
Earth Observation Systems and Pasture Modeling: A Bibliometric Trend Analysis

 , , , , ,
  and
and
Abstract
:1. Introduction
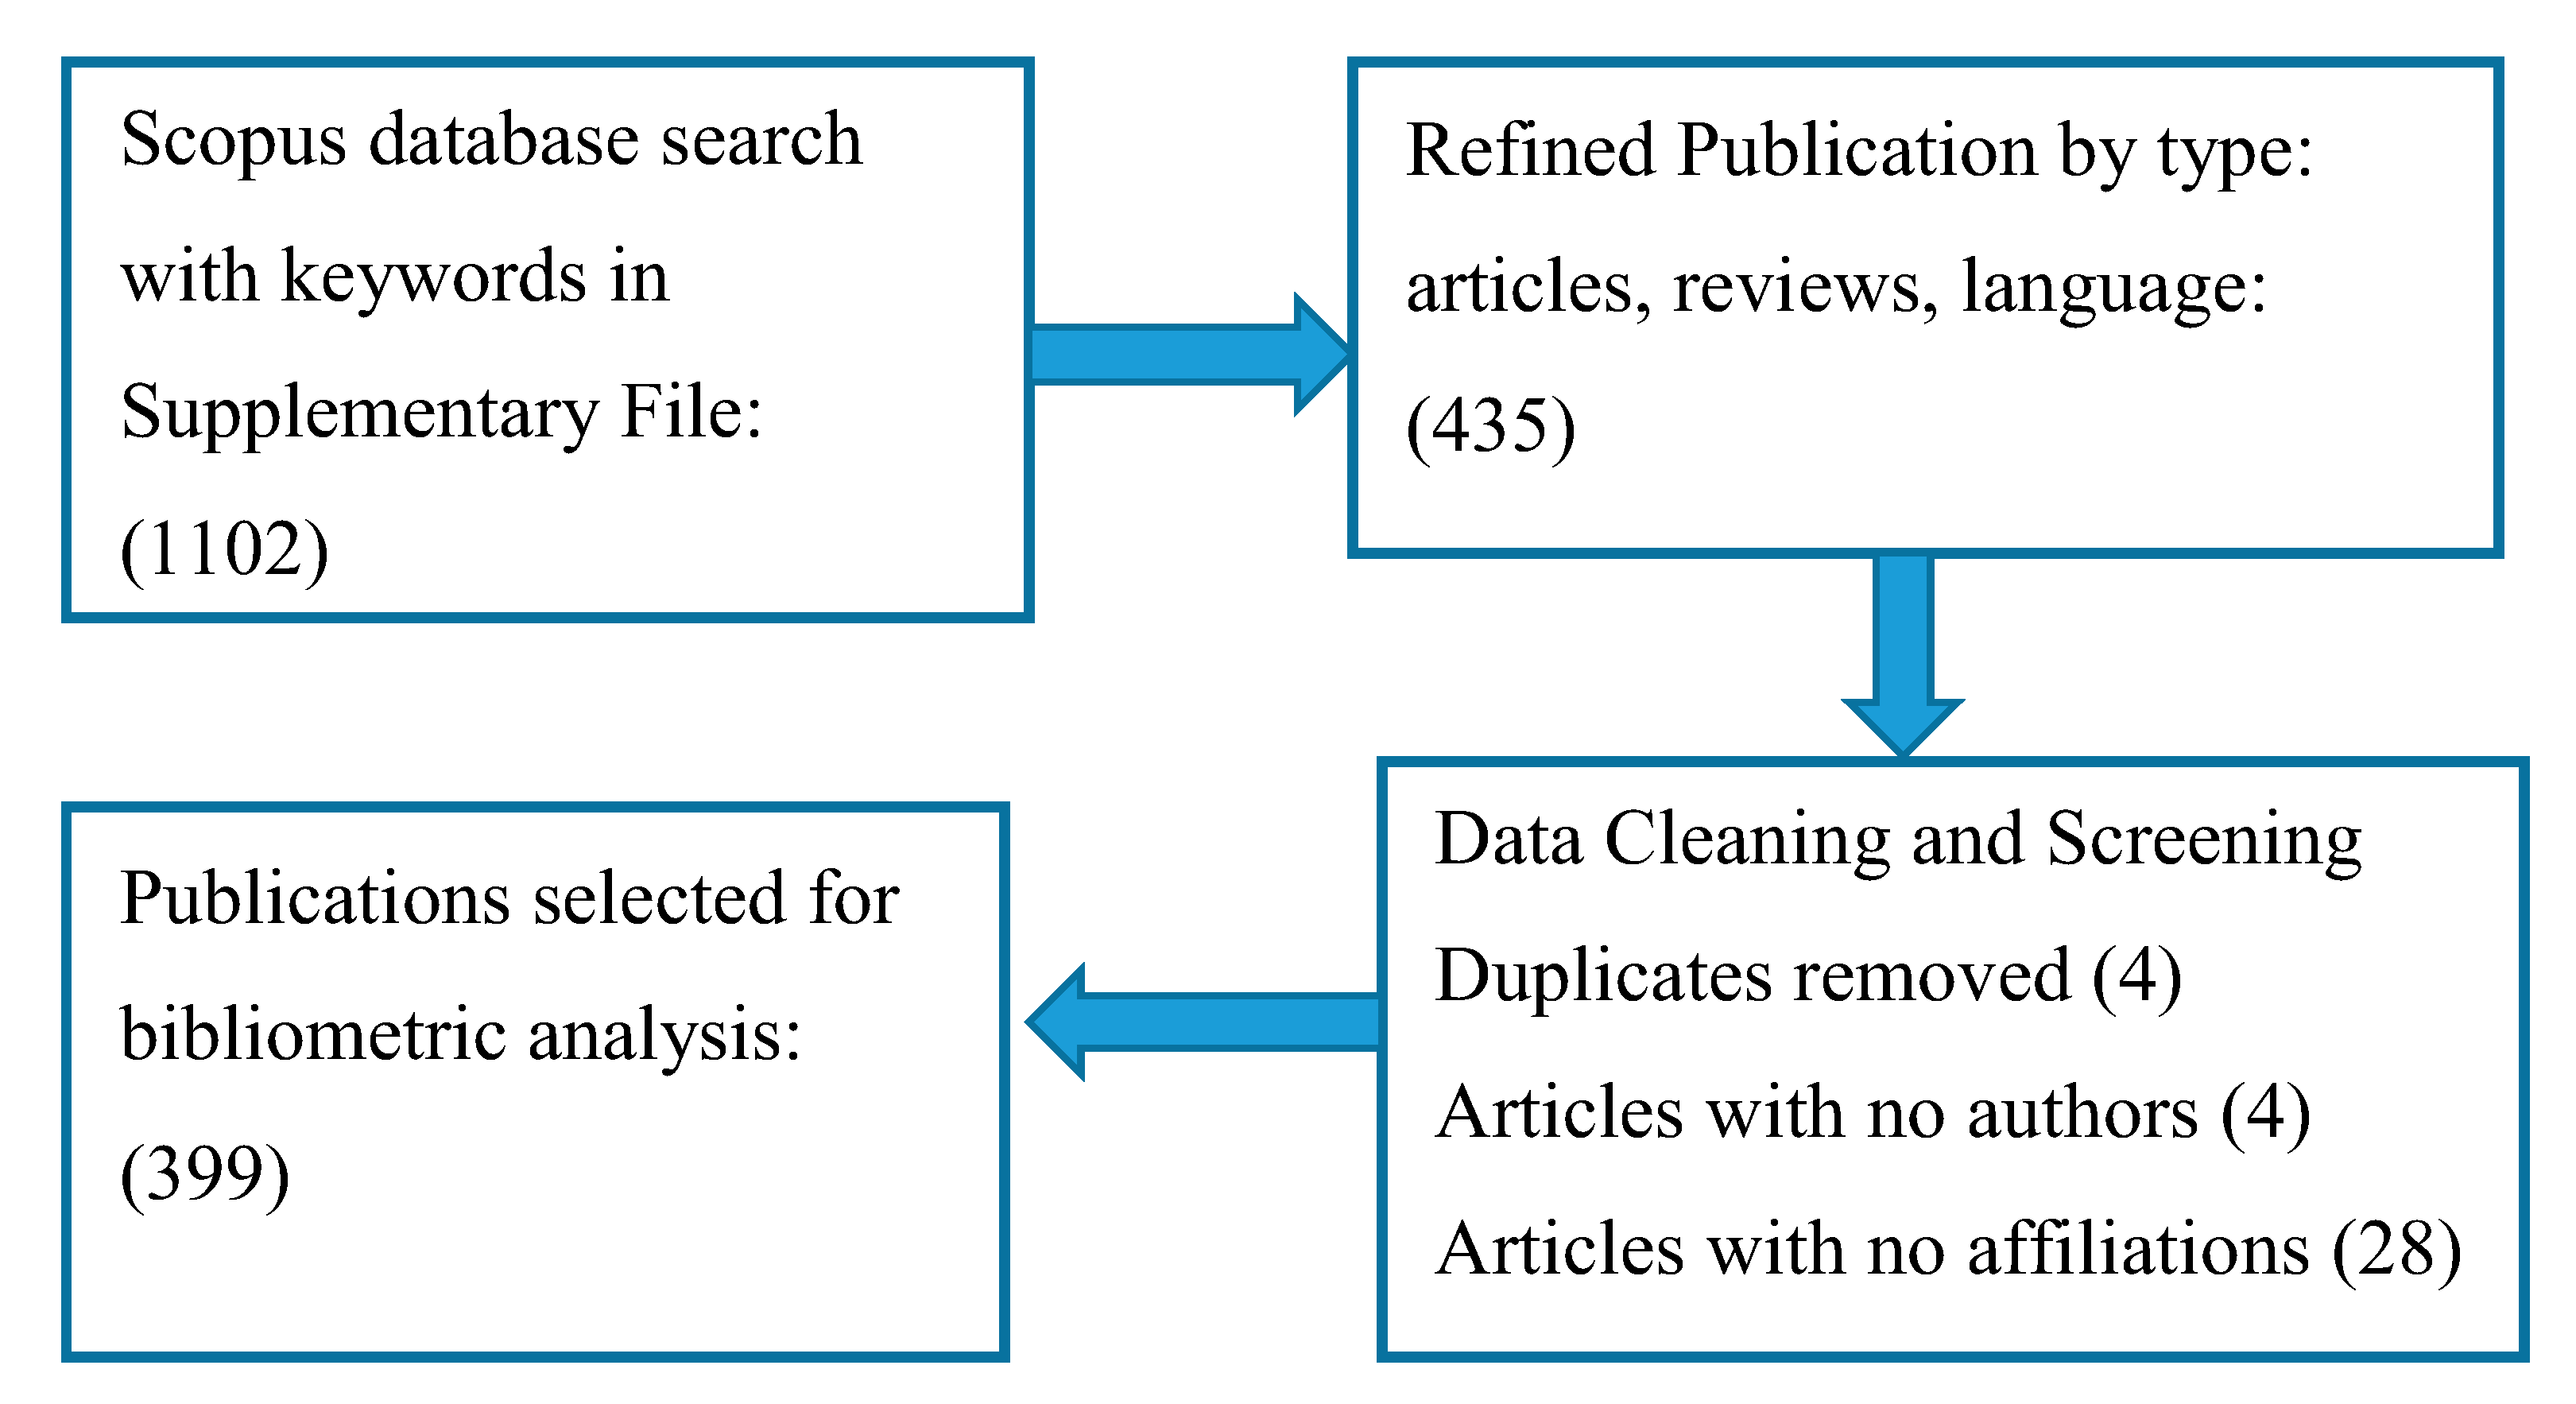
2. Data Collection, Preparation and Methods
3. Results
3.1. Characteristics of Scopus Indexed Database
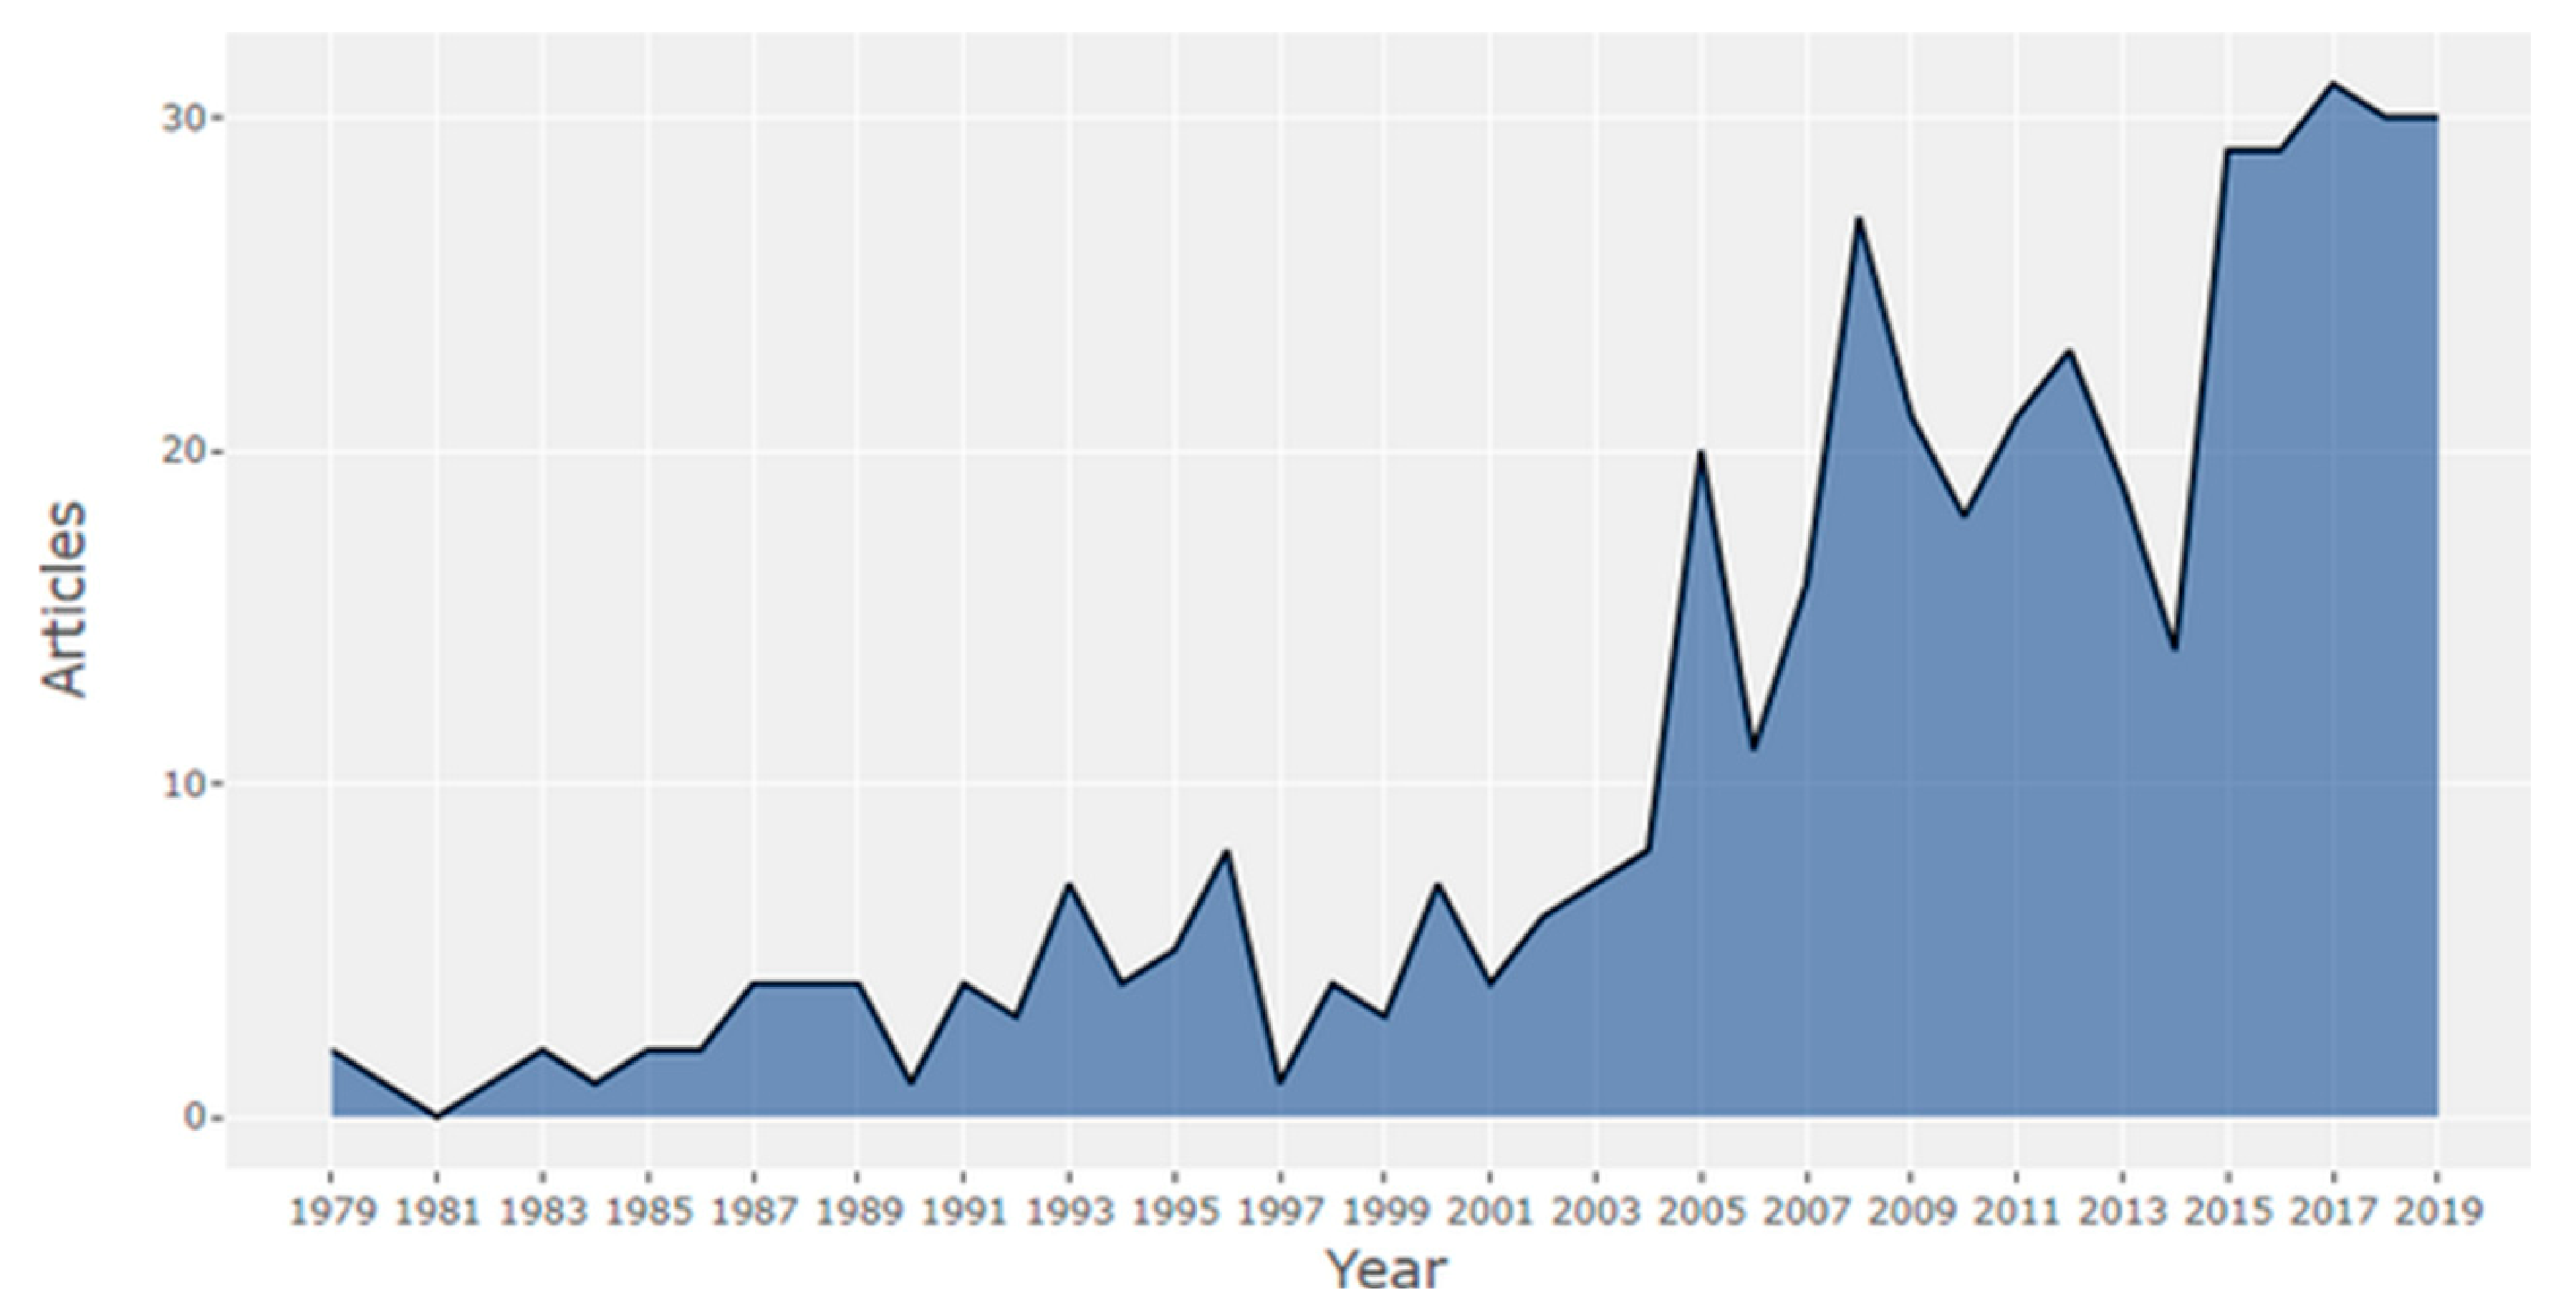
3.1.1. Temporal Scientific Contribution per Article
3.1.2. Scopus Global EOS and PM Most Cited and Spatial Distribution
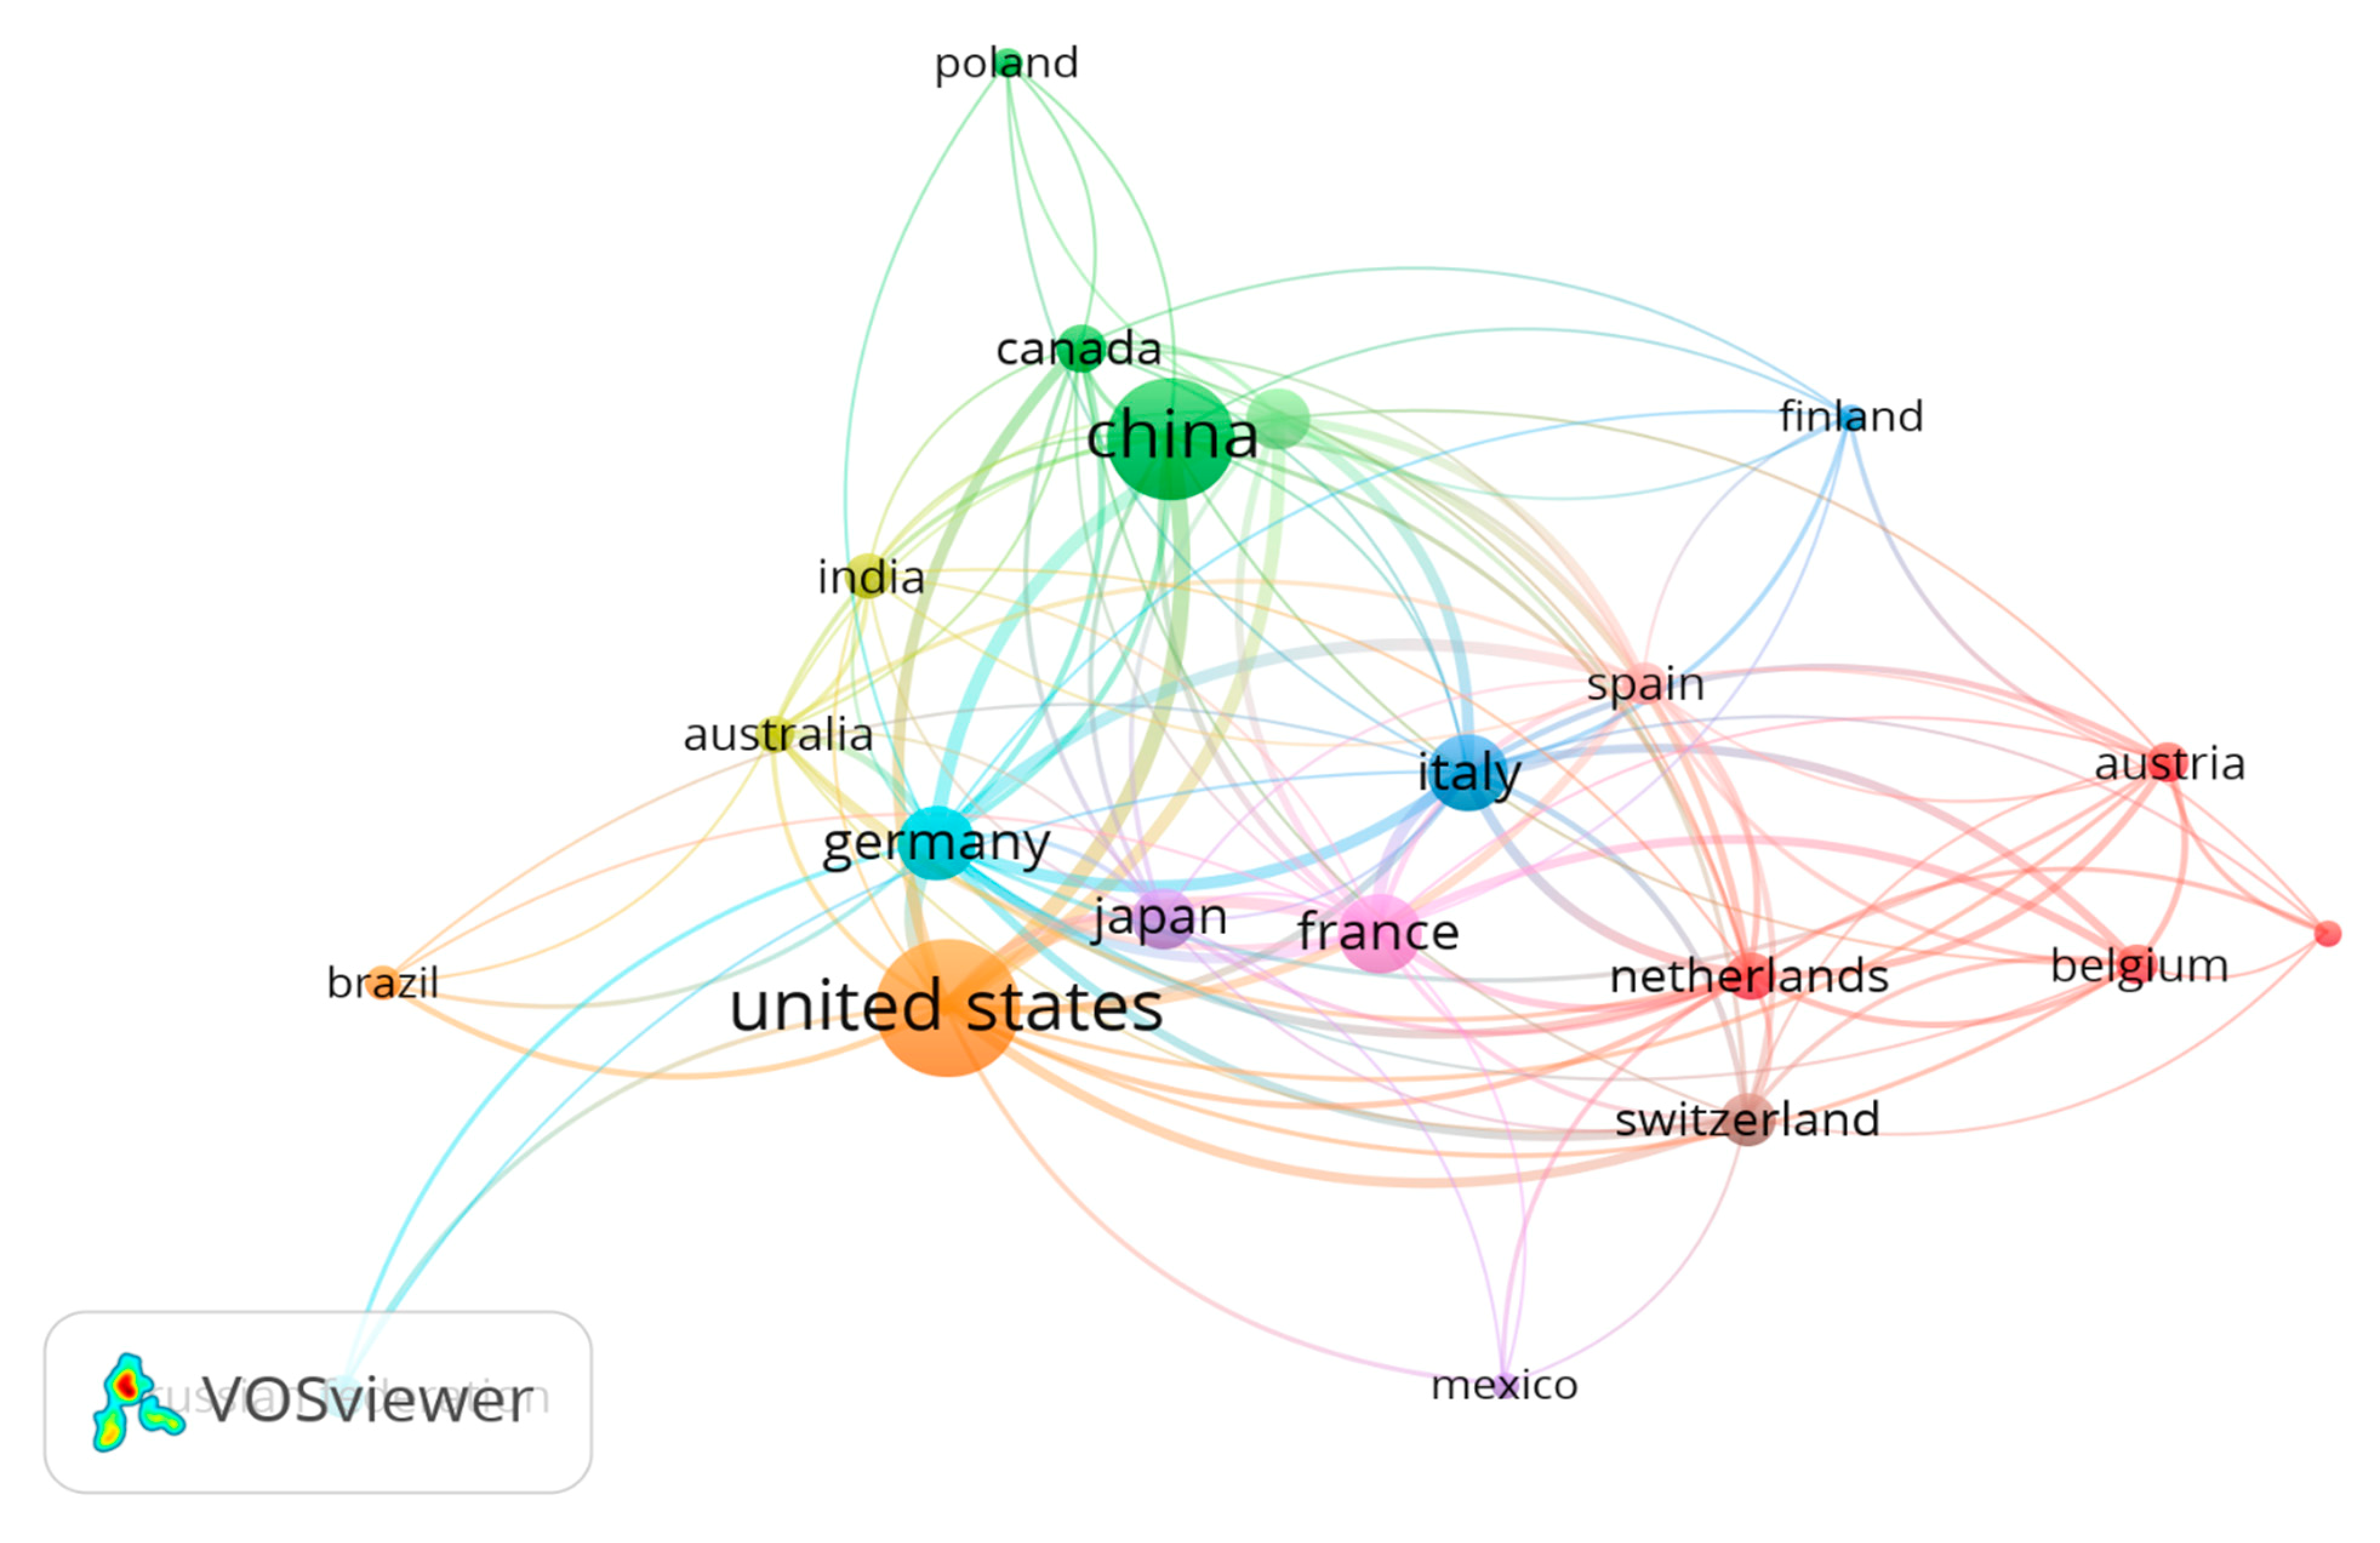
3.1.3. Scientific Collaboration Analysis per Countries
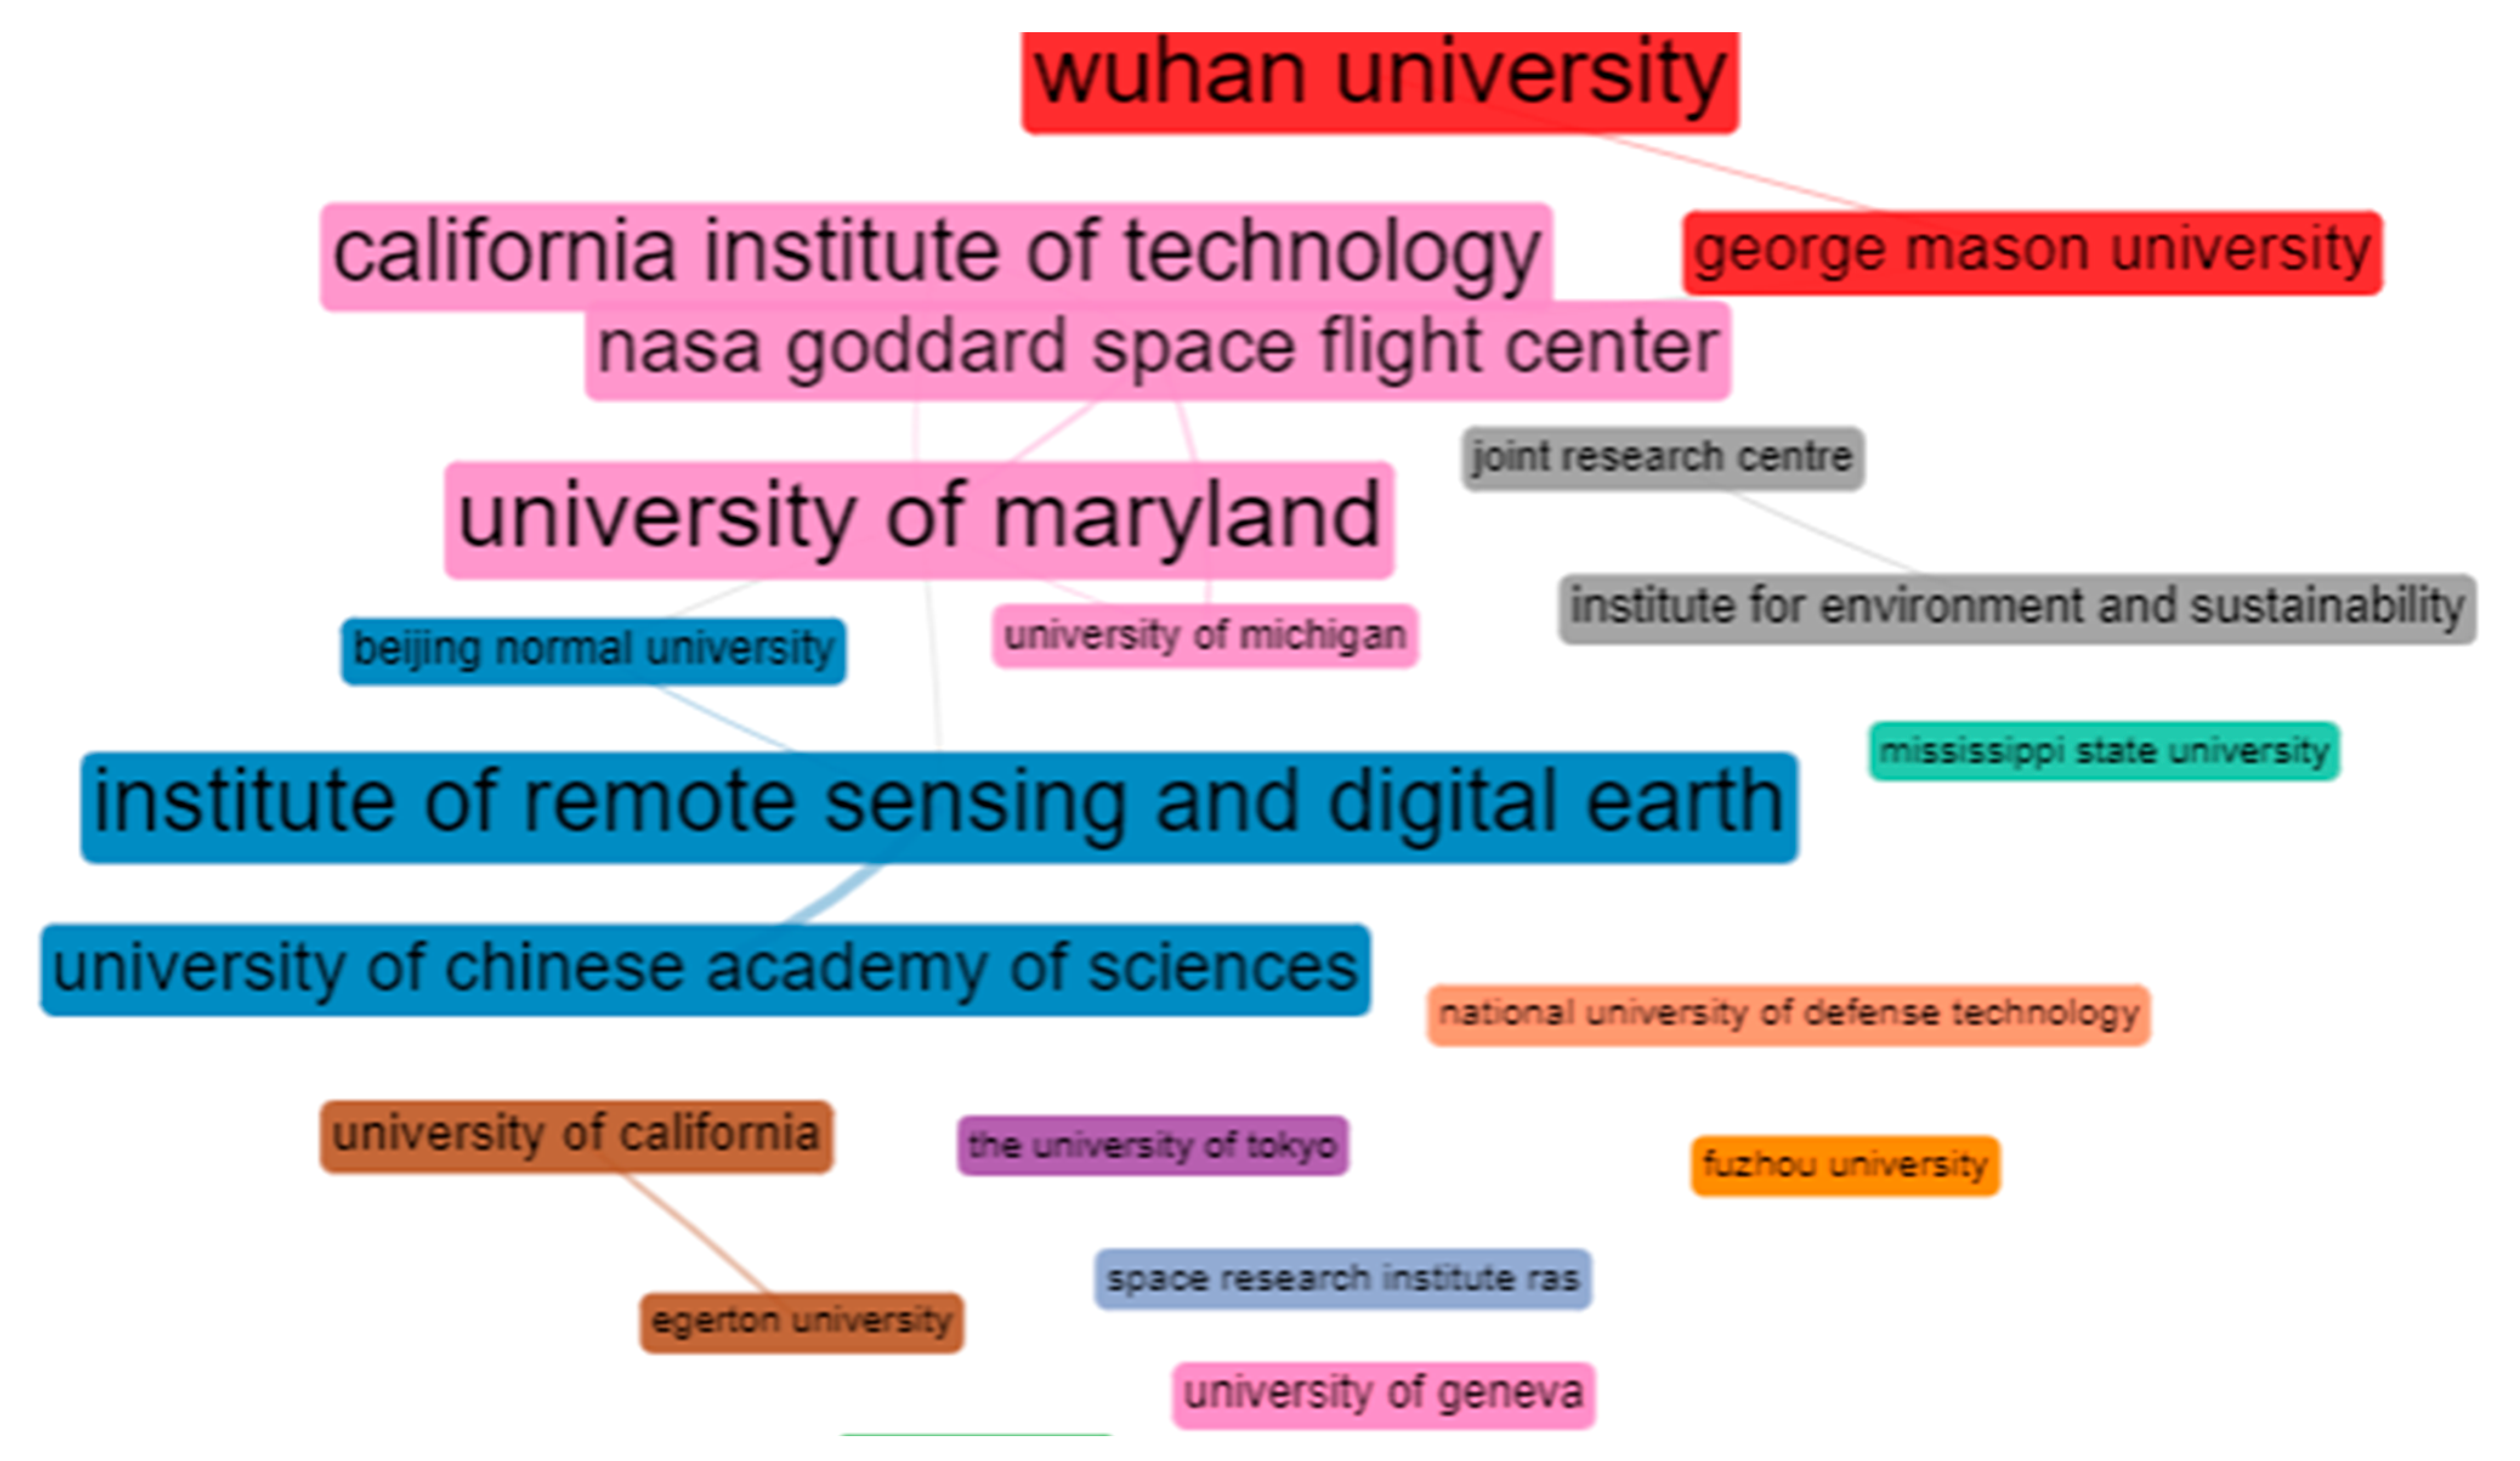
3.1.4. Collaboration Analysis between Institutions
3.1.5. Author’s Contribution
3.1.6. Journal Analysis
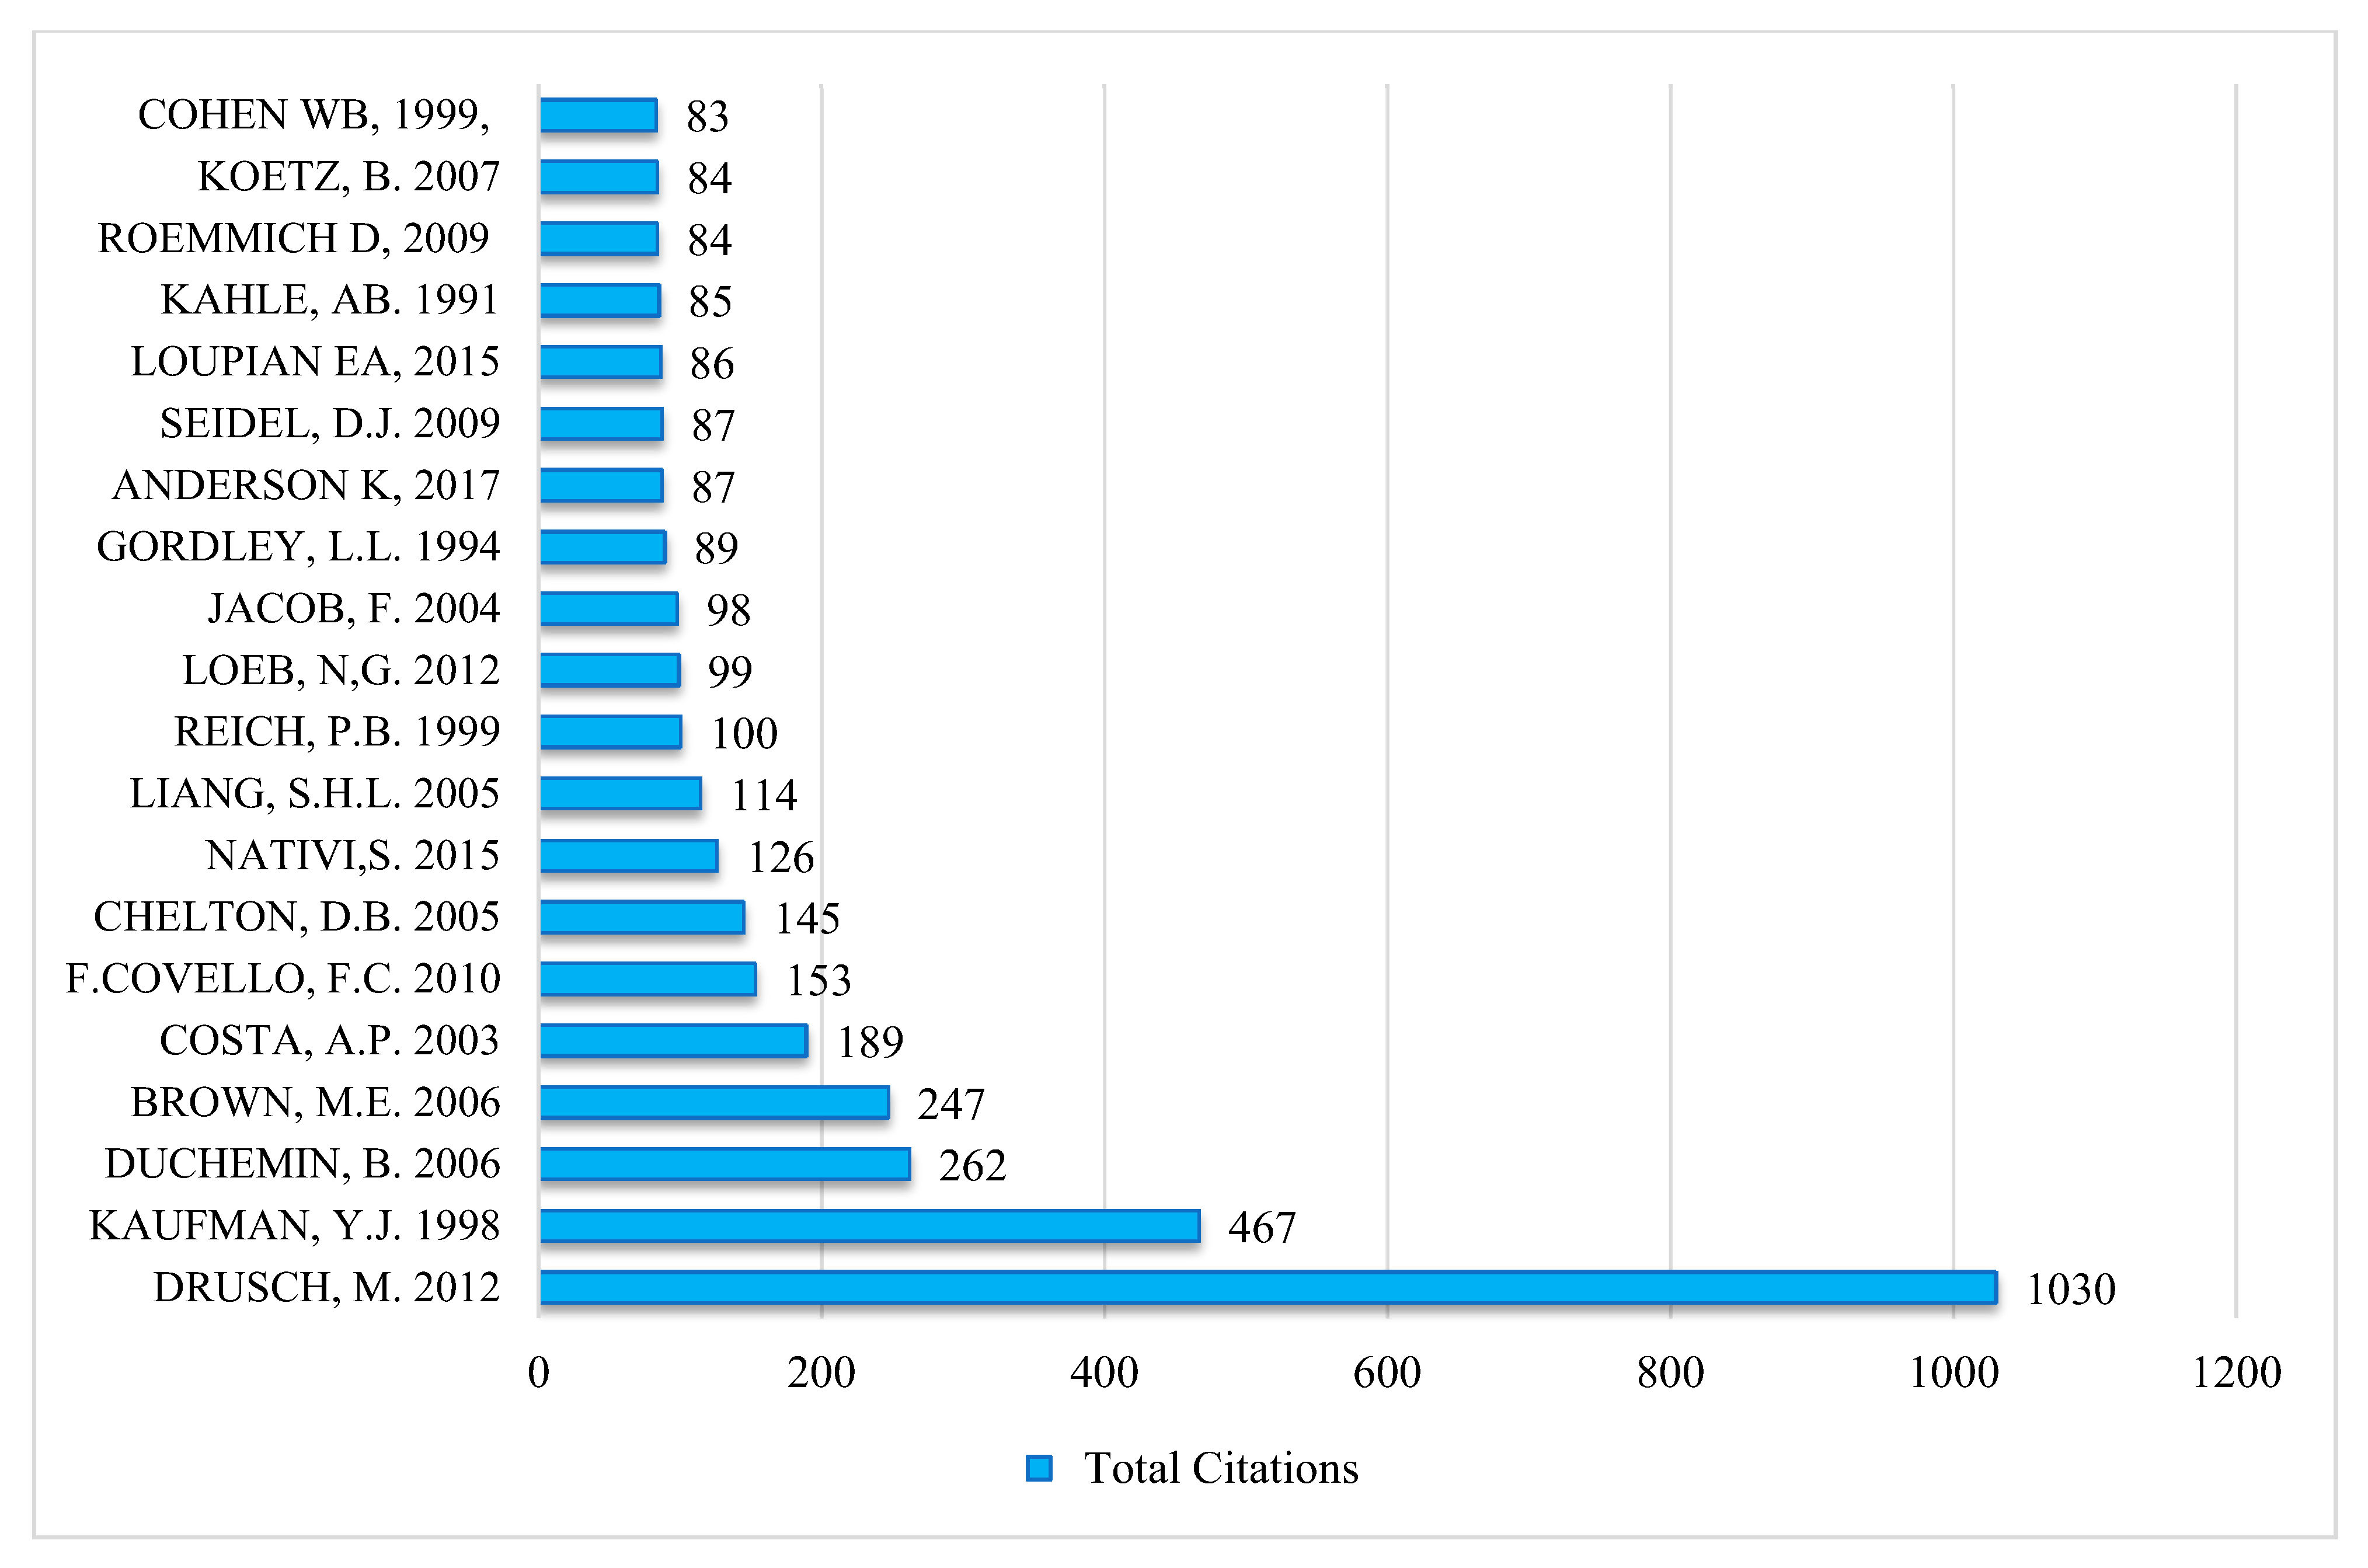
3.1.7. Top Global Cited Published Articles on EOS and PM Studies
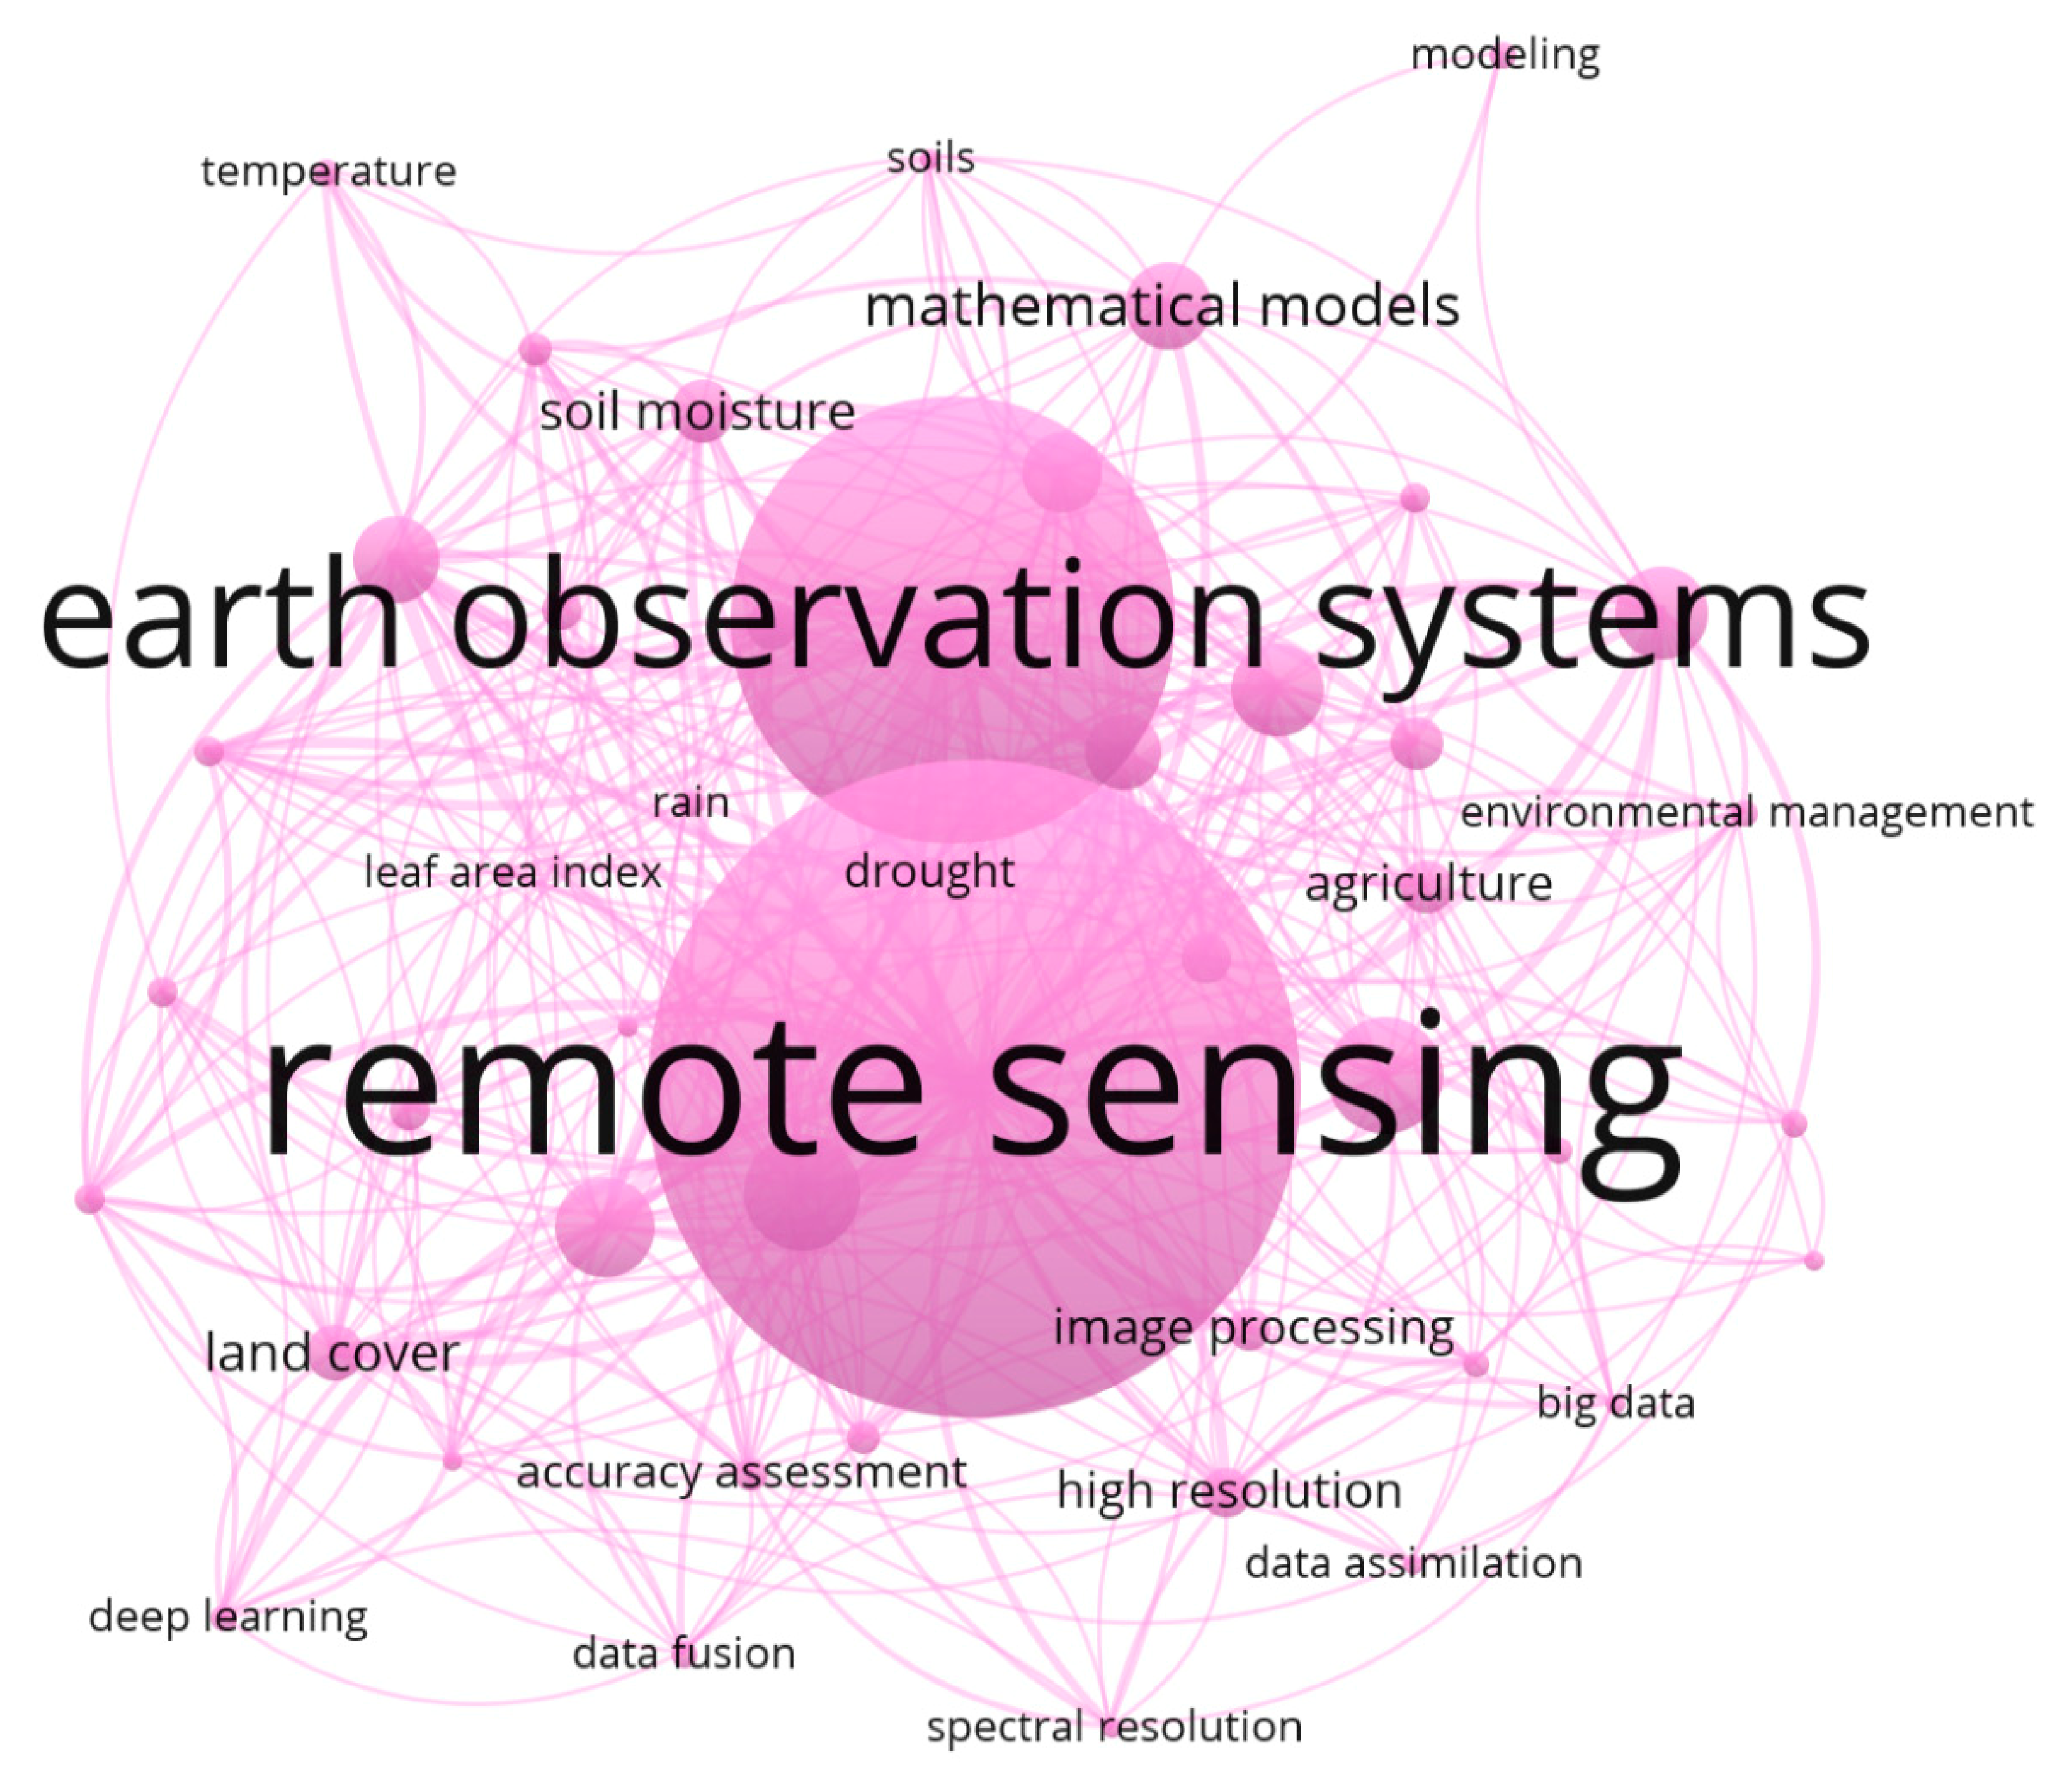
3.1.8. Top 20 Authors Keywords and Co-Occurrence Network
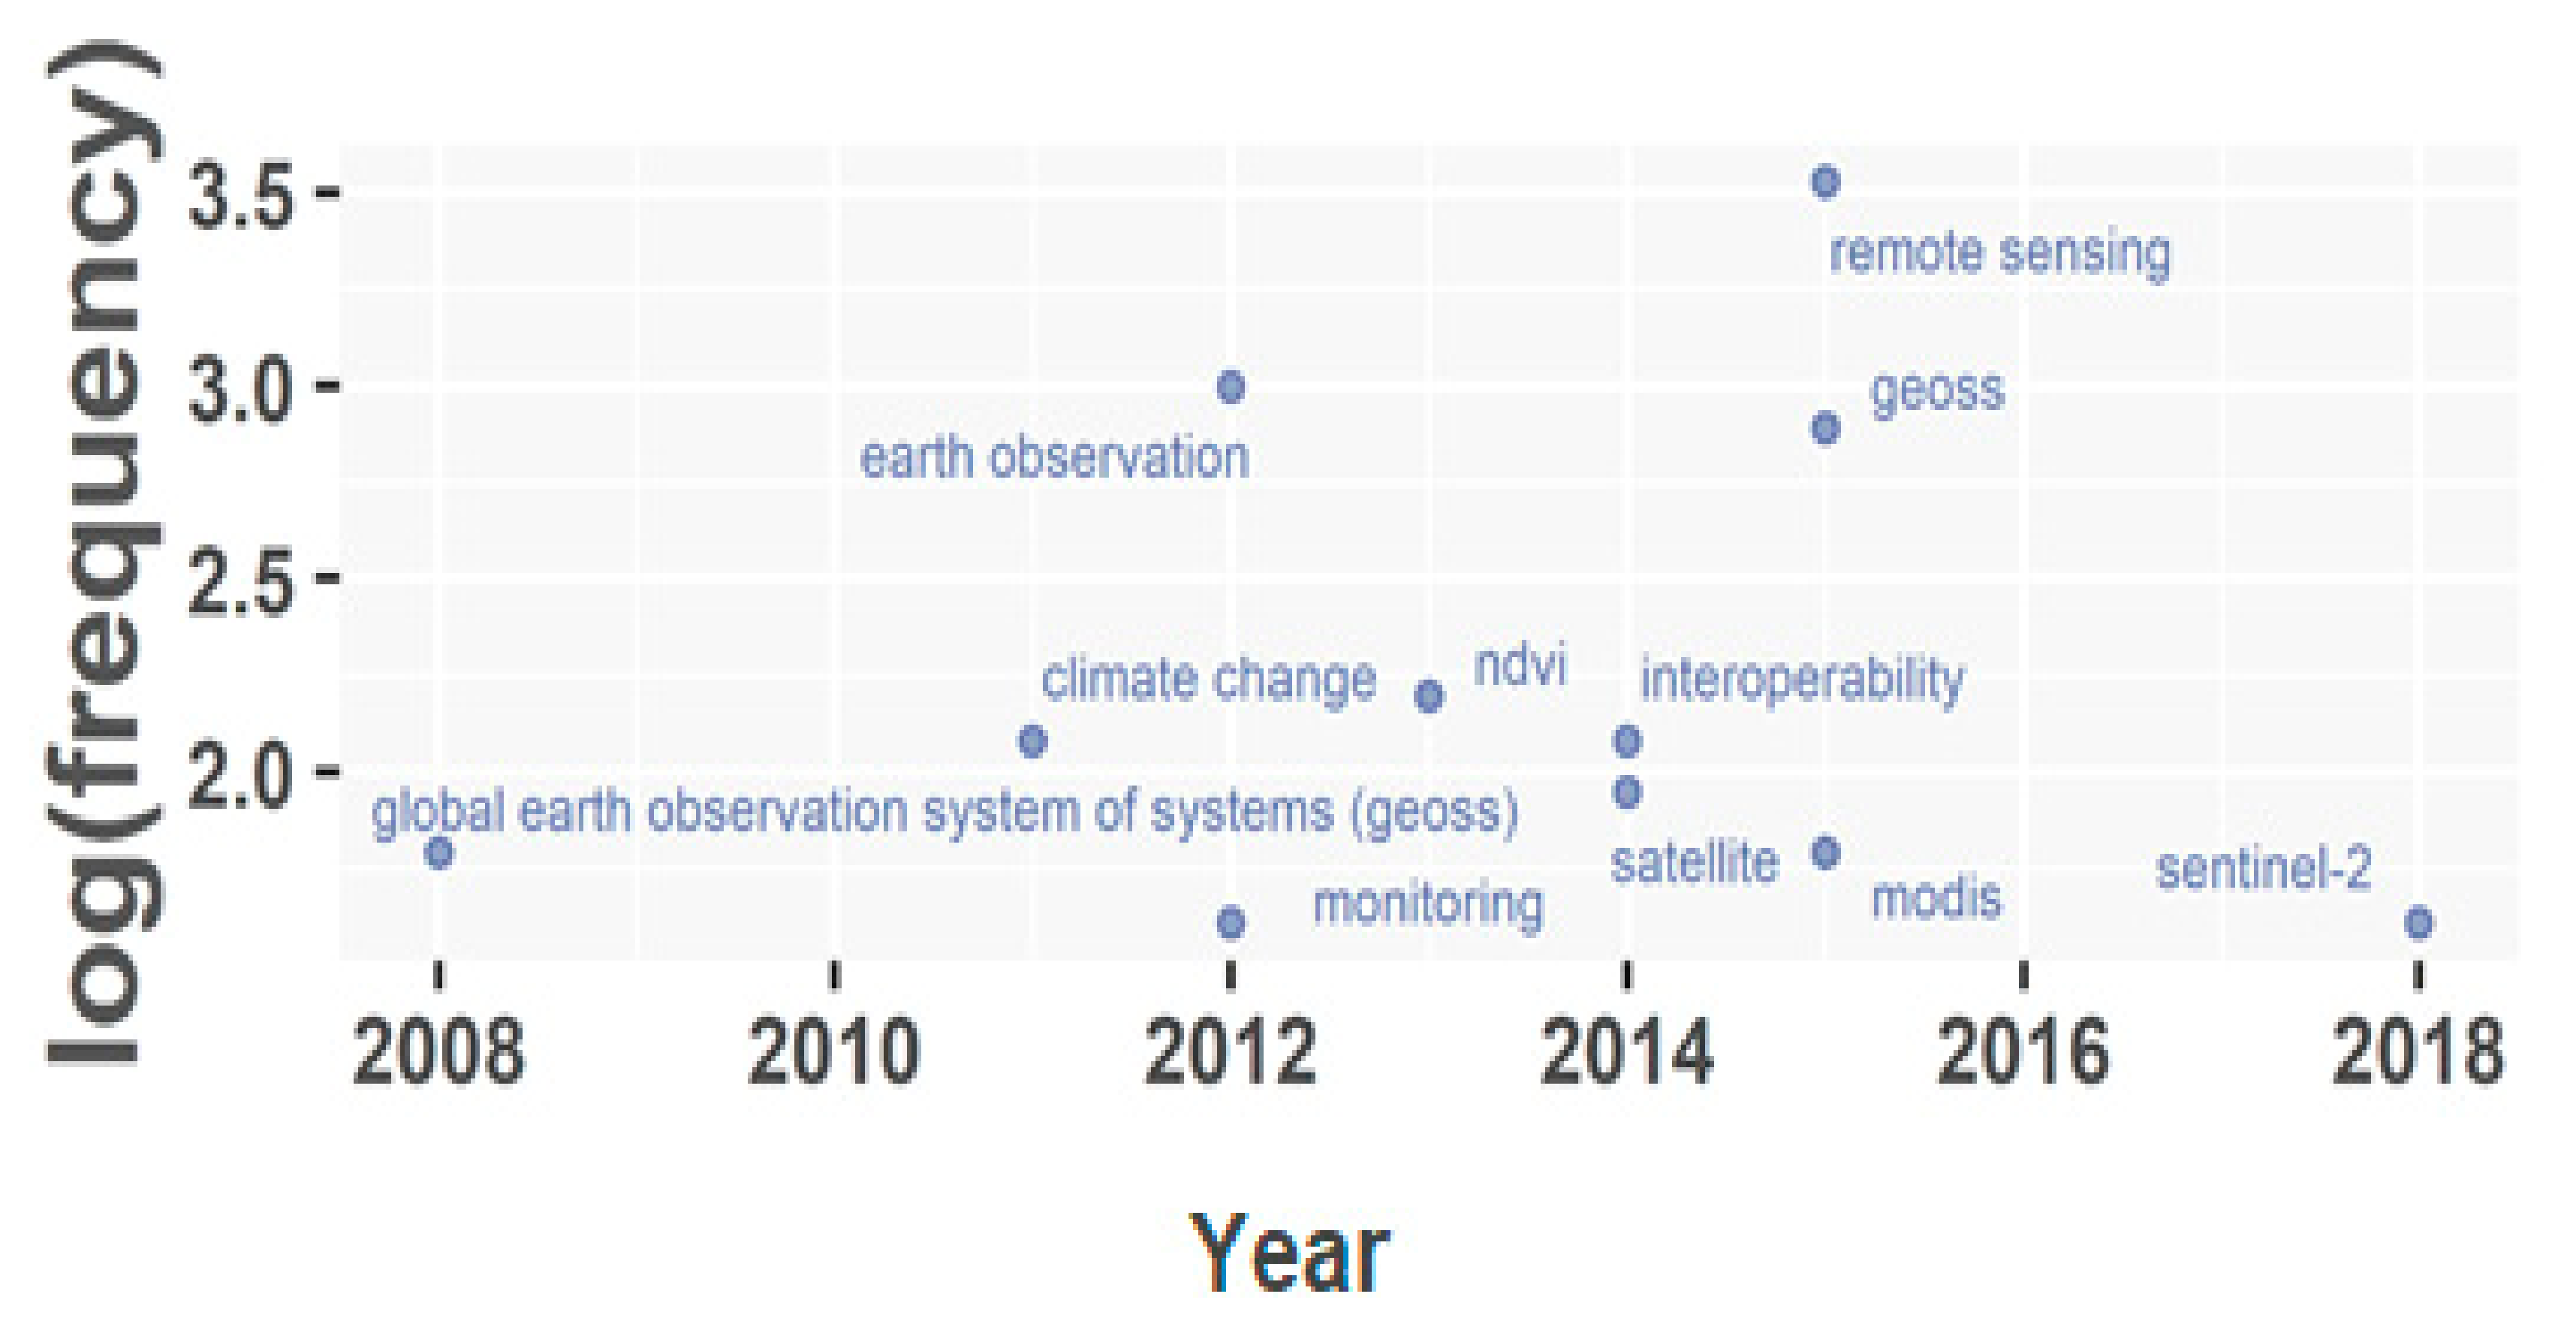
3.1.9. Decadal Trending Topics of High-Frequency Keywords
4. Discussion
5. Conclusions
Author Contributions
Funding
Data Availability Statement
Acknowledgments
Conflicts of Interest
References
- Latham, J.; Cumani, R.; Rosati, I.; Bloise, M. Global Land Cover Share (Glc-Share) Database Beta-Release Version 1.0-2014; FAO: Rome, Italy, 29 April 2014; Available online: https://www.fao.org/uploads/media/glc-share-doc.pdf (accessed on 15 October 2021).
- Ali, I.; Cawkwell, F.; Dwyer, E.; Barrett, B.; Green, S. Satellite remote sensing of grasslands: From observation to management. J. Plant Ecol. 2016, 9, 649–671. [Google Scholar] [CrossRef] [Green Version]
- Franzluebbers, A.J. Soil organic carbon in managed pastures of the southeastern United States of America. Grassland Carbon Sequestration: Management, Policy and Economics. Integr. Crop. Manag. 2010, 11, 163–175. [Google Scholar]
- Afuye, G.A.; Ojeh, V.N. Temporal Variations in Ambient Carbon Monoxide Concentrations between Weekdays and Weekends in Akure Central Business District, South West Nigeria. Phys. Sci. Int. J. 2017, 16, 1–12. [Google Scholar] [CrossRef]
- Letsoalo, N.L. Rangeland Management Practices among Emerging Livestock Farmers in Gauteng Province, South Africa. Available online: https://uir.unisa.ac.za/handle/10500/25597 (accessed on 1 October 2021).
- Yang, X.; Guo, X.; Fitzsimmons, M. Assessing light to moderate grazing effects on grassland production using satellite imagery. Int. J. Remote Sens. 2012, 33, 5087–5104. [Google Scholar] [CrossRef]
- Cadman, M.; de Villiers, C.; Lechmere-Oertel, R.; McCulloch, D. Grasslands Ecosystem Guidelines: Landscape interpretation for planners and managers. In South African National; Biodiversity Institute: Pretoria, South Africa, 2013; pp. 1–139. [Google Scholar]
- Eriksen, J.; Ledgard, S.; Lou, J.; Schils, R.; Rasmussen, J. Environmental Impacts of Grazed Pastures. Grassl. Sci. Eur. 2010, 15, 880–890. Available online: https://orgprints.org/id/eprint/17879/4/17879.pdf (accessed on 15 October 2021).
- Clementini, C.; Pomente, A.; Latini, D.; Kanamaru, H.; Vuolo, M.R.; Heureux, A.; Fujisawa, M.; Schiavon, G.; Del Frate, F. Long-Term Grass Biomass Estimation of Pastures from Satellite Data. Remote Sens. 2020, 12, 2160. [Google Scholar] [CrossRef]
- de la Fuente, B.; Weynants, M.; Bertzky, B.; Delli, G.; Mandrici, A.; Garcia Bendito, E.; Dubois, G. Land productivity dynam-ics in and around protected areas globally from 1999 to 2013. PLoS ONE 2020, 15, e0224958. [Google Scholar] [CrossRef]
- Le, Q.B.; Nkonya, E.; Mirzabaev, A. Biomass productivity-based mapping of global land degradation hotspots. In Economics of Land Degradation and Improvement–A Global Assessment for Sustainable Development; Springer: Cham, Switzerland, 2016; pp. 55–85. ISBN 978-3-319-19167-6. [Google Scholar]
- Wang, J.; Xiao, X.; Bajgain, R.; Starks, P.; Steiner, J.; Doughty, R.B.; Chang, Q. Estimating leaf area index and aboveground biomass of grazing pastures using Sentinel-1, Sentinel-2 and Landsat images. ISPRS J. Photogramm. Remote Sens. 2019, 154, 189–201. [Google Scholar] [CrossRef] [Green Version]
- Dabrowska-Zielinska, K.; Budzynska, M.; Gatkowska, M.; Kowalik, W.; Bartold, M.; Kiryla, M. Importance of grasslands monitoring applying optical and radar satellite data in perspective of changing climate. In Proceedings of the 2017 IEEE International Geoscience and Remote Sensing Symposium (IGARSS), Fort Worth, TX, USA, 23 July 2017; pp. 5782–5785. [Google Scholar] [CrossRef]
- Symeonakis, E.; Calvo-Cases, A.; Arnau-Rosalen, E. Land use change and land degradation in south eastern Mediterranean Spain. Environ. Manag. 2007, 40, 80–94. [Google Scholar] [CrossRef]
- Xu, H.; Huang, X.; Zhong, T.; Chen, Z.; Yu, J. Chinese land policies and farmers’ adoption of organic fertilizer for saline soils. Land Use Policy 2014, 38, 541–549. [Google Scholar] [CrossRef]
- Galdino, S.; Sano, E.E.; Andrade, R.G.; Grego, C.R.; Nogueira, S.F.; Bragantini, C.; Flosi, A.H. Large-scale modeling of soil erosion with RUSLE for conservationist planning of degraded cultivated Brazilian pastures. Land Degrad. Dev. 2016, 27, 773–784. [Google Scholar] [CrossRef] [Green Version]
- Truter, W.F.; Botha, P.R.; Dannhauser, C.S.; Maasdorp, B.V.; Miles, N.; Smith, A.; Snyman, H.A.; Tainton, N.M. Southern African pasture and forage science entering the 21st century: Past to present. Afr. J. Range Forage Sci. 2015, 32, 73–89. [Google Scholar] [CrossRef] [Green Version]
- Mirzabaev, A.; Goedecke, J.; Dubovyk, O.; Djanibekov, U.; Le, Q.B.; Aw-Hassan, A. Economics of land degradation in Central Asia. In Economics of Land Degradation and Improvement–A Global Assessment for Sustainable Development; Springer: Cham, Switzerland, 2016; pp. 261–290. ISBN 978-3-319-19167-6. [Google Scholar]
- Nkonya, E.; Mirzabaev, A.; Von Braun, J. Economics of Land Degradation and Improvement–A Global Assessment for Sustainable Development; Springer: Cham, Switzerland, 2016; ISBN 978-3-319-19167-6. [Google Scholar]
- Kwon, H.Y.; Nkonya, E.; Johnson, T.; Graw, V.; Kato, E.; Kihiu, E. Global estimates of the impacts of grassland degradation on livestock productivity from 2001 to 2011. In Economics of Land Degradation and Improvement–A Global Assessment for Sustainable Development; Springer: Cham, Switzerland, 2016; pp. 197–214. ISBN 978-3-319-19167-6. [Google Scholar]
- Sevov, A.; Yancheva, C.; Kazakova, Y. Sustainable Pasture Management. In New Perspectives in Forage Crops; InTech: London, UK, 2018. [Google Scholar]
- Dingaan, M.N.; Tsubo, M. Improved assessment of pasture availability in semi-arid grassland of South Africa. Environ. Monit. Monit. Monit. Assess. 2019, 191, 1–2. [Google Scholar] [CrossRef] [PubMed]
- Numata, I.; Roberts, D.A.; Chadwick, O.A.; Schimel, J.; Sampaio, F.R.; Leonidas, F.C.; Soares, J.V. Characterization of pasture biophysical properties and the impact of grazing intensity using remotely sensed data. Remote Sens. Environ. 2007, 109, 314–327. [Google Scholar] [CrossRef]
- Weber, D.; Schaepman-Strub, G.; Ecker, K. Predicting habitat quality of protected dry grasslands using Landsat NDVI phenology. Ecol. Indic. 2018, 91, 447–460. [Google Scholar] [CrossRef]
- Lugassi, R.; Zaady, E.; Goldshleger, N.; Shoshany, M.; Chudnovsky, A. Spatial and temporal monitoring of pasture ecological quality: Sentinel-2-based estimation of crude protein and neutral detergent fiber contents. Remote Sens. 2019, 11, 799. [Google Scholar] [CrossRef] [Green Version]
- Afuye, G.A.; Kalumba, A.M.; Orimoloye, I.R. Characterisation of Vegetation Response to Climate Change: A Review. Sustainability 2021, 13, 7265. [Google Scholar] [CrossRef]
- Gibson, D.J.; Newman, J.A. Grasslands and climate change: An overview. In Grasslands and Climate Change; Cambridge University Press: Cambridge, UK, 2019; pp. 3–18. ISBN 978-1-107-19526-4. [Google Scholar]
- Cobon, D.H.; Kouadio, L.; Mushtaq, S.; Jarvis, C.; Carter, J.; Stone, G.; Davis, P. Evaluating the shifts in rainfall and pasture-growth variabilities across the pastoral zone of Australia during 1910–2010. Crop. Pasture Sci. 2019, 70, 634–647. [Google Scholar] [CrossRef] [Green Version]
- Afuye, G.A.; Ojeh, V.N.; Okunlola, B.A.; Adejokun, V.F. Heat-Sum Calculation in Forecasting Maize PhenologicalStages and Harvesting Date in Lagos South West, Nigeria. J. Geogr. Environ. Earth Sci. Int. 2018, 1, 1–2. [Google Scholar] [CrossRef]
- Lai, L.; Kumar, S. A global meta-analysis of livestock grazing impacts on soil properties. PLoS ONE 2020, 15, e0236638. [Google Scholar] [CrossRef]
- Calotă, A.M.; Pătru-Stupariu, I. Quantifying the effects of defective planning on pastures using urbanization and landscape indicators. In Proceedings of the 10th IALE World Congress- Nature and Society Facing the Anthropocene Challenges and Perspectives for Landscape Ecology, Bucharest, Romania, 1–5 July 2019. [Google Scholar]
- Gankhuyag, U. Quantitative Analysis of the Relationship between Mining and Livestock Sectors in Mongolia. Master’s Dissertation, Columbia University, New York, NY, USA, 2013. [Google Scholar] [CrossRef]
- Guo, S.; Jiang, L.; Shen, G.Q. Embodied pasture land use change in China 2000-2015: From the perspective of globalization. Land Use Policy 2019, 82, 476–485. [Google Scholar] [CrossRef]
- Thornley, J.H.; Cannell, M.G. Temperate grassland responses to climate change: An analysis using the Hurley pasture model. Ann. Bot. 1997, 80, 205–221. [Google Scholar] [CrossRef] [Green Version]
- Johnson, I.R.; Chapman, D.F.; Snow, V.O.; Eckard, R.J.; Parsons, A.J.; Lambert, M.G.; Cullen, B.R. DairyMod and EcoMod: Biophysical pasture-simulation models for Australia and NewZealand. Aust. J. Exp. Agric. 2008, 48, 621–631. [Google Scholar] [CrossRef]
- Stolter, C.; Ramoelo, A.; Kesch, K.; Madibela, O.R.; Cho, M.A.; Joubert, D.F. Forage quality and availability for large herbivores in southern African rangelands. Biodivers. Ecol. 2018, 6, 187–196. [Google Scholar] [CrossRef]
- Dos Reis, A.A.; Werner, J.P.; Silva, B.C.; Figueiredo, G.K.; Antunes, J.F.; Esquerdo, J.C. Coutinho, A.C.; Lamparelli, R.A.; Rocha, J.V.; Magalhães, P.S. Monitoring pasture aboveground biomass and canopy height in an integrated crop-livestock system using textural information from PlanetScope imagery. Remote Sens. 2020, 12, 2534. [Google Scholar] [CrossRef]
- Segarra, J.; Buchaillot, M.L.; Araus, J.L.; Kefauver, S.C. Remote sensing for precision agriculture: Sentinel-2 improved features and applications. Agronomy 2020, 10, 641. [Google Scholar] [CrossRef]
- Mashaba-Munghemezulu, Z.; Chirima, G.J.; Munghemezulu, C. Delineating Smallholder Maize Farms from Sentinel-1 Coupled with Sentinel-2 Data Using Machine Learning. Sustainability 2021, 13, 4728. [Google Scholar] [CrossRef]
- Abdel-Hamid, A.; Dubovyk, O.; Graw, V.; Greve, K. Assessing the impact of drought stress on grasslands using multi-temporal SAR data of Sentinel-1: A case study in Eastern Cape, South Africa. Eur. J. Remote Sens. 2020, 53 (Suppl. S2), 3–16. [Google Scholar] [CrossRef]
- Chen, Y.; Guerschman, J.; Shendryk, Y.; Henry, D.; Harrison, M.T. Estimating Pasture Biomass Using Sentinel-2 Imagery and Machine Learning. Remote Sens. 2021, 13, 603. [Google Scholar] [CrossRef]
- Khiste, G.P.; Paithankar, R.R. Analysis of Bibliometric term in Scopus. Int. J. Libr. Sci. Inf. Manag. 2017, 3, 81–88. [Google Scholar]
- Mair, L.; Mill, A.C.; Robertson, P.A.; Rushton, S.P.; Shirley, M.D.; Rodriguez, J.P.; McGowan, P.J. The contribution of scientific research to conservation planning. Biol. Conserv. 2018, 223, 82–96. [Google Scholar] [CrossRef] [Green Version]
- Jiang, M.; Huo, Y.; Huang, K.; Li, M. Way forward for straw burning pollution research: A bibliometric analysis during 1972–2016. Environ. Sci. Pollut. Res. 2019, 26, 13948–13962. [Google Scholar] [CrossRef] [PubMed]
- Gao, Y.; Wang, F.; Song, Y.; Liu, H. The status of and trends in the pharmacology of berberine: A bibliometric review. Chin. Med. 2020, 15, 1–3. [Google Scholar] [CrossRef] [PubMed] [Green Version]
- Mishra, M.; Sudarsan, D.; Santos, C.A.; Mishra, S.K.; Kar, D.; Baral, K.; Pattnaik, N. An overview of research on natural resources and indigenous communities: A bibliometric analysis based on Scopus database (1979–2020). Environ. Monit. Assess. 2021, 193, 1–7. [Google Scholar] [CrossRef] [PubMed]
- Mongeon, P.; Paul-Hus, A. The journal coverage of Web of Science and Scopus: A comparative analysis. Scientometrics 2016, 106, 213–228. [Google Scholar] [CrossRef]
- Radhakrishnan, S.; Erbis, S.; Isaacs, J.A.; Kamarthi, S. Novel keyword co-occurrence network-based methods to foster systematic reviews of scientific literature. PLoS ONE 2017, 12, e0172778. [Google Scholar] [CrossRef]
- Aria, M.; Cuccurullo, C. Bibliometrix: An R-tool for comprehensive science mapping analysis. J. Informetr. 2017, 11, 959–975. [Google Scholar] [CrossRef]
- Linnenluecke, M.K.; Marrone, M.; Singh, A.K. Conducting systematic literature reviews and bibliometric analyses. Aust. J. Manag. 2020, 45, 175–194. [Google Scholar] [CrossRef]
- Vieira, A.F.; Moura, M.; Silva, L. Soil metagenomics in grasslands and forests–A review and bibliometric analysis. Appl. Soil Ecol. 2021, 167, 104047. [Google Scholar] [CrossRef]
- Orimoloye, I.R.; Ololade, O.O. Global trends assessment of environmental health degradation studies from 1990 to 2018. Environ. Dev. Sustain. 2021, 23, 3251–3264. [Google Scholar] [CrossRef]
- Chen, H.; Ho, Y.S. Highly cited articles in biomass research: A bibliometric analysis. Renew. Sustain. Energy Rev. 2015, 49, 12–20. [Google Scholar] [CrossRef]
- Zhou, P.; Tijssen, R.; Leydesdorff, L. University-Industry Collaboration in China and the USA: A bibliometric comparison. PLoS ONE 2016, 11, e0165277. [Google Scholar] [CrossRef] [PubMed] [Green Version]
- Yang, J.N.; Shen, Y.Y.; Wang, Y.R. A bibliometric analysis of international grassland agroecology research. Acta Prataculturae Sin. 2017, 26, 224. [Google Scholar] [CrossRef]
- Yu, D.; Xu, Z.; Wang, W. Bibliometric analysis of fuzzy theory research in China: A 30-year perspective. Knowl. Based Syst. 2018, 141, 188–199. [Google Scholar] [CrossRef]
- Busayo, E.T.; Kalumba, A.M.; Afuye, G.A.; Ekundayo, O.Y.; Orimoloye, I.R. Assessment of the Sendai framework for disaster risk reduction studies since 2015. Int. J. Disaster Risk Reduct. 2020, 50, 101906. [Google Scholar] [CrossRef]
- Tang, Y.; Long, X.; Wu, M.; Yang, S.; Gao, N.; Xu, B.; Dutta, S. Bibliometric review of research trends on disinfection by-products in drinking water during 1975–2018. Sep. Purif. Technol. 2020, 241, 116741. [Google Scholar] [CrossRef]
- Singh, R.; Sibi, P.S.; Sharma, P.; Tamang, M.; Singh, A.K. Twenty years of journal of quality assurance in hospitality & tourism: A bibliometric assessment. J. Qual. Assur. Hosp. Tour. 2021, 1–26. [Google Scholar] [CrossRef]
- Afuye, G.A.; Kalumba, A.M.; Busayo, E.T.; Orimoloye, I.R. A Bibliometric Review of Vegetation Response to Climate Change. Environ. Sci. Pollut. Res. 2021, 1–13. [Google Scholar] [CrossRef] [PubMed]
- Cuccurullo, C.; Aria, M.; Sarto, F. Foundations and trends in performance management. A twenty-five years bibliometric analysis in business and public administration domains. Scientometrics 2016, 108, 595–611. [Google Scholar] [CrossRef]
- Zhang, Y.; Huang, K.; Yu, Y.; Yang, B. Mapping of water footprint research: A bibliometric analysis during 2006–2015. J. Clean. Prod. 2017, 149, 70–79. [Google Scholar] [CrossRef]
- Van Eck, N.J.; Waltman, L. Software survey: VOSviewer, a computer program for bibliometric mapping. Scientometrics 2010, 84, 523–538. [Google Scholar] [CrossRef] [PubMed] [Green Version]
- Van Eck, N.J.; Waltman, L. VOSviewer Manual; Leiden Univeristeit: Leiden, The Netherlands, 2013; pp. 1–53. [Google Scholar]
- Moral Muñoz, J.A.; Herrera Viedma, E.; Santisteban Espejo, A.; Cobo, M.J. Software tools for conducting bibliometric analysis in science: An up-to-date review. El Prof. De La Inf. 2020, 29, e290103. [Google Scholar] [CrossRef] [Green Version]
- Cobo, M.J.; López-Herrera, A.G.; Herrera-Viedma, E.; Herrera, F. Science mapping software tools:.Review, analysis, and cooperative study among tools. J. Am. Soc. Inf. Sci. Technol. 2011, 62, 1382–1402. [Google Scholar] [CrossRef]
- Perianes-Rodriguez, A.; Waltman, L.; Van Eck, N.J. Constructing bibliometric networks: A comparison between full and fractional counting. J. Informetr. 2016, 10, 1178–1195. [Google Scholar] [CrossRef] [Green Version]
- Leung, X.Y.; Sun, J.; Bai, B. Bibliometrics of social media research: A co-citation and co-word. Int. J. Hosp. Manag. 2017, 66, 35–45. [Google Scholar] [CrossRef]
- Muritala, B.A.; Sánchez-Rebull, M.V.; Hernández-Lara, A.B. A Bibliometric Analysis of Online Reviews Research in Tourism and Hospitality. Sustainability 2020, 12, 9977. [Google Scholar] [CrossRef]
- Gagolewski, M. Bibliometric impact assessment with R and the CITAN package. J. Informetr. 2011, 1, 678–692. [Google Scholar] [CrossRef]
- Ellegaard, O.; Wallin, J.A. The bibliometric analysis of scholarly production: How great is the impact? Scientometrics 2015, 105, 1809–1831. [Google Scholar] [CrossRef] [Green Version]
- Huang, J.; Tang, J.; Qu, Y.; Zhang, L.; Zhou, Y.; Bao, S.; Mu, D. Mapping the knowledge structure of neonatal hypoxic-ischemic encephalopathy over the past decade: A co-word analysis based on keywords. J. Child Neurol. 2016, 31, 797–803. [Google Scholar] [CrossRef] [PubMed]
- Barnett, A.G.; Graves, N.; Clarke, P.; Blakely, T. What is the Impact of Research Funding on Research? Productivity? Available online: eprints.qut.edu.au/83127/ (accessed on 6 November 2021).
- Saygitov, R.T. The Impact of Grant Funding on the Publication Activity of Awarded Applicants: A Systematic Review of Comparative Studies and Meta-Analytical Estimates. Biorxiv 2018, 1, 354662. [Google Scholar] [CrossRef]
- Xie, H.; Zhang, Y.; Wu, Z.; Lv, T. A Bibliometric Analysis on Land Degradation: Current Status, Development, and Future Directions. Land 2020, 9, 28. [Google Scholar] [CrossRef] [Green Version]
- Brown, M.E.; Pinzón, J.E.; Didan, K.; Morisette, J.T.; Tucker, C.J. Evaluation of the consistency of long-term NDVI time series derived from AVHRR, SPOT-vegetation, SeaWiFS, MODIS, and Landsat ETM+ sensors. IEEE Trans. Geosci. Remote Sens. 2006, 44, 1787–1793. [Google Scholar] [CrossRef]
- Drusch, M.; Del Bello, U.; Carlier, S.; Colin, O.; Fernandez, V.; Gascon, F.; Hoersch, B.; Isola, C.; Laberinti, P.; Martimort, P.; et al. Sentinel-2: ESA’s optical high-resolution mission for GMES operational services. Remote Sens. Environ. 2012, 120, 25–36. [Google Scholar] [CrossRef]
- Jia, K.; Liang, S.; Gu, X.; Baret, F.; Wei, X.; Wang, X.; Yao, Y.; Yang, L.; Li, Y. Fractional vegetation cover estimation algorithm for Chinese GF-1 wide-field view data. Remote Sens. Environ. 2016, 177, 184–191. [Google Scholar] [CrossRef]
- Jacob, F.; Petitcolin, F.; Schmugge, T.; Vermote, E.; French, A.; Ogawa, K. Comparison of land surface emissivity and radiometric temperature derived from MODIS and ASTER sensors. Remote Sens. Env. 2004, 90, 137–152. [Google Scholar] [CrossRef]
- Duchemin, B.; Hadria, R.; Erraki, S.; Boulet, G.; Maisongrande, P.; Chehbouni, A.; Escadafal, R.; Ezzahar, J.; Hoedjes, J.C.; Kharrou, M.H.; et al. Monitoring wheat phenology and irrigation in Central Morocco: On the use of relationships between evapotranspiration, crops coefficients, leaf area index and remotely-sensed vegetation indices. Agric. Water Manag. 2006, 79, 1–27. [Google Scholar] [CrossRef]
- Koetz, B.; Sun, G.; Morsdorf, F.; Ranson, K.J.; Kneubühler, M.; Itten, K.; Allgöwer, B. Fusion of imaging spectrometer and LIDAR data over combined radiative transfer models for forest canopy characterization. Remote Sens. Environ. 2007, 106, 449–459. [Google Scholar] [CrossRef]
- De Rosa, D.; Basso, B.; Fasiolo, M.; Friedl, J.; Fulkerson, B.; Grace, P.R.; Rowlings, D.W. Predicting pasture biomass using a statistical model and machine learning algorithm implemented with remotely sensed imagery. Comput. Electron. Agric. 2021, 180, 105880. [Google Scholar] [CrossRef]
- Kaufman, Y.J.; Tanré, D. Algorithm for remote sensing of tropospheric aerosol from MODIS. NASA MODIS Algorithm Theor. Basis Doc. Goddard Space Flight Cent. 1998, 85, 3–68. [Google Scholar]
- Covello, F.; Battazza, F.; Coletta, A.; Lopinto, E.; Fiorentino, C.; Pietranera, L.; Valentini, G.; Zoffoli, S. COSMO-SkyMed an existing opportunity for observing the Earth. J. Geodyn. 2010, 49, 171–180. [Google Scholar] [CrossRef] [Green Version]
- Nativi, S.; Mazzetti, P.; Santoro, M.; Papeschi, F.; Craglia, M.; Ochiai, O. Big data challenges in building the global earth observation system of systems. Environ. Model. Softw. 2015, 68, 1–26. [Google Scholar] [CrossRef]
- Liang, S.H.; Croitoru, A.; Tao, C.V. A distributed geospatial infrastructure for Sensor Web. Comput. Geosci. 2005, 31, 221–231. [Google Scholar] [CrossRef]
- Reich, P.B.; Turner, D.P.; Bolstad, P. An approach to spatially distributed modeling of net primary production (NPP) at the landscape scale and its application in validation of EOS NPP products. Remote. Sens. Environ. 1999, 70, 69–81. [Google Scholar] [CrossRef]
- Anderson, K.; Ryan, B.; Sonntag, W.; Kavvada, A.; Friedl, L. Earth observation in service of the 2030 Agenda for Sustainable Development. Geo-Spat. Inf. Sci. 2017, 20, 77–96. [Google Scholar] [CrossRef]
- Kahle, A.B.; Palluconi, F.D.; Hook, S.J.; Realmuto, V.J.; Bothwell, G. The advanced spaceborne thermal emission and reflectance radiometer (ASTER). Int. J. Imaging Syst. Technol. 1991, 3, 144–156. [Google Scholar] [CrossRef]
- Cohen, W.B.; Justice, C.O. Validating Modis Terrestrial Ecology Products: Linking in Situ and Satellite Measurements; Remote sensing of environment; Elsevier Science Inc: New York, NY, USA, 1999. [Google Scholar] [CrossRef]
- Guanter, L.; Segl, K.; Kaufmann, H. Simulation of optical remote-sensing scenes with application to the EnMAP hyperspectral mission. IEEE Trans. Geosci. Remote Sens. 2009, 47, 2340–2351. [Google Scholar] [CrossRef]
- Chuvieco, E.; Li, J.; Yang, X. Advances in Earth Observation of Global Change; Springer: New York, NY, USA, 2010; pp. 1–15. [Google Scholar] [CrossRef]
- Mineart, G.M.; Crout, R.L. Technologies for global observations of ocean constituents. Mar. Technol. Soc. J. 2005, 39, 36–48. [Google Scholar] [CrossRef]
- Pandit, S.; Tsuyuki, S.; Dube, T. Estimating above-ground biomass in sub-tropical buffer zone community forests, Nepal, using Sentinel 2 data. Remote Sens. 2018, 10, 601. [Google Scholar] [CrossRef] [Green Version]
- Reida, J.B.; Wood, D. Interactive Model for Assessing Mangrove Health, Ecosystem Services, Policy Consequences, and Satellite Design in Rio de Janeiro Using Earth Observation Data. In Proceedings of the 71st International Astronautical Congress (IAC), International Astronautical Federation, Washington, DC, USA, 12–14 October 2020; Available online: https://hdl.handle.net/1721.1/129598.
- Susanty, A.; Bakhtiar, A.; Prasetya, F.; Maher, H.; Setiawan, J.D.; Chiou, C.C.; Wood, D. Indicators for Measuring the Impact of COVID-19 on Supply Chain Vulnerability of SMEs. In Proceedings of the 2021 IEEE 8th International Conference on Industrial Engineering and Applications (ICIEA), Chengdu, China, 23 April 202; pp. 439-443. [CrossRef]
- Xia, J.; Yang, C.; Li, Q. Building a spatiotemporal index for earth observation big data. Int. J. Appl. Earth Obs. Geoinf. 2018, 73, 245–252. [Google Scholar] [CrossRef]
- Bovée, M.; African Nations over the Moon. Ecofin Agency. 2019. Available online: https://www.ecofinagency.com/telecom/1705-40069-Rwanda-ready-to-launch-another-satellite-into-orbit (accessed on 14 July 2021).
- Woldai, T. The status of Earth Observation (EO) & Geo-Information Sciences in Africa–trends and challenges. Geo-Spat. Inf. Sci. 2020, 23, 107–123. [Google Scholar] [CrossRef]
- Cracknell, A.P. The development of remote sensing in the last 40 years. Int. J. Remote Sens. 2018, 39, 8387–8427. [Google Scholar] [CrossRef] [Green Version]
- Amedjar, M. Random Forest Effectiveness for Bragança Region Mapping: Comparing Indices, Number of the Decision Trees, and Generalization. Ph.D. Thesis, Biblioteca Digital do IPB, Braganza, Portugal, 2020. [Google Scholar]
- Crabbe, R.A.; Lamb, D.; Edwards, C. Discrimination of species composition types of a grazed pasture landscape using Sentinel-1 and Sentinel-2 data. Int. J. Appl. Earth Obs. Geoinf. 2020, 84, 101978. [Google Scholar] [CrossRef]


| Description | Results |
|---|---|
| Time Span | 1979–2019 |
| Documents | 435 |
| Sources (Journals, Books, etc.) | 229 |
| Keywords Plus (ID) | 3279 |
| Author’s Keywords (DE) | 1257 |
| Average Citations per Document | 19.76 |
| Authors | 1682 |
| Author Appearances | 2018 |
| Authors of Multi-Authored Documents | 1622 |
| Single-Authored Documents | 68 |
| Documents per Author | 0.259 |
| Authors per Document | 3.78 |
| Co-Authors per Document | 4.64 |
| Collaboration Index | 4.42 |
| Article | 402 |
| Review | 33 |
| Country | Articles | TC | AAC | SCP | MCP | A/MP |
|---|---|---|---|---|---|---|
| USA | 74 | 2949 | 39.85 | 61 | 13 | 0.176 |
| Netherlands | 5 | 1097 | 219.40 | 0 | 5 | 1.000 |
| France | 14 | 640 | 45.71 | 8 | 6 | 0.429 |
| Italy | 22 | 544 | 24.733 | 10 | 12 | 0.545 |
| China | 37 | 488 | 12.11 | 30 | 7 | 0.189 |
| Germany | 14 | 281 | 20.07 | 10 | 4 | 0.286 |
| Brazil | 2 | 192 | 96.00 | 1 | 1 | 0.500 |
| Switzerland | 6 | 151 | 25.17 | 3 | 3 | 0.500 |
| Canada | 5 | 149 | 29.80 | 3 | 2 | 0.400 |
| United Kingdom | 5 | 118 | 23.60 | 2 | 3 | 0.600 |
| Spain | 4 | 111 | 27.75 | 1 | 3 | 0.750 |
| Japan | 14 | 83 | 5.93 | 11 | 3 | 0.214 |
| Austria | 2 | 70 | 11.67 | 1 | 5 | 0.833 |
| Mexico | 2 | 43 | 21.50 | 0 | 2 | 1.000 |
| New Zealand | 2 | 41 | 20.50 | 2 | 0 | 0.000 |
| Greece | 3 | 40 | 13.33 | 1 | 2 | 0.667 |
| Thailand | 1 | 37 | 37.00 | 1 | 0 | 0.000 |
| India | 8 | 36 | 4.50 | 8 | 0 | 0.000 |
| Sri Lanka | 1 | 31 | 31.00 | 1 | 0 | 0.000 |
| Poland | 4 | 23 | 5.75 | 4 | 0 | 0.000 |
| Source | NP | TC | Start Year |
|---|---|---|---|
| IEEE Transaction on Geoscience and Remote Sensing. | 23 | 682 | 1987 |
| Remote Sensing. | 14 | 205 | 2010 |
| Remote Sensing of Environment. | 13 | 1688 | 1999 |
| IEEE Journal of Selected Topics in Applied Earth Observation and Remote Sensing. | 12 | 159 | 2008 |
| IEEE Systems Journal. | 11 | 195 | 2008 |
| Journal of Remote Sensing. | 11 | 93 | 2016 |
| ACTA Astronautic. | 10 | 106 | 1987 |
| Advances in Space Research | 10 | 87 | 1994 |
| International Journal of Remote Sensing. | 8 | 316 | 2000 |
| Proceedings of SPIE- the International Society for Optical Engineering. | 7 | 27 | 1979 |
| Space Policy. | 7 | 120 | 1995 |
| Computers and Geosciences. | 6 | 176 | 2005 |
| International Journal of Applied Earth Observation and Geoinformation. | 6 | 139 | 2009 |
| Canadian Journal of Remote Sensing. | 5 | 103 | 1997 |
| Journal of Geophysical Research Atmospheres. | 5 | 607 | 1998 |
| Current Problems in Remote Sensing of the Earth from Space. | 5 | 109 | 2015 |
| Environmental Modelling and Software. | 4 | 188 | 2013 |
| IEEE Geoscience and Remote Sensing Letters. | 4 | 69 | 2005 |
| Journal of Atmospheric Science. | 4 | 109 | 2000 |
| Sensors (Switzerland). | 4 | 29 | 2017 |
| Satellite/EOS/Model | Findings/Gaps | Total Citation | Reference |
|---|---|---|---|
| Sentinel-2 | The findings reveal the effectiveness of using Sentinel-2 in a global monitoring environment but unable to retrieve previous decades’ data for a long time series. | 1030 | [77] |
| MODIS | The results show that MODIS products work better than AVHRR in monitoring global fire detection changes in the location and rate of biomass consumption by fires. | 467 | [83] |
| Landsat7-ETM+ images, NDVI, LAI, AET, | Findings demonstrate exponential relationships between LAI and NDVI, as well in LAI and plant transpiration coefficient (Kcb); good accuracy linear relationship on NDVI and Kcb to wheat phenology in the seasonal land cover using Landsat data. Such analysis approaches on a regional scale are limited by high resolution and visit time. | 262 | [80] |
| AVHRR, SPOT-Vegetation, SeaWiFS, MODIS, Landsat ETM+. NDVI | Findings reveal a consistency in NDVI records derived in different satellites through statistical and correlation analyses for monitoring the surface vegetation. | 247 | [76] |
| COSMO-SkyMed | Findings show COSMO-SkyMed constellation contribution of the X-band SAR, fast response, and short revisit time for various agriculture monitoring applications. | 153 | [84] |
| Global Earth Observation System of Systems | The findings reveal the importance of knowledge and semantic formalization to address multidisciplinary applications (i.e., pasture change detection over time). | 126 | [85] |
| NASA Sensor Web | The findings showed the development of GeoSWIFT for the integration of remote sensing imagery and real-time in situ sensing observations of crop yielding. | 114 | [86] |
| Earth Observation System, MODIS, Land Science Team model, LAI | The results show the combination of remote sensing data with process-based and spatially distributed biogeochemistry models to examine variation in ecosystem processes. However, these process models can be validated against direct measurements made with eddy covariance flux towers and ground-based NPP sampling. | 100 | [87] |
| ASTER and MODIS. TES algorithm, TISIE algorithm | The results reveal the feasibility of merging ASTER and MODIS data for emissivity and radiometric temperature in semi-arid rangelands and agricultural areas. | 98 | [79] |
| Earth Observations | The findings show the significant role of Earth observation systems in supporting the 2030 Agenda directly addressing the sustainable development goals (SDGs). | 87 | [88] |
| Advanced Spaceborne Thermal Emission Reflectance Radiometer | Findings demonstrate the ability of ASTER to provide science objectives identified by the EOS global change program such as surface reflected radiances and the application of digital elevation models for vegetation conditions. | 85 | [89] |
| LIDAR, Imaging spectrometer, Radiative transfer models, LAI | The findings specified robust estimates of the characteristics of the forest canopy characteristics that were achieved, ranging from maximal tree height, fractional cover (Fcover), leaf area index (LAI) to the foliage chlorophyll, and water content of the foliage for a wide range of pastures. | 84 | [81] |
| MODIS, LAI | The findings validate land cover and land use change models using MODIS data based on MODIS Land Discipline Group (MODLAND). | 83 | [90] |
| Environmental Mapping and Analysis Program (EnMAP) mission | Findings revealed the simulated tool of remote sensing images for hyperspectral and multispectral data called EnMAP to applications such as pasture monitoring. | 77 | [91] |
| Widefield view (WFV for GF-1), Prospect + Sail radiative transfer model | Findings show a high-quality fractional vegetation cover estimation algorithm using a physical model and neural networks through the first high-resolution EOS Chinese satellite (GF-1 data). | 74 | [78] |
| Rank | Author Keywords (DE) | Articles | Author Keywords (ID) | Articles |
|---|---|---|---|---|
| 1 | Remote sensing | 34 | Remote sensing | 171 |
| 2 | Earth observation | 20 | Earth observation | 98 |
| 3 | Geoss | 18 | EOS | 76 |
| 4 | NDVI | 9 | Observations | 71 |
| 5 | Climate change | 8 | Satellite imagery | 62 |
| 6 | Interoperability | 8 | Satellites | 54 |
| 7 | Satellite | 7 | Earth (planet) | 42 |
| 8 | Geoss | 6 | Geoss | 40 |
| 9 | MODIS | 6 | Earth observations | 31 |
| 10 | Data sharing | 5 | Radiometers | 31 |
| 11 | Monitoring | 5 | Satellite data | 31 |
| 12 | Sentinel-2 | 5 | MODIS | 28 |
| 13 | Agriculture | 4 | Calibration | 27 |
| 14 | AMSR-E | 4 | Climate change | 27 |
| 15 | Aster | 4 | Decision Making | 24 |
| 16 | Big data | 4 | Spatial resolution | 24 |
| 17 | Biodiversity | 4 | Environmental monitoring | 23 |
| 18 | Calibration | 4 | Orbit | 21 |
| 19 | Classification | 4 | Weather forecasting | 21 |
| 20 | Data management | 4 | Mathematical model | 20 |
Publisher’s Note: MDPI stays neutral with regard to jurisdictional claims in published maps and institutional affiliations. |
© 2021 by the authors. Licensee MDPI, Basel, Switzerland. This article is an open access article distributed under the terms and conditions of the Creative Commons Attribution (CC BY) license (https://creativecommons.org/licenses/by/4.0/).
Share and Cite
Nduku, L.; Kalumba, A.M.; Munghemezulu, C.; Mashaba-Munghemezulu, Z.; Chirima, G.J.; Afuye, G.A.; Busayo, E.T. Earth Observation Systems and Pasture Modeling: A Bibliometric Trend Analysis. ISPRS Int. J. Geo-Inf. 2021, 10, 793. https://0-doi-org.brum.beds.ac.uk/10.3390/ijgi10110793
Nduku L, Kalumba AM, Munghemezulu C, Mashaba-Munghemezulu Z, Chirima GJ, Afuye GA, Busayo ET. Earth Observation Systems and Pasture Modeling: A Bibliometric Trend Analysis. ISPRS International Journal of Geo-Information. 2021; 10(11):793. https://0-doi-org.brum.beds.ac.uk/10.3390/ijgi10110793
Chicago/Turabian StyleNduku, Lwandile, Ahmed Mukalazi Kalumba, Cilence Munghemezulu, Zinhle Mashaba-Munghemezulu, George Johannes Chirima, Gbenga Abayomi Afuye, and Emmanuel Tolulope Busayo. 2021. "Earth Observation Systems and Pasture Modeling: A Bibliometric Trend Analysis" ISPRS International Journal of Geo-Information 10, no. 11: 793. https://0-doi-org.brum.beds.ac.uk/10.3390/ijgi10110793