
Passive Mobile Data for Studying Seasonal Tourism Mobilities: An Application in a Mediterranean Coastal Destination


Abstract
:1. Introduction
- To confirm the potential value of mobile phone data for the study of the multiple geographical and temporal scales of seasonal events, such as tourism mobility in cities and regions.
- To implement an approach that allows the visualisation of these multiple geographical and temporal changes using graph-based representations.
- To measure the effect of tourism seasonality on the reconfiguration of overall intra-urban and inter-urban mobility.
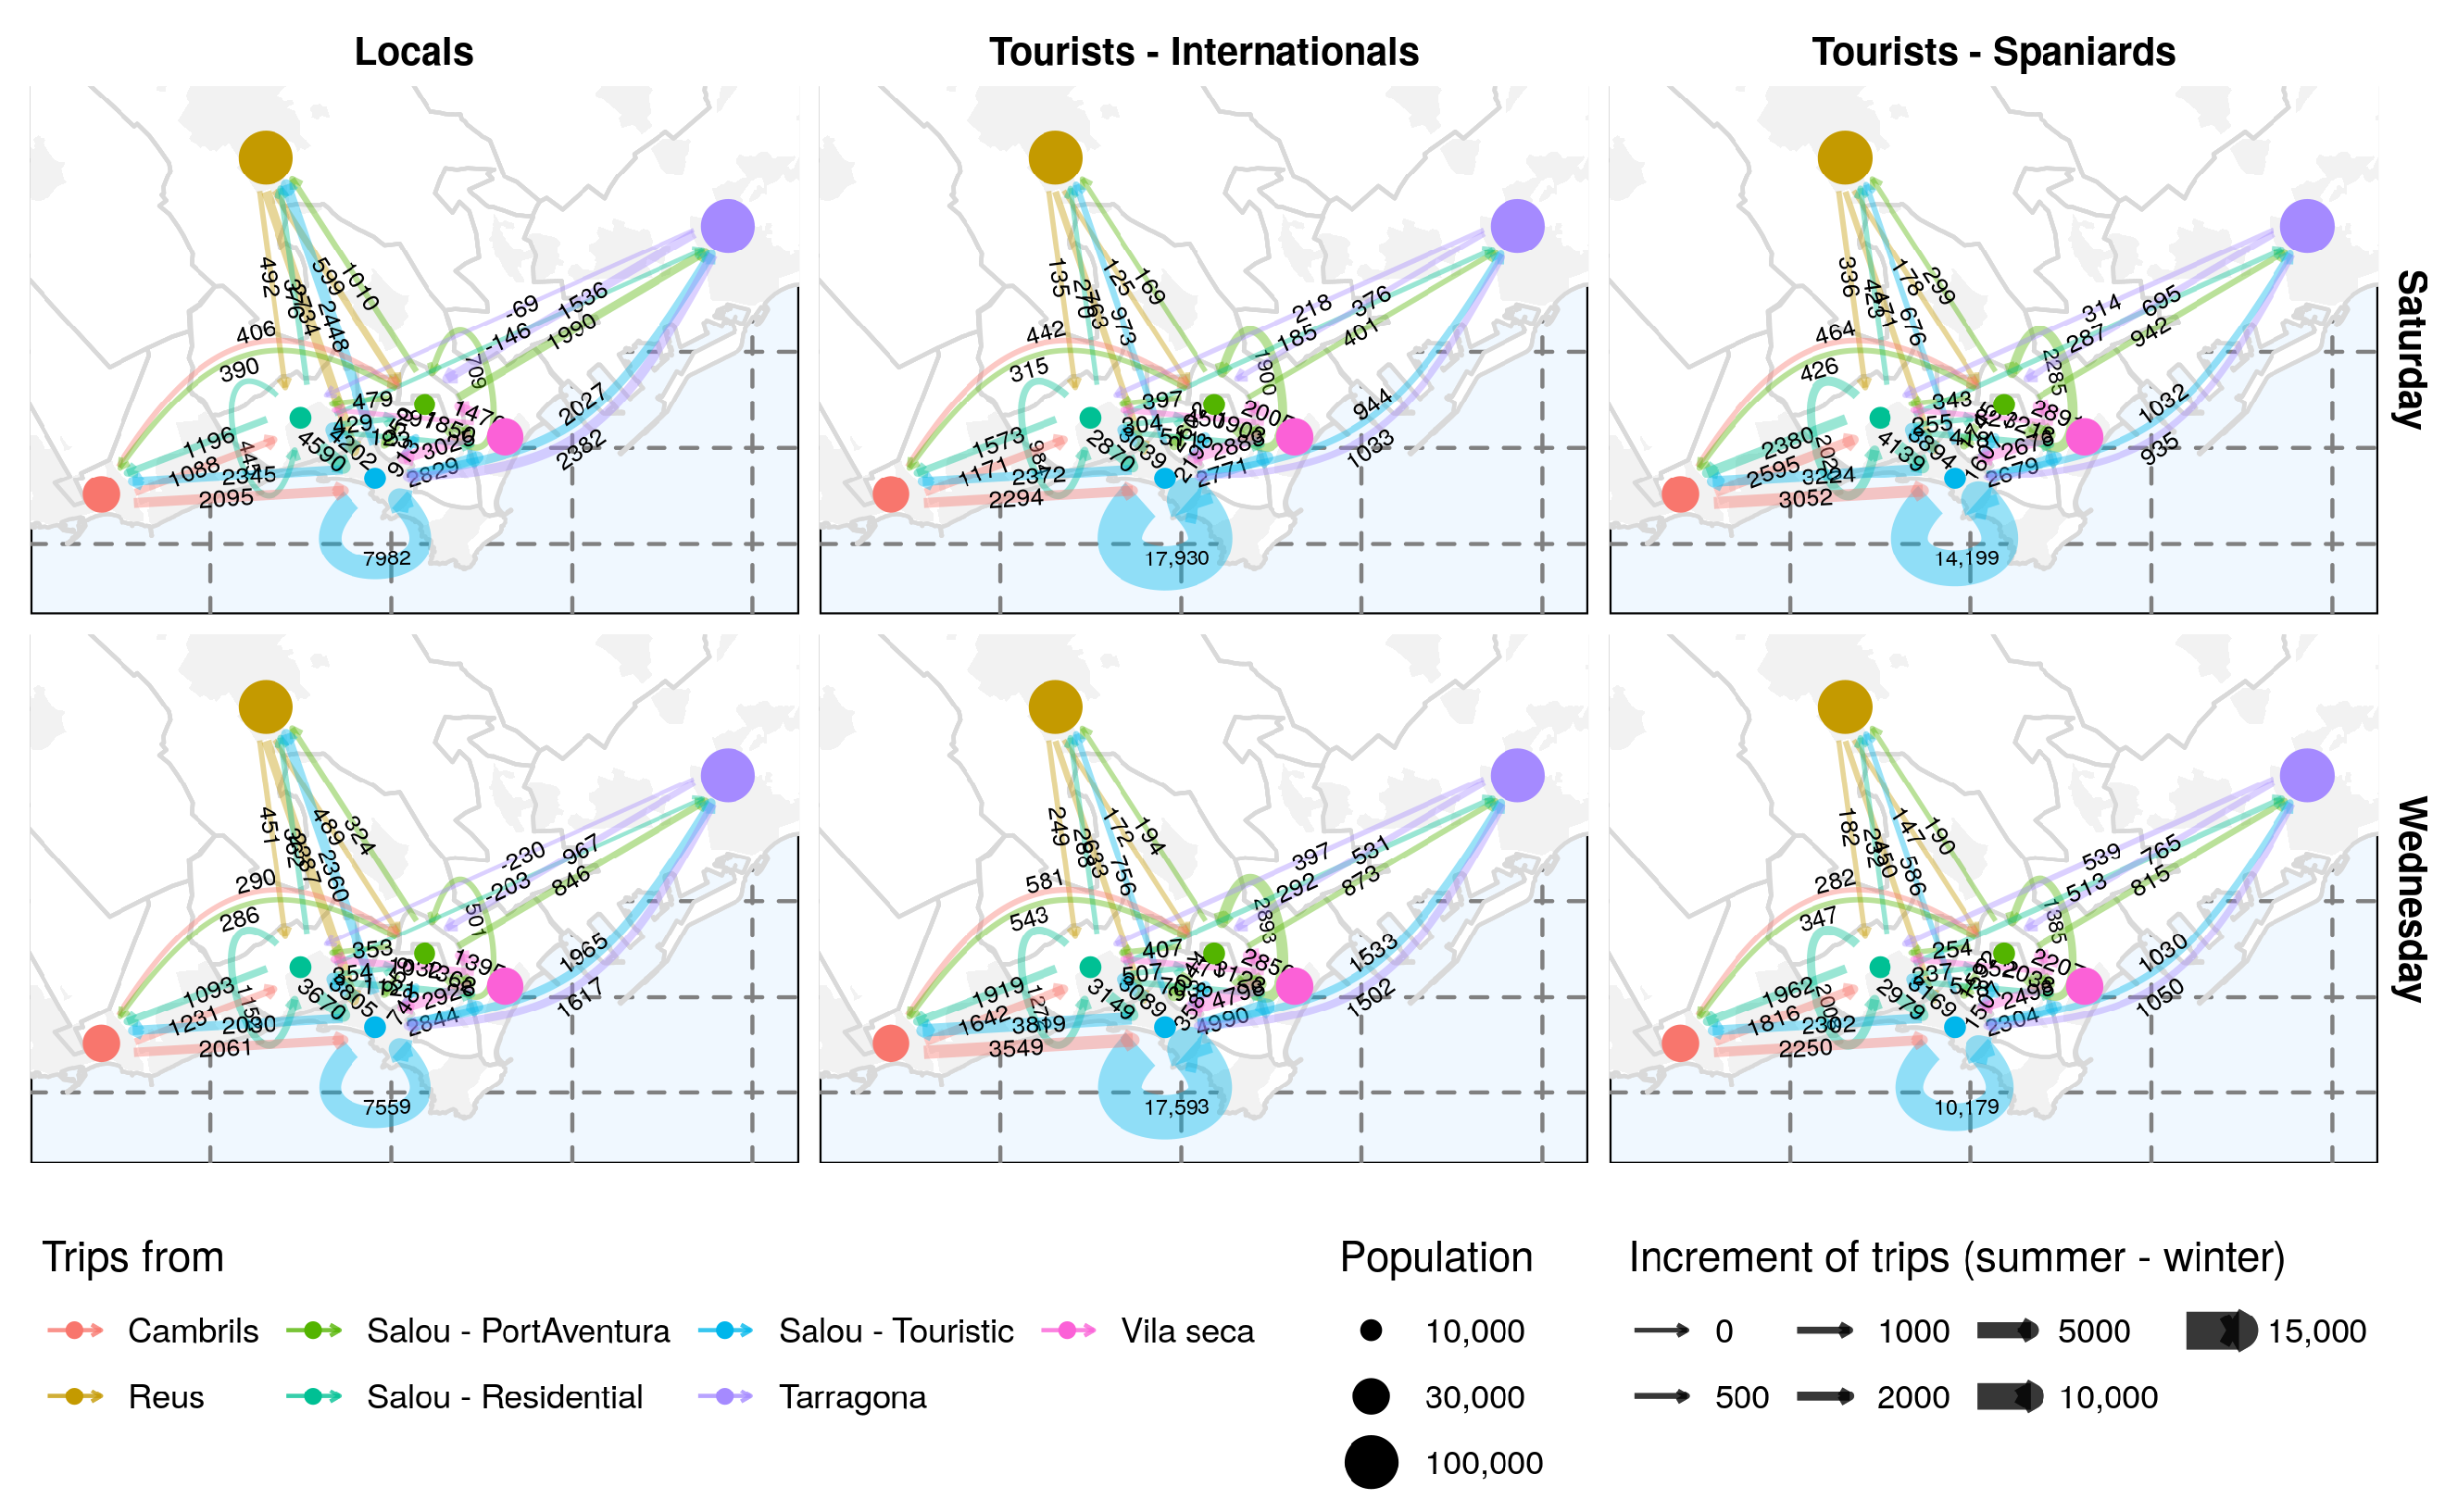
- To identify the differentiated mobility patterns of tourists and locals.
- To verify how diverse intensities in tourism activity within the different areas of the city involve different mobility patterns and timings.
2. Background
2.1. Mobile Phone Data
2.2. Tourism Mobility Studies Based on Mobile Phone Data
2.3. Main Contributions of This Work
3. Methodology
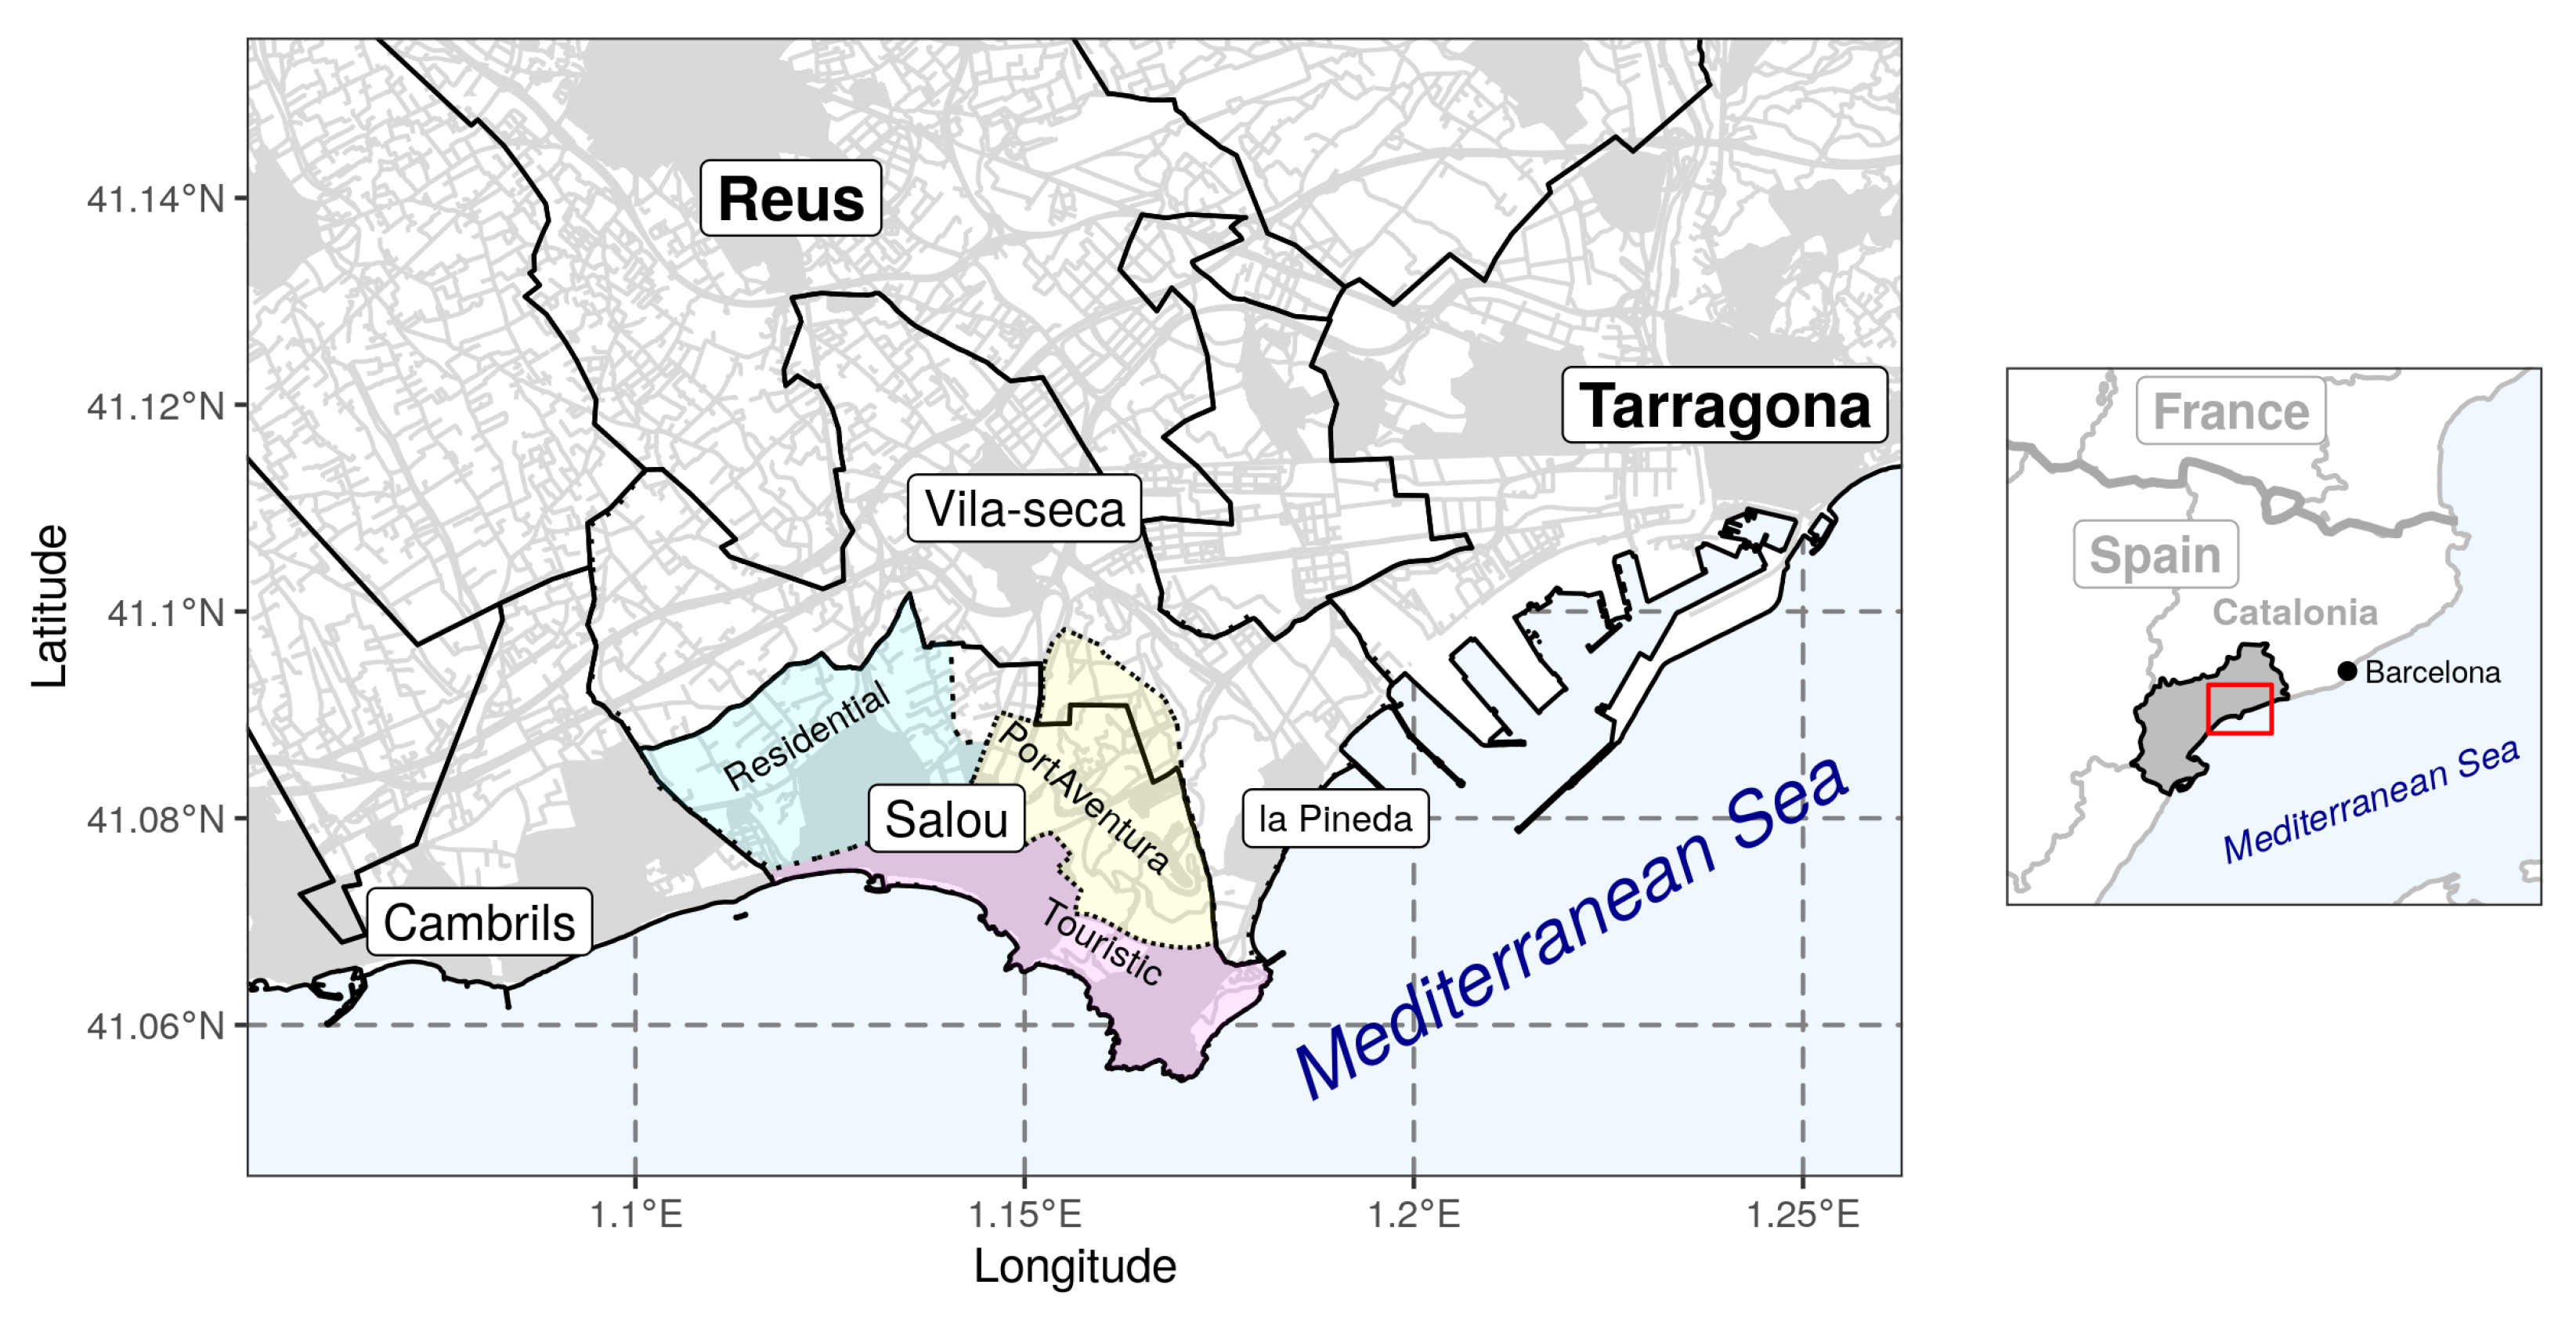
3.1. Case Study
3.2. Data
- Pre-processing and cleaning. Based on the mobile operator’s anonymised data (Table 3), a pre-processing stage is carried out to facilitate the management, ordering and grouping of the data for later stages. In this same stage, data cleaning and quality control tasks are also performed. These tasks are applied to anonymised mobile data records and user profile data.Figure 1 shows a representation of a possible scenario for analysing PMD. In the vast majority of studies, the location of the mobile phone is based on the locations of the cell towers of the mobile phone network used (see Table 3). A Voronoi tessellation is constructed based on the cell tower locations and is used to determine the position of each user in a specific moment; in this way, each polygon defines the maximum level of granularity. The Voronoi polygon layer is used to zone and extrapolate the user activity in each cell, depending on other datasets, such as sociodemographic data or land use and cover from the Spanish Land Occupation Information System (SIOSE). We did not have access to the location of the antennas nor the Voronoi tessellation, only to the trips already aggregated at the municipal or district level.
- Potential sample selection. The next step is to select the users whose mobile activity provides correct information in the study area. The main objective of this stage is to build a sample that involves a compromise between quantity and quality. Some indicators to consider are the number of records generated and the time lapses between them. Special treatment is required in the case of foreign visitors, since their period of activity is limited to a few specific days, and their activity starts and ends mainly at airports.
- Activity and trip extraction. At this stage, activity and travel indicators are generated from mobile data records. This stage is divided into two sub-tasks: (1) the identification and characterisation of stays and activities, and (2) the identification and characterisation of travel and stages. The first is responsible for analysing consecutive records in the same mobile cell, and they are identified as stays when they remain for longer than a particular threshold (e.g., an average of 30 min, but it depends on the land use and other variable considerations). The stays that correspond to activities are then identified. The second task is responsible for defining the trips made using the activities and stages detected in the previous task. For each trip, a list of features are defined: a destination, start and end time, a mode of transport and a route. A distinction is drawn between medium- and long-distance trips and short-distance movements in urban environments. For long-distance trips map-matching and the average velocity of the trip is enough to determine the transport mode. For shorter trips, data fusion techniques are also necessary to specify a mode of transport (e.g., transport networks, airports, bus stations, surveys, land use).
- Extrapolation of the sample to the total population. The fourth stage is responsible for extrapolating the selected sample to the total population. Two different types are considered: residents in the country under study and foreigners. For the first of them, different factors are used, such as the census section, and, for foreigners, the total number of official visitors segmented by nationality, type of visitor, and entry point are used. The mobility of international tourists and other visitors is analysed from the data on users who are roaming on the Orange network. The analysis of the roaming data offers the following peculiarities: (1) Since they are not customers of Orange Spain, the only sociodemographic information available is the nationality of the mobile operator of each user, so it is taken as a proxy of their nationality; (2) roaming users can connect to different networks during their stay, so the percentage of users present in the sample over the total number of foreign visitors is higher than the market share of the operator; and (3) many of these users generate an insufficient number of records to analyse their mobility, so these data are usually excluded from the analysis.
- Output generation. The last stage is responsible for generating the final dataset, adding different spatial and temporal resolutions and the segmentation needed to visualise the behaviour of the selected population. The results of this stage are a collection of OD matrices with different naming conventions that we merged and adapted for the proposed visual analysis (see Table 4).
3.3. Data Visualisation
4. Results
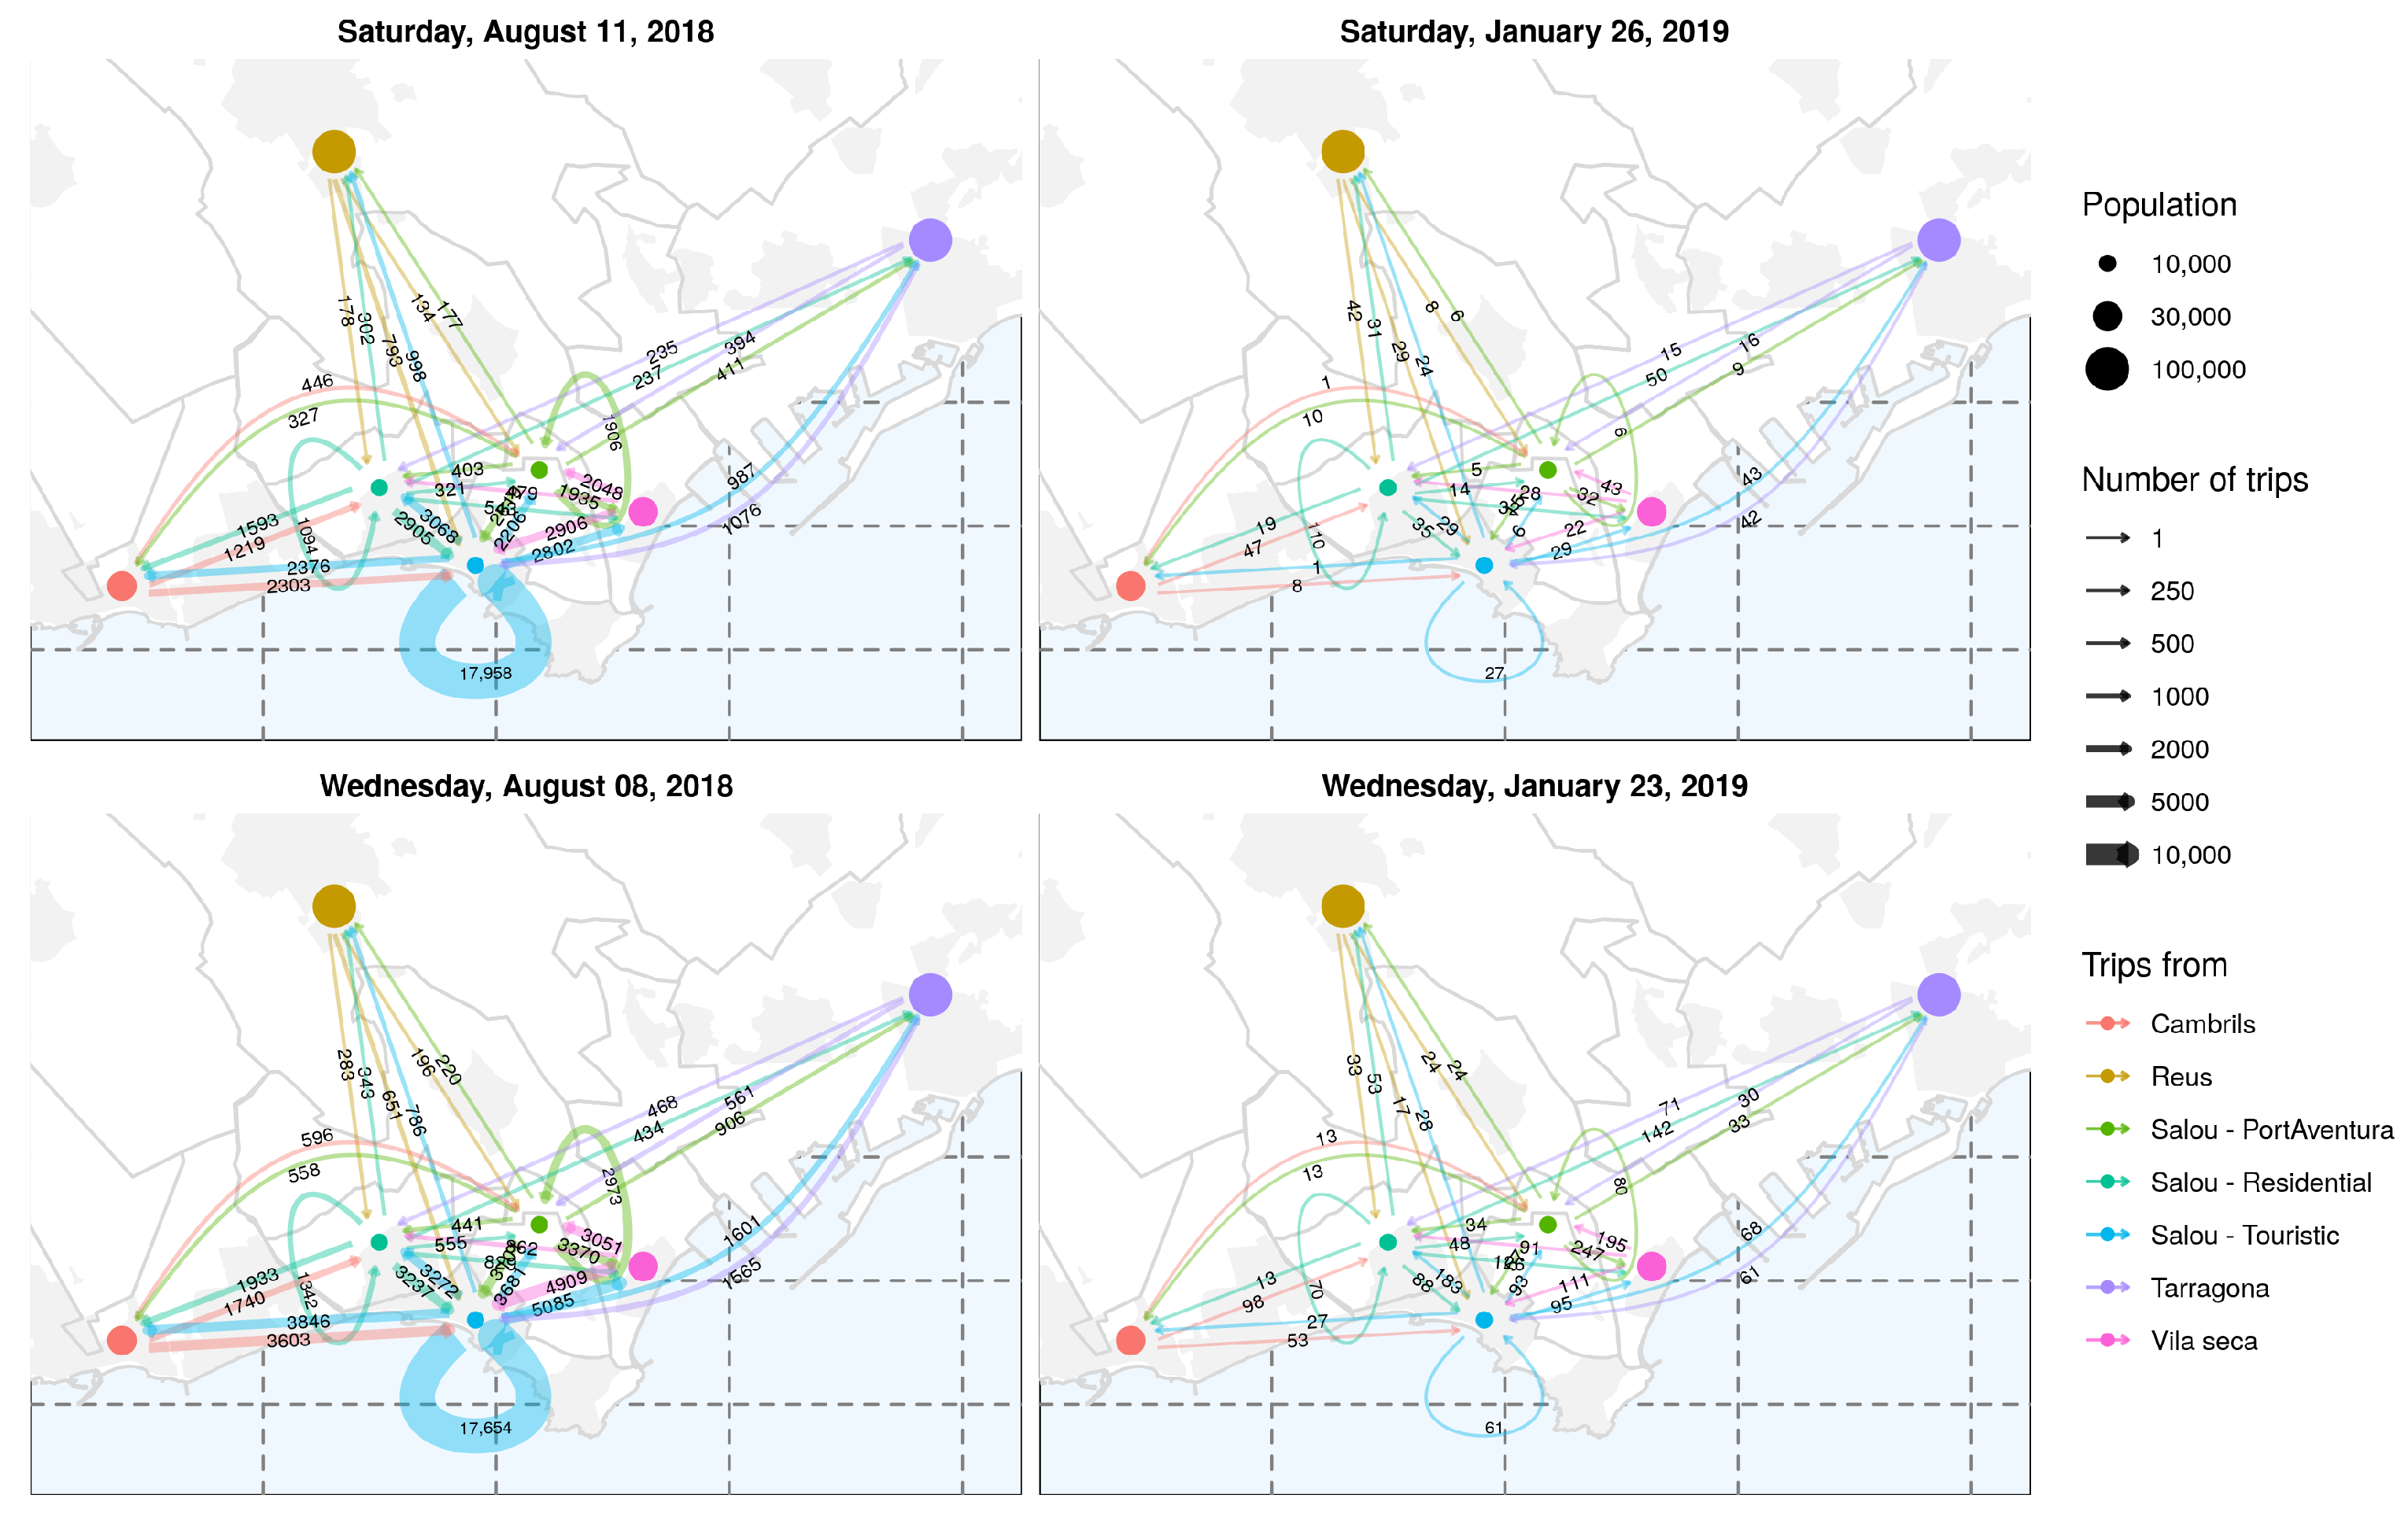
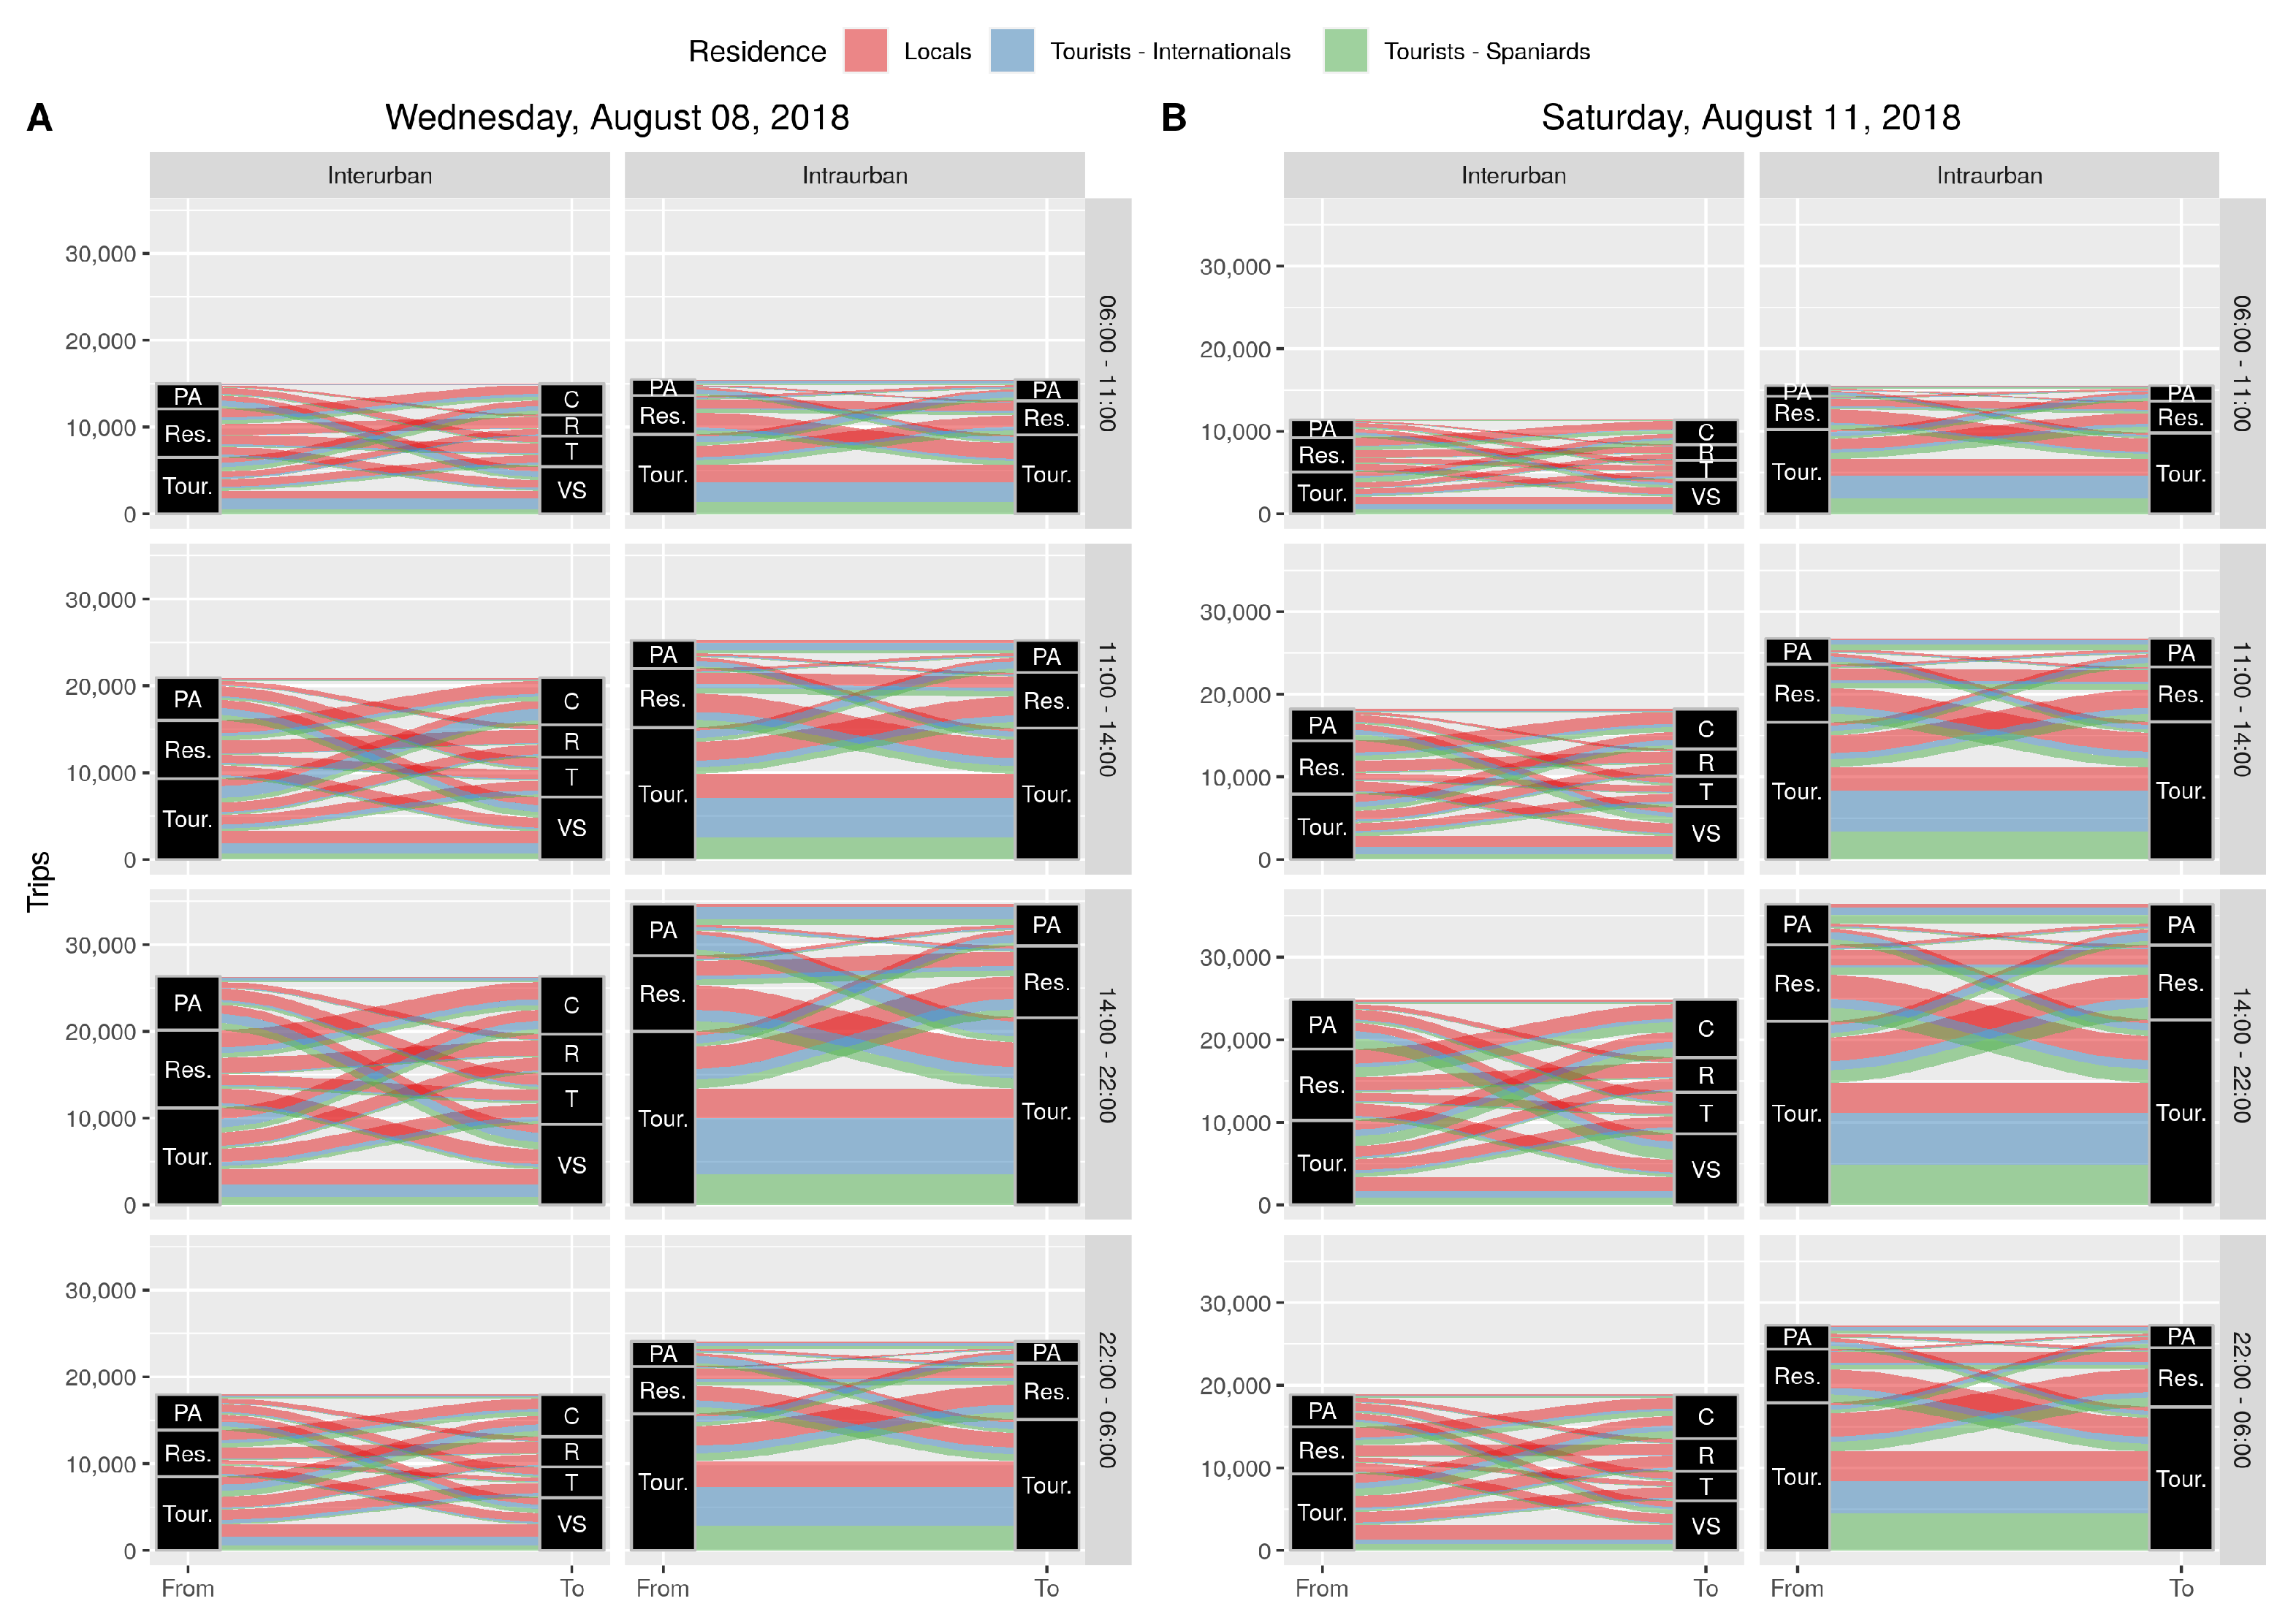
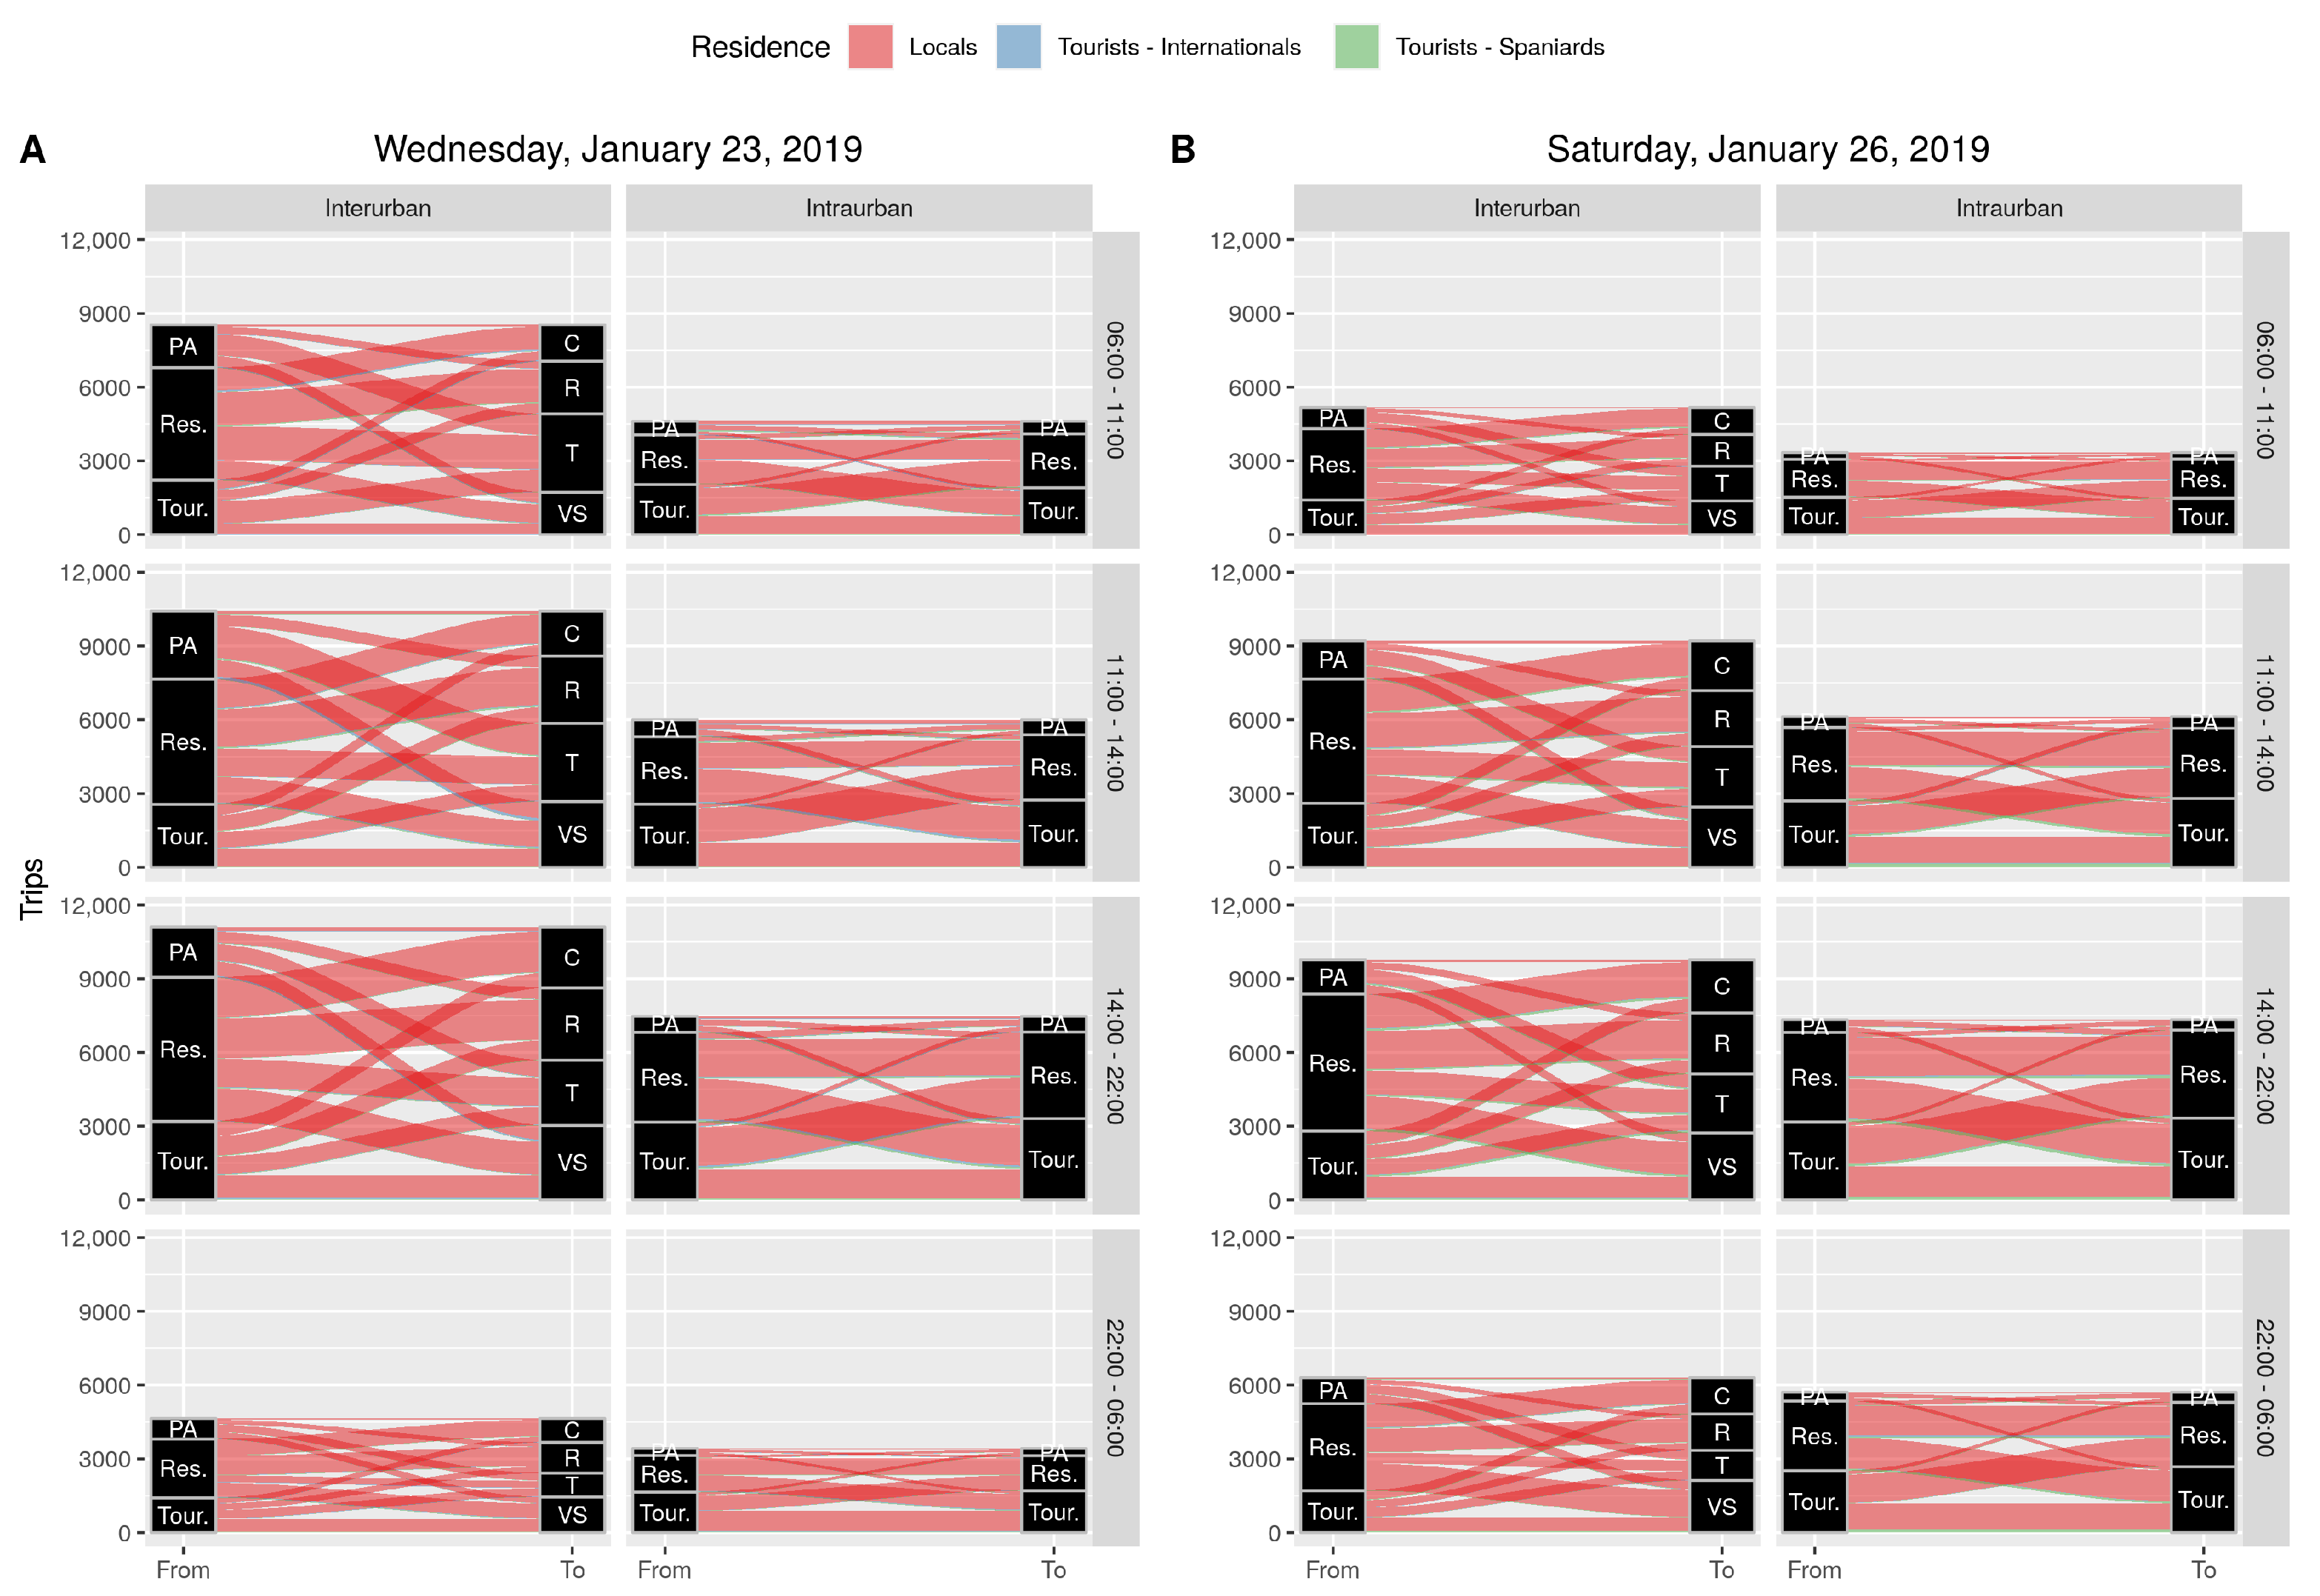
4.1. Visualising Tourism Mobilities Using Mobility Data
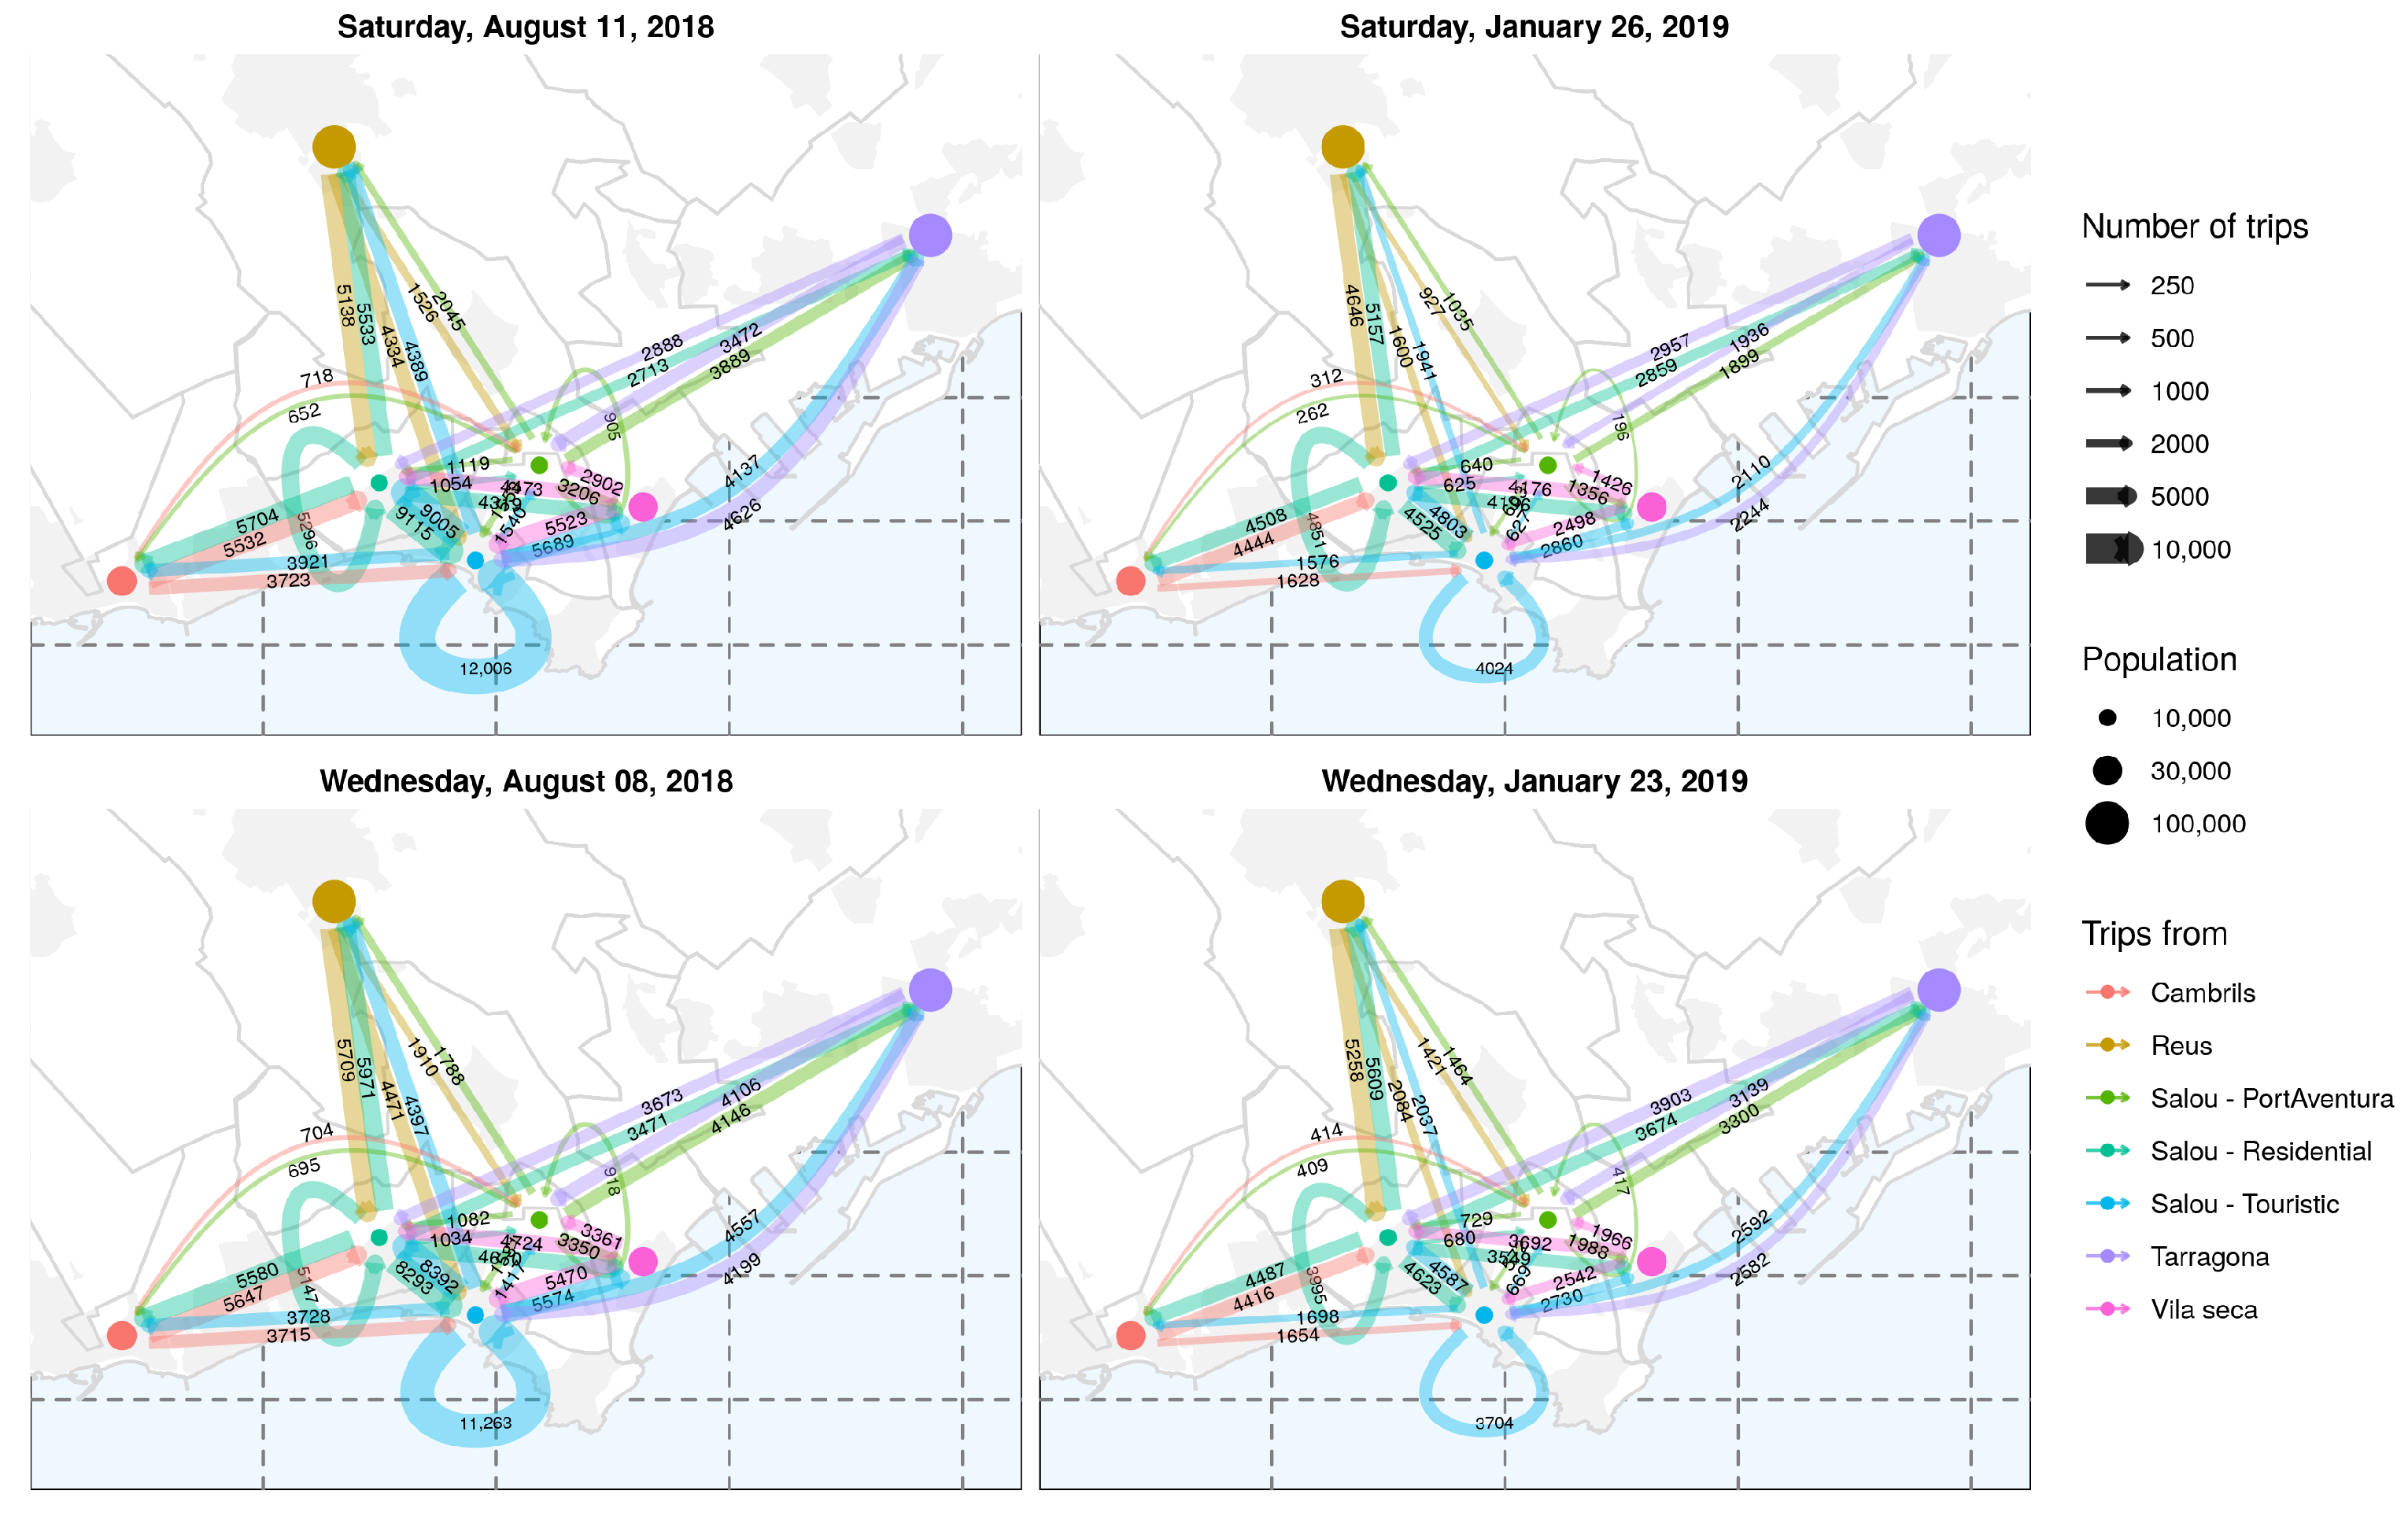
4.2. Seasonality at the Intra-Urban and Inter-Urban Scale
5. Discussion and Conclusions
5.1. Main Findings and Contributions
5.2. Limitations
5.3. Future Work
Author Contributions
Funding
Institutional Review Board Statement
Informed Consent Statement
Conflicts of Interest
References
- Li, J.; Xu, L.; Tang, L.; Wang, S.; Li, L. Big data in tourism research: A literature review. Tour. Manag. 2018, 68, 301–323. [Google Scholar] [CrossRef]
- Alaei, A.R.; Becken, S.; Stantic, B. Sentiment analysis in tourism: Capitalizing on big data. J. Travel Res. 2019, 58, 175–191. [Google Scholar] [CrossRef]
- e Silva, F.B.; Herrera, M.A.M.; Rosina, K.; Barranco, R.R.; Freire, S.; Schiavina, M. Analysing spatiotemporal patterns of tourism in Europe at high-resolution with conventional and big data sources. Tour. Manag. 2018, 68, 101–115. [Google Scholar] [CrossRef]
- Chen, C.; Ma, J.; Susilo, Y.; Liu, Y.; Wang, M. The promises of big data and small data for travel behavior (aka human mobility) analysis. Transp. Res. Part Emerg. Technol. 2016, 68, 285–299. [Google Scholar] [CrossRef] [Green Version]
- Reif, J.; Schmücker, D. Exploring new ways of visitor tracking using big data sources: Opportunities and limits of passive mobile data for tourism. J. Destin. Mark. Manag. 2020, 18, 100481. [Google Scholar] [CrossRef]
- Gutiérrez, A.; Domènech, A.; Zaragozí, B.; Miravet, D. Profiling tourists’ use of public transport through smart travel card data. J. Transp. Geogr. 2020, 88, 13. [Google Scholar] [CrossRef]
- Howard, P.N.; Mazaheri, N. Telecommunications reform, Internet use and mobile phone adoption in the developing world. World Dev. 2009, 37, 1159–1169. [Google Scholar] [CrossRef]
- Lenormand, M.; Picornell, M.; Cantú-Ros, O.G.; Tugores, A.; Louail, T.; Herranz, R.; Barthelemy, M.; Frías-Martínez, E.; Ramasco, J.J. Cross-Checking Different Sources of Mobility Information. PLoS ONE 2014, 9, 1–10. [Google Scholar] [CrossRef] [PubMed]
- Blondel, V.D.; Decuyper, A.; Krings, G. A survey of results on mobile phone datasets analysis. EPJ Data Sci. 2015, 4, 10. [Google Scholar] [CrossRef] [Green Version]
- Xu, Y.; Li, J.; Xue, J.; Park, S.; Li, Q. Tourism Geography through the Lens of Time Use: A Computational Framework Using Fine-Grained Mobile Phone Data. Ann. Am. Assoc. Geogr. 2020, 1–25. [Google Scholar] [CrossRef]
- Janecek, A.; Valerio, D.; Hummel, K.A.; Ricciato, F.; Hlavacs, H. The cellular network as a sensor: From mobile phone data to real-time road traffic monitoring. IEEE Trans. Intell. Transp. Syst. 2015, 16, 2551–2572. [Google Scholar] [CrossRef]
- Wu, W.; Wang, Y.; Gomes, J.B.; Anh, D.T.; Antonatos, S.; Xue, M.; Yang, P.; Yap, G.E.; Li, X.; Krishnaswamy, S.; et al. Oscillation resolution for mobile phone cellular tower data to enable mobility modelling. In Proceedings of the 2014 IEEE 15th International Conference on Mobile Data Management, Brisbane, Australia, 14–18 July 2014; Volume 1, pp. 321–328. [Google Scholar]
- Sørensen, A.Ø.; Bjelland, J.; Bull-Berg, H.; Landmark, A.D.; Akhtar, M.M.; Olsson, N.O. Use of mobile phone data for analysis of number of train travellers. J. Rail Transp. Plan. Manag. 2018, 8, 123–144. [Google Scholar]
- Jiang, S.; Ferreira, J.; Gonzalez, M.C. Activity-based human mobility patterns inferred from mobile phone data: A case study of Singapore. IEEE Trans. Big Data 2017, 3, 208–219. [Google Scholar] [CrossRef] [Green Version]
- Masso, A.; Silm, S.; Ahas, R. Generational differences in spatial mobility: A study with mobile phone data. Popul. Space Place 2019, 25, e2210. [Google Scholar] [CrossRef]
- Blumenstock, J.E. Inferring patterns of internal migration from mobile phone call records: Evidence from Rwanda. Inf. Technol. Dev. 2012, 18, 107–125. [Google Scholar] [CrossRef]
- Schmid, T.; Bruckschen, F.; Salvati, N.; Zbiranski, T. Constructing sociodemographic indicators for national statistical institutes by using mobile phone data: Estimating literacy rates in Senegal. J. R. Stat. Soc. Ser. A (Stat. Soc.) 2017, 180, 1163–1190. [Google Scholar] [CrossRef] [Green Version]
- Silm, S.; Ahas, R.; Mooses, V. Are younger age groups less segregated? Measuring ethnic segregation in activity spaces using mobile phone data. J. Ethn. Migr. Stud. 2018, 44, 1797–1817. [Google Scholar] [CrossRef] [Green Version]
- Yip, N.M.; Forrest, R.; Xian, S. Exploring segregation and mobilities: Application of an activity tracking app on mobile phone. Cities 2016, 59, 156–163. [Google Scholar] [CrossRef]
- Kamenjuk, P.; Aasa, A.; Sellin, J. Mapping changes of residence with passive mobile positioning data: The case of Estonia. Int. J. Geogr. Inf. Sci. 2017, 31, 1425–1447. [Google Scholar] [CrossRef]
- Bengtsson, L.; Lu, X.; Thorson, A.; Garfield, R.; Von Schreeb, J. Improved response to disasters and outbreaks by tracking population movements with mobile phone network data: A post-earthquake geospatial study in Haiti. PLoS Med. 2011, 8, e1001083. [Google Scholar] [CrossRef]
- Grantz, K.H.; Meredith, H.R.; Cummings, D.A.; Metcalf, C.J.E.; Grenfell, B.T.; Giles, J.R.; Mehta, S.; Solomon, S.; Labrique, A.; Kishore, N.; et al. The use of mobile phone data to inform analysis of COVID-19 pandemic epidemiology. Nat. Commun. 2020, 11, 1–8. [Google Scholar] [CrossRef] [PubMed]
- Ahas, R.; Aasa, A.; Mark, Ü.; Pae, T.; Kull, A. Seasonal tourism spaces in Estonia: Case study with mobile positioning data. Tour. Manag. 2007, 28, 898–910. [Google Scholar] [CrossRef]
- Ahas, R.; Aasa, A.; Roose, A.; Mark, Ü.; Silm, S. Evaluating passive mobile positioning data for tourism surveys: An Estonian case study. Tour. Manag. 2008, 29, 469–486. [Google Scholar] [CrossRef]
- Raun, J.; Ahas, R.; Tiru, M. Measuring tourism destinations using mobile tracking data. Tour. Manag. 2016, 57, 202–212. [Google Scholar] [CrossRef]
- Raun, J.; Shoval, N.; Tiru, M. Gateways for intra-national tourism flows: Measured using two types of tracking technologies. Int. J. Tour. Cities 2020. [Google Scholar] [CrossRef]
- Alawwad, Z.; Alkowaileet, W.; Alsubaiee, S.; Alfaris, A.; Alansari, M.M.; Ragab, A.M. Analyzing call detail records to support tourism statistics in Saudi Arabia: An exploratory study. In Proceedings of the 14th Global Forum on Tourism Statistics, Venice, Italy, 23–25 November 2016. [Google Scholar]
- Chen, N.C.; Xie, W.; Welsch, R.E.; Larson, K.; Xie, J. Comprehensive Predictions of Tourists’ Next Visit Location Based on Call Detail Records Using Machine Learning and Deep Learning Methods. In Proceedings of the 2017 IEEE International Congress on Big Data (BigData Congress), Honolulu, HI, USA, 25–30 June 2017; pp. 1–6. [Google Scholar]
- Chen, N.C.; Xie, J.; Tinn, P.; Alonso, L.; Nagakura, T.; Larson, K. Data Mining Tourism Patterns. Available online: http://papers.cumincad.org/data/works/att/caadria2017_070.pdf (accessed on 12 December 2020).
- Leng, Y.; Noriega, A.; Pentland, A.; Winder, I.; Lutz, N.; Alonso, L. Analysis of tourism dynamics and special events through mobile phone metadata. arXiv 2016, arXiv:1610.08342. [Google Scholar]
- Ling, F.; Sun, T.; Zhu, X.; Chen, Q.; Tang, X.; Ke, X. Mining travel behaviors of tourists with mobile phone data: A case study in Hainan. In Proceedings of the 2016 2nd IEEE International Conference on Computer and Communications (ICCC), Chengdu, China, 14–17 October 2016; pp. 1524–1529. [Google Scholar]
- Zhu, X.; Sun, T.; Yuan, H.; Hu, Z.; Miao, J. Exploring Group Movement Pattern through Cellular Data: A Case Study of Tourists in Hainan. ISPRS Int. J. Geo-Inf. 2019, 8, 74. [Google Scholar] [CrossRef] [Green Version]
- Chen, Q.; Hu, Z.; Su, H.; Tang, X.; Yu, K. Understanding travel patterns of tourists from mobile phone data: A case study in Hainan. In Proceedings of the 2018 IEEE International Conference on Big Data and Smart Computing (BigComp), Shanghai, China, 15–17 January 2018; pp. 45–51. [Google Scholar]
- Qin, S.; Man, J.; Wang, X.; Li, C.; Dong, H.; Ge, X. Applying big data analytics to monitor tourist flow for the scenic area operation management. Discret. Dyn. Nat. Soc. 2019, 2019, 8239047. [Google Scholar] [CrossRef] [Green Version]
- Vanhoof, M.; Hendrickx, L.; Puussaar, A.; Verstraeten, G.; Ploetz, T.; Smoreda, Z. Exploring the Use of Mobile Phone Data for Domestic Tourism Trip Analysis. Available online: https://journals.openedition.org/netcom/2742 (accessed on 12 December 2020).
- Mamei, M.; Colonna, M. Analysis of tourist classification from cellular network data. J. Locat. Based Serv. 2018, 12, 19–39. [Google Scholar] [CrossRef]
- Xu, Y.; Li, J.; Belyi, A.; Park, S. Characterizing destination networks through mobility traces of international tourists—A case study using a nationwide mobile positioning dataset. Tour. Manag. 2021, 82, 104195. [Google Scholar] [CrossRef]
- Gutiérrez, A.; Miravet, D. The determinants of tourist use of public transport at the destination. Sustainability 2016, 8, 908. [Google Scholar] [CrossRef]
- Domènech, A.; Miravet, D.; Gutiérrez, A. Mining bus travel card data for analysing mobilities in tourist regions. J. Maps 2020, 16, 40–49. [Google Scholar] [CrossRef]
- Domènech, A.; Gutiérrez, A. A GIS-Based Evaluation of the Effectiveness and Spatial Coverage of Public Transport Networks in Tourist Destinations. ISPRS Int. J. Geo-Inf. 2017, 6, 83. [Google Scholar] [CrossRef] [Green Version]
- Gutiérrez, A.; Miravet, D. Estacionalidad turística y dinámicas metropolitanas: Un análisis a partir de la movilidad en transporte público en el Camp de Tarragona. Rev. Geogr. Norte Gd. 2016, 89, 65–89. [Google Scholar] [CrossRef] [Green Version]
- Domènech, A.; Gutiérrez, A.; Clavé, S.A. Cruise Passengers’ Spatial Behaviour and Expenditure Levels at Destination. Tour. Plan. Dev. 2020, 17, 17–36. [Google Scholar] [CrossRef]
- Domènech, A.; Gutiérrez, A.; Anton Clavé, S. Built environment and urban cruise tourists’ mobility. Ann. Tour. Res. 2020, 81, 102889. [Google Scholar] [CrossRef]
- INE. Estadística de Movimientos Turísticos en Fronteras (FRONTUR) Noviembre 2019. Datos Provisionales. Available online: https://www.ine.es/daco/daco42/frontur/frontur1119.pdf (accessed on 12 December 2020).
- Zaragozí, B.; Giménez-Font, P. A visual data analysis for determining the geographical extent of the cabreves. J. Cult. Herit. 2021. [Google Scholar] [CrossRef]
- Zaragozí, B.M.; Trilles, S.; Navarro-Carrión, J.T. Leveraging Container Technologies in a GIScience Project: A Perspective from Open Reproducible Research. ISPRS Int. J. Geo-Inf. 2020, 9, 138. [Google Scholar] [CrossRef] [Green Version]
- Pujol-Perdices, M.; Gutiérrez, A. Segregación residencial de la población extranjera en un destino turístico maduro: El caso de La Pineda (Costa Dorada). Lurralde Investigación y Espacio 2017, 40, 167–192. [Google Scholar]
- Gutiérrez, A.; Miravet, D.; Saladié, Ò.; Anton Clavé, S. Transport mode choice by tourists transferring from a peripheral high-Speed Rail station to their destinations: Empirical evidence from Costa Daurada. Sustainability 2019, 11, 3200. [Google Scholar] [CrossRef] [Green Version]
- Shoval, N.; McKercher, B.; Ng, E.; Birenboim, A. Hotel location and tourist activity in cities. Ann. Tour. Res. 2011, 38, 1594–1612. [Google Scholar] [CrossRef]
- McKercher, B.; Shoval, N.; Ng, E.; Birenboim, A. First and repeat visitor behaviour: GPS tracking and GIS analysis in Hong Kong. Tour. Geogr. 2012, 14, 147–161. [Google Scholar] [CrossRef]
- Miranda, F.; Doraiswamy, H.; Lage, M.; Zhao, K.; Gonçalves, B.; Wilson, L.; Hsieh, M.; Silva, C.T. Urban Pulse: Capturing the Rhythm of Cities. IEEE Trans. Vis. Comput. Graph. 2017, 23, 791–800. [Google Scholar] [CrossRef] [PubMed] [Green Version]
- Wang, Z.; Yuan, Y.; Chang, L.; Sun, X.; Luo, X. A Graph-Based Visual Query Method for Massive Human Trajectory Data. IEEE Access 2019, 7, 160879–160888. [Google Scholar] [CrossRef]
- Parliament, E. Regulation (eu) 2016/679 of the european parliament and of the coucil of 27 april 2016 on the protection of natural persons with regard to the processing of personal data and on the free movement of such data, and repealing directive 95/46/ec (general data protection regulation). Off. J. Eur. Union L 2016, 119, 1–88. [Google Scholar]
- Trilles, S.; Granell, C.; Degbelo, A.; Bhattacharya, D. Interactive guidelines: Public communication of data-based research in cities. PLoS ONE 2020, 15, e0228008. [Google Scholar] [CrossRef]
- Zaragozí, B.; Giménez-Font, P.; Belda-Antolí, A.; Ramón-Morte, A. A graph-based analysis for generating geographical context from a historical cadastre in Spain (17th and 18th centuries). Hist. Methods J. Quant. Interdiscip. Hist. 2019, 52, 228–243. [Google Scholar] [CrossRef]


| Age Group | Total Population | Orange Users | Percentage |
|---|---|---|---|
| 10–19 | 4,813,817 | 683,995 | 14.2% |
| 20–44 | 15,238,220 | 5,489,663 | 36.0% |
| 45–65 | 13,522,821 | 4,045,965 | 29.9% |
| Over 65 | 9,057,193 | 1,282,015 | 14.2% |
| Origin | Total Visitors | Roaming Users | Percentage |
|---|---|---|---|
| France | 2,060,689 | 383,927 | 18.63% |
| United Kingdom | 982,514 | 94,568 | 9.63% |
| Germany | 641,242 | 30,678 | 4.78% |
| Portugal | 738,530 | 97,696 | 13.23% |
| Rest of the world | 3,166,237 | 333,437 | 10.53% |
| Device ID | Cell Tower ID | Date | Time |
|---|---|---|---|
| 125976C2BB0F73BDD81888E | 2140307102 | 20190126 | 161438 |
| 322405D3AC0F22ABB72352B | 2150335289 | 20190126 | 181436 |
| 228852A3DB0D33CAE15688E | 2140307102 | 20190811 | 192361 |
| 522345B6BD1A83BBB31932B | 2150335289 | 20190811 | 202513 |
| … | … | … | … |
| ID | From | To | Time_range | Residence | Date | Trips |
|---|---|---|---|---|---|---|
| 1 | 1 | 1 | 06:00–11:00 | Locals | 2018-08-08 | 11,308 |
| 2 | 1 | 1 | 06:00–11:00 | Locals | 2018-08-11 | 9132 |
| 3 | 1 | 1 | 06:00–11:00 | Locals | 2019-01-23 | 9004 |
| 4 | 1 | 1 | 06:00–11:00 | Locals | 2019-01-26 | 7158 |
| 5 | … | … | … | … | … | … |
| 6272 | 7 | 7 | 22:00–06:00 | Tourists-Spaniards | 2019-01-26 | 87 |
Publisher’s Note: MDPI stays neutral with regard to jurisdictional claims in published maps and institutional affiliations. |
© 2021 by the authors. Licensee MDPI, Basel, Switzerland. This article is an open access article distributed under the terms and conditions of the Creative Commons Attribution (CC BY) license (http://creativecommons.org/licenses/by/4.0/).
Share and Cite
Zaragozí, B.; Trilles, S.; Gutiérrez, A. Passive Mobile Data for Studying Seasonal Tourism Mobilities: An Application in a Mediterranean Coastal Destination. ISPRS Int. J. Geo-Inf. 2021, 10, 98. https://0-doi-org.brum.beds.ac.uk/10.3390/ijgi10020098
Zaragozí B, Trilles S, Gutiérrez A. Passive Mobile Data for Studying Seasonal Tourism Mobilities: An Application in a Mediterranean Coastal Destination. ISPRS International Journal of Geo-Information. 2021; 10(2):98. https://0-doi-org.brum.beds.ac.uk/10.3390/ijgi10020098
Chicago/Turabian StyleZaragozí, Benito, Sergio Trilles, and Aaron Gutiérrez. 2021. "Passive Mobile Data for Studying Seasonal Tourism Mobilities: An Application in a Mediterranean Coastal Destination" ISPRS International Journal of Geo-Information 10, no. 2: 98. https://0-doi-org.brum.beds.ac.uk/10.3390/ijgi10020098