Article

A Contributor-Focused Intrinsic Quality Assessment of OpenStreetMap in Mozambique Using Unsupervised Machine Learning

Department of Geography, Geoinformatics and Meteorology, University of Pretoria, Pretoria 0083, South Africa
*
Author to whom correspondence should be addressed.
ISPRS Int. J. Geo-Inf. 2021, 10(3), 156; https://0-doi-org.brum.beds.ac.uk/10.3390/ijgi10030156
Submission received: 20 January 2021 / Revised: 24 February 2021 / Accepted: 6 March 2021 / Published: 11 March 2021

Abstract

:
Anyone can contribute geographic information to OpenStreetMap (OSM), regardless of their level of experience or skills, which has raised concerns about quality. When reference data is not available to assess the quality of OSM data, intrinsic methods that assess the data and its metadata can be used. In this study, we applied unsupervised machine learning for analysing OSM history data to get a better understanding of who contributed when and how in Mozambique. Even though no absolute statements can be made about the quality of the data, the results provide valuable insight into the quality. Most of the data in Mozambique (93%) was contributed by a small group of active contributors (25%). However, these were less active than the OSM Foundation’s definition of active contributorship and the Humanitarian OpenStreetMap Team (HOT) definition for intermediate mappers. Compared to other contributor classifications, our results revealed a new class: contributors who were new in the area and most likely attracted by HOT mapping events during disaster relief operations in Mozambique in 2019. More studies in different parts of the world would establish whether the patterns observed here are typical for developing countries. Intrinsic methods cannot replace ground truthing or extrinsic methods, but provide alternative ways for gaining insight about quality, and they can also be used to inform efforts to further improve the quality. We provide suggestions for how contributor-focused intrinsic quality assessments could be further refined.

1. Introduction

OpenStreetMap (OSM), initiated in 2004, is a collaborative mapping project aimed at providing a map of the world in the form of a freely available database of geographic features that can be edited by anyone. OSM data resembles both volunteered geographic information (VGI), i.e., voluntarily contributed by members of the public, and crowdsourced data, i.e., obtained by enlisting the services of a large number of people, typically via the Internet [1]. The OSM project came about to overcome issues with spatial data availability and restrictions on the use of proprietary data sets imposed by data producers such as national mapping agencies. To a large extent, OSM was prompted by the success of Wikipedia [2]. With over 7 million registered users in 2021 [3], the OSM database is quite impressive and hosts a vast amount of geographic information contributed by users from all over the world. It is one of the most well-known and successful examples of crowdsourcing and volunteered geographic information so that OSM data, as well as its contributors, have become focal points of research [4,5,6,7,8,9]. However, only very few studies have focussed on OSM data in Africa [10,11].
OSM makes it possible for anyone to contribute geographic information, regardless of their level of experience or skills. In developing countries, where geospatial data is often scarce, OSM can be valuable for filling data gaps, e.g., during a disaster response [6,10,12]. Since the task of creating geographic information is no longer exclusively performed by trained professionals, data quality can be a concern and has been cited as a hindrance to its use [12,13]. OSM data quality has often been assessed extrinsically by comparing it to other reference datasets (see Section 2.2). However, such reference data is not always available [14] and some feature definitions (e.g., wetlands) are subjective. Therefore, intrinsic assessment methods have been employed to study OSM data quality, where the data itself or metadata about it is analysed.
For example, knowledge about contribution characteristics in a specific area can provide a better understanding of how volunteers contribute data and, therefore, insight into data quality. Analysing contributors and their contributions can answer questions, such as: What kind of contributors (e.g., experienced vs newcomers) have worked on the data in the area? In which areas should the data be validated, e.g., where have many newcomers or older non-recurring contributors worked? Several studies have analysed and characterised OSM contributors [5,15,16], but none of these focussed on Africa. As the number of OSM contributors continues to grow, knowledge about their characteristics and the kind of data they contribute is increasing in importance, especially in Africa where reference datasets are typically not available.
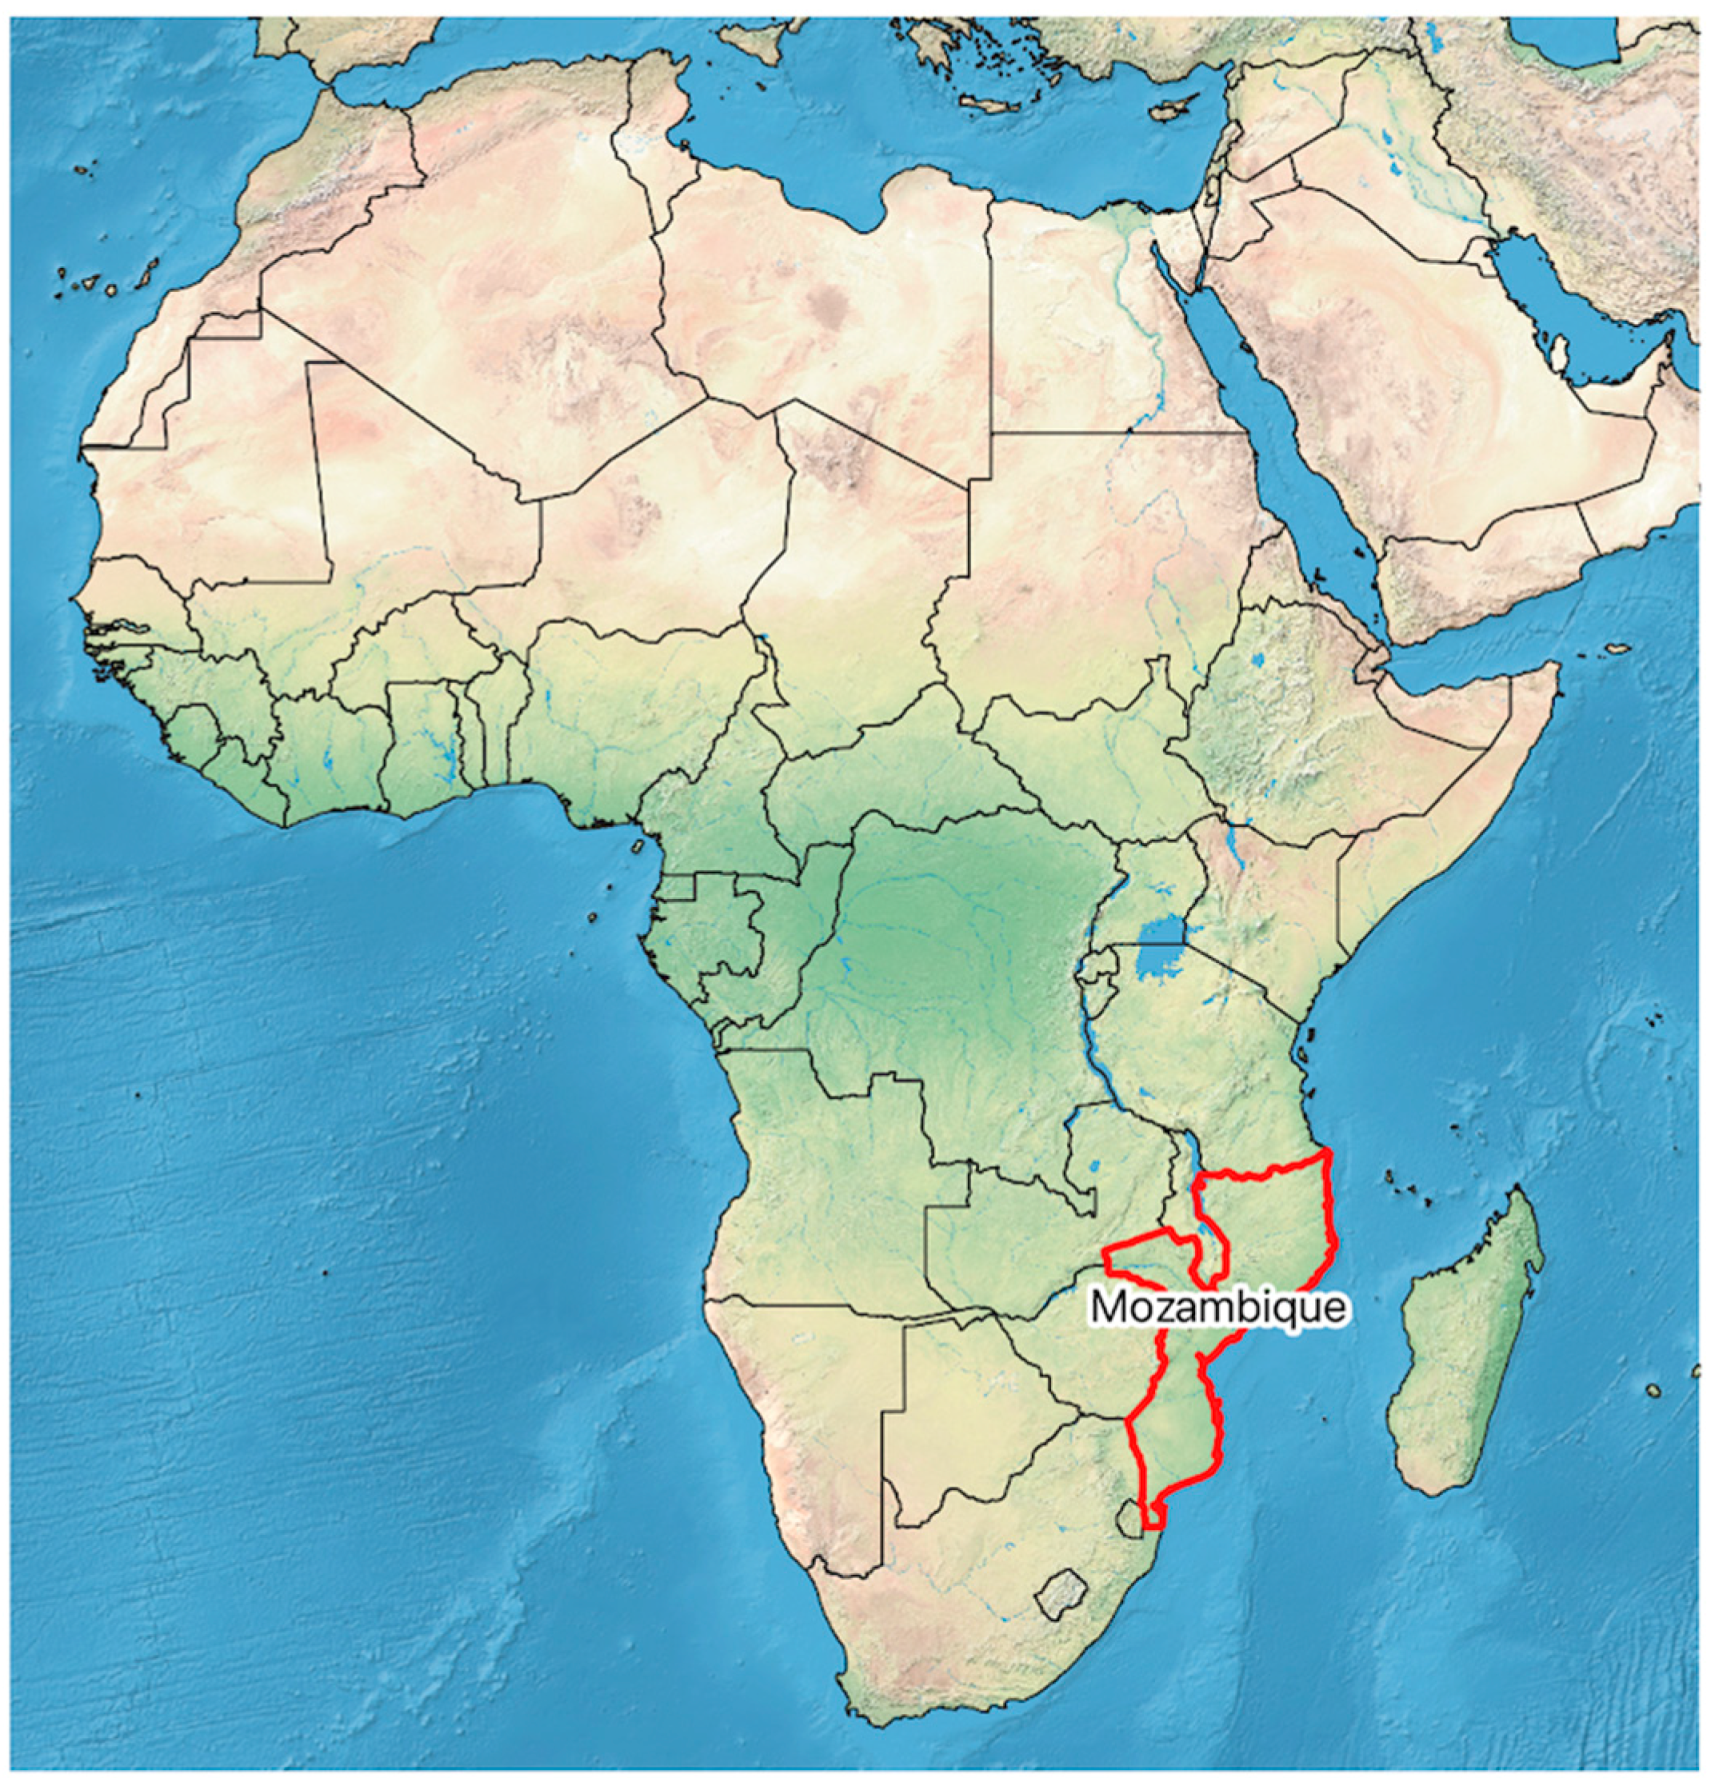
In this study, contributions to OSM data in Mozambique were analysed. Mozambique lies in the south-eastern part of Africa (see Figure 1) and has a sizable coastline of roughly 2700 km on the Indian ocean [17]. Mozambique covers an area of 801,537 km2, which makes it the world’s 36th-largest country, comparable in size to Turkey [18]. Even though Mozambique’s rate of economic growth has shown significant increase over the past two decades, the country still faces development challenges and is ranked as one of the world’s most underdeveloped nations. The population is among the poorest and most vulnerable to climate conditions. Over 60% of the population lives in low-lying flood prone zones with poor drainage, inadequate sanitation and flimsy infrastructure (e.g., rural and informal dwellings). Due to its geography—namely, a vast coastline, low-lying terrain and tropical climate—Mozambique is often faced with droughts, tropical cyclones and flooding near the coast and in river basins [17,19].
In 2019, cyclones Idai and Kenneth caused significant flood damage and a subsequent humanitarian crisis in Mozambique. In response, the Humanitarian OpenStreetMap Team (HOT) initiated a large number of mapping projects in support of relief operations, which resulted in a significant amount of attention in the OSM community. Smaller OSM mapping projects, aimed at filling gaps in spatial data coverage in the country, have also taken place over the years. We chose Mozambique for our study because we expected many new and recurring users to have contributed OSM data over a relatively short and recent timespan in the aftermaths of cyclones Idai and Kenneth.
In order to get a better understanding of OSM data quality in Mozambique, we applied principal component analysis and k-means clustering, an unsupervised machine learning (also referred to as statistical learning) technique, to characterize contributors of OSM data in Mozambique. Based on the contributor characterization, conclusions are presented about the quality of the data in Mozambique. To our knowledge, this is the first contributor-focussed intrinsic assessment of OSM data quality for an African country that makes use of unsupervised machine learning.
In the next section of this paper, we review data quality and how it can be assessed, specifically if the data is contributed by volunteers. Then we explain how we analysed OSM contributors in Mozambique and present the results of our analysis. The paper is concluded with a discussion of the results and potential future work.

2. Background and Related Work

2.1. Data Quality

Data quality refers to the degree to which a set of inherent data characteristics fulfils requirements [20]. If data is collected for a specific purpose, then these requirements are clear. However, geospatial data is typically collected and used for many different purposes; therefore, the quality cannot be assessed fully at the time of data collection. Instead, users need to assess the quality with reference to their context and the intended purpose of its use. In other words, the quality of geospatial data is subjective, as it depends on the user, purpose and context in which it is used [21].
There are several dimensions of geospatial data quality [22]:
  • Completeness describes the presence or absence of features, their attributes and relationships;
  • Logical consistency refers to the degree of adherence to logical rules of data structure, attribution and relationships;
  • Positional accuracy measures the closeness of a feature’s position to values as accepted as or being true;
  • Thematic accuracy comprises the accuracy of quantitative attributes, the correctness of non-quantitative attributes and the correctness of the classification of features and their relationships;
  • Temporal quality describes the quality of temporal attributes and temporal relationships of features;
  • Usability is based on user requirements and assessed by evaluating quality along the other dimensions.
Since quality is often assessed by users who were not involved in the data collection, the user has to rely on metadata provided by a contributor when assessing the quality of geospatial data. However, despite the availability of standards and tools for metadata collection and automation, metadata required to assess data quality remains a challenge and there is even less metadata available for VGI. Other VGI quality challenges include anonymous contributions and the detection of data that is volunteered maliciously, e.g., to manipulate property prices [21].

2.2. Data Quality Assessment

Data quality assessment methods are either direct, i.e., by inspecting the data, or indirect, i.e., by relying on external knowledge or experience of the data. Direct methods can be classified as intrinsic (internal) where quality is assessed based on the data only, or extrinsic (external) where data quality is assessed against another (external) data source [22]. Researchers have applied and evaluated both intrinsic and extrinsic data quality assessments methods for VGI [14,23].
In the early days of OSM, extrinsic methods were frequently used to compare OSM to external reference data for determining how well it measured up to professionally produced data, e.g., by traditional mapping agencies. Haklay [24] is one of the earliest of such examples with an assessment of the positional accuracy and completeness of the OSM road network in the United Kingdom. Girres and Touya [25] and Neis et al. [26] conducted similar assessments of the OSM road network in France and Germany, respectively. Mooney and Corcoran [27] assessed the accuracy of tags assigned to OSM road segments in Ireland, United Kingdom, Germany, and Austria, while Helbich et al. [28] evaluated the positional accuracy of road junctions in a German city. The quality of OSM building footprints was assessed in Munich, Germany [29] and in Lombardy, Italy [30]. OSM data has also been compared to land use data in Southern Germany [31].
Intrinsic quality assessments are useful when reference data is not available [14] or for data with subjective feature definitions [28], such as wetlands. Data-focused intrinsic assessment derives insight about data quality by considering the characteristics of the data itself, such as the number of versions of a feature, the type of edits made to the feature, when a feature was last edited and the number of contributors associated with a feature [32]. Contributor-focused intrinsic assessment derives insight about data quality by analysing the contributors, e.g., the frequency of their contributions, mapping preferences, contribution longevity and knowledge of the area (e.g., local vs. non-local contributors). The assumption is that features that have been worked on by experienced contributors, who have been active over a long period, are most likely to be of good quality [4]. Data-focused and contributor-focused assessments are often combined (e.g., [14]). Barron et al. [23] proposed a framework of 25 intrinsic indicators of OSM data quality, some of them focused on data and others on contributions. Whether data-focused, contributor-focused or a combination thereof, the reliability of results of intrinsic quality assessment methods depend on the availability of sufficient history data [32].
The use of intrinsic methods for assessing data quality is becoming increasingly relevant due to the lack of reference data in many parts of the world, specifically in developing countries, e.g., because it does not exist or because it is outdated [14] or too expensive. It is interesting to note that the countries for which intrinsic quality assessments of OSM data and contributors have been done do not only include developed countries, such as Canada [4,33]; Ireland and Lithuania [6]; Austria [34]; UK [35]; Germany [32]; Ireland, UK, Germany, and Austria [7]; Germany, France and UK [16], but also Haiti, Philippines, Liberia and Nepal [14]; Tanzania [11]; Jakarta [36]; India [37]. Tools have also been developed to support intrinsic quality assessment [38].
We chose Mozambique for our intrinsic approach to quality assessment focusing on contributor characteristics. Firstly, because few quality assessments have been done in Africa, and secondly, because we were interested in the impact of mapping projects initiated by HOT after two cyclones had affected Mozambique.

2.3. Contributor-Focused Intrinsic Quality Assessment

Table 1 summarizes contributor characteristics analysed in recent intrinsic quality assessments of OSM data. We categorized them into four kinds of characteristics; namely, time-related, activity-related, area-related and person-related, thus describing the when, how, where and who of contributions. We used some of these characteristics in our study.
The OpenStreetMap Foundation grants free membership to active members, which they define as a user who has contributed on at least 42 days in the past year [43]. The OSM Tasking Manager refers to beginner, intermediate and advanced mappers, based on the number changesets on which a user has worked [44]. Researchers have classified contributors, mostly based on descriptive statistics. For example, Anderson et al. [14] differentiated between experienced and inexperienced contributors based on whether they had been active for more than seven days; Budhathoki and Haythornthwaite [5] distinguished casual mappers from serious mappers based on node contributions, lifespan and mapping days; Bégin et al. [4] identified the main contributors as those who had mapped almost 95% of the study area; based on node contributions, Neis and Zipf [15] divided contributors into Senior Mappers, Junior Mappers, Non-recurring Mappers, and No Edit Mappers, and they also counted contributors by country and by continent; Yang et al. [16] distinguished professionals from amateurs, based on practice, skill and motivation (weekday productivity and duration of uninterrupted contribution periods).
A recent study by Jacobs and Mitchell [33] seems to be one of the first to move beyond descriptive statistics by applying k-means clustering to segment contributors in Ottawa-Gatineau (Canada), based on OSM history data. They identified four distinct clusters of contributors: Proficient Mappers/Validators, Power Mappers/Validators, Novice Mappers/Validators and Node Mappers/Validators. The Power Mappers/Validators cluster consists of contributors who are registered on OSM for longer, tend to map more complex features and use more advanced OSM editing software. Our study is one of the first to apply k-means clustering to segment contributors, and the first to do this for an African country.

3. Method

The analysis was conducted in Python, making use of various Python libraries; namely, Pyosmium, Pandas, Numpy, and Scikit-learn. Pyosmuim provides a range of functions for handling OSM data (e.g., reading and writing). Pandas has a range of tools to load, prepare, manipulate and analyse data. The data was analysed in a Pandas dataframe. Numpy provides mathematical functions and the efficient handling of multi-dimensional arrays. Scikit-learn has machine learning functionalities and a set of data analysis capabilities; it was used for the principal component analysis and cluster analysis. The Matplotlib and Seaborn libraries were used for data visualization. The analysis was conducted on a Packard Bell Laptop with an Intel® Core™ i3-5005U CPU and 8GB RAM.

3.1. Step 1: Extracting Contribution Data from OSM History Data

First, OSM history data was downloaded and contribution data extracted. OSM data is available in two formats: eXtensible Markup Language (XML), published as BZIP2 compressed file; Protocolbuffer Binary Format (PBF). The complete copy of the OSM data contains the latest version of all features. The history file also includes any older versions of features and deleted features since the inception of OSM. The files are updated weekly on the Planet OSM website (https://planet.openstreetmap.org, accessed on 9 March 2021). Due to the large size of the history file, it is advisable to work with a subset, provided by third parties. For this study, we downloaded the history file for Mozambique (in PBF format) from the Geofabrik website (https://www.geofabrik.de/, accessed on 9 March 2021) where it is available to registered OSM users only. The file was downloaded in June 2019. The first contribution to Mozambique is dated 1 January 2006 and the most recent contribution has a date of 3 June 2019.
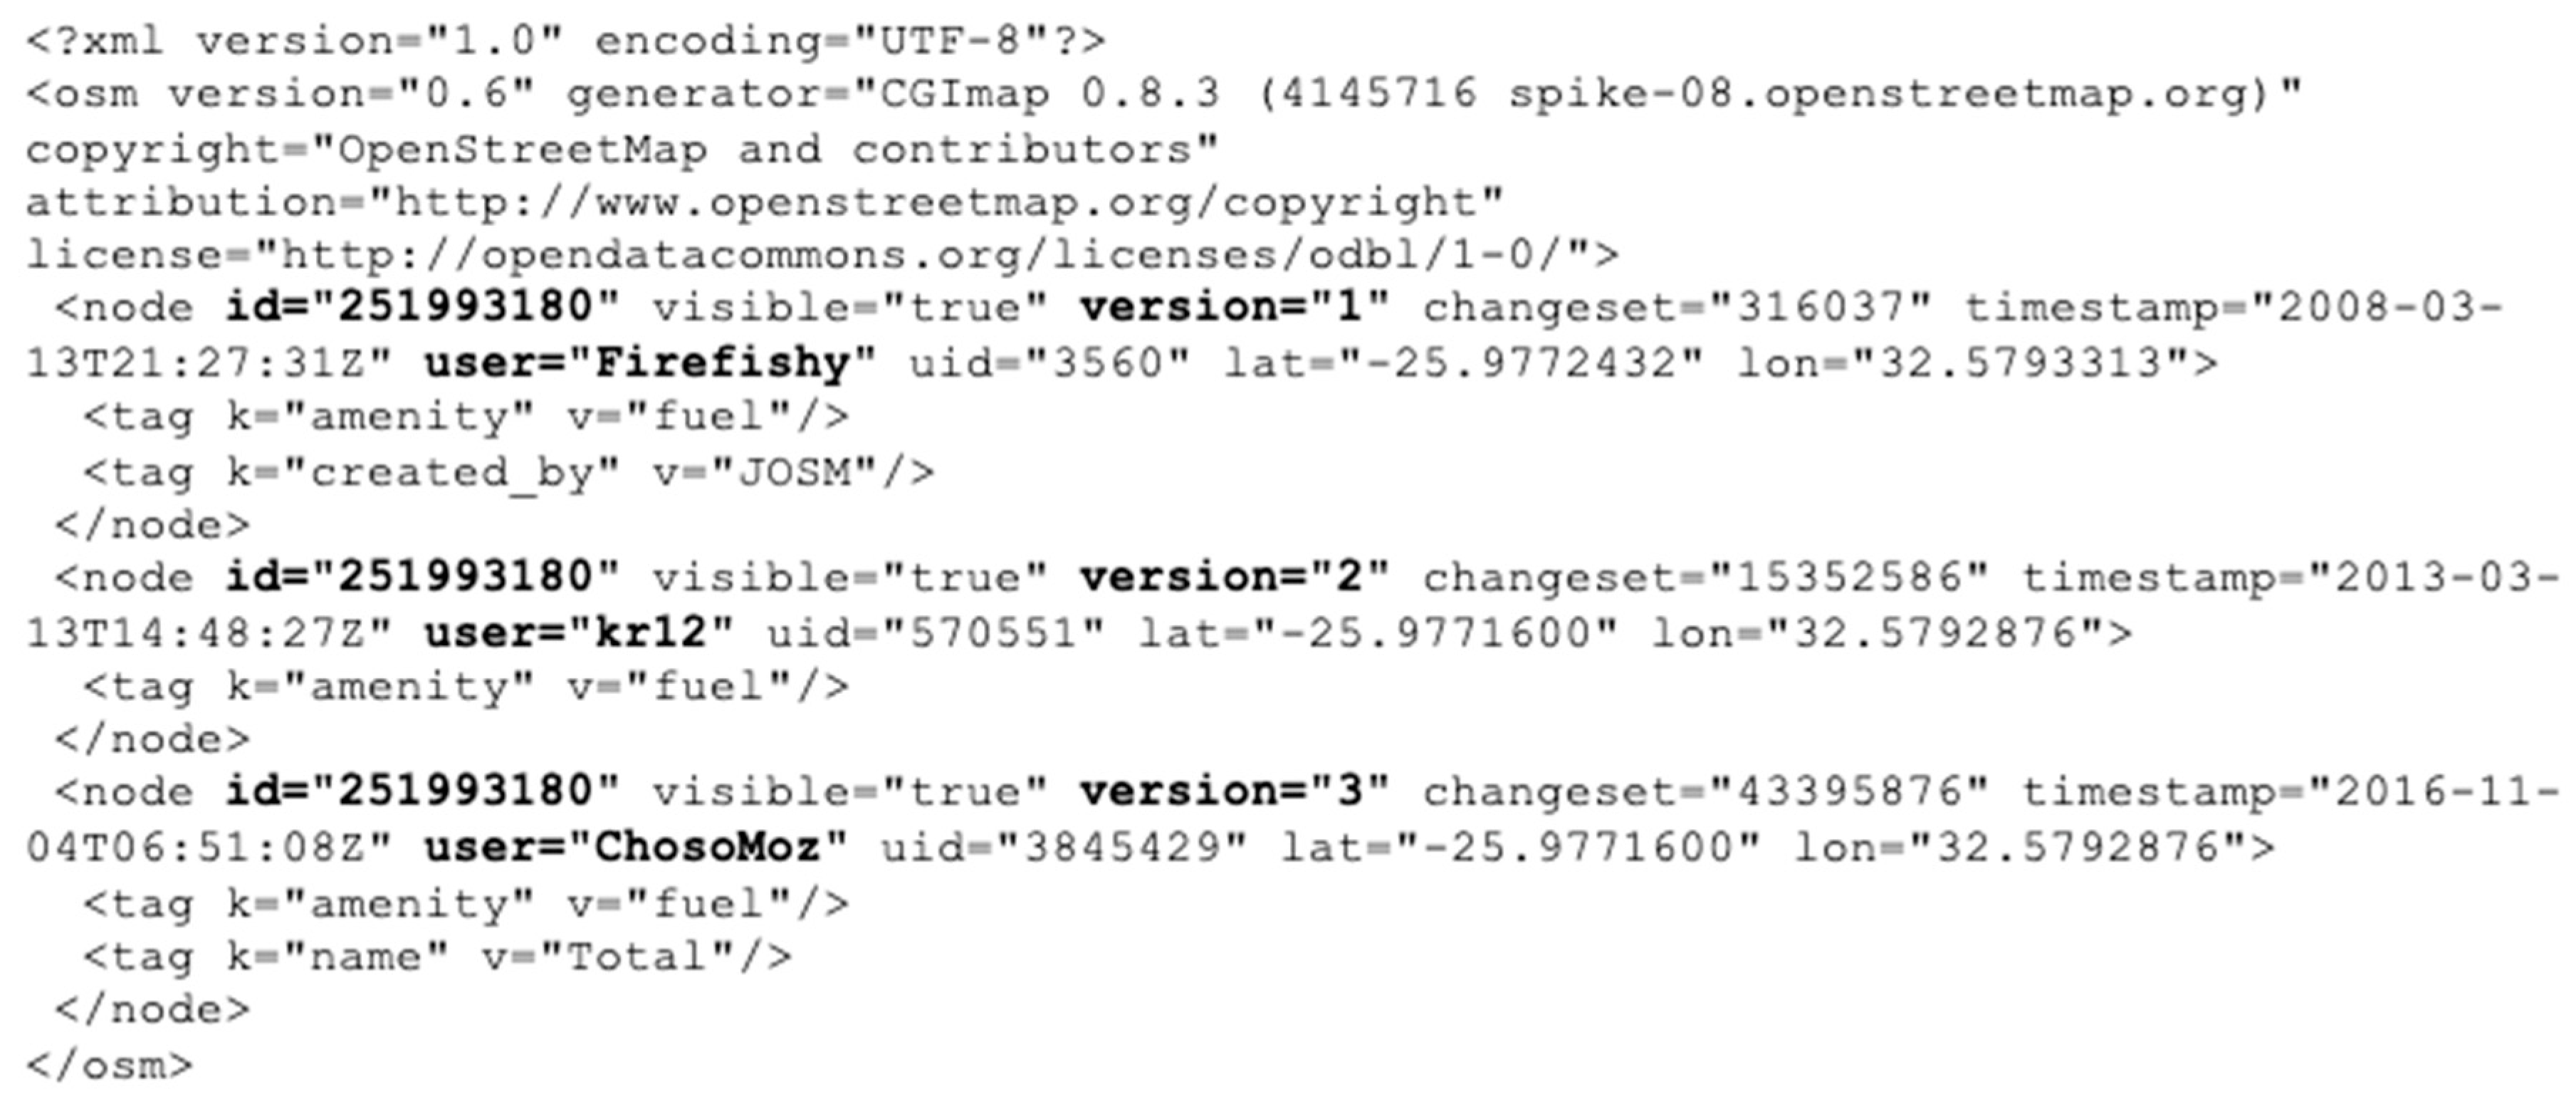
In OSM, geographic features are represented as nodes, ways and relations. For each feature, a set of attributes is stored: id (unique identifier), uid (last user to modify the feature), user (display name of uid), timestamp (time of last modification), visible (false means the feature is deleted), version (edit version of the object, initialized to 1 when the feature is created), and changeset (number of the changeset in which the feature was created or updated). Any edit to the feature results in an increment in the feature’s version number. A changeset consists of a set of changes made by a single user over a short period of time [45]. Figure 2 provides an example of three records for the same node (id = 251993180) in the OSM history file. A total of three contributors (Firefishy, kr12 and ChosoMoz) edited the feature in 2008, 2013 and 2016, respectively, each as part of a different changeset.
We followed the framework developed by Rehrl and Gröchenig [40] for transforming OSM history data into user- and feature-centred actions that can be analysed for various research goals (e.g., change detection, contribution profiling, etc.) [40,46]. It describes how database changes (i.e., changes performed on OSM features) can be aggregated to construct information about how volunteers contributed (user-centred) and how features were impacted by these contributions (feature-centred). Aggregation is based on CRUD (create, read, update and delete): the changes (i.e., creating, updating and deleting features) performed on OSM features by contributors provide information about the editing actions of contributors.
We prepared three sets of attributes for analysing contributions. Firstly, contribution lifespan was determined from the first and last timestamp among all the feature edits by a specific contributor (user) in the Mozambique data. The lifespan reveals how long a user has been contributing to OSM. Users with a longer lifespan are likely to be more familiar and experienced with OSM contributions.
Secondly, information to provide insight into a user’s contribution intensity was prepared: the number of changesets (quantity) a contributor has worked on, the average contribution time spent on editing map features (based on the first and last timestamp associated with a changeset) and the number of mapping days (derived from the timestamp attributes of features edited by a specific user). Note that the changeset timestamps and, therefore, the value for time spent on editing map features, depends on the application used for contributing data. These attributes describe how active or involved someone is in OSM contributions.
Thirdly, the contribution actions of each contributor were determined based on the specific feature editing quantities (for nodes, ways and relations, respectively) and the feature editing preferences, i.e., the types of edits (creating, modifying or deleting features). These attributes describe how someone contributes to OSM, e.g., one can distinguish between a contributor who added a few points of interest (nodes) and a contributor who repeatedly edited ways and relations to improve the quality of a road network in an area.
Table 2, Table 3 and Table 4 show the 29 attributes prepared from the Mozambique history data, describing the contribution lifespan, contribution intensity and contributor actions of user 32,744, one of the most active users. For example, user 32,744 prefers to work mostly on nodes and tends to modify existing features more than creating new ones. The user has worked on 319 changesets with an average contribution time of approximately 18 min per changeset (as noted above, contribution times vary depending on the application used to make contributions). The user has contributed data in Mozambique for more than a decade on 176 mapping days. In total, 132,390 contributions were made.

3.2. Step 2: Classification of Contributors

In this step, contributors were clustered based on their contribution lifespan, contribution intensity and contributor actions.
Cluster analysis is an unsupervised machine learning technique for finding structure or revealing patterns in large, unexplored datasets [47,48]. It is frequently used for customer segmentation, i.e., to group customers based on the similarity of their purchasing habits and demographic characteristics [49]. ‘Unsupervised learning’ refers to the fact that the algorithm works with unlabelled data (no predefined groupings) and attempts to ‘learn’ some sort of structure from the input data. This knowledge is used to partition the data into clusters or groups. The k-means clustering algorithm is one of the most favoured and efficient clustering algorithms [47,50,51]. It groups a set of observations into k clusters, each with similar attributes, thereby measuring the similarity between observations and segmenting them based on similarities [47,50,52].
In this study, k-means clustering was used to group contributors based on their contribution lifespan, intensity and actions in the Mozambique area. The next three paragraphs explain how feature scaling, principal component analysis and the elbow method were used as part of the k-means clustering.
Feature scaling is the process of normalizing ranges of data values to the same scale [48,53]. This has to be done before implementing a distance-based machine learning algorithm, such as k-means clustering, which is affected by scale [53]. Feature scaling is also required before principal component analysis can be done.
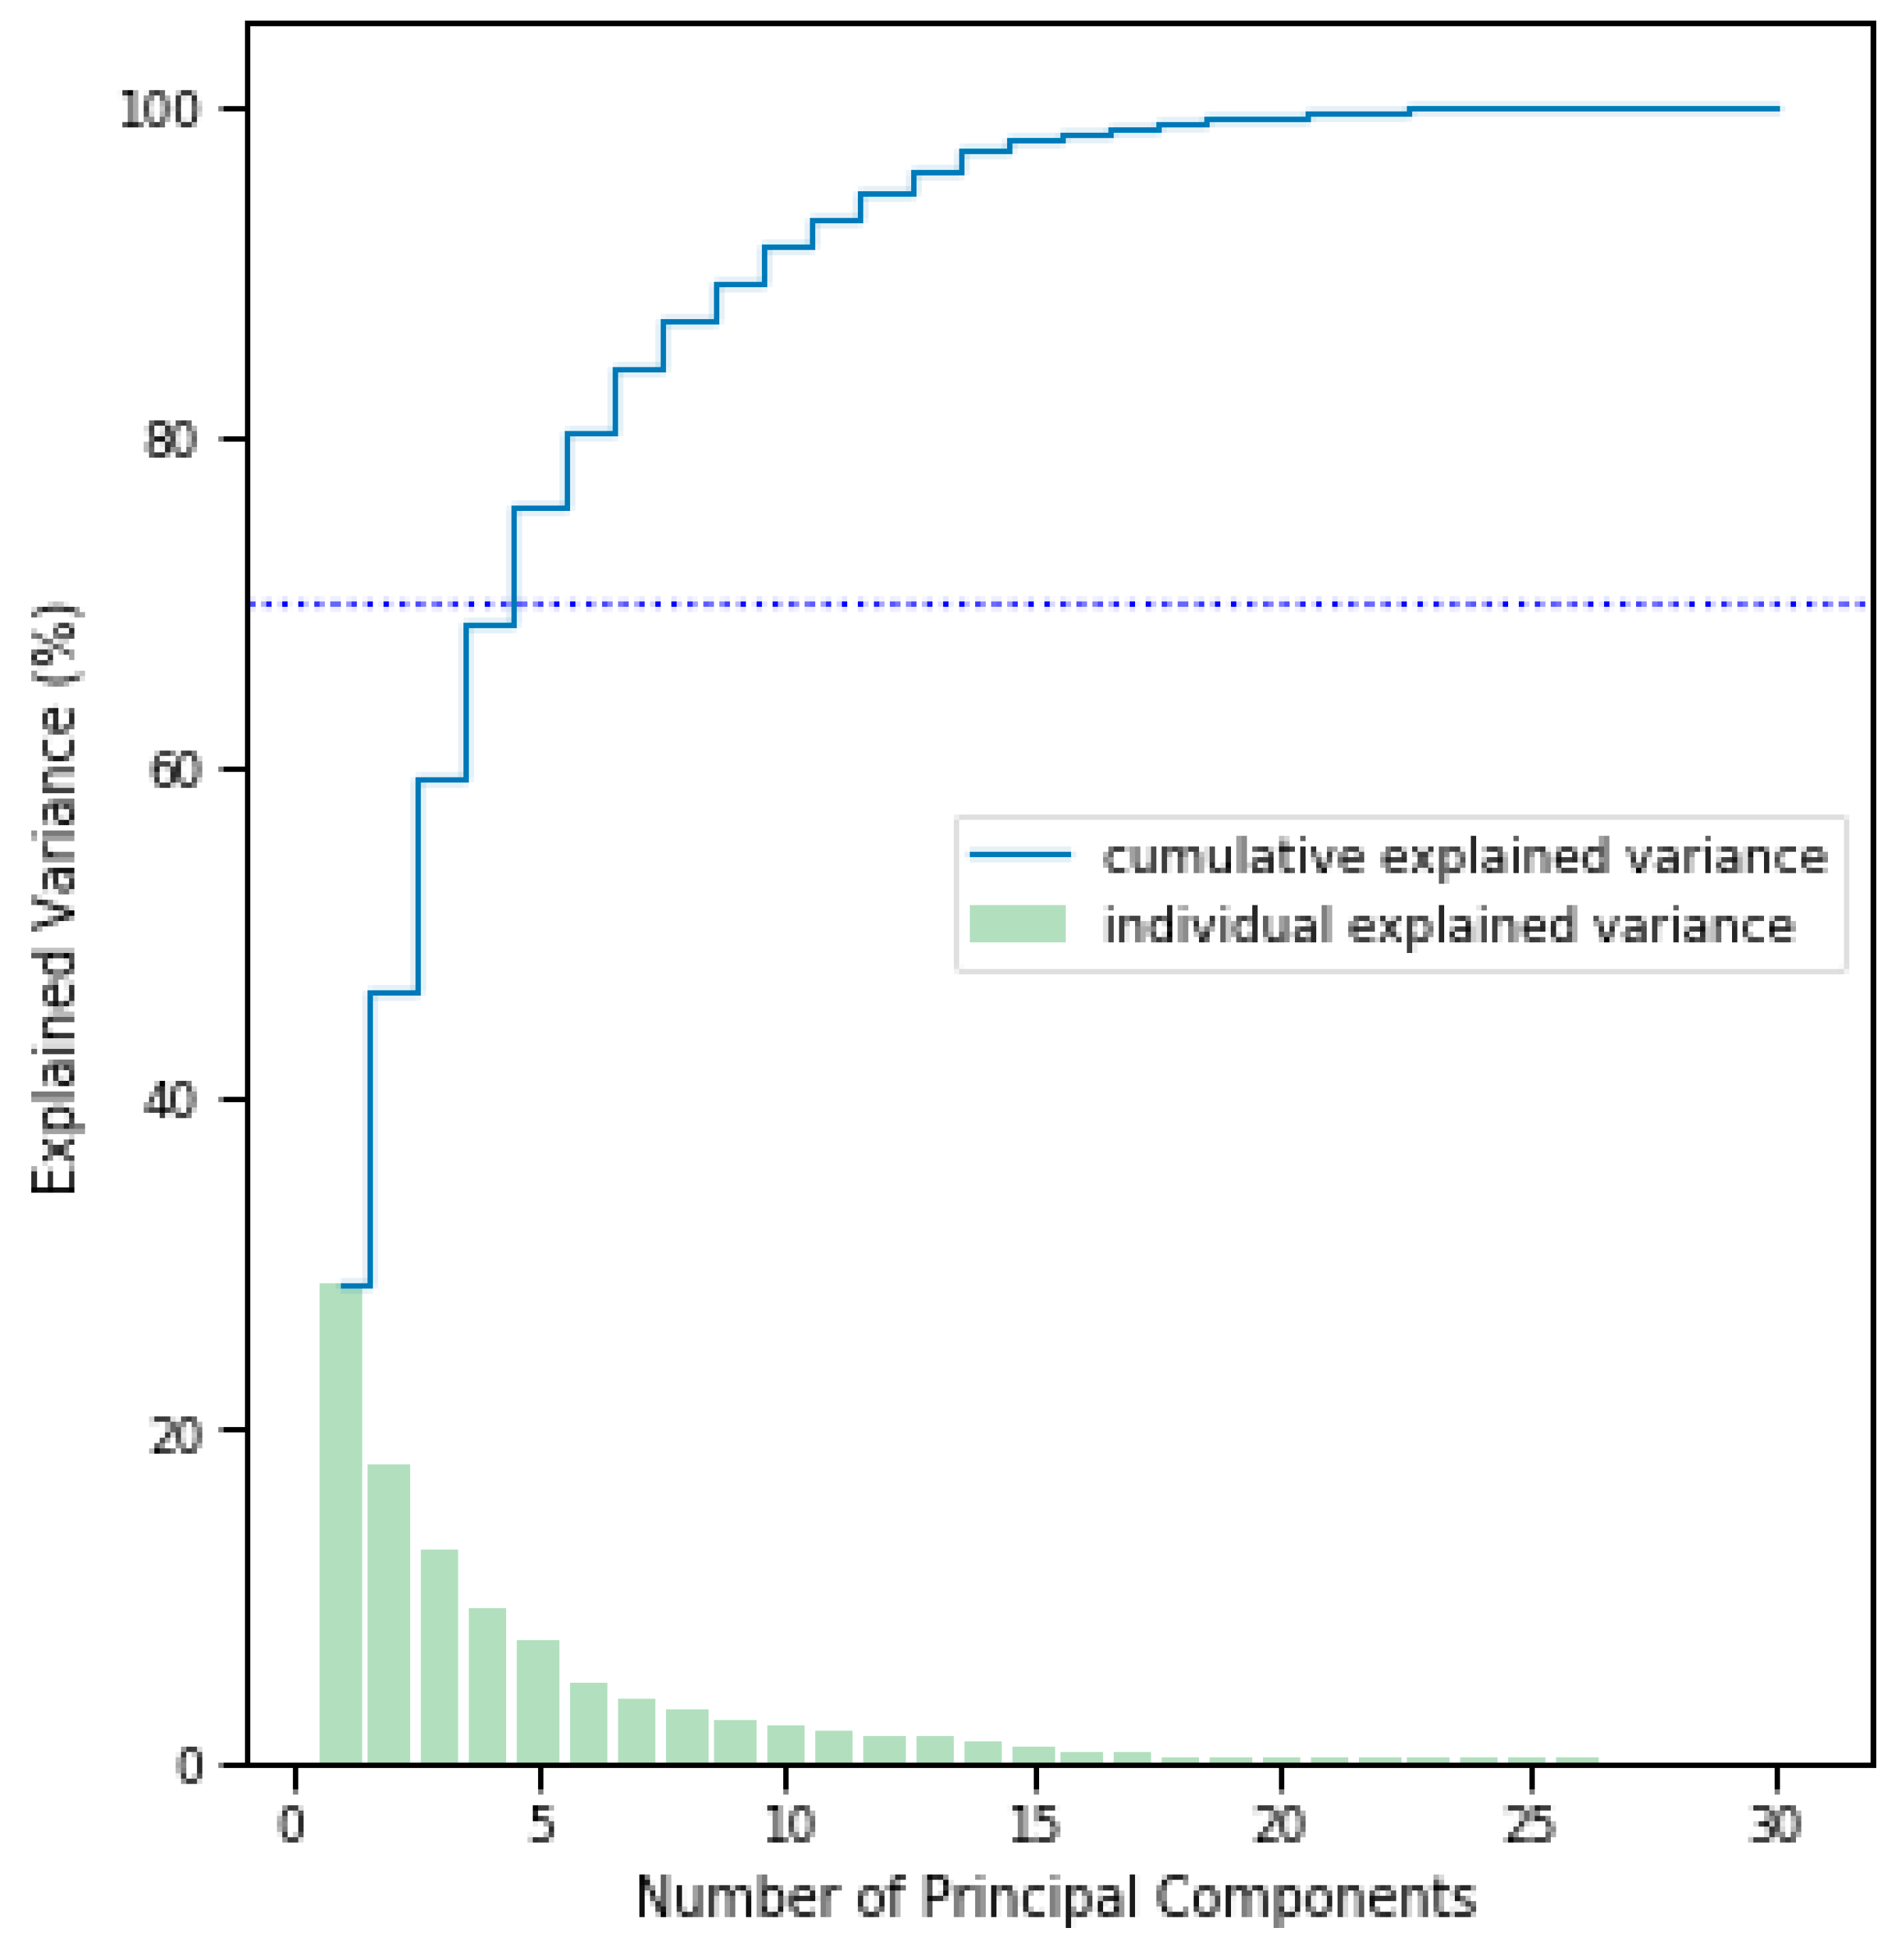
Clustering algorithms tend to struggle with high dimensional data, i.e., data described by many attributes [54,55,56], because it increases computation time; the task of clustering becomes complex so that it is difficult to visualize and interpret clusters; data properties are not preserved because one cannot clearly differentiate between similar and dissimilar objects. To overcome these challenges, a dimensionality reduction technique, which describes the data in fewer attributes, was applied in our study prior to clustering [50,54,55,57].
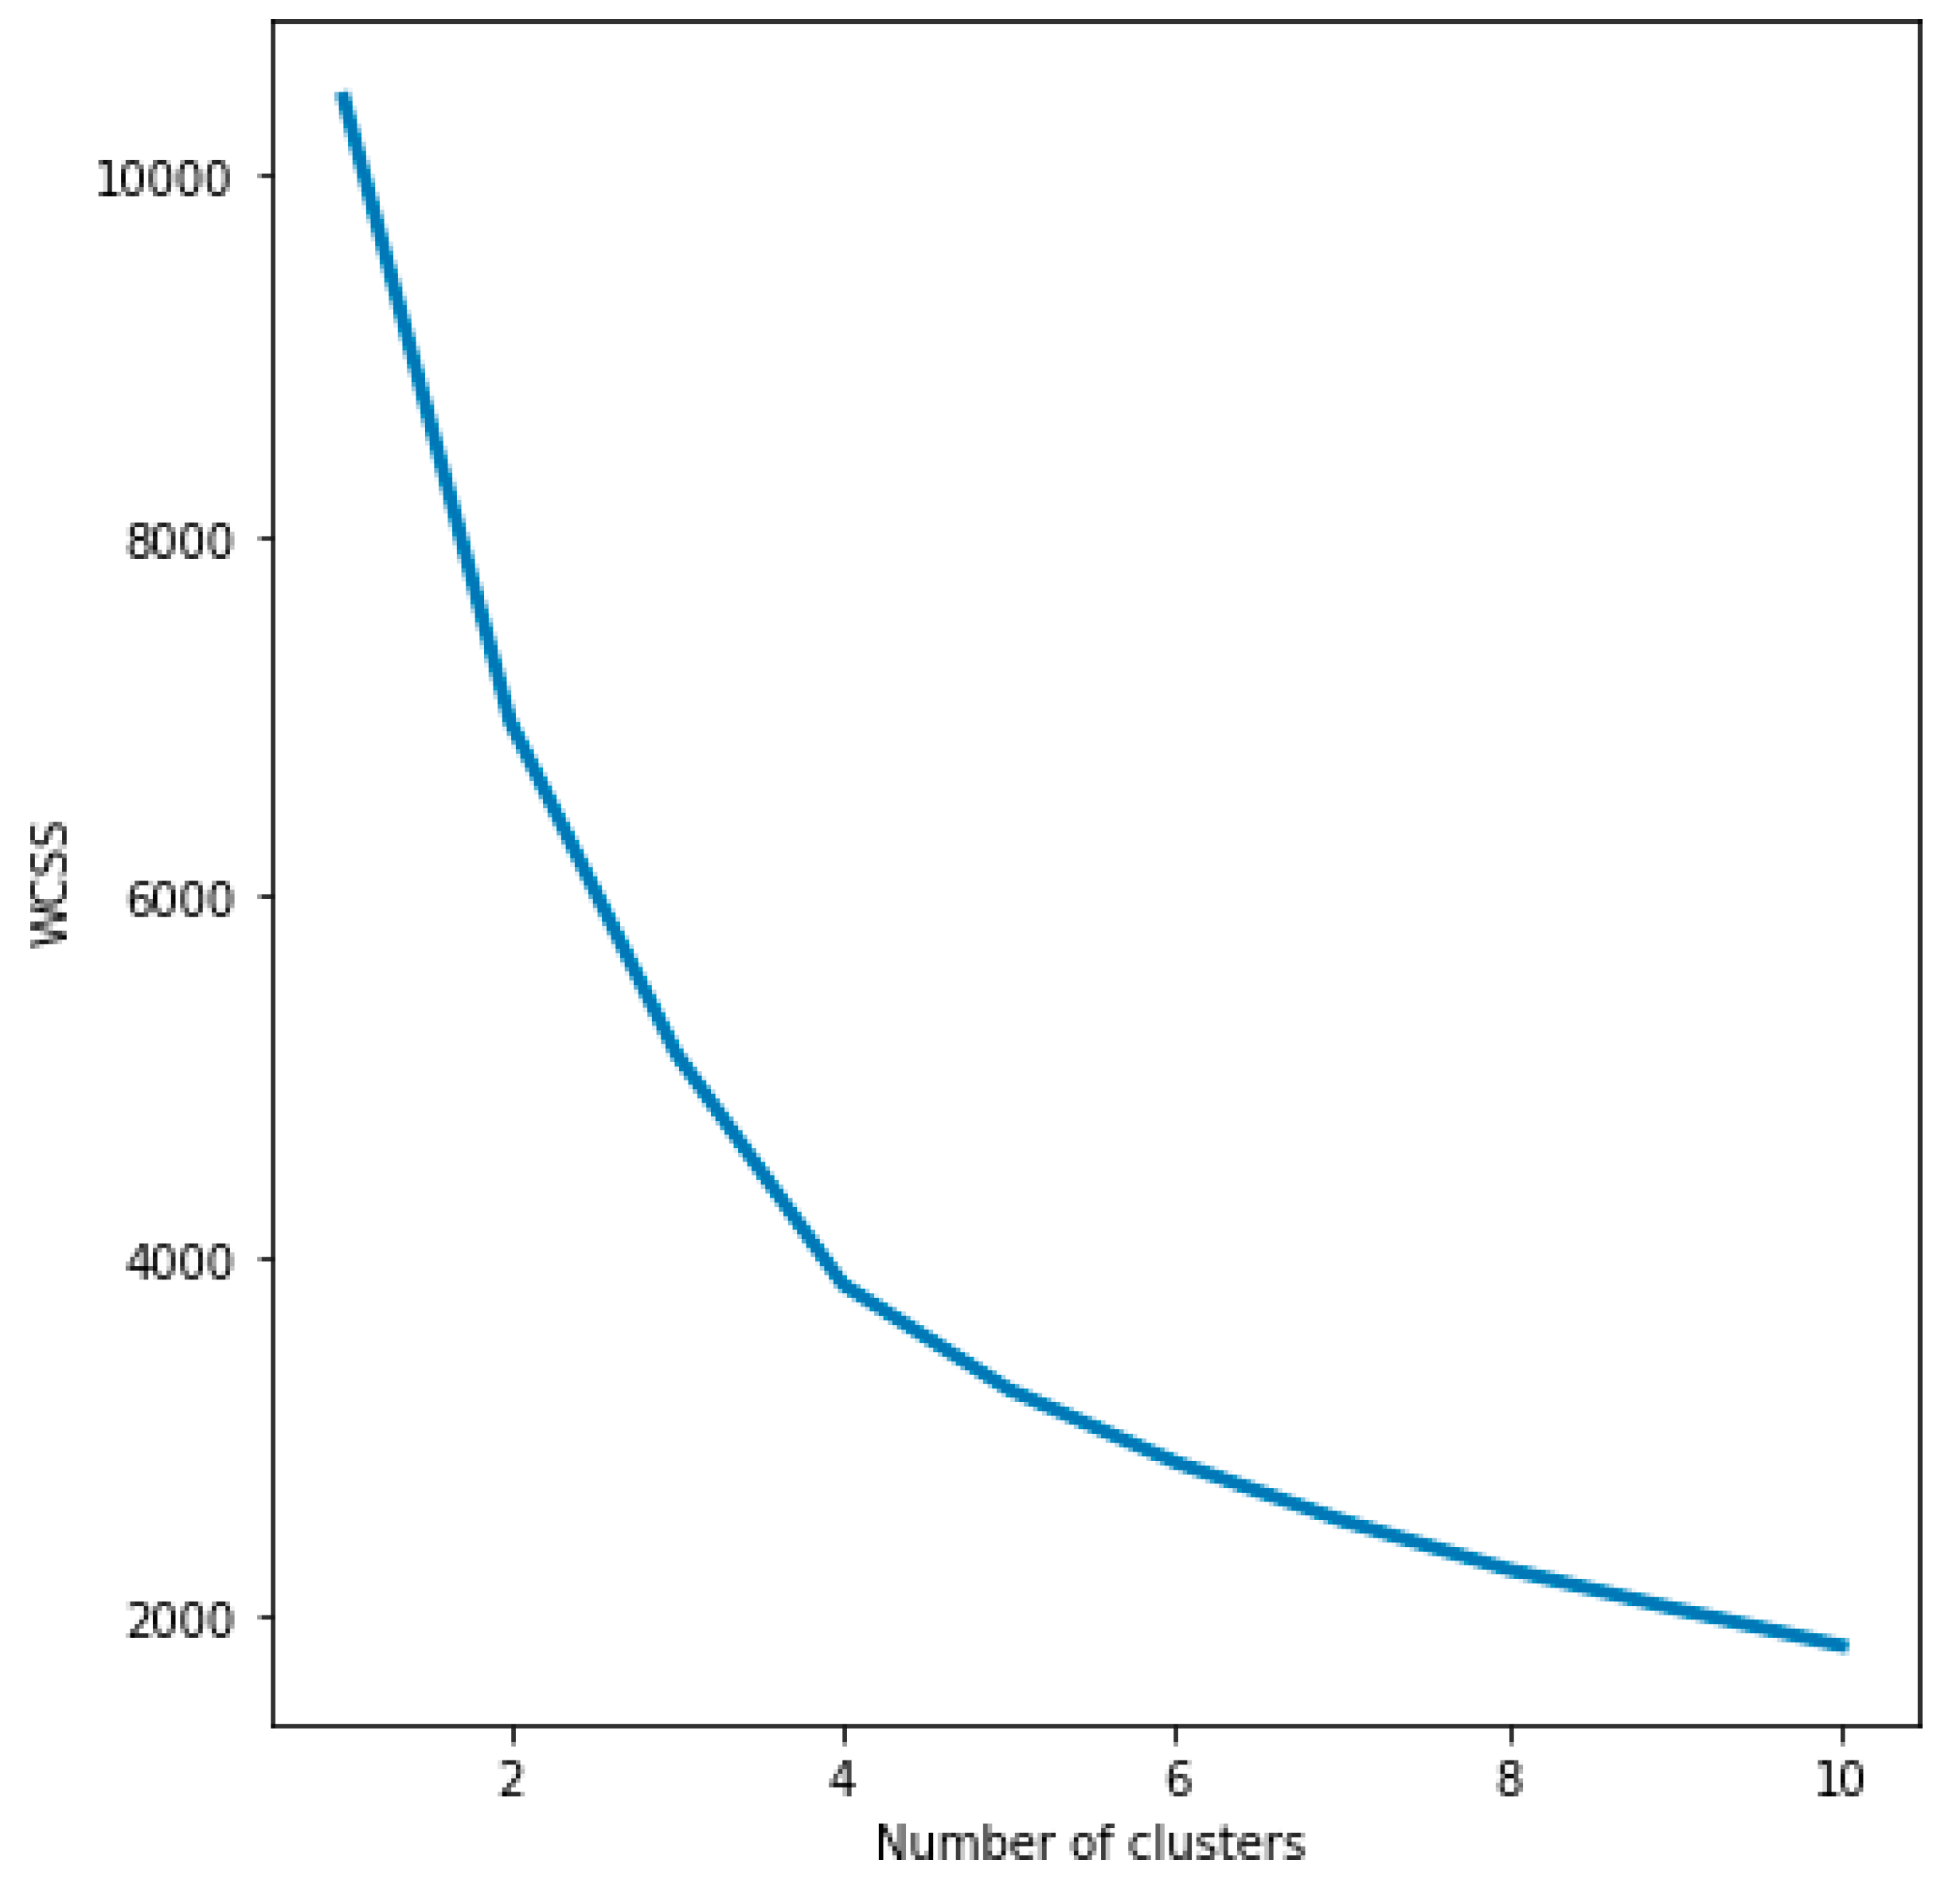
Selecting a suitable number of clusters for k-means clustering can be challenging [55]. There are different ways of doing this and the researcher has to decide on a method [57]. We decided to use the elbow method, one of the most widely adopted methods for determining an optimal number of clusters for k-means clustering. It uses the within-cluster sum of squares or WCSS (i.e., the distance between points in a cluster) to determine an optimal number of clusters for a dataset. To achieve an optimal clustering solution, the WCSS needs to be minimized. The WCSS tends to decrease as the number of clusters increases, however, the goal is not to have each data point in a separate cluster, i.e., where the number of clusters is equal to the number of observations, meaning WCSS = 0. The elbow method aims to find some sort of compromise (or middle ground), where WCSS is low enough but the number of clusters is also not too large. This value of WCSS is referred to as the “elbow” point: after the elbow point, the WCSS no longer decreases by a substantial amount as the number of clusters increases. That is, after the elbow point, a significantly better solution for WCSS would not be reached by increasing the number of clusters. By this logic, the optimal number of clusters lies at the elbow point [58,59].

4. Results

4.1. Clustering

Results of the principal component analysis of the 29 attributes (normalized to values between 0 and 1) showed that the first six principal components explained 80.4% of the total variation in the data. See Figure 3.
Next, we analysed how each of the 29 attributes contribute to the first three principal components. The heatmap in Figure 4 shows the attribute loadings for each of the three principal components. A loading, either positive or negative, shows how strongly an attribute is associated with a specific principal component. This helps with determining what each principal component represents, as illustrated in Table 5. Principal component 1 represents inactivity (negative loadings on attributes representing contribution intensity and actions), while principal component 2 represents activity and advanced editing (positive loadings on attributes representing contribution intensity and advanced actions) and principal component 3 is somewhere between the two.
These three principal components (or dimensions) are used in the final solution to describe each contributor. An example for user 32,744 is provided in Table 6, showing that principal component 2 describes this user best.
Following the elbow method, we calculated the WCSS for each possible value of k (clusters) and plotted the results (see Figure 5). The optimal number of clusters (i.e., k = 4) was selected through trial and error. The elbow point was most visible when working with a solution of three principal components.
Next, k-means clustering was used to group contributors (n = 10,237) into four clusters, see Table 7. Following an assessment of solutions for three, four, five and six principal components to examine how each performed during the clustering phase, a solution for three principal components was selected. This was done through visualising and examining the cluster solutions. The first three principal components provide a significant amount of information that aids in differentiating between clusters (see Figure 6 below). However, the rest of the principal components (principal components 4, 5 and 6) do not contribute much information for further differentiation between clusters, as illustrated in Figure 7. Thus, only principal components 1, 2 and 3 were included in the final cluster analysis.
In order to better understand the clusters produced, some descriptive statistics were calculated (see Table 8), revealing that cluster 3 has the highest averages for all three values, while cluster 1 has the lowest averages for the number of changesets and contributions. These results show that cluster 3 is the simplest to characterise, as it has significantly different (and higher) averages than the other clusters. For clusters 0, 1 and 2, the averages do not differ significantly, and interpretation of these clusters required additional visual inspection of the clusters (i.e., the contributors of each cluster) in order to better understand their principal component loadings and characteristics.

4.2. Description of the Four Clusters

Cluster 0 (n = 2676) mostly consists of contributors with older contributions who have not continued to contribute data in Mozambique over time. These contributors have a low number of mapping days and total contributions, and a large number of their contributions have been modified by others, i.e., most of the time they do not return to their contributions. They are associated with only a small number of features where they were the last user to modify the feature. This indicates contributors who have not maintained an interest in contributing and have not continued to make contributions. This cluster represents non-returning contributors in the Mozambique area.
Cluster 1 (n = 1301) consists of contributors who have not been very productive in Mozambique during their respective lifespans. Most of these contributors have worked on a small number of changesets and their total contributions are low. Even the contributors in this cluster who have a higher number of mapping days do not have a higher number of total contributions. The contributors in this cluster appear to be the least productive, supported by the average and median values for changeset quantity and total contributions in Table 8, which are even lower than those of the non-returning users. This cluster represents the least-productive contributors in Mozambique.
Cluster 2 (n = 3708) consists of contributors who have been active recently in the Mozambique area. They do not have a large number of mapping days but have a large number of nodes and ways where they are the latest contributor (although only second highest compared to contributors in cluster 3). A significant number of the contributors in this cluster are new to Mozambique. Contributors in this cluster are also associated with a larger number of total contributions, particularly for nodes and ways. The average and median values for changeset quantity and total contributions for this cluster (in Table 8) show that they are the second-most active contributors. This cluster represents the new contributors in the Mozambique area.
Cluster 3 (n = 2552) consists of the most active contributors in the Mozambique area. The strongest loading for this cluster is a negative principal component 1 value, indicating that contributors in this cluster have worked on a large number of changesets, and are associated with high numbers of total contributions, node contributions, way contributions and ways and nodes where they were the last user to modify. The notion that cluster 3 consists of experienced contributors is confirmed by the positive principal component 2 value, suggesting contributors who have been active in the Mozambique area for a significant amount of time and have maintained an interest in contributing data. Contributors from this cluster are associated with a large number of mapping days and have done a significant amount of work on relation features. They also tend to make a lot of modifications. The average and median values for changeset quantity and total contributions for this cluster confirm that among those who contributed in Mozambique, cluster 3 users have contributed the most. This cluster represents active contributors in the Mozambique area.

5. Discussion

Senaratne et al. [60] proposed the use of machine learning techniques for intrinsic data-focused quality assessment, e.g., cluster analysis to assess the thematic accuracy of volunteered geographic information. Kaur and Singh [61] describe a solution for intrinsic detection and correction of OSM data errors that is based on supervised machine learning. Similar to our study, Jacobs and Mitchell [33] applied the k-means clustering algorithm, an unsupervised machine learning technique, for classifying OSM contributors.
The patterns witnessed through clustering contributors in Mozambique show that most of the work (93%) is done by a small percentage (25%) of active contributors in cluster 3. These results are consistent with similar OSM contributor studies in other countries, e.g., in Canada [4] and the United Kingdom [35]. They display the “participation inequality” pattern that is often witnessed in online peer production systems, not only for OSM [5,14,15], but also for others, such as Wikipedia [62]. The active contributors in other studies tend to account for a much smaller portion of the total contributors (around 10 to 15%) [5,15], compared to the 25% in our study. Cluster 2 contributed 5%, while clusters 0 and 1 have virtually no impact (2%) on contributions.
Disasters tend to attract large numbers of new contributors who produce large amounts of data in a short amount of time and assist to satisfy informational needs of disaster relief services [14,23]. The contributions in clusters 2 and 3 are likely to have been influenced by the disaster mapping efforts following cyclones Idai and Kenneth. High numbers of contributions were observed mostly during the disaster activation mapping period in early 2019. Some contributors managed to produce thousands of contributions in a short span of time. The same is true for the contributors in cluster 2, the newcomers. This confirms what others have found; namely, that disaster events influence contribution patterns [14].
However, it is important to note that not every contributor that is categorized as a new contributor in this study is new to OSM; some contributors could just be new to contributing in the Mozambique area, since this study is limited to Mozambique. Their contribution characteristics in other parts of the world could be very different, and future work could determine whether there are significant differences in contribution behaviour inside vs outside Mozambique.
Understanding the behaviour of a small group of active contributors makes it possible to characterize the quality of an entire dataset [4]. Since most of the data in Mozambique originates from active contributors in cluster 3, who have on average worked on 90 changesets, confidence in the quality of the data is strengthened. Moreover, the small number of active contributors in cluster 3 tend to make a lot of modifications and are often the last user to edit a feature. This could be an indication of their desire to improve the quality of the data.
The majority of buildings (99.6%) and ways (84%) in Mozambique have been edited twice at most. This may reflect that any data contributed through projects in the HOT task manager is generally subjected to a validation process by experienced mappers. Most of the buildings appeared in areas for which mapathons were conducted, outside larger cities. Interestingly, Li et al. [9] also analysed OSM data for Mozambique following the cyclones. They identified 13 built-up areas that were not yet included in OSM, suggesting that more mapping is required to improve completeness of the Mozambique data.
Almost all the contributors in the first three clusters had between one and three total mapping days. Contributors with only one mapping day make up the majority of these clusters (70% or more in each cluster). In contrast, only 22% of contributors in cluster 3 have only one mapping day. The contributors in cluster 3 with one mapping day could represent data imports, as they are associated with a significantly high number of changesets and contributions in a short span of time. This type of contribution needs to be approved (the process is described here [63]); therefore, these kinds of contributions need further investigation. The nature of changesets and the set-up of a contributor’s application could affect how they submit changesets and, thus, the timestamps in the history file. Therefore, relying solely on time related metrics can skew the results, especially when focusing on a specific day or a short period of time. However, our analysis covered more than a decade of contributions (2006 to 2019); therefore, the uncertainty about changeset timestamps has a small effect on the results.
Some of the clusters revealed in this study align with categories that have been described in other studies, e.g., cluster 0 (non-recurring contributors) is comparable to the Non-recurring Mappers in Neis and Zipf [15] and cluster 3 (active contributors) has similarities with the Power Mapper/Validator in Jacobs and Mitchell [33]. Unproductive contributors (cluster 1) are identified in various studies (e.g., [4,5,14]). Our results reveal a new category, namely, the newcomer contributors (cluster 2) who were most likely attracted to mapping in Mozambique by the HOT mapping projects. Understanding contributor behaviour in one geographic area can be used to assess data created by those contributors in another region [4]. Analysing the characteristics of these Mozambique-newcomers in their ‘home’ regions could provide further insight into the quality of OSM data in Mozambique.
On average, the active contributors (cluster 3) in our study mapped in Mozambique for nine days on 90 changesets. Compared to OSM contributors generally, this is rather low. The OSM Foundation defines active contributors as those who edit on 42 days over a period of 365 days. To become an intermediate mapper in the OSM Tasking Manager, one should have worked on 250 changesets. It would be interesting to know how active Mozambique contributors are in other parts of OSM. This could provide further insight into the quality of their Mozambique contributions.
One could further characterise the individual contributors in cluster 3 based on descriptive statistics, e.g., for lifespan, mapping days and contributions. This would further refine the understanding of who contributed what, when and how in Mozambique. Analysing the contribution characteristics of cluster 3 users in the whole of OSM would also help to improve the understanding of OSM quality in Mozambique.
Determining a suitable cluster solution can be a challenging task. The final cluster solution can be affected by several factors, including the data pre-processing techniques chosen (e.g., dimensionality reduction, normalization), the number of clusters selected, the method used to determine the number of clusters and the spread of the data. One would have to repeat this study with different pre-processing techniques, a different method for choosing the number of clusters and a different number of clusters to assess whether this would lead to differently characterized clusters. A limitation of our study is that we only used k-means clustering. A visual inspection of the four clusters shows that not all the clusters are spherical around the centroid. Other clustering algorithms should be explored to establish whether they are more suitable.
In this study, individual contributors were clustered; however, the nature of contributions depends on the types of features in an area and changes over time as the map matures [14]. It would, therefore, be interesting to cluster changesets to understand contribution behaviour across different changesets. The study by Budhathoki and Haythornwaite [5] is one of few that involves contributor input through a questionnaire; most contributor-focused intrinsic assessments are based on history data only. Combining questionnaires with an analysis of OSM history data could help to explain the results of contributor-focused intrinsic assessments and could guide the development of more reliable contributor-focused intrinsic assessment metrics. Another avenue of future work would be to analyse the spatial collective intelligence [64] of contributors in Mozambique.

6. Conclusions

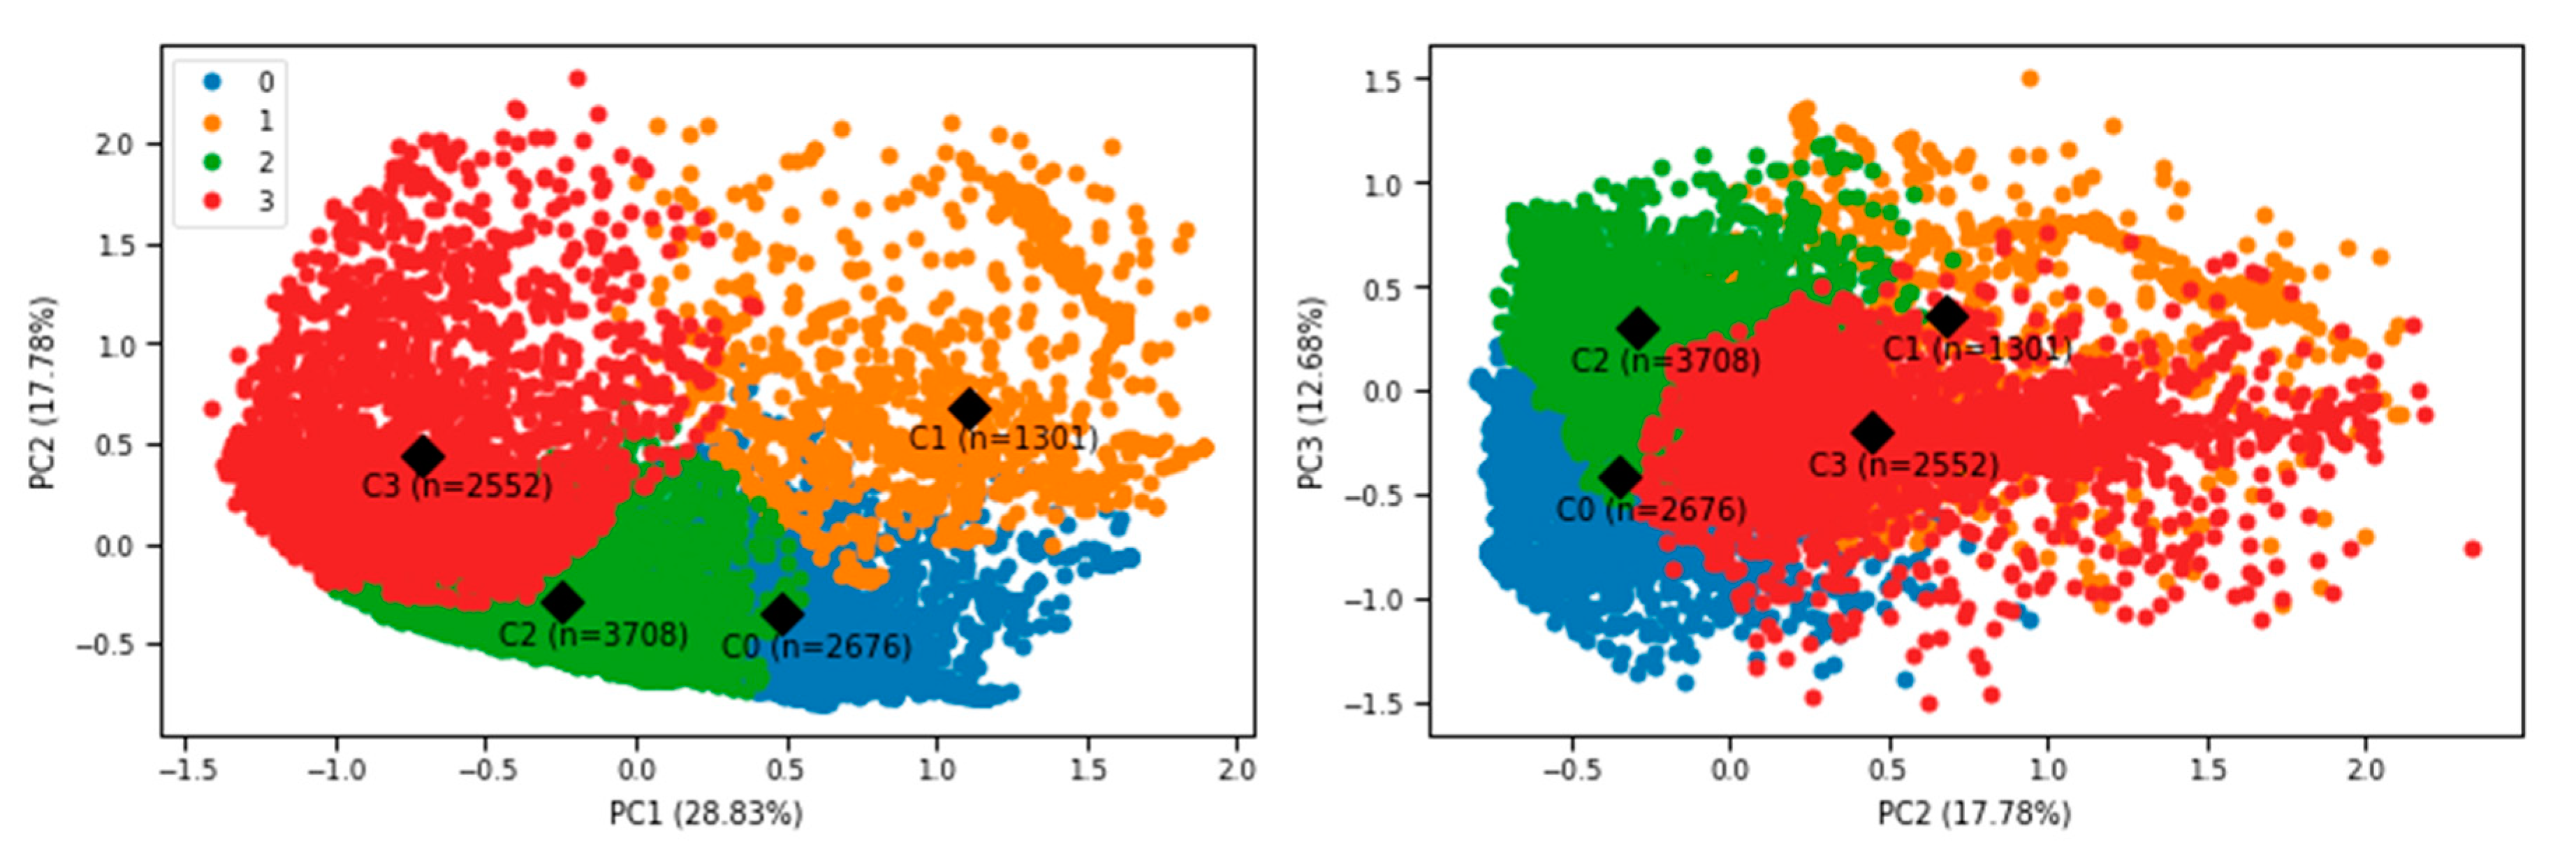
In this study, we applied unsupervised machine learning to get a better understanding of who contributed when and how to OSM data in Mozambique. The results of the k-means cluster analysis revealed four distinct classes of contributors: active contributors (n = 2552); older non-returning contributors (2676); least productive contributors (n = 1301); new contributors (n = 3708). This is the first segmentation of OSM contributors for an African country using unsupervised machine learning.
Similar to the results of other OSM contribution analyses, most of the data generated in Mozambique (93%) was contributed by a small group of active contributors (25%). Studies have suggested that such active contributors are more likely to be experienced and knowledgeable about the project and are, therefore, more likely to produce data that is of good quality [16,23]. Compared to other contributor classifications, our cluster analysis revealed a new kind of contributor class, namely, the new contributors. Active and new contributors were most likely attracted by HOT mapping events during the cyclone-related disaster relief operations in Mozambique in 2019.
Even though no absolute statements can be made about the quality of the Mozambique OSM data, the results of our contributor-focused intrinsic quality assessment strengthen confidence in the quality of the data because it is mostly contributed by experienced users who seem to have a desire to improve the quality of the data. Most features in Mozambique were edited at least twice, suggesting that they have been quality checked at least once. Initiatives to improve the quality of OSM data in Mozambique should prioritize data edited only once and contributed by those classified into clusters 0, 1 and 2.
More studies in different parts of Africa would contribute to understanding whether the patterns observed in Mozambique are unique or also found in other parts of the African continent and/or in developing countries in other parts of the world. One could also analyse contribution inequality between different (African) developing countries, similar to Yang et al. [65], who found that the level of contribution inequality increases in countries without huge imports.
The results of this study show how one can gain a better understanding of the community that contributes data in a specific area by inspecting history data with machine learning techniques, and we have provided some suggestions for further work. Intrinsic methods should not replace ground truthing or extrinsic methods, but rather complement them by providing alternative ways to gain insight about data quality. Results of intrinsic quality assessments can also be used to inform efforts to further improve the quality.

Author Contributions

Conceptualization, Aphiwe Madubedube, Serena Coetzee and Victoria Rautenbach; formal analysis, Aphiwe Madubedube; methodology, Aphiwe Madubedube, Serena Coetzee and Victoria Rautenbach; supervision, Serena Coetzee and Victoria Rautenbach; writing—original draft, Aphiwe Madubedube; writing—review and editing, Aphiwe Madubedube, Serena Coetzee and Victoria Rautenbach. All authors have read and agreed to the published version of the manuscript.

Funding

This research received no external funding.

Acknowledgments

The authors would like to acknowledge Vreda Pieterse who provided input into the research design.

Conflicts of Interest

The authors declare no conflict of interest.

References

  1. Cooper, A.K.; Coetzee, S.; Kourie, D.G. Volunteered geographical information, crowdsourcing, citizen science and neogeography are not the same. In Proceedings of the 28th International Cartographic Conference ICC2017, Washington, DC, USA, 2–7 July 2017. [Google Scholar] [CrossRef] [Green Version]
  2. Ramm, F.; Topf, J. OpenStreetMap: Using and Enhancing the Free Map of the World, 1st ed.; UIT Cambridge: Cambridge, UK, 2010; ISBN 978-1-90686-011-0. [Google Scholar]
  3. OpenStreetMap Wiki Contributors. Stats. 2021. Available online: https://wiki.openstreetmap.org/wiki/Stats (accessed on 17 January 2021).
  4. Bégin, D.; Devillers, R.; Roche, S. Assessing volunteered geographic information (VGI) quality based on contributors’ mapping behaviours. In Proceedings of the International Archives of the Photogrammetry, Remote Sensing and Spatial Information Sciences, XL-2/W1, 8th International Symposium on Spatial Data Quality, Hong Kong, China, 30 May–1 June 2013; pp. 149–154. [Google Scholar] [CrossRef] [Green Version]
  5. Budhathoki, N.R.; Haythornthwaite, C. Motivation for open collaboration: Crowd and community models and the case of OpenStreetMap. Am. Behav. Sci. 2013, 57, 548–575. [Google Scholar] [CrossRef]
  6. Ciepłuch, B.; Mooney, P.; Winstanley, A.C. Building Generic Quality Indicators for OpenStreetMap. In Proceedings of the 19th Annual GIS Research UK (GISRUK), Portsmouth, UK, 27–29 April 2011. [Google Scholar]
  7. Mooney, P.; Corcoran, P.; Winstanley, A.C. Towards quality metrics for OpenStreetMap. In Proceedings of the 18th SIGSPATIAL International Conference on Advances in Geographic Information Systems, San Jose, CA, USA, 2–5 November 2010; pp. 514–517. [Google Scholar]
  8. Vandecasteele, A.; Devillers, R. Improving volunteered geographic data quality using semantic similarity measurements. In Proceedings of the International Archives of the Photogrammetry, Remote Sensing and Spatial Information Sciences, XL-2/W1, 8th International Symposium on Spatial Data Quality, Hong Kong, China, 30 May–1 June 2013; pp. 143–148. [Google Scholar] [CrossRef] [Green Version]
  9. Coetzee, S.; Rautenbach, V.; Green, C.; Gama, K.; Fourie, N.; Goncalves, B.; Sastry, N. Using and Improving Mapathon Data Through Hackathons. In Proceedings of the International Archives of the Photogrammetry, Remote Sensing and Spatial Information Sciences, XLII-2/W13, ISPRS Geospatial Week 2019, Enschede, The Netherlands, 10–14 June 2019; pp. 1525–1529. [Google Scholar] [CrossRef] [Green Version]
  10. Li, H.; Herfort, B.; Huang, W.; Zia, M.; Zipf, A. Exploration of OpenStreetMap missing built-up areas using twitter hierarchical clustering and deep learning in Mozambique. ISPRS J. Photogramm. Remote Sens. 2020, 166, 41–51. [Google Scholar] [CrossRef]
  11. Minghini, M.; Brovelli, M.A.; Frassinelli, F. An open source approach for the intrinsic assessment of the temporal accuracy, up-to-dateness and lineage of OpenStreetMap. In Proceedings of the International Archives of the Photogrammetry, Remote Sensing & Spatial Information Sciences, XLII-4/W8, FOSS4G 2018, Dar es Salaam, Tanzania, 29–31 August 2018; pp. 147–154. [Google Scholar] [CrossRef] [Green Version]
  12. Antoniou, V.; Skopeliti, A. Measures and indicators of VGI quality: An Overview. In Proceedings of the ISPRS Annals of the Photogrammetry, Remote Sensing and Spatial Information Sciences, II-3/W5, ISPRS Geospatial Week 2015, La Grande Motte, France, 28 September–3 October 2015; pp. 345–351. [Google Scholar] [CrossRef] [Green Version]
  13. Mooney, P.; Morgan, L. How much do we know about the contributors to volunteered geographic information and citizen science projects? In Proceedings of the ISPRS Annals of Photogrammetry, Remote Sensing & Spatial Information Sciences, II-3/W5, ISPRS Geospatial Week 2015, La Grande Motte, France, 28 September–3 October 2015; pp. 339–343. [Google Scholar] [CrossRef] [Green Version]
  14. Anderson, J.; Soden, R.; Keegan, B.; Palen, L.; Anderson, K.M. The Crowd is the Territory: Assessing Quality in Peer-Produced Spatial Data during Disasters. Int. J. Hum. Comput. Stud. 2018, 34, 295–310. [Google Scholar] [CrossRef]
  15. Neis, P.; Zipf, A. Analyzing the contributor activity of a volunteered geographic information project—The case of OpenStreetMap. ISPRS Int. J. Geo Inf. 2012, 1, 146–165. [Google Scholar] [CrossRef]
  16. Yang, A.; Fan, H.; Jing, N. Amateur or professional: Assessing the expertise of major contributors in OpenStreetMap based on contributing behaviors. ISPRS Int. J. Geo Inf. 2016, 5, 21. [Google Scholar] [CrossRef]
  17. Brida, A.B.; Owiyo, T.; Sokona, Y. Loss and damage from the double blow of flood and drought in Mozambique. Int. J. Glob. Warm. 2013, 5, 514–531. [Google Scholar] [CrossRef] [Green Version]
  18. Wikipedia Contributors. Mozambique. 2021. Available online: https://en.wikipedia.org/wiki/Mozambique (accessed on 17 January 2021).
  19. Matyas, C.J.; Silva, J.A. Extreme weather and economic well-being in rural Mozambique. Nat. Hazards 2013, 66, 31–49. [Google Scholar] [CrossRef]
  20. ISO. ISO 9000:2015, Quality Management Systems—Fundamentals and Vocabulary; International Organization for Standardization (ISO): Geneva, Switzerland, 2015. [Google Scholar]
  21. Cooper, A.K.; Coetzee, A.; Kaczmarek, I.; Kourie, D.G.; Iwaniak, A.; Kubik, T. Challenges for quality in volunteered geographic information. In Proceedings of the AfricaGEO 2011, Cape Town, South Africa, 31 May–2 June 2011. [Google Scholar]
  22. ISO. ISO 19157:2013, Geographic Information—Data Quality; International Organization for Standardization (ISO): Geneva, Switzerland, 2013. [Google Scholar]
  23. Barron, C.; Neis, P.; Zipf, A. A comprehensive framework for intrinsic OpenStreetMap quality analysis. Trans. GIS 2014, 18, 877–895. [Google Scholar] [CrossRef]
  24. Haklay, M. How good is volunteered geographical information? A comparative study of OpenStreetMap and Ordnance Survey datasets. Environ. Plan. B Plan. Des. 2010, 37, 682–703. [Google Scholar] [CrossRef] [Green Version]
  25. Girres, J.F.; Touya, G. Quality assessment of the French OpenStreetMap dataset. Trans. GIS 2010, 14, 435–459. [Google Scholar] [CrossRef]
  26. Neis, P.; Zielstra, D.; Zipf, A. The street network evolution of crowdsourced maps: OpenStreetMap in Germany 2007–2011. Future Internet 2012, 4, 1–21. [Google Scholar] [CrossRef] [Green Version]
  27. Mooney, P.; Corcoran, P. The annotation process in OpenStreetMap. Trans. GIS 2012, 16, 561–579. [Google Scholar] [CrossRef]
  28. Helbich, M.; Amelunxen, C.; Neis, P.; Zipf, A. Comparative spatial analysis of positional accuracy of OpenStreetMap and proprietary geodata. In Proceedings of the GI_Forum 2012, Salzburg, Austria, 5–9 July 2011; pp. 24–33. [Google Scholar]
  29. Fan, H.; Zipf, A.; Fu, Q.; Neis, P. Quality assessment for building footprints data on OpenStreetMap. Int. J. Geogr. Inf. Sci. 2014, 28, 700–719. [Google Scholar] [CrossRef]
  30. Brovelli, M.A.; Zamboni, G. A new method for the assessment of spatial accuracy and completeness of OpenStreetMap building footprints. ISPRS Int. J. Geo Inf. 2018, 7, 289. [Google Scholar] [CrossRef] [Green Version]
  31. Dorn, H.; Törnros, T.; Zipf, A. Quality evaluation of VGI using authoritative data—A comparison with land use data in Southern Germany. ISPRS Int. J. Geo Inf. 2015, 4, 1657–1671. [Google Scholar] [CrossRef]
  32. Keßler, C.; De Groot, R.T.A. Trust as a proxy measure for the quality of volunteered geographic information in the case of OpenStreetMap. In Geographic Information Science at the Heart of Europe; Lecture Notes in Geoinformation and Cartography; Vandenbroucke, D., Bucher, B., Crompvoets, J., Eds.; Springer: Cham, Switzerland, 2013; pp. 21–37. ISBN 978-3-319-00614-7. [Google Scholar]
  33. Jacobs, K.T.; Mitchell, S.W. OpenStreetMap quality assessment using unsupervised machine learning methods. Trans. GIS 2020, 24, 1280–1298. [Google Scholar] [CrossRef]
  34. Fogliaroni, P.; D’Antonio, F.; Clementini, E. Data trustworthiness and user reputation as indicators of VGI quality. Geo Spat. Inf. Sci. 2018, 21, 213–233. [Google Scholar] [CrossRef] [Green Version]
  35. Haklay, M.; Basiouka, S.; Antoniou, V.; Ather, A. How many volunteers does it take to map an area well? The validity of Linus’ law to volunteered geographic information. Cartogr. J. 2010, 47, 315–322. [Google Scholar] [CrossRef] [Green Version]
  36. Muttaqien, B.I.; Ostermann, F.O.; Lemmens, R.L. Modeling aggregated expertise of user contributions to assess the credibility of OpenStreetMap features. Trans. GIS 2018, 22, 823–841. [Google Scholar] [CrossRef]
  37. Sehra, S.S.; Singh, J.; Rai, H.S. Assessing OpenStreetMap data using intrinsic quality indicators: An extension to the QGIS processing toolbox. Future Internet 2017, 9, 15. [Google Scholar] [CrossRef] [Green Version]
  38. Minghini, M.; Frassinelli, F. OpenStreetMap history for intrinsic quality assessment: Is OSM up-to-date? Open Geospat. Data Softw. Stand. 2019, 4, 9. [Google Scholar] [CrossRef] [Green Version]
  39. Napolitano, M.; Mooney, P. MVP OSM: A Tool to Identify Areas of High Quality Contributor Activity in OpenStreetMap. Bull. Soc. Cartogr. 2012, 45, 10–18. [Google Scholar]
  40. Rehrl, K.; Gröchenig, S. A framework for data-centric analysis of mapping activity in the context of volunteered geographic information. ISPRS Int. J. Geo Inf. 2016, 5, 37. [Google Scholar] [CrossRef] [Green Version]
  41. D’Antonio, F.; Fogliaroni, P.; Kauppinen, T. VGI edit history reveals data trustworthiness and user reputation. In Proceedings of the AGILE’2014 International Conference on Geographic Information Science, Castellon, Spain, 3–6 June 2014. [Google Scholar]
  42. Martini, A.; Kuper, P.V.; Breunig, M. Database-supported change analysis and quality evaluation of OpenStreetMap data. In Proceedings of the ISPRS Annals of Photogrammetry, Remote Sensing & Spatial Information Sciences, IV-2/W5, ISPRS Geospatial Week 2019, Enschede, The Netherlands, 10–14 June 2019; pp. 535–541. [Google Scholar] [CrossRef] [Green Version]
  43. OpenStreetMap Foundation. 2020. Available online: https://join.osmfoundation.org/active-contributor-membership/ (accessed on 3 December 2020).
  44. HOT OSM. 2020. Available online: https://learnosm.org/en/coordination/tasking-manager3-project-admin/ (accessed on 3 December 2020).
  45. OpenStreetMap Wiki. 2020. Available online: https://wiki.openstreetmap.org (accessed on 3 December 2020).
  46. Rehrl, K.; Gröechenig, S.; Hochmair, H.; Leitinger, S.; Steinmann, R.; Wagner, A. A conceptual model for analyzing contribution patterns in the context of VGI. In Progress in Location-Based Services; Lecture Notes in Geoinformation and, Cartography; Crompvoets, J., Ed.; Springer: Berlin/Heidelberg, Germany, 2013; ISBN 978-3-642-34202-8. [Google Scholar]
  47. Nazeer, K.A.; Sebastian, M.P. Improving the Accuracy and Efficiency of the k-means Clustering Algorithm. In Proceedings of the World Congress on Engineering 2009, London, UK, 1–3 July 2009; Volume 1, pp. 1–3. [Google Scholar]
  48. Oslandia. OSM Data Classification. 2017. Available online: https://github.com/Oslandia/osm-data-classification (accessed on 3 December 2020).
  49. Ezenkwu, C.P.; Ozuomba, S. Application of K-Means Algorithm for Efficient Customer Segmentation: A Strategy for Targeted Customer Services. Int. J. Adv. Res. Artif. Intell. 2015, 4, 40–44. [Google Scholar] [CrossRef] [Green Version]
  50. Ding, C.; He, X. K-means clustering via principal component analysis. In Proceedings of the Twenty-First International Conference on Machine Learning (ICML ‘04), Banff, AB, Canada, 4–8 July 2004. [Google Scholar] [CrossRef]
  51. Wagstaff, K.; Cardie, C.; Rogers, S.; Schrödl, S. Constrained k-means clustering with background knowledge. In Proceedings of the Eighteenth International Conference on Machine Learning (ICML ‘01), San Francisco, CA, USA, 28 June–1 July 2002; pp. 577–584. [Google Scholar]
  52. Khajvand, M.; Zolfaghar, K.; Ashoori, S.; Alizadeh, S. Estimating customer lifetime value based on RFM analysis of customer purchase behavior: Case study. Procedia Comput. Sci. 2011, 3, 57–63. [Google Scholar] [CrossRef] [Green Version]
  53. Mohamad, I.B.; Usman, D. Standardization and its effects on K-means clustering algorithm. Res. J. Appl. Sci. Eng. Technol. 2013, 6, 3299–3303. [Google Scholar] [CrossRef]
  54. Assent, I. Clustering high dimensional data. Wiley Interdiscip. Rev. Data Min. Knowl. Discov. 2012, 2, 340–350. [Google Scholar] [CrossRef]
  55. Hamerly, G.; Elkan, C. Learning the k in k-means. In Proceedings of the 16th International Conference on Neural Information Processing Systems (NIPS’03), Bangkok, Thailand, 1–5 December 2009; pp. 281–288. [Google Scholar] [CrossRef]
  56. Kriegel, H.P.; Kröger, P.; Zimek, A. Clustering high-dimensional data: A survey on subspace clustering, pattern-based clustering, and correlation clustering. ACM Trans. Knowl. Discov. Data 2009, 3, 1–58. [Google Scholar] [CrossRef]
  57. Yang, B.; Fu, X.; Sidiropoulos, N.D.; Hong, M. Towards k-means-friendly spaces: Simultaneous deep learning and clustering. In Proceedings of the 34th International Conference on Machine Learning (ICML ‘17), Sydney, Australia, 7–9 August 2017; pp. 3861–3870. [Google Scholar] [CrossRef]
  58. Bholowalia, P.; Kumar, A. EBK-means: A clustering technique based on elbow method and k-means in WSN. Int. J. Comput. Appl. 2014, 105, 17–24. [Google Scholar] [CrossRef]
  59. Kodinariya, T.M.; Makwana, P.R. Review on determining number of Cluster in K-Means Clustering. Int. J. Adv. Res. Comput. Sci. Manag. Stud. 2013, 1, 90–95. [Google Scholar]
  60. Senaratne, H.; Mobasheri, A.; Ali, A.L.; Capineri, C.; Haklay, M. A review of volunteered geographic information quality assessment methods. Int. J. Geogr. Inf. Sci. 2017, 31, 139–167. [Google Scholar] [CrossRef]
  61. Kaur, J.; Singh, J. An Automated Approach for Quality Assessment of OpenStreetMap Data. In Proceedings of the 2018 International Conference on Computing, Power and Communication Technologies (GUCON), Uttar Pradesh, India, 28–19 September 2018; pp. 707–712. [Google Scholar] [CrossRef]
  62. Van den Berg, H.; Coetzee, S.; Cooper, A.K. Analysing commons to improve the design of volunteered geographic information repositories. In Proceedings of the AfricaGEO 2011, Cape Town, South Africa, 31 May–2 June 2011. [Google Scholar]
  63. OpenStreetMap Import/Guidelines. 2020. Available online: https://wiki.openstreetmap.org/wiki/Import/Guidelines (accessed on 19 January 2021).
  64. Spielman, S.E. Spatial collective intelligence? Credibility, accuracy, and volunteered geographic information. Cartogr. Geogr. Inf. Sci. 2014, 41, 115–124. [Google Scholar] [CrossRef] [PubMed]
  65. Yang, A.; Fan, H.; Jing, N.; Sun, Y.; Zipf, A. Temporal analysis on contribution inequality in OpenStreetMap: A comparative study for four countries. ISPRS Int. J. Geo Inf. 2016, 5, 5. [Google Scholar] [CrossRef]
Figure 1. Location of Mozambique in Africa (Source: Natural Earth).
Ijgi 10 00156 g001
Figure 2. Three records from the OSM history file, showing edits to a single node (id=251993180).
Ijgi 10 00156 g002
Figure 3. Cumulative variance plot showing that 80.4% of the variance can be explained by the first six principal components.
Ijgi 10 00156 g003
Figure 4. Attribute contribution loadings for each of the three principal components.
Ijgi 10 00156 g004
Figure 5. Determining the number of clusters based on the elbow method.
Ijgi 10 00156 g005
Figure 6. Cluster solution with three principal components.
Ijgi 10 00156 g006
Figure 7. Cluster solution with six principal components.
Ijgi 10 00156 g007
Table 1. Contributor-focused characteristics.
Time-related characteristics (when?)
Lifespan (longevity)The timespan between the first and last contribution [5,15,16,36,39].
Mapping frequencyThe frequency at which a contributor updates data in a given area [39].
Mapping daysThe number of days on which data was contributed [5,14,16,36].
Mapping weeksThe number of weeks during which data was contributed [16].
Mapping timeframeA specific timeframe (during the overall lifespan of OSM) during which data was contributed [15].
Duration of uninterrupted contribution periodThe longest number of successive days on which data was contributed [16].
Weekday productivityThe number of contributions on weekdays divided by the sum of all contributions (including those on weekends) [16].
Average contribution timeThe average amount of time a contributor spends when editing map features, based on the first and last timestamp associated with a changeset [40].
Activity-related characteristics (how?)
Overall feature editing quantitiesThe number of edits by the contributor on any kind of feature [4,36,39].
Specific feature editing quantitiesThe number of specific features created or edited by a contributor, e.g., nodes in [5,15]; polygons in [6].
Feature editing preferenceThe types of features or objects that a contributor prefers to edit [4,15].
Editing characteristicsThe types of edits, e.g., creating new features vs modifying or deleting features [41].
Changeset quantityThe number of changesets a contributor has worked on [36].
Area-related characteristics (where?)
Contributor density The number of contributors active on a given part of the map [14,35,42].
Contribution stageThe number and kind of contributions on a given part of the map, based on distinct stages through which the map progresses from initial creation to mostly maintenance at a later stage [14].
Contribution areaThe geographic area in which a contributor has been active [4,15].
Person-related characteristics (who?)
Local knowledgeBased on the distance from the first created node to the study area, assuming that most users will start mapping close to a place they are familiar with [15,36], based on the centre of activity of the contributor [15] or based features that cannot be traced from aerial imagery [39].
ReputationBased on the trustworthiness of the feature editing done by the contributor [34].
SkillBased on the OSM editor tool used by the contributor [16,33,36].
Table 2. Contribution lifespan attributes prepared from the Mozambique history data for user 32744.
First contribution2008-04-20 17:38:29 UTC
Latest contribution2019-02-27 17:05:54 UTC
Lifespan (in days)3964.98
Table 3. Contribution intensity attributes prepared from the Mozambique history data for user 32744.
Mapping days176
Changeset quantity319
Average contribution time (in minutes)17.59
Number of edits per feature (average)4.43
Table 4. Contributor actions attributes prepared from the Mozambique history data for user 32744.
Total contributions132,390
Node contributions131,164
Nodes created28,467
Nodes modified97,851
Nodes deleted4846
Nodes last user to edit10,710
Nodes modified by others19,813
Nodes revisited100,641
Way contributions1221
Ways created255
Ways modified917
Ways deleted49
Ways last user to edit69
Ways modified by others226
Ways revisited926
Relation contributions5
Relations created0
Relations modified5
Relations deleted0
Relations last user to edit0
Relations modified by others4
Relations revisited1
Table 5. Characterising the principal components.
Principal Component 1Principal Component 2Principal Component 3
Changeset quantity (negative)Changeset quantity (positive)Changeset quantity (negative)
Total contributions (negative)Mapping days (positive)Node created (negative)
Node contributions (negative)Average number of edits per feature (positive)Nodes last user to edit (positive)
Nodes last user to edit (negative)Nodes created (negative)Nodes modified by others (negative)
Ways created (negative)Ways created (negative)Ways last user to edit (positive)
Way contributions (negative)Ways modified (positive)Ways modified by others (negative)
Ways last user to edit (negative)Relation contributions (positive)
Relations modified (positive)
Relations modified by others (positive)
Table 6. User 32744 characterised by the three principal components.
Principal component 1−0.199
Principal component 22.332
Principal component 3−0.746
Table 7. The four clusters, characterised by the three principal components.
ClusterPrincipal Component 1 (28.8%)Principal Component 2 (17.8%)Principal Component 3 (12.7%)Number of Contributors (% of Total)
00.49−0.35−0.412676 (26%)
11.110.680.361301 (13%)
2−0.25−0.290.313708 (36%)
3−0.710.44−0.202552 (25%)
Table 8. Descriptive statistics for each cluster.
Number of Mapping DaysChangeset QuantityTotal Contributions
ClusterAverageMedianAverageMediaAverageMedian
01.1515.062256.83119
11.9113.27144.435
21.1515.383513.09337
39.10390.132314,489.202346.5
Publisher’s Note: MDPI stays neutral with regard to jurisdictional claims in published maps and institutional affiliations.

