Article

Evaluating Natural Ecological Land Change in Function-Oriented Planning Regions Using the National Land Use Survey Data from 2009 to 2018 in China

1
Key Laboratory of Digital Earth Science, Aerospace Information Research Institute, Chinese Academy of Sciences, Beijing 100094, China
2
College of Resources and Environment, University of Chinese Academy of Sciences, Beijing 100094, China
3
College of Land Science and Technology, China Agricultural University, Beijing 100193, China
4
Key Laboratory of Land Use, Ministry of Natural Resources, China Land Surveying and Planning Institute, Beijing 100035, China
*
Author to whom correspondence should be addressed.
ISPRS Int. J. Geo-Inf. 2021, 10(3), 172; https://0-doi-org.brum.beds.ac.uk/10.3390/ijgi10030172
Submission received: 4 January 2021 / Revised: 21 February 2021 / Accepted: 14 March 2021 / Published: 16 March 2021

Abstract

:
The natural ecological lands, such as forest land, grassland, wetland, etc., constitute the most important factor for maintaining and preserving the earth’s ecosystem, which must be well concerned in the regional function-oriented planning for the sustainability of human economic development. We analyzed and evaluated the change of natural ecological land in the function-oriented planning regions where we applied the major function-oriented zones introduced as a new concept in China. Using the land-use data from 2009 to 2018 that were produced by the National Land Use Survey, we re-classified natural ecological land types into the forest, grassland, wetland, and bare land, and then addressed the changes of natural ecological land types from 2009 to 2018 in the major function-oriented zones. As a result, the area of natural ecological lands generally tended to decrease from 2009 to 2018, while the decreasing trend of natural ecological land areas was controlled after 2015 with the implementation of governmental policies for environment protection and eco-logical projects. Especially, the decrease of forest land area significantly tended to be zero in 2018 in optimal development zones. The decreased areas of natural ecological lands were mostly converted from artificial land from 2008 to 2019. On the other side, the forest lands mostly changed from cropland and grassland in key development zones, agricultural production zones, and key ecological function zones, due to the fact that grassland conversed in afforestation during this period. The evaluation of natural ecological land changes, which could be implemented by using the annual updates of national land-use data in China, is significant to support the government’s spatial regulation design, to reshape the planned regions, and make policies for environmental restoration and protection management.

1. Introduction

The changes in land use, which is a major driving factor of global and regional eco-logical changes, affect the ecosystem structure and process, either directly or indirectly, and induce the capacity change of the ecosystem that could supply us services [1,2,3,4,5]. Generally, land use could be identified into three types: (1) the natural ecological land (hereinafter referred to as ecological land) with natural attributions that coordinate the ecosystem, such as forest, grassland, wetland, etc.; (2) semi-natural land use types which accommodate human interaction with nature frequently, such as cropland, orchard, etc.; (3) land for human products, such as urban areas [6,7,8,9,10]. The concept of ecological land has been applied for the classification of land ecological function, land changes, ecosystem functions, etc. in a set of studies from the 1990s [11,12,13,14,15,16,17,18,19,20,21,22,23] and environmental management especially in China [2]. According to the researches above, the capacity and change of ecological land within a region indicate the change of the natural environment, the intensity of human disturbance, and the effects of spatial regulation implemented in the development planning.
The conflicts between human production and ecological spaces have been in-creasing with the economic developments in China. The major function-oriented zones (MFOZs) were conducted in 2010 [24] based on regional major functions of land that play in urbanization and industrialization, ecological constructions, grain pro-ductions, and protection of natural and cultural heritages, with purposes to coordinate regional development and shaping an orderly spatial structure of land use. The zoning of MFOZs integrates the method of major function category, the regional equilibrium model and specification, and the development intensity. A total of 10 indicators were selected to classify MFOZS including 9 quantitative indicators (available land resources, available water resources, environmental capacity, ecological vulnerability, ecological importance, natural disaster hazard, degree of population agglomeration, economic development level, transport dominance level) and one qualitative indicator of national strategy [25]. Each indicator is a composition of multi-factors with several sets of variables. MFOZs demonstrate the patterns of ecological environment and governmental development planning. Most studies have focused on spatial development planning and ecological conservation [25,26,27,28,29] rather than the quantity and quality of the ecological environment, especially the spatiotemporal characteristics of ecological land in MFOZs. At present, there’s still a lack of knowledge about the spatiotemporal changes of the ecological land in MFOZs.
In this paper, we evaluated the spatiotemporal changes of ecological land in MFOZs using land-use data of 10 years from 2009 to 2018 by the approach quantifying change of ecological land. This study presents a case study applying the multiple years of land-use data to provide valuable information on regional ecological land for regional planning, management, ecosystem conservation, and restoration.

2. Materials and Methods

2.1. Study Area and Data

The study area is located in China where we selected the major function-oriented zones (MFOZs) (V1.0) shown in Figure 1 as the evaluating unit. MFOZs, as published by the China State Council in 2011, address the issue of forming the regional development pattern. The regions with massive urbanization and industrialization are schematized as optimal development zones (ODZs) and key development zones (KDZs), the regions with ecological constructing or grain producing as the development-restricted zones, the regions with natural and cultural heritage protection as the prohibited development zones (PDZs). The development-restricted zones are divided into agricultural production zones (APZs) and key ecological function zones (KEFZs) further. Figure 1 demonstrates the spatial location of re-dividing the MFOZs [30] after overlapping the county border. PDZs in MFOZs were not discussed, since they spatially overlapped with ranges of ODZs, KDZs, and RDZs, and its area was relatively small compared to the other zones.
The land-use data from 2009 to 2018 are collected from the 2nd National Land Use Survey in China. These data are produced on the scale of 1:10,000 and updated annually through the visual interpretation of satellite observing high spatial resolution data including Gaofen, Worldview, Quickbird, and aerial photos, and verification and modification of field investigations, which are sponsored by the Ministry of Natural Resources. The classification scheme of ecological land use is defined in two-level, top-level include 8 classes. The sub-level includes 38 classes [2] that are shown in Table 1 in the next section.

2.2. Method

The approach of data processing and analysis is shown in Figure 2. We integrated the land use data to ecological land and MFOZs and quantified the changes of ecological Land from 2009 to 2018 in MFOZs. The processing is conducted by the MATLAB program built by authors.

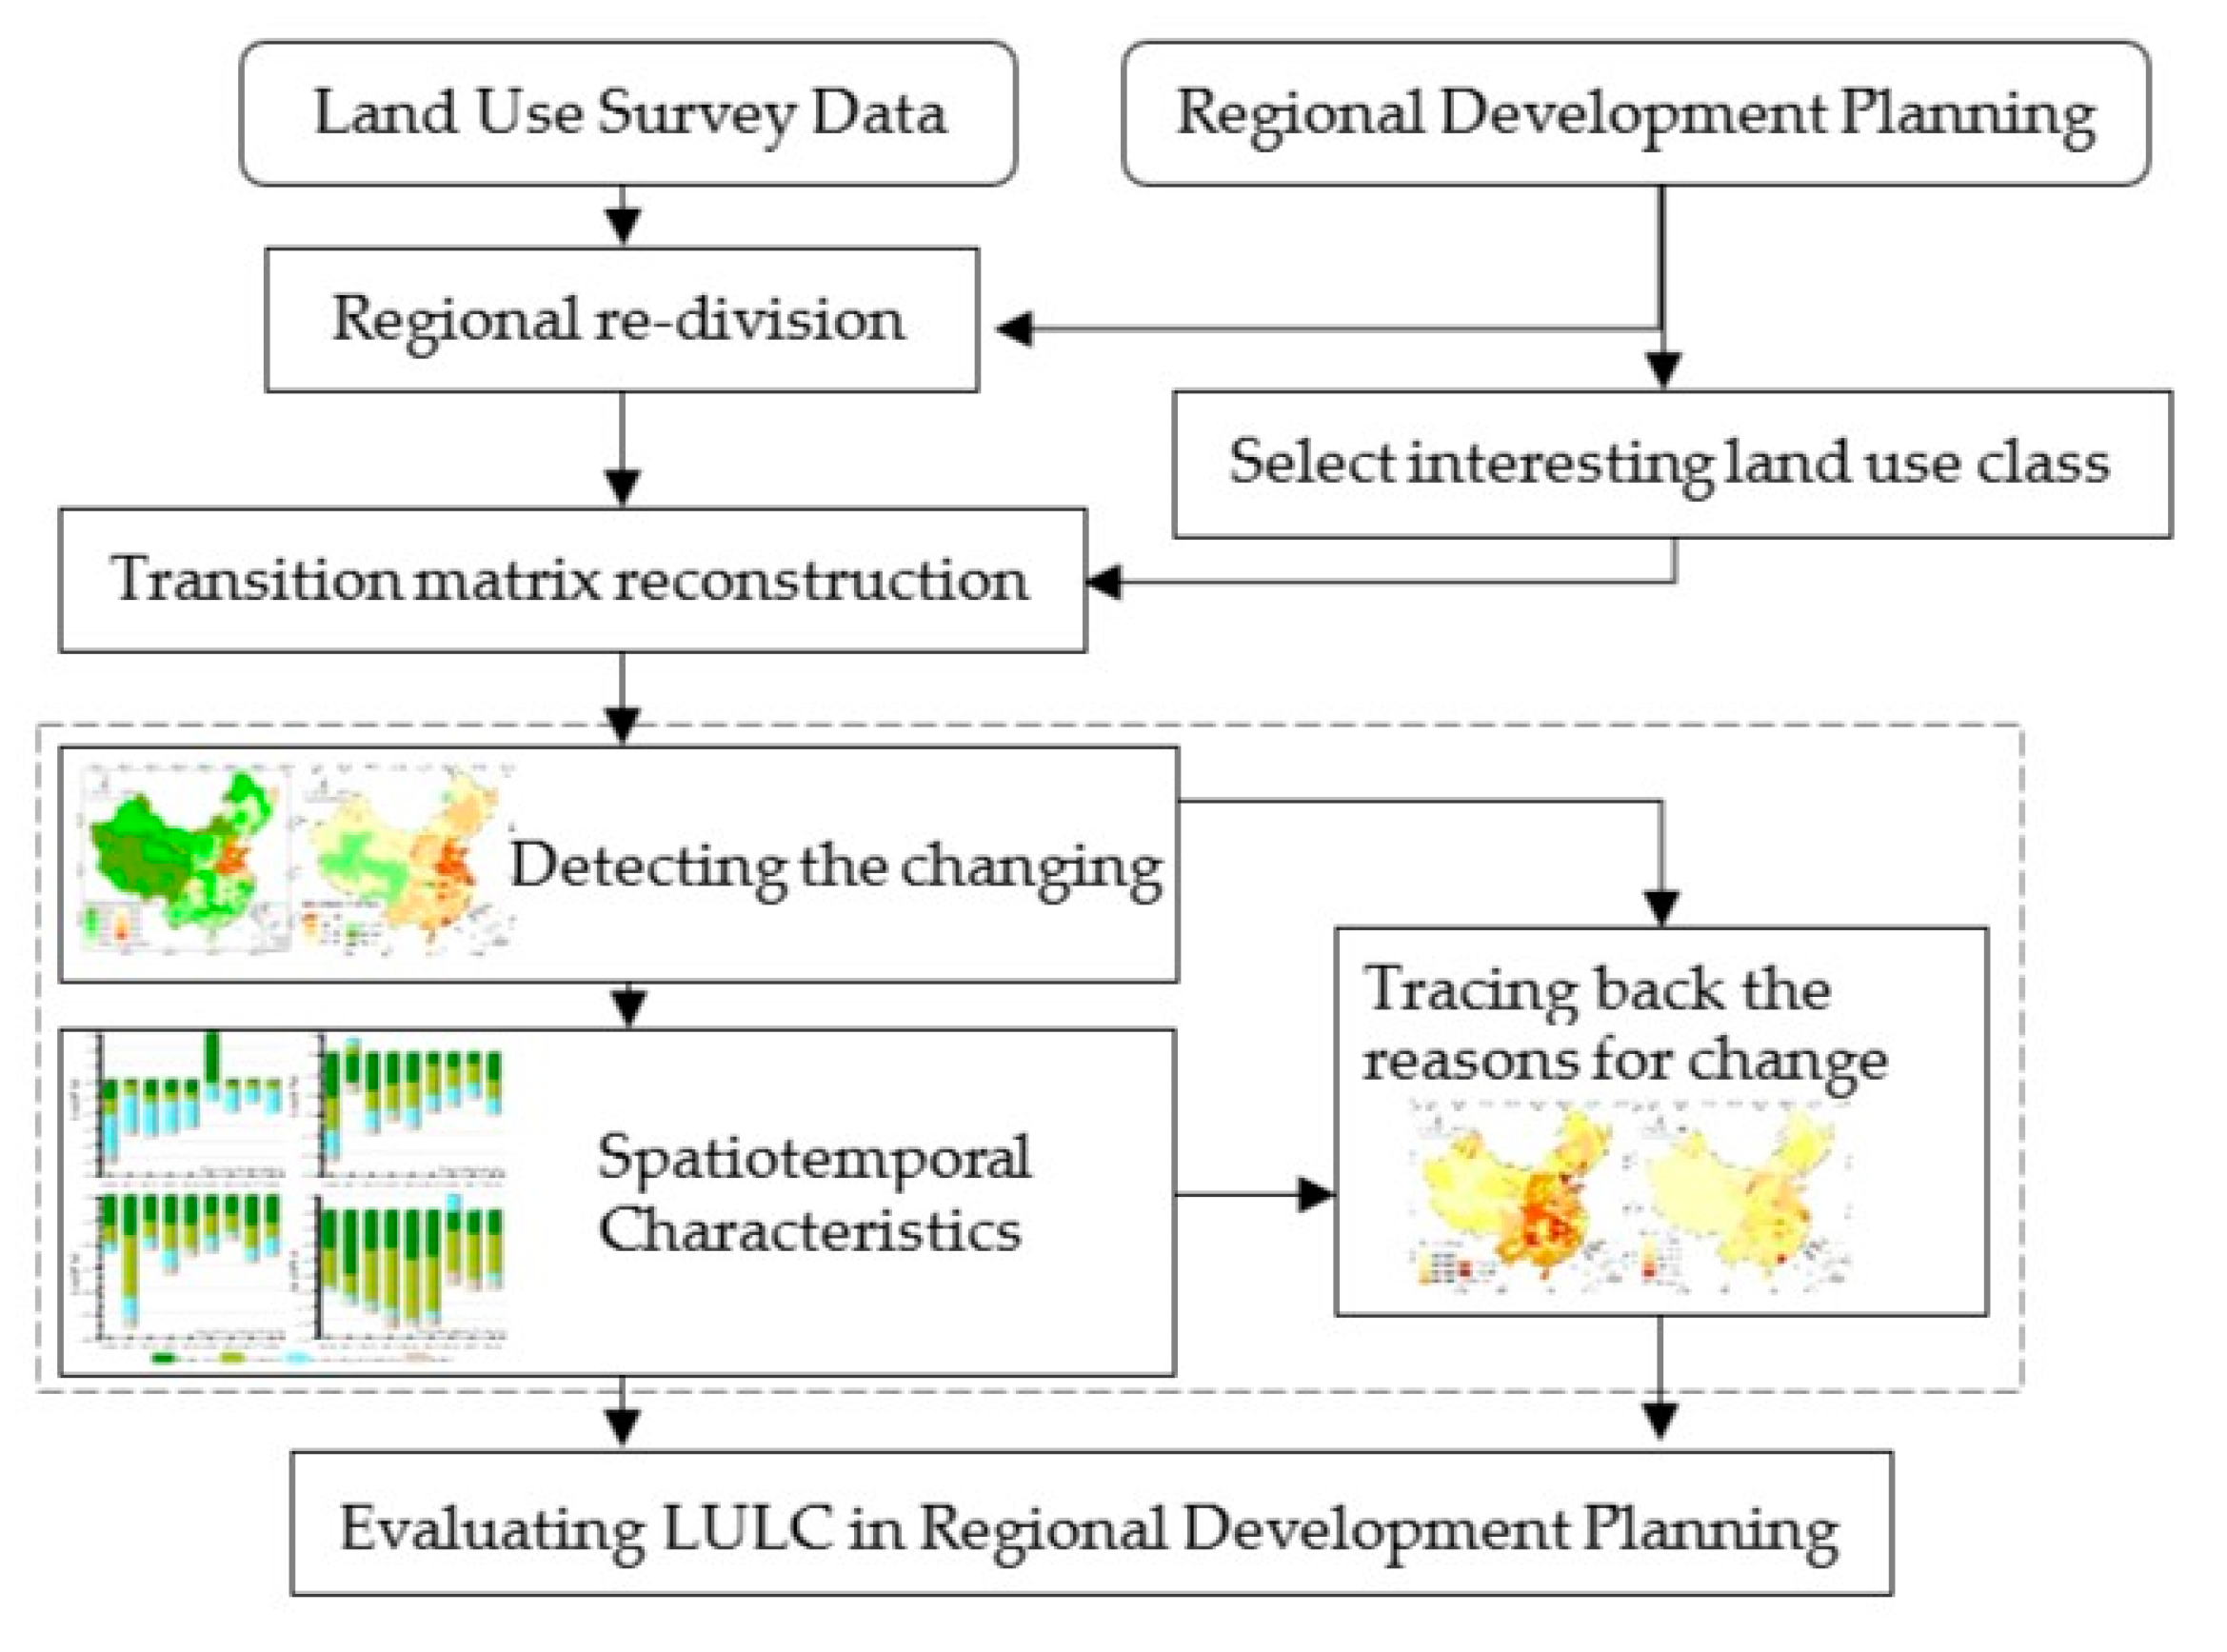
2.2.1. Integrating Data

Firstly, we integrated land use data at a 1:1000 scale into the area in the county unit due to the huge volume of land use data in the whole of China. The ecological land was reclassified into forest land, grassland, wetland, and bare land as shown in Table 1 according to natural and human attributions of land use. The transfer matrix table of ecological land for yearly changes in each county is created from 2009 to 2018 and then summarized by MFOZs.

2.2.2. Change Indexes of Ecological Land

The changing indexes of ecological land are calculated using a transition matrix for MFOZs. The matrices of ecological land transition were established every year, which quantitatively demonstrate unchanged and changed ecological land types in the MFOZs. The changing indexes, including the rate of change, disturbing rate, and transformed rate are computed with expressions as follows.
The rate of change is defined as
R i = Ais Aie Ais × 100
where R i is the rate of change for i type, Ais , and Aie are the areas of i type at the start and end of the computed year, respectively.
The disturbing rate is defined as
K i = ( ij n | D i w | + | D w i | Ai ) × 1 t × 100
where K i is the degree of ecological land disturbing by the non-ecological land for i type, D i w and D w i are the areas of the ecological land transferred into and out from i type to j non-ecological land class during the t years, respectively, Ai is the area of i type in MFOZs in 2009. This index reveals the intensity of ecological land changed from non-ecological land other lands within MFOZs during a period.
Transforming rate
S i = ( ij n | T i j | + | T j i | Ai ) × 1 t × 100
where S i is the degree of ecological land transforming, T i j and T j i are the areas between the ecological land types transferred in and out during t years, respectively (e.g., forest land degraded into grassland), Ai is the area of i type in MFOZs in 2009. This index reveals the intensity of internal changes in ecological land within MFOZs during a period.

3. Results

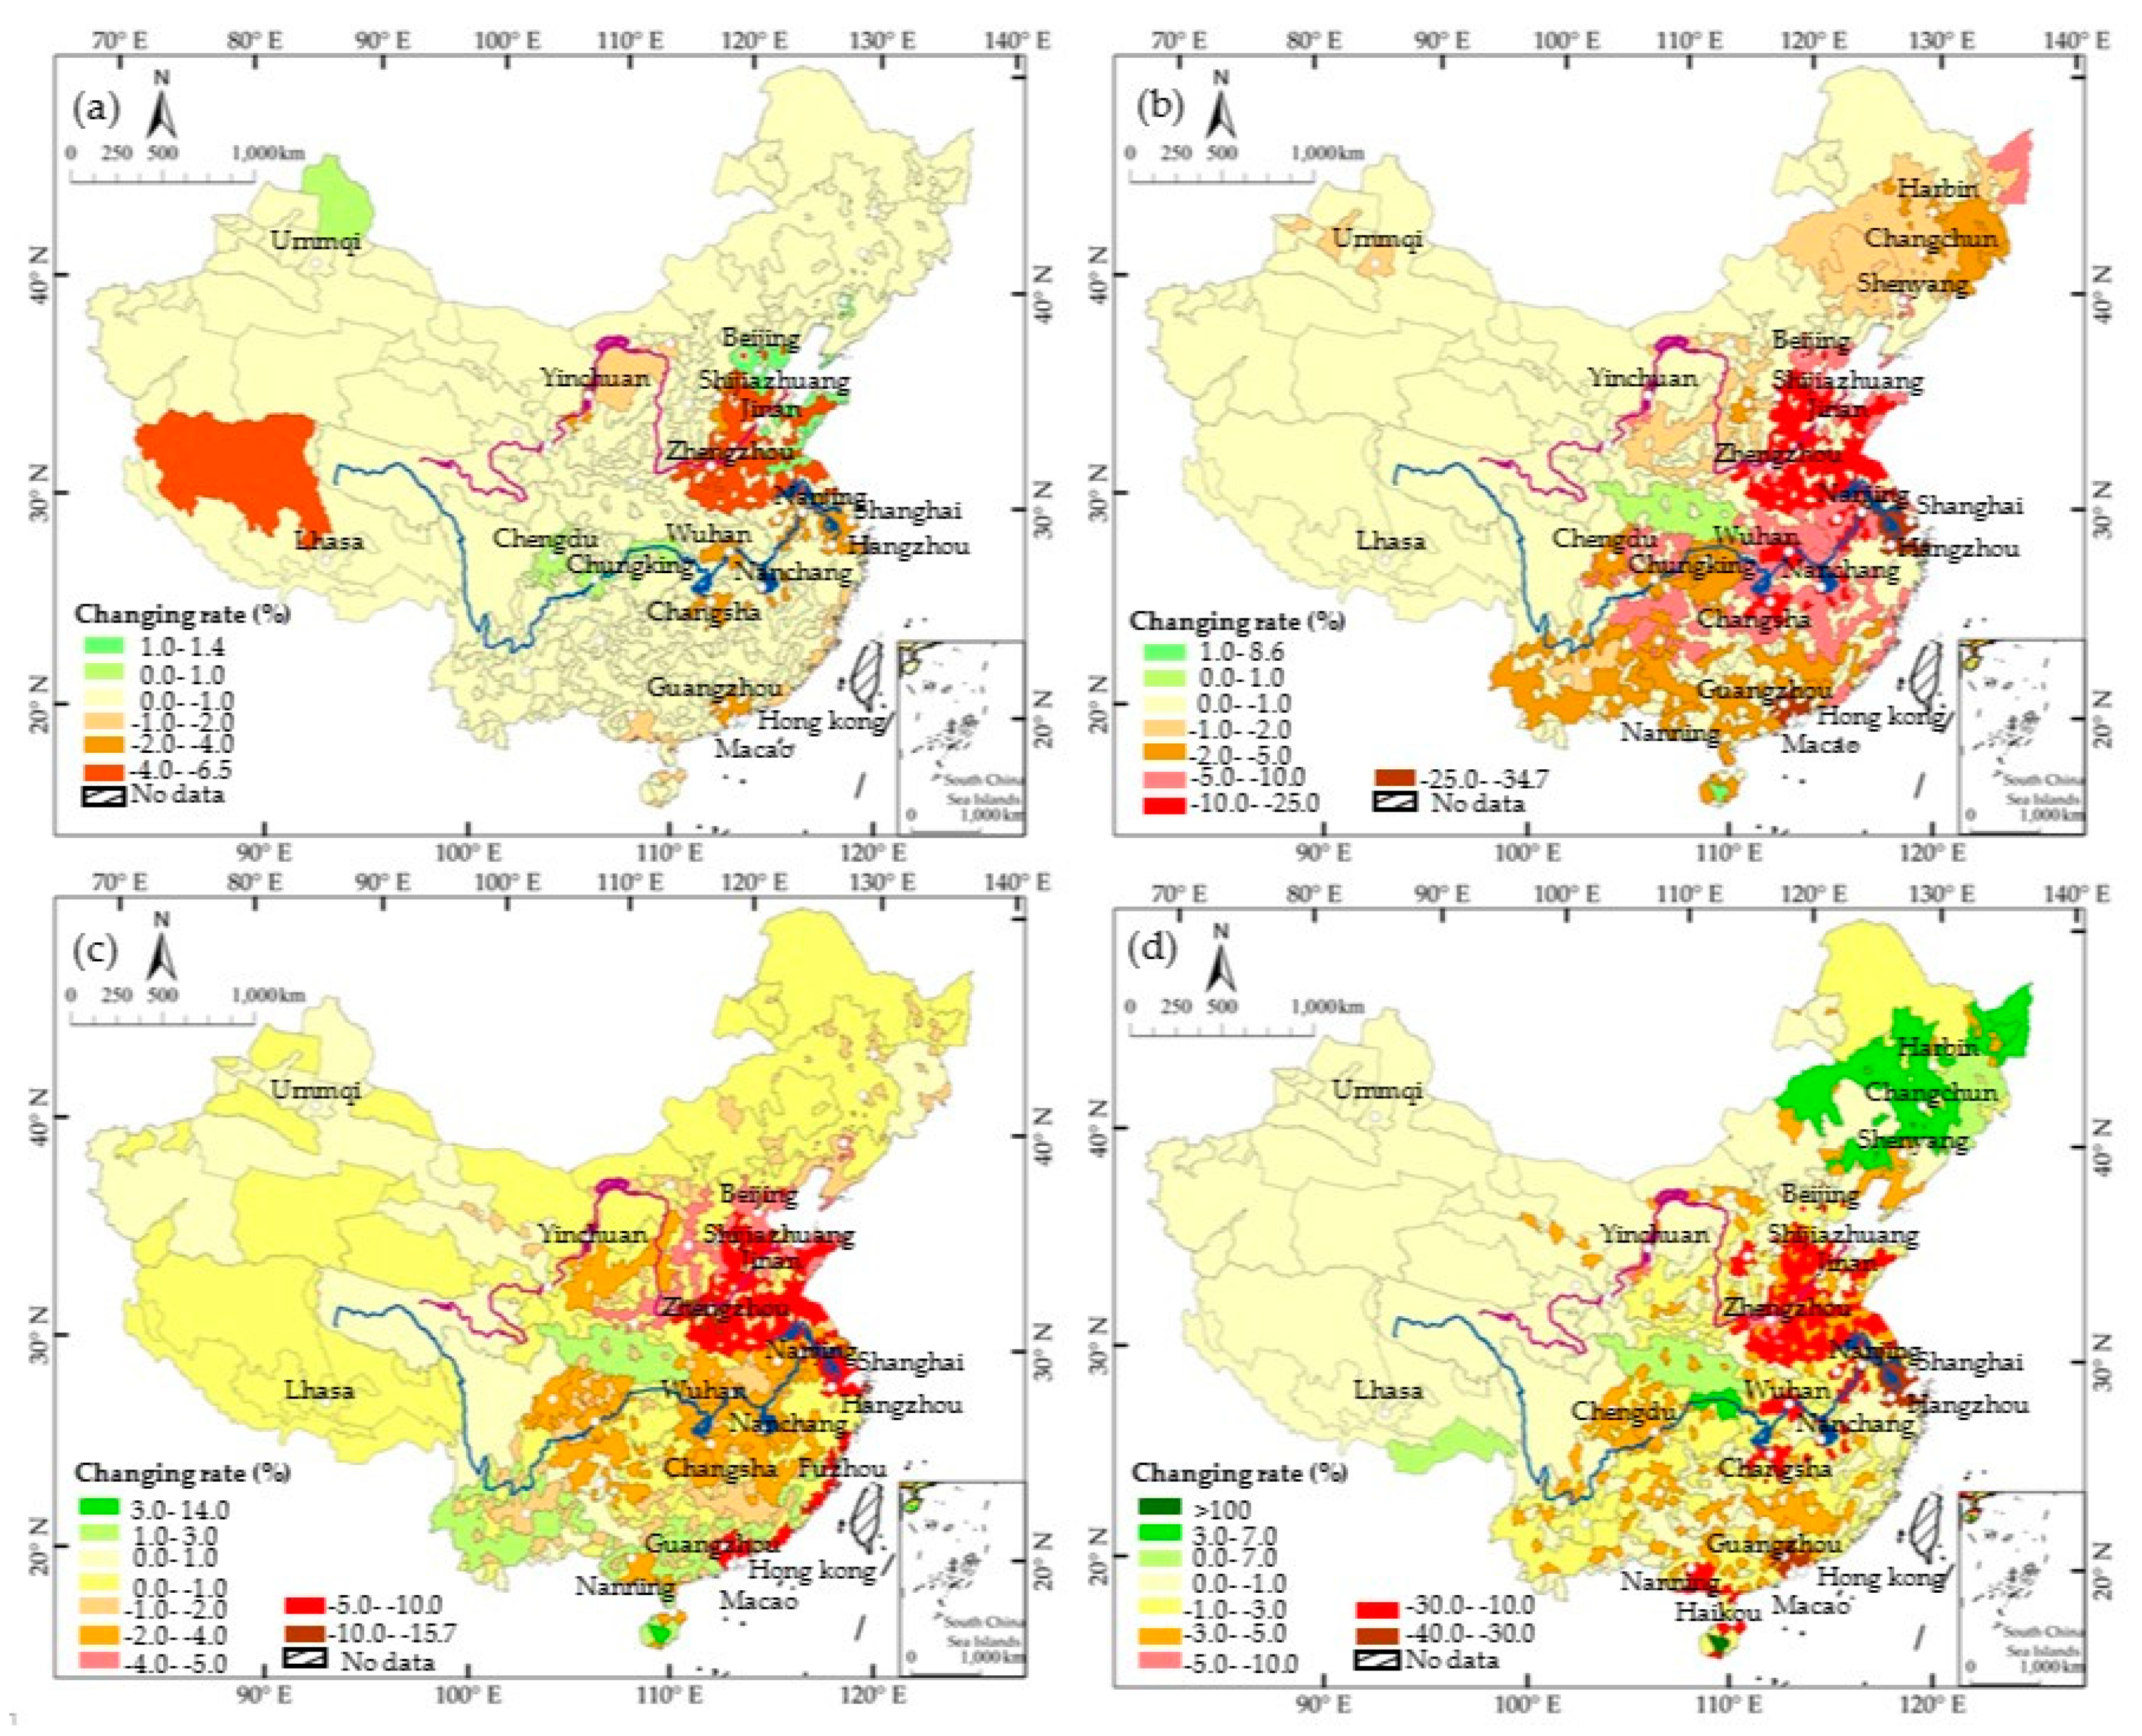
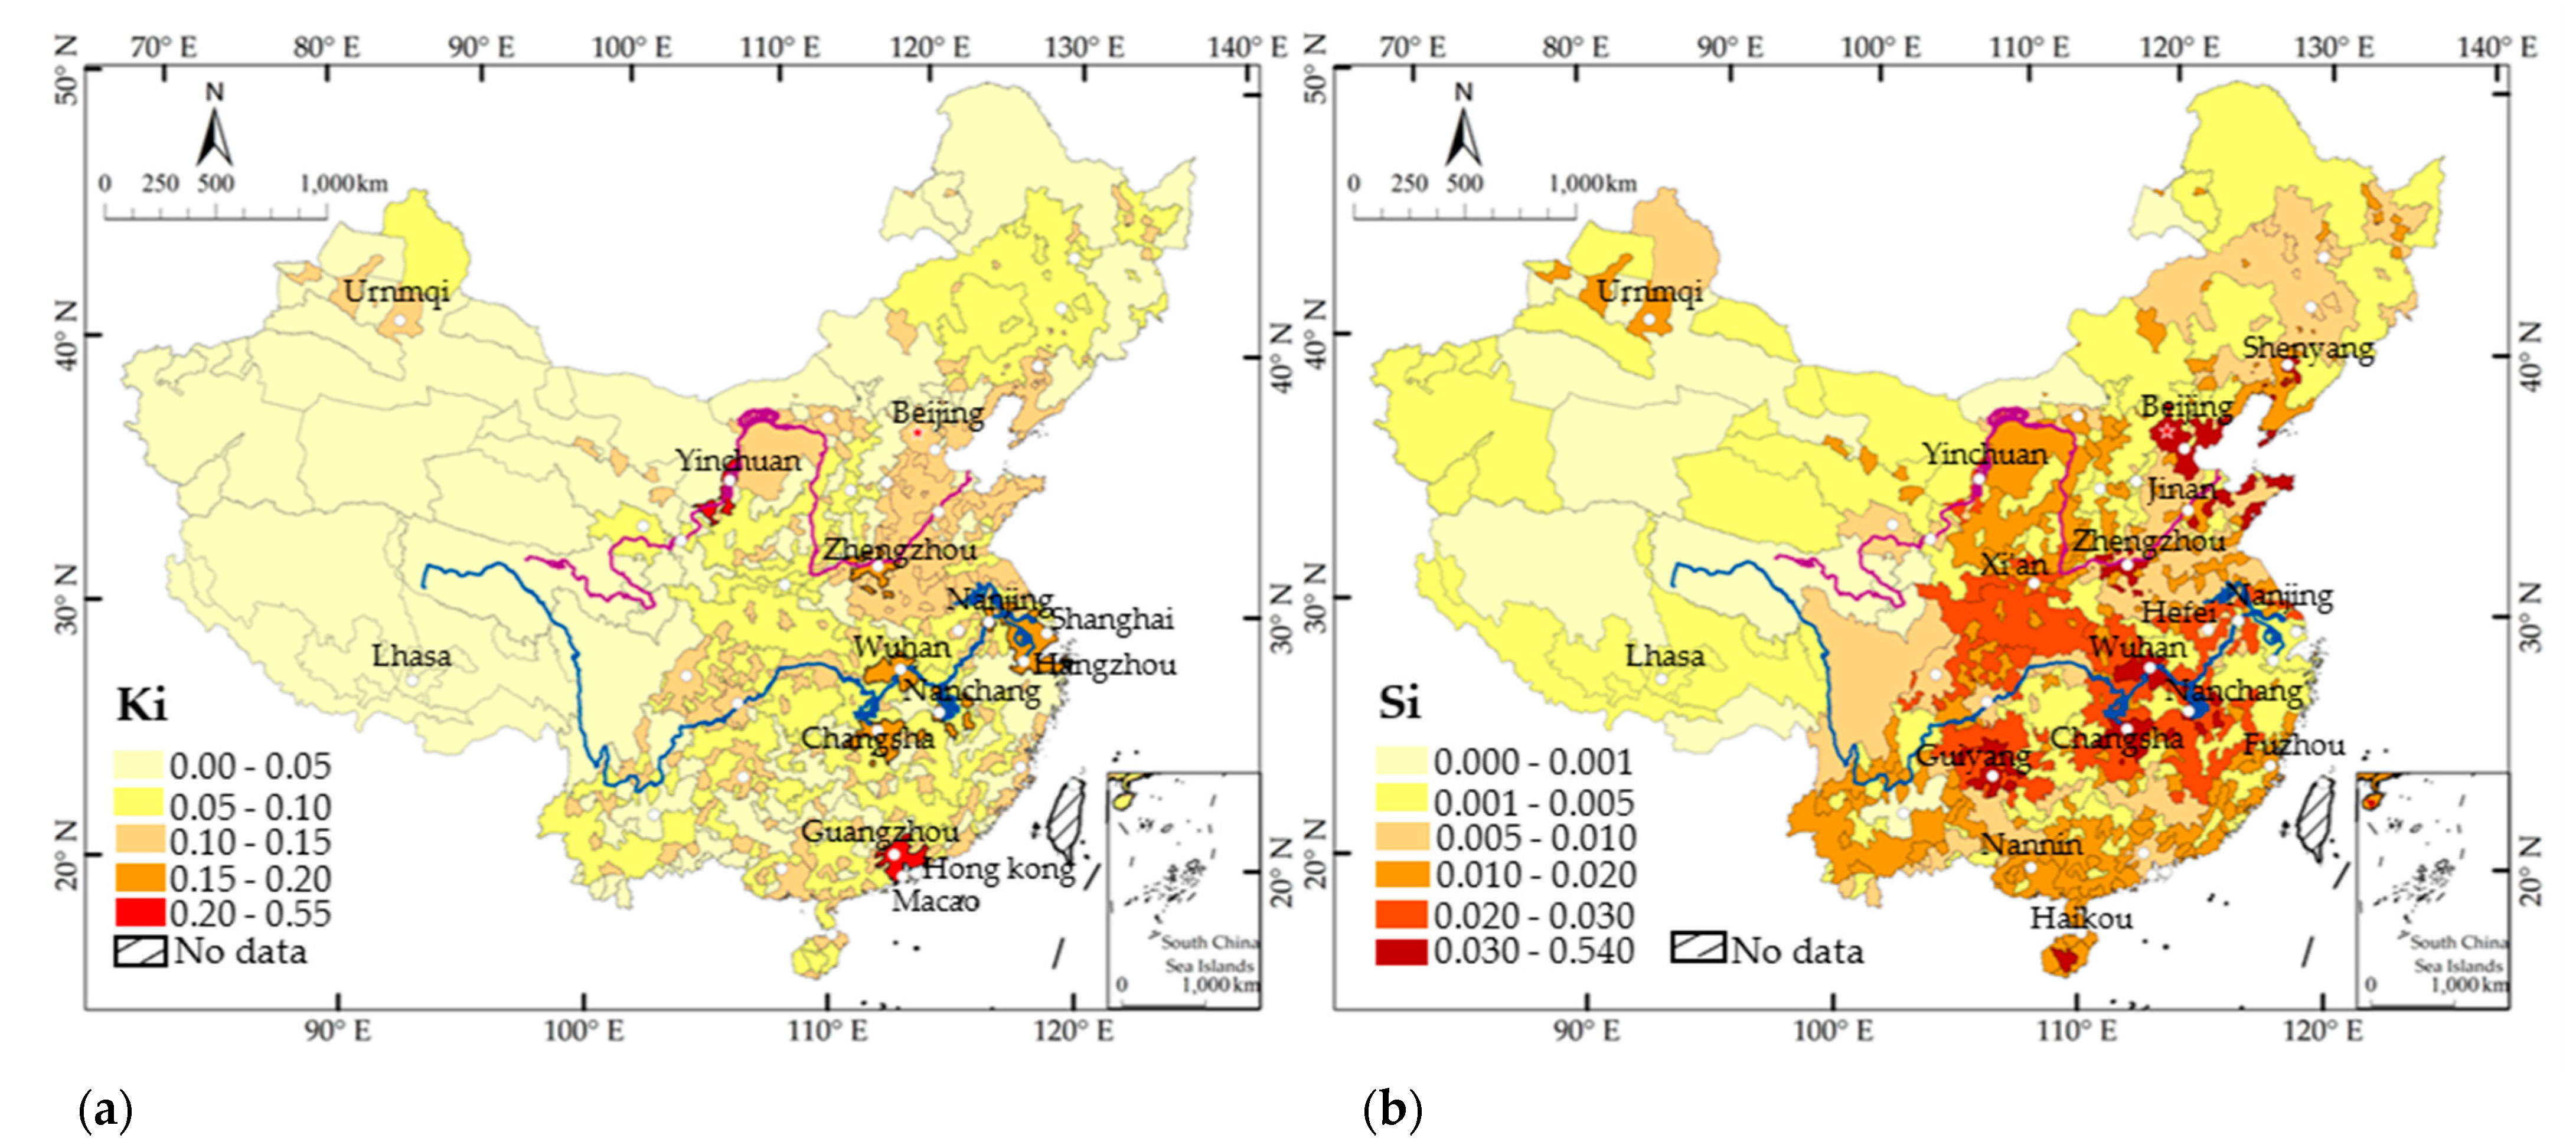
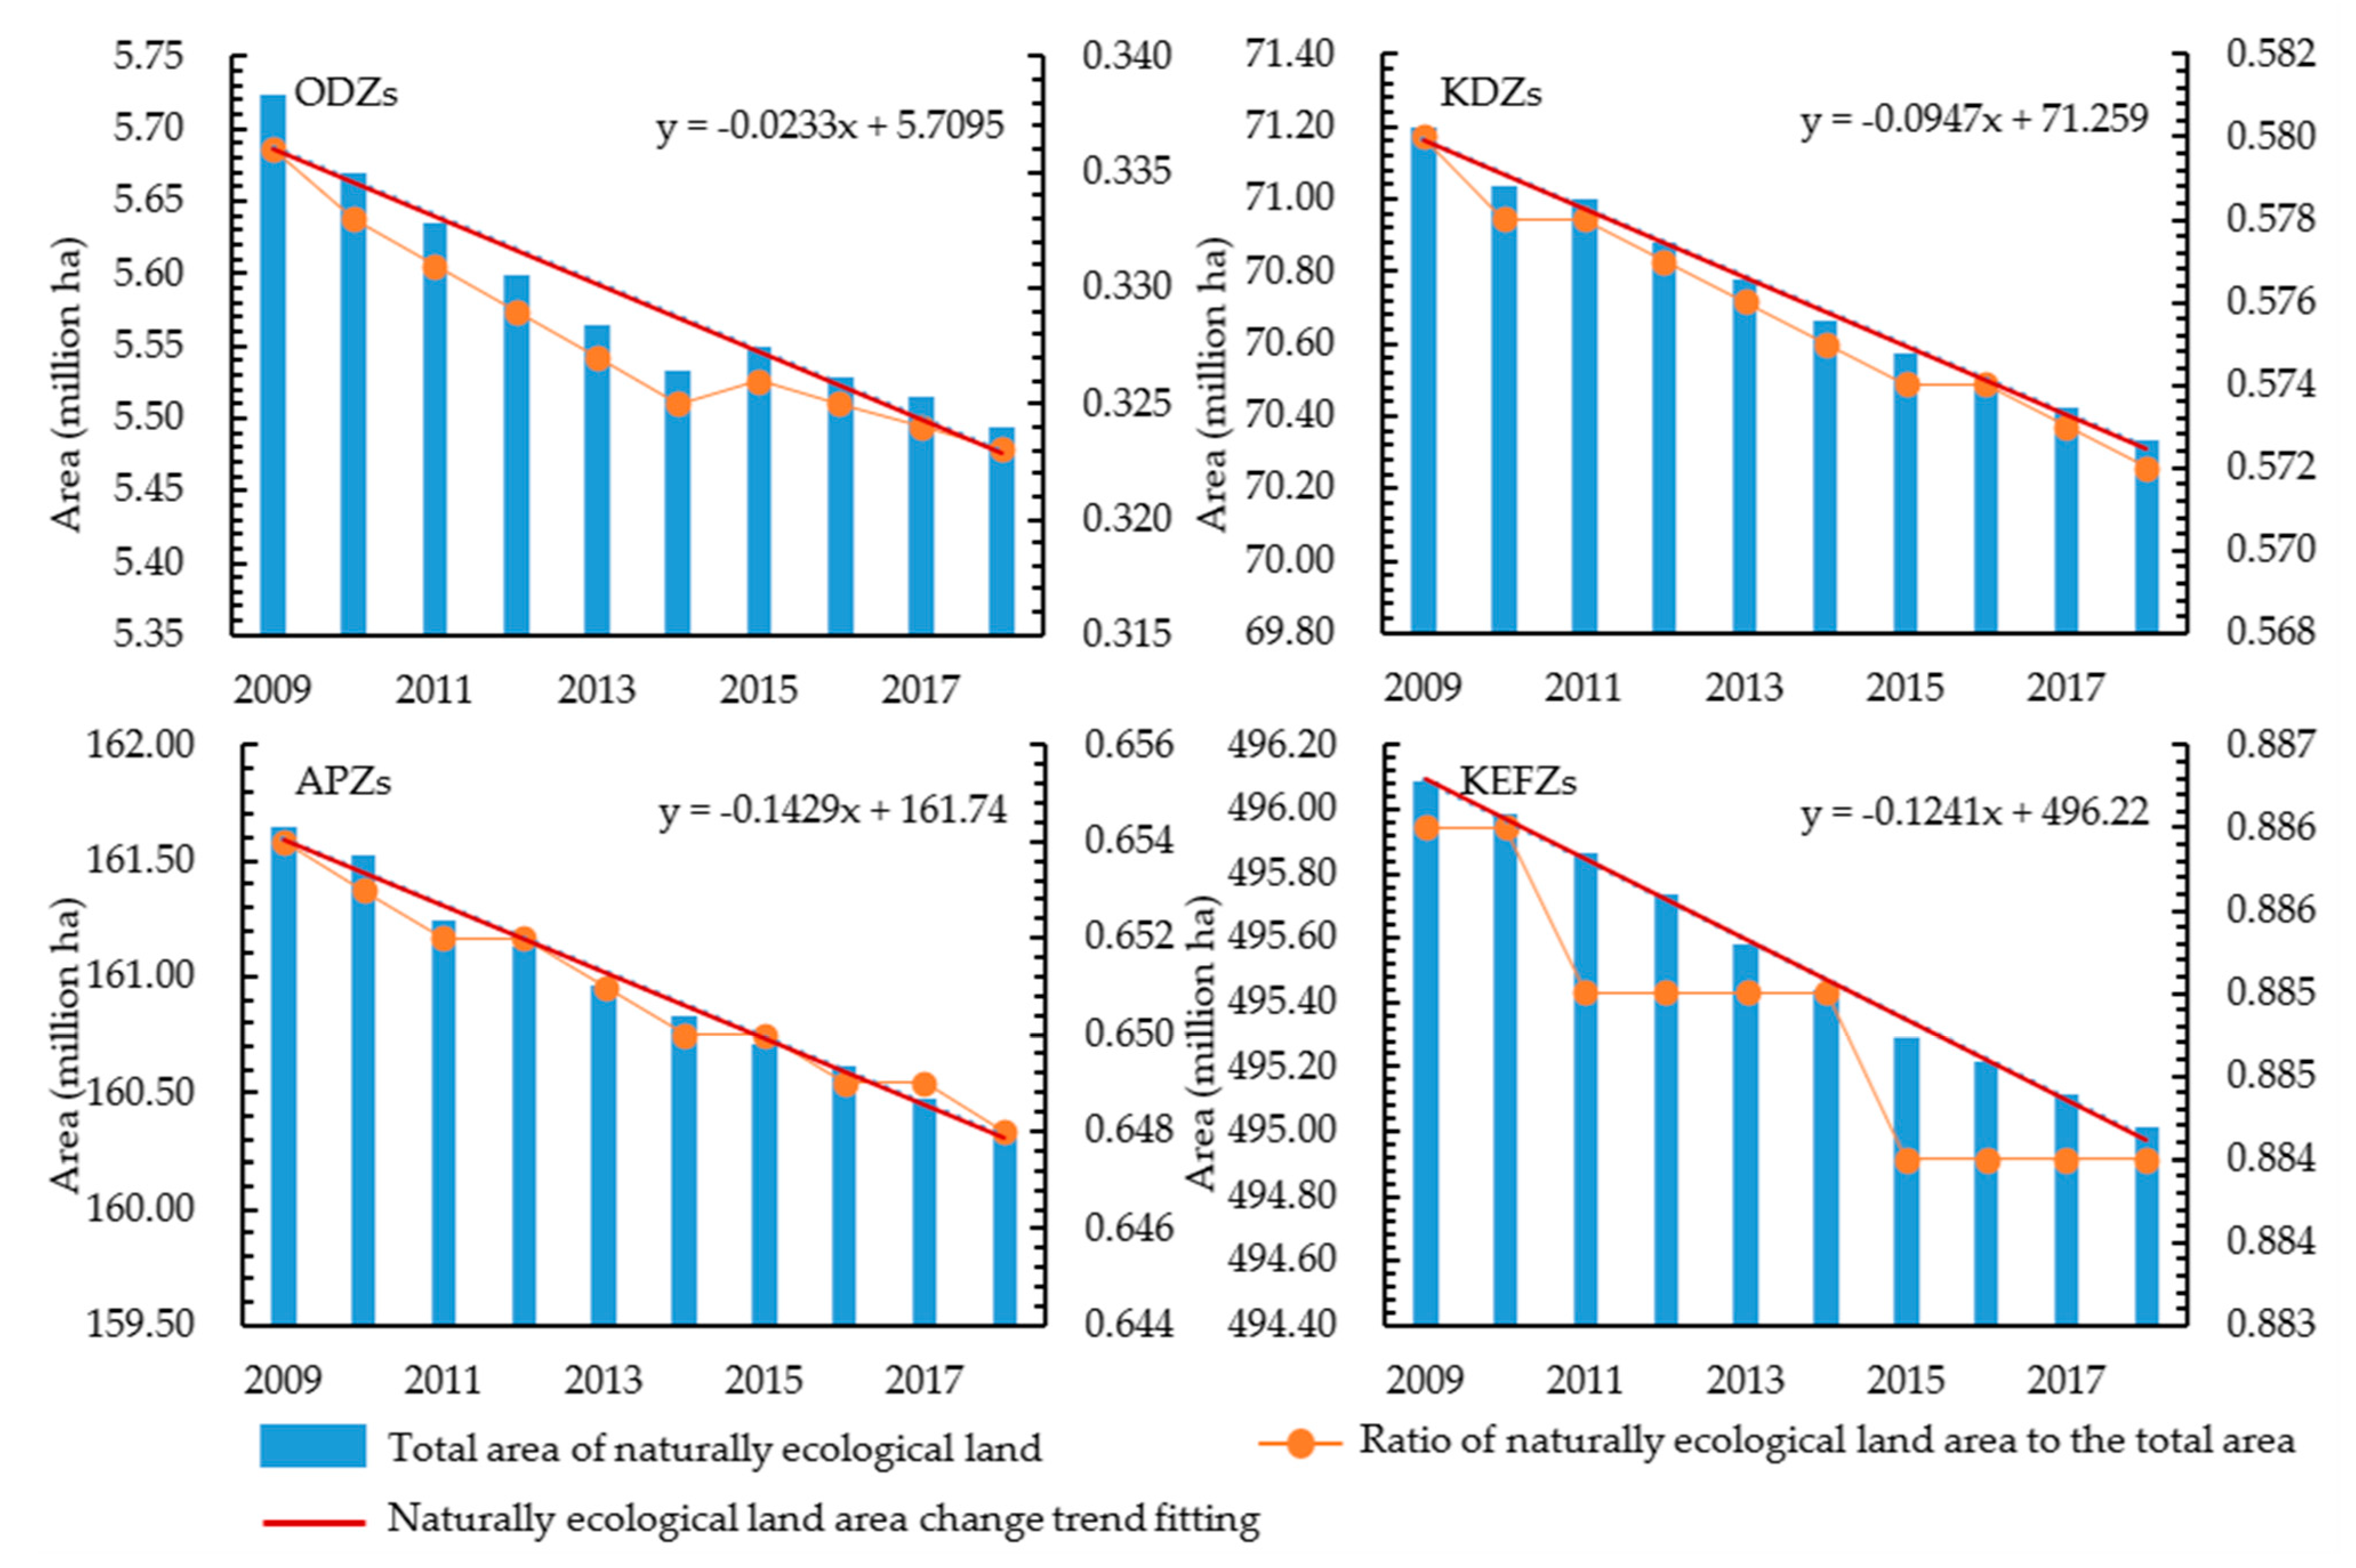
3.1. Spatiotemporal Characteristics of Ecological Land in MFOZ

We calculated the area and the change rates of ecological land in ODZs, KDZs, APZs, and KEFZs shown in Figure 1. Using the land use data from the 2nd National Land Use Survey from 2009 to 2018. The total area of ecological lands in ODZs, KDZs, APZs, and KEFZs was 5.49, 70.33, 160.35, and 495.02 (million ha), respectively in 2018 (Table 2). The area of ecological land was the least in ODZs.
Generally, the areas for all types of ecological land tend to decrease from the year 2009 to 2018 in all of MFOZs. The least decreasing rate was 0.22% in KEFZs, which implied that the national policy for KEFZs in MFOZs was effective for ecological protection. However, in ODZs, because of the rapid economic development, the decreasing rate of the ecological land area was the highest, up to 4%. Especially the forest land, and wetland showed a significant decrease in ODZs. This indicated the intense conflicts between economic development and maintaining ecological land in ODZs. The loss of ecological land was similar in KDZs and APZs, decreasing by 1.21% and 0.80%, respectively, while the decrease of forest land was the greatest in KDZs comparing with the other zones. KEFZs showed the smallest decrease in each ecological land.
The decrease of ecological land types was significant in KDZs, APZs, and KEFZs, especially in APZs, where the decreased area for each ecological land type was the largest, up to 1.30 million ha. The decreases of wetland were greater than the other types in ODZs, KDZs, and APZs, especially in ODZs. The large population, relatively high development intensity, and climate change were inducing the decrease of wet-land in ODZs where the decrease area of wetland from 2009 to 2018 was almost equal to the area of wetland in KDZs, but the original area of wetland in ODZs was much smaller than that in KDZs. The areas of forest land, grassland, and bare land noticeably decreased from 2009 to 2018 in APZs.
Figure 3 demonstrated the fraction and the changing rate of ecological land area from 2009 to 2018. It could be seen from Figure 3 that the area of the ecological land area was relatively large in the western and northwestern MFOZs as there was less human activity. The ecological land area in the ODZ was relatively less, the smallest area is 2 million ha in ODZs around Beijing, accounting for only 27% of the total area. As a whole, the ecological land area in the APZs and KEFZs was also comparatively large, which were significant ecological barriers in China. However, the fraction of ecological land was relatively less in the central regions which are mainly KDZs and APZs, such as KDZs around Zhengzhou and North of Shanghai, and APZs around Jinan and Zhengzhou. The fraction of ecological land of KEFZs was relatively higher than others.
The regions in which the ecological land area reduced were mainly located in North China, such as KDZs around Zhengzhou, and APZs around Jinan and Zhengzhou. In APZs around Jinan and Zhengzhou, where ecological land covered only 0.2% of the total region area, but the area had been reduced by nearly 0.1% since 2009; it was the largest proportion of all MFOZs. Ecological land in smaller patches of MFOZs always changed obviously, which reflected the relatively intense conflict over resources and the environment. In addition, it pre-sent-ed a pattern of distribution along the Hu Line. To the west of the Hu Line, the ecological land change was relatively stable, with an increase in some areas, such as KEFZs around Lhasa. On the contrary, the ecological land areas declined significantly in the east of the Hu Line.

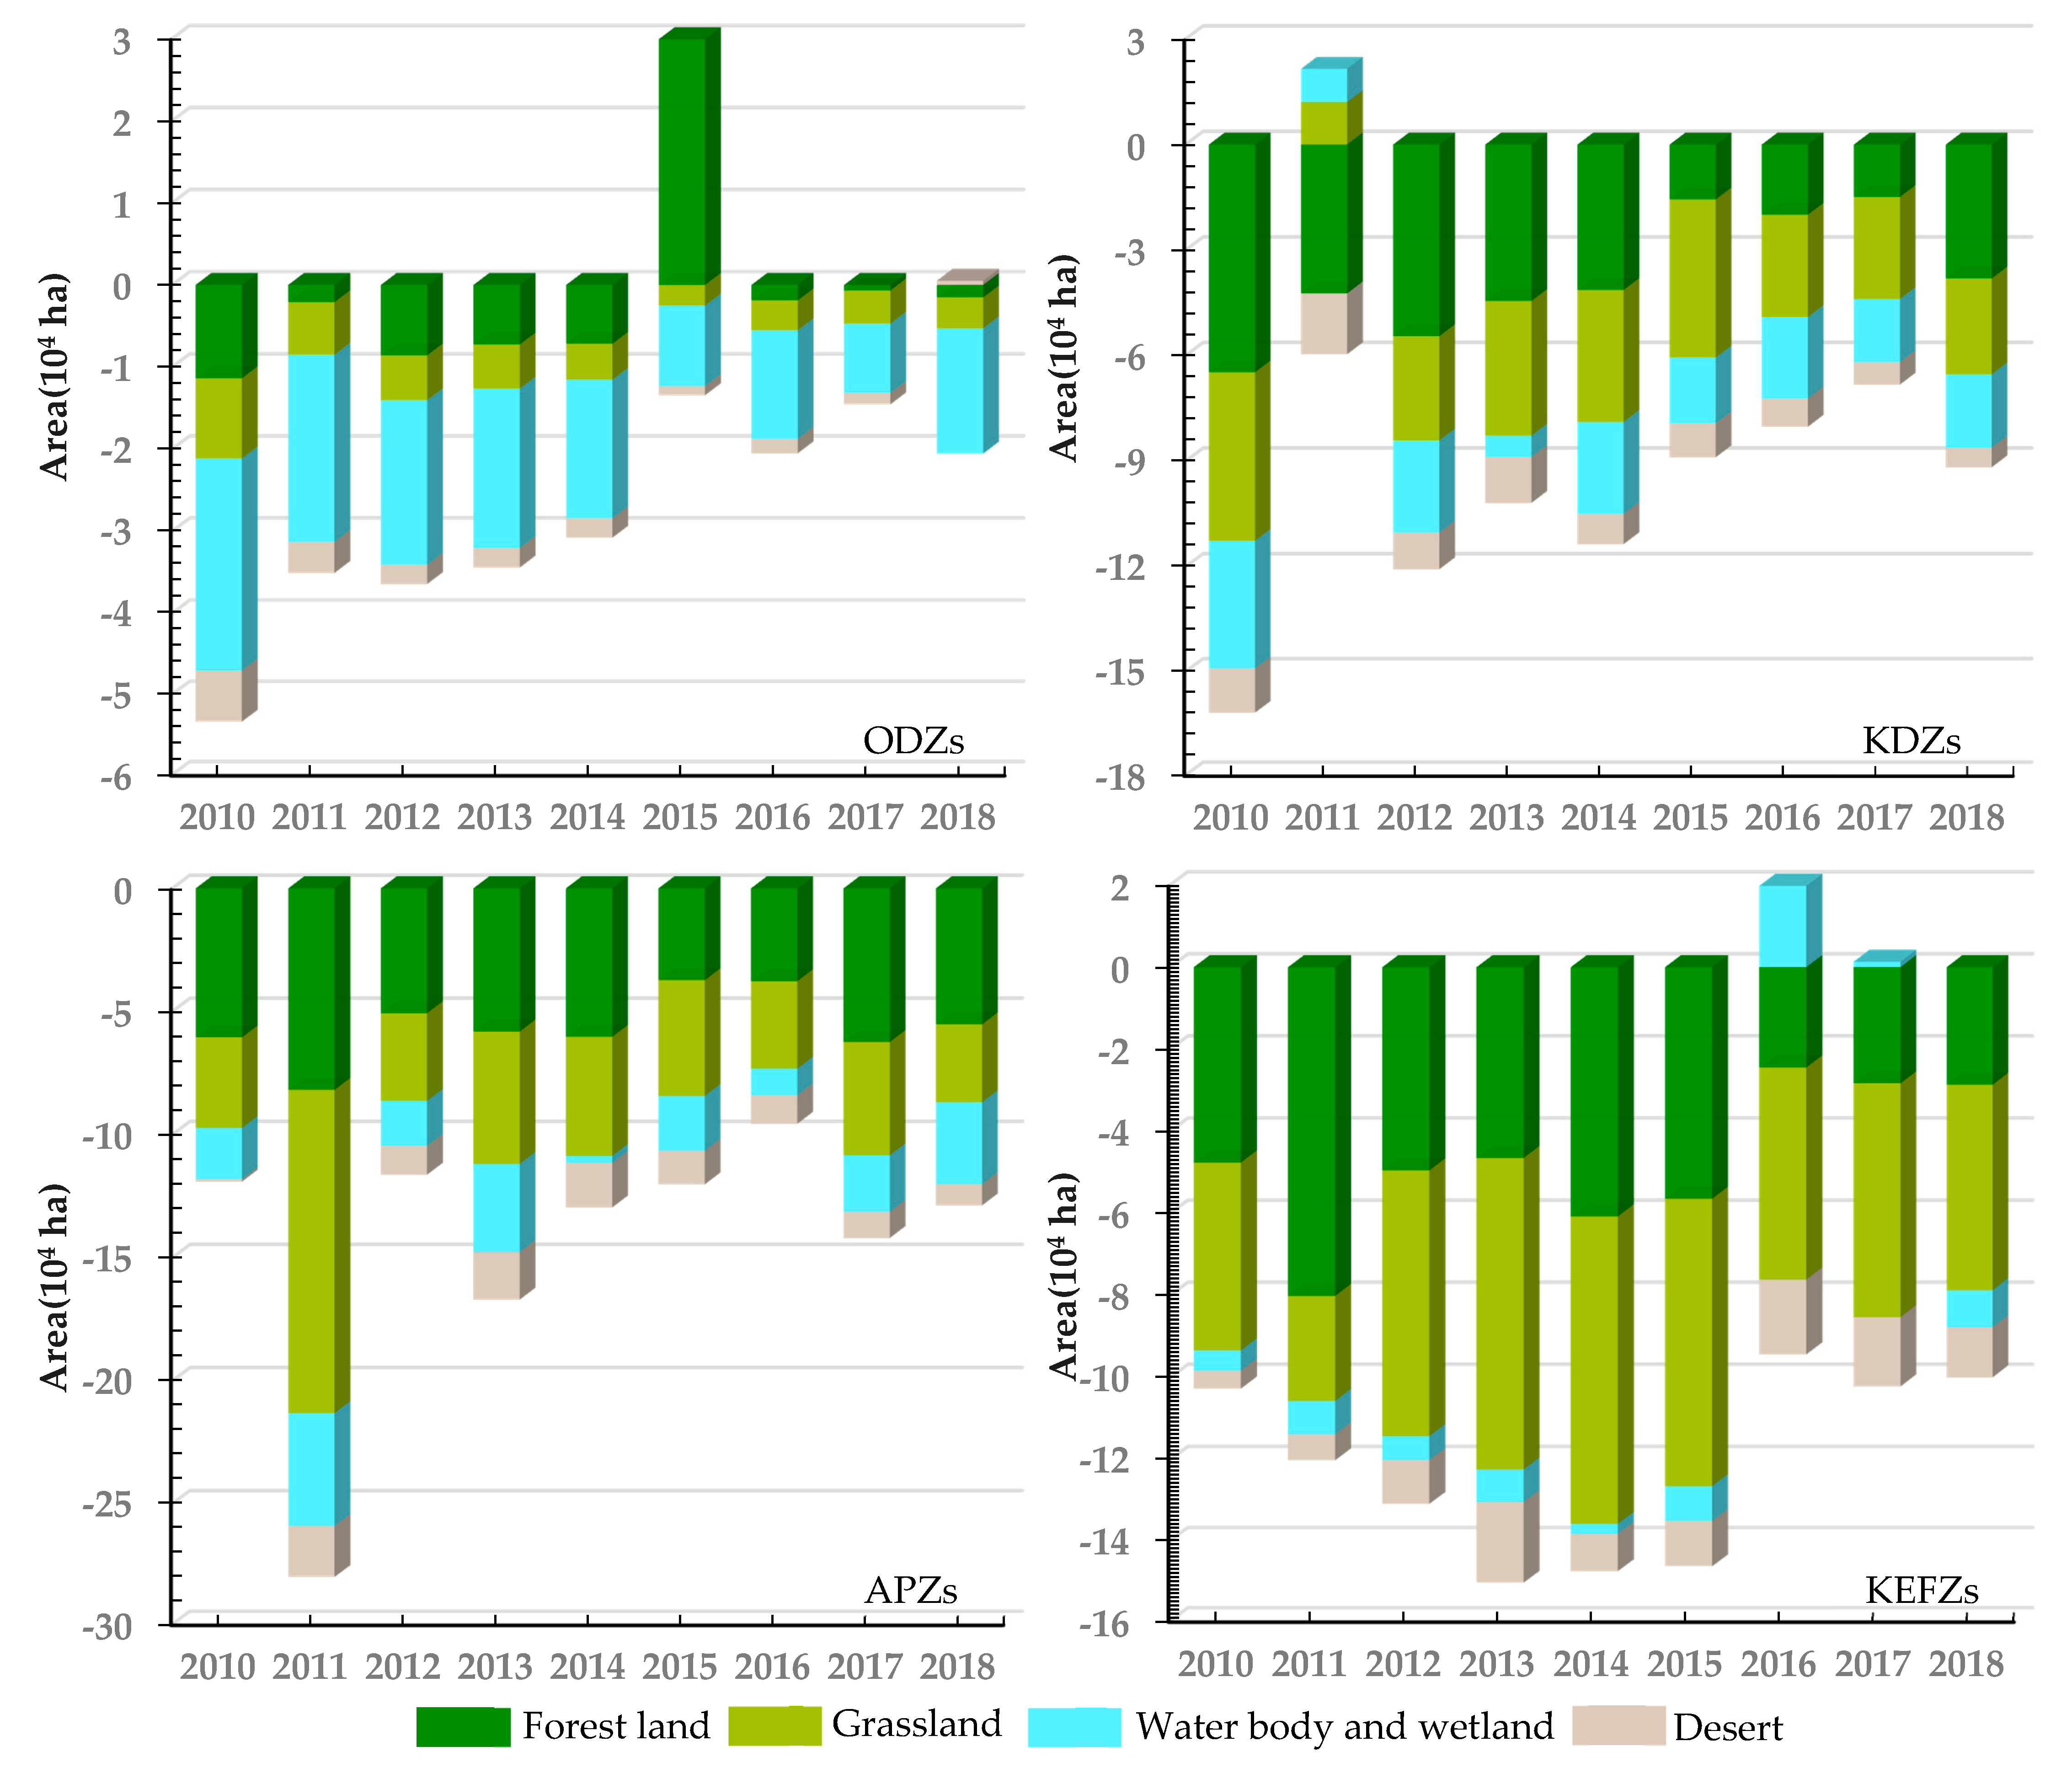
3.2. Changing of Ecological Land types

We calculated the yearly area change of each ecological land type from 2009 to 2018 in MFOZs by Equation (1) that is shown in Figure 4. It could be found from Figure 4 that the changes of ecological land from 2009 to 2018 showed the phasic changes in two phases: 2009–2015 and 2015–2018. The areas of forest land, grassland, wetland, and bare land decreased larger in the first phase of 2009–2015, whereas the declining area of these classes slowed down in the second phase of 2015–2018 in Figure 4. This was mostly due to the policy of nature ecology conservation and ecological restoration implemented greatly after 2015. In particular, the area of forest land in ODZs sharply in-creased in 2015 when a reforestation project was implemented. These results indicated that the development planning has shifted towards improving the ecological environment for sustainable development. Generally, the areas of forest land and grass-land decreased in each MFOZ, and the area of wetland declined greatly in ODZs.
Figure 5 shows the spatial variation of the change rate for each ecological type. The ecological land structure was different in each MFOZs mainly influenced by climatic conditions. Comparing with Figure 1, it could be seen that the forest land de-creased by 6.53% and 6.37% from 2009 to 2018 KDZs around Zhengzhou and APZs around Jinan and Zhengzhou, respectively. Interestingly, forest land area had significantly decreased in KEFZs around Lhasa which was always ecologically fragile [31]. This was due to the fact that the total area of the forest land was small, and a few changes would cause the overall ratio to change. Forest land had high biodiversity and multiple ecosystem services, which needed special protection in poor climatic conditions, especially in this area. Meanwhile, forest land area increased by 0.27% and 0.16% in ODZs around Beijing, and KDZs around the north of Nanjing (Figure 5a), which reflected relatively high efforts to protect the eco-environment in this area.
The area of grassland decreased in most regions, and the reduction area was mainly located in ODZs KDZs and APZs, such as ODZs around Shanghai and Guangzhou, KDZs around Hangzhou, Nanjing, Wuhan, Changsha, and APZs around Jinan and Zhengzhou. The decreasing trend of grassland needed to be taken into account in comparison with the forest land. It was worth mentioning that the grassland increased significantly in KEFZs around Hainan and north of Chengdu (Figure 5b).
Similar to the grassland, the area of the wetland had also decreased significantly in most regions, mainly in North China. The rate of wetland decreased by more than 15% in KDZs around Zhengzhou. It was different from other land classes that the area of wetland increased in some regions, especially in the west and southwest regions. The maximum growth rate took place in KEFZs around Hainan (Figure 5c).
The area of desert in most MFOZs has decreased. The obviously declined regions were ODZs around Guangzhou and Shanghai, KDZs around Taiyuan, Wuhan, Changsha, and Changsha, and APZs around Jinan and Zhengzhou. Meanwhile, the area of desert in some APZs and KEFZs had increased, such as KEFZs around Haikou, Harbin, and west and north of Chengdu, and APZs around Harbin, Changchun, and Shenyang. This might be evidence of ecological degradation.

3.3. Conversion Between Ecological Land and Non-Ecological Land

The interchanges of ecological land and non-ecological land were one of the references to investigate the reasons of ecological land changed. We calculated the disturbing rate (Ki) from ecological land type to non-ecological land type by Equation (2) in MFOZs, where the non-ecological land type used seven types including cropland, or-chard, residential land, mining land, land for transportation and streets, water body and water conservation facilities, and others land. Figure 6 presents the Ki for ODZs, KDZs, APZs, and KEFZs. Table 3 shows the area of changed ecological land from 2009 to 2018 in MFOZs.
Table 3 shows that the decreased areas of ecological land were much larger than the increased although there was some non-ecological land converted into ecological land, which resulted in the continuous reduction of ecological land. Especially the area of ecological land decrease in APZs was due to the double stresses from residential land expanding and cropland protection for food security.
Comparing Table 3 and Figure 6, cropland was the dominant category of ecological land change. Much ecological land was taken over by cropland, residential land, and land for transportation and streets. At the same time, a large amount of cropland was converted into ecological land, which indicated the aggravated conflicts among ecological protection, economic development, food production. The development of residential land was the main reason for the loss of ecological land in ODZs and KDZs. while cropland was the main occupation in APZs and KEFZs. The regional discrepancy of ecological land in MFOZs corresponded with the level of economic development and urbanization. On the other hand, the conversion between ecological land was also a consideration for each MFOZs construction and sustainable development in China. We tracked the changing evidence of ecological restoration that a lot of grasslands and wetland were converted into forest land in MFOZs, which might show that the quality of ecological land is upgrading (Figure 6).
Additionally, we calculated the transforming rate (Si) between forest land, grassland, wetland, and bare land using Equation (3). The transforming rate could reveal the intensity of ecological land internal changed. The transforming rate was higher in ODZs and KDZs, such as ODZs around Shanghai, and Beijing, KDZs around Nanjing, Wuhan, Changsha, and Guiyang (Figure 7b) which revealed that some ecological protection projects had been carried out in these areas to improve the quality of ecological land [32,33]. The ecological land disturbed rate (Ki) was also relatively high in KDZs around Yinchuan (Figure 7a) which revealed that both construction and agricultural occupation and ecological degradation occurred in this area at the same time. In addition, it was a concern that ecological degradation had occurred in KEFZs around Hainan by comparing Figure 7a, Figure 7b and Figure 5. Some ecological lands were converted into bare land in KEFZs.

4. Discussion

On the whole, the area of ecological land was basically stable in each MFOZs. The total area of ecological land reduces from 734.65 to 731.19 (million ha), a total decrease of 0.47% since 2009. The slope of the ecological land area trend fitting was the largest in APZs, and the smallest in ODZs (Figure 8), which indicated annual decline area was the greatest in APZs. However, due to the larger total area, the proportion of ecological land to the total area had only decreased by 0.6% in APZs. Contrary to this, the area of ODZs only dropped by 0.23 (million ha), and the rate of the total area was as much as 1.2%.
Furthermore, the area of forest land showed an increased direction in ODZs and KDZs, which are relatively developed, with relatively high eco-environmental needs and restoration capacity. For example, ODZs around Beijing implemented a one-million-mu afforestation plan in 2014, which is the reason that the forest land increased in 2015 (Figure 8). However, there are still problems of occupation and degradation of ecological land which was mainly manifested in the transformation of large amounts of ecological land into non-ecological lands and the degradation of ecological land, especially in APZs which face double pressures from rural-urban construction land for economic development and cropland for food production. Cropland is the maximum flow direction, which is makes clear the problems and deviations of ‘Equilibrium Requisition Compensation of Cropland’ [2,5,32,33].
To probe the changes of ecological land in APZs obtained above, we calculated the changing area for each ecological land in APZs from 2009 to 2018 (Figure 9). We could see from Figure 9 that forest land and grassland declined in all APZs. The area of forest land had decreased more than 100,000 ha in APZs around Wuhan, Jinan, and Nanning. The area of grassland had decreased mostly in the APZs around Harbin, the decline area was 147090 ha. The wetland area had increased in APZs around Urumqi and Nanning. The APZs around Jinan as the region lacking water resources, the wetland area has decreased the most, reaching 107432 ha. The bare land area had basically decreased, except for the APZs around Harbin.
Overall, the APZs, mosaicking in the agriculture region, were severely affected by human disturbance, especially in APZs around Jinan, Wuhan, and Harbin. Forest land and grassland are the main types of reduction. It was, therefore, necessary to further strengthen the management and control. This result was also consistent with the research of colleagues Yan et al. and Ning et al. [8,9,10,11,12,13,14,15,16,17,18,19,20,21,22,23,24,25,26,27,28,29,30,31,32,33,34].

5. Conclusions

The function-oriented regional planning highly needs the knowledge of the spatiotemporal features of ecological environments and artificial developments for the planned regions. The long-term land use data have great potential to be applied in the investigations of ecological features and change for regional planning which assists the government in regulation and reshapes of the function-oriented planning regions. We introduced MFOZs as the investigating regions for the spatiotemporal features of ecological lands using the long-term land use data from the Second National Land Use Survey to address the rate of change, disturbing rate of ecological land, and transformed rate between ecological land types and non-ecological land in MFOZs. The results can be concluded as follows.
(1) The area of ecological lands generally tended to decrease from 2009 to 2018 due to the natural stresses and artificial impacts. The decrease of forest land area significantly tended to be zero in 2018 in ODZs while the decreases of ecological lands still lasted in KDZs, APZs, and KEFZs each year.
(2) The changes of ecological lands from 2009 to 2018 showed two-phase changes, the first phase from 2009 to 2015 and the second phase from 2015 to 2018 when the decreasing trend of ecological lands slowed down especially in ODZs. This result was induced by the adjustments and reinforcements of national environmental protection policy after 2015, and imply the decreases of ecological land areas have been controlling with the implementation of governmental policies for environment protection and ecological projects.
(3) The decreased areas of ecological lands were mostly converted into cropland, residential land, and land for transportation and streets from 2008 to 2019. On the other side, the forest lands were mostly changed from cropland and grassland in KDZs, APZs, and KEFZs which indicated the grassland conversed in afforestation during this period.
Using the land use data, which could be obtained by satellite remote sensing observing data each year, we can not only better understand the current spatiotemporal characteristics of ecological land, and their changes, but detect the reasons for the increase or decrease of ecological land. Finally, a monitoring system for ecological land should be built to support the government’s spatial regulation design, reshape the planned regions, and make policies for environmental restoration and protection.

Author Contributions

Conceptualization, Zhijie Zhang, Yuanjie Zhang and Xiao Yu; methodology, Zhijie Zhang, Yuanjie Zhang and Xiao Yu, software, Zhijie Zhang, validation, Zhijie Zhang, and Yuanjie Zhang; formal analysis, Zhijie Zhang, Yuanjie Zhang and Xiao Yu; resources, Yuqi Chen, Liping Lei and Xudong Guo; data curation, Yuqi Chen, Liping Lei and Xudong Guo; writing—original draft preparation, Zhijie Zhang, writing—review and editing, Zhijie Zhang, Yuanjie Zhang and Xiao Yu; visualization, Zhijie Zhang, supervision, Yuqi Chen, Liping Lei and Xudong Guo; project administration, Yuqi Chen, Liping Lei and Xudong Guo; funding acquisition, Yuqi Chen and Xudong Guo. All authors have read and agreed to the published version of the manuscript.

Funding

This research was financially supported by the National Key Research and Development Program of China (2018YFD1100103), Land Survey and Evaluation Project of the Ministry of Natural Resources: Land Ecological Status Survey and Evaluation (DCPJ171510-01).

Institutional Review Board Statement

Not applicable.

Informed Consent Statement

Not applicable.

Data Availability Statement

The data presented in this study are available from the author upon reasonable request.

Acknowledgments

Special thanks are given to the anonymous reviewers and editors for their constructive comments.

Conflicts of Interest

The authors declare no conflict of interest.

References

  1. Li, D.; Xu, E.; Zhang, H. Influence of ecological land change on wind erosion prevention service in arid area of northwest China from 1990 to 2015. Ecol. Indic. 2020, 117, 106686. [Google Scholar] [CrossRef]
  2. Guo, X.; Chang, Q.; Liu, X.; Bao, H.; Zhang, Y.; Tu, X.; Zhu, C.; Lv, C.; Zhang, Y. Multi-dimensional eco-land classification and management for implementing the ecological redline policy in China. Land Use Policy 2018, 74, 15–31. [Google Scholar] [CrossRef]
  3. Yu, F.; Li, X.; Zhang, L.; Xu, W.; Fu, R.; Wang, H. Study of Ecological Land in China: Conception, Classification, and Spatial-temporal Pattern. Acta Ecol. Sin. 2015, 35, 4931–4943. [Google Scholar] [CrossRef] [Green Version]
  4. Chen, Y.; Zhang, Z.; Guo, X.; Lv, C.; Wang, X. Spatial-temporal Analysis on Ecological Land Changes in the Key Ecological Functional Areas in China. China Land Sci. 2015, 32, 19–26. [Google Scholar] [CrossRef]
  5. Wang, J.; He, T.; Lin, Y. Changes in ecological, agricultural, and urban land space in 1984–2012 in China: Land policies and regional social-economical drivers. Habitat Int. 2018, 71, 1–13. [Google Scholar] [CrossRef]
  6. Kopmann, A.; Rehdanz, K. A human well-being approach for assessing the value of natural land areas. Ecol. Econ. 2013, 93, 20–33. [Google Scholar] [CrossRef]
  7. Chiarenza, G.M. A blueprint for a methodology to balance land-use in semi-natural areas. J. Environ. Plan. Manag. 2020, 63, 2246–2264. [Google Scholar] [CrossRef]
  8. Yan, H.; Liu, F.; Liu, J.; Xiao, X.; Qin, Y. Status of land use intensity in China and its impacts on land carrying capacity. J. Geogr. Sci. 2017, 27. [Google Scholar] [CrossRef] [Green Version]
  9. Wu, K.-Y.; Ye, X.-Y.; Qi, Z.-F.; Zhang, H. Impacts of land use/land cover change and socioeconomic development on regional ecosystem services: The case of fast-growing Hangzhou metropolitan area, China. Cities 2013, 31, 276–284. [Google Scholar] [CrossRef]
  10. Kenneweg, W.H. Landscape response functions for biodiversity—Assessing the impact of land-use changes at the county level. Landsc. Urban Plan. 2004, 67, 157–172. [Google Scholar] [CrossRef]
  11. Quintas-Soriano, C.; Castro, A.J.; Castro, H.; García-Llorente, M. Impacts of land use change on ecosystem services and implications for human well-being in Spanish drylands. Land Use Policy 2016, 54, 534–548. [Google Scholar] [CrossRef]
  12. Chuai, X.; Huang, X.; Wu, C.; Li, J.; Lu, Q.; Qi, X.; Zhang, M.; Zuo, T.; Lu, J. Land use and ecosystems services value changes and ecological land management in coastal Jiangsu, China. Habitat Int. 2016, 57, 164–174. [Google Scholar] [CrossRef]
  13. Bai, Y.; Jiang, B.; Wang, M.; Li, H.; Alatalo, J.M.; Huang, S.F. New ecological redline policy (ERP) to secure ecosystem services in China. Land Use Policy 2016, 55, 348–351. [Google Scholar] [CrossRef] [Green Version]
  14. Hu, Y.; Zhen, L.; Zhuang, D. Assessment of Land-Use and Land-Cover Change in Guangxi, China. Sci. Rep. 2019, 9, 2189. [Google Scholar] [CrossRef] [PubMed] [Green Version]
  15. Zhang, Y.; Chang, Q.; Guo, X. Management-oriented ecological land’s conception and multi-dimensional classification system in China. Acta Ecol. Sin. 2016, 36, 3655–3665. [Google Scholar] [CrossRef]
  16. Sims, R.A.; Corns, I.G.W.; Klinka, K. Introduction-Global to local: Ecological land classification. Environ. Monitor. Assess 1996, 39, 1–10. [Google Scholar] [CrossRef] [PubMed]
  17. Bunce, R.G.H.; Barr, C.J.; Gillespie, M.K.; Howard, D.C. The ITE land classification: Providing an environmental stratification of Great Britain. Environ. Monitor. Assess 1996, 39, 39–46. [Google Scholar] [CrossRef]
  18. Dong, Y.W.; Zhou, W.; Zhou, L.; Zhou, H. Study on ecological protection of urbanization area: A case study of Nanjing, Jiangsu. Urban Res. 1999, 75, 6–8. [Google Scholar]
  19. Sun, X.; Lei, G.; Hai, R.; Ye, Y.; Li, A.; Mark, S.S.; Connor, J.D.; Wu, J.; Bryan, B.A. China’s progress towards sustainable land development and ecological civilization. Landsc. Ecol. 2018, 33, 1647–1653. [Google Scholar] [CrossRef]
  20. Zou, L.; Liu, Y.; Yang, J.; Yang, S.; Hu, X. Quantitative identification and spatial analysis of land use ecological-production-living functions in rural areas on China’s southeast coast. Habitat Int. 2020, 100, 102182. [Google Scholar] [CrossRef]
  21. Shi, G.; Jiang, N.; Yao, L.Q. Land Use and Cover Change during the Rapid Economic Growth Period from 1990 to 2010: A Case Study of Shanghai. Sustainability 2018, 10, 426. [Google Scholar] [CrossRef] [Green Version]
  22. Gao, C.; Feng, Y.; Tong, X.; Jin, Y.; Gu, C. Modeling urban encroachment on ecological land using cellular automata and cross-entropy optimization rules. Sci. Total Environ. 2020, 744, 140996. [Google Scholar] [CrossRef] [PubMed]
  23. Li, G.; Jiang, C.; Du, J.; Jia, Y.; Bai, J. Spatial differentiation characteristics of internal ecological land structure in rural settlements and its response to natural and socio-economic conditions in the Central Plains, China. Sci. Total Environ. 2020, 709, 135932. [Google Scholar] [CrossRef] [PubMed]
  24. Fan, J.; Sun, W.; Yang, Z.S.; Fan, P.; Chen, D. Focusing on the major function-oriented zone: A new spatial planning approach and practice in China and its 12th Five-Year Plan. Asia Pac. Viewp. 2012, 53, 86–96. [Google Scholar] [CrossRef]
  25. Fan, J.; Li, P.X. The scientific foundation of Major Function Oriented Zoning in China. J. Geogr. Sci. 2009, 19, 515–531. [Google Scholar] [CrossRef]
  26. Zhang, C.; Su, Y.; Yang, G.; Chen, D.; Yang, R. Spatial-Temporal Characteristics of Cultivated Land Use Efficiency in Major Function-Oriented Zones: A Case Study of Zhejiang Province, China. Land 2020, 9, 114. [Google Scholar] [CrossRef]
  27. Xia, H.; Zhang, W.; He, L.; Ma, M.; Peng, H.; Li, L.; Ke, Q.; Hang, P.; Wang, X.T. Assessment on China’s urbanization after the implementation of main functional areas planning. J. Environ. Manag. 2020, 264, 110381. [Google Scholar] [CrossRef] [PubMed]
  28. Tan, M. Uneven growth of urban clusters in megaregions and its policy implications for new urbanization in China. Land Use Policy 2017, 66, 72–79. [Google Scholar] [CrossRef]
  29. Liu, W.C.; Liu, J.Y.; Kuang, W.H.; Jia, N. Examining the influence of the implementation of Major Function-oriented Zones on built-up area expansion in China. J. Geogr. Sci. 2017, 27, 643–660. [Google Scholar] [CrossRef]
  30. Fan, J. Draft of major function oriented zoning of China. J. Geogr. Sci. 2015, 70, 186–201. [Google Scholar] [CrossRef]
  31. Wang, H.; Peng, P.; Kong, X.; Zhang, T.; Yi, G. Vegetation dynamic analysis based on multisource remote sensing data in the east margin of the Qinghai-Tibet Plateau, China. Peerj 2019, 7, e8223. [Google Scholar] [CrossRef] [PubMed] [Green Version]
  32. Xie, Z.H. China’s historical evolution of environmental protection along with the forty years’ reform and opening-up. Environ. Sci. Ecotechnol. 2020, 1, 100001. [Google Scholar] [CrossRef]
  33. Liu, Y.; Fang, F.; Li, Y. Key issues of land use in China and implications for policy making. Land Use Policy 2014, 40, 6–12. [Google Scholar] [CrossRef]
  34. Ning, J.; Liu, J.; Kuang, W.; Xu, X.; Zhang, S.; Yan, C.; Li, R.; Wu, S.; Hu, Y.; Du, G.; et al. Spatiotemporal patterns and characteristics of land-use change in China during 2010–2015. J. Geogr. Sci. 2018, 28, 547–562. [Google Scholar] [CrossRef] [Green Version]
Figure 1. Major Function-oriented Zones (MFOZs) of China (V1.0), where ODZs stand for optimal development zones, KDZs stand for key development zones, APZs stand for agricultural production zones, KEFZs stand for key ecological function zones. According to management, MFOZs divide into the national and provincial levels.
Ijgi 10 00172 g001
Figure 2. Flow chat of evaluating the spatiotemporal changes of ecological land in MFOZs.
Ijgi 10 00172 g002
Figure 3. Fraction and the changing rate of ecological land area in MFOZs. (a) the fraction of ecological land area in 2018; (b) the changing rate of ecological land area from 2009 to 2018.
Ijgi 10 00172 g003
Figure 4. The changed area of ecological lands types from 2009 to 2018 in ODZs, KDZs, APZs and KEFZs.
Ijgi 10 00172 g004
Figure 5. The spatial distribution of the rate of change for ecological land types in MFOZs from 2009 to 2018. (a) Forest land; (b) Grassland; (c)Wetland; (d) Bare land.
Ijgi 10 00172 g005
Figure 6. The proportion and types of ecological land conversion from 2009 to 2018 where the red line is the rate of increase area, the blue line is the rate of decrease area; the above four figures show the exchange between non-ecological land and ecological land, the following four pictures show the internal conversion of ecological land; 01: cropland, 02: orchard, 03: forest land, 04: grassland, 10: land for transportation and streets, 20: residential land, 204: mining land, 11: wetland, 118: water body and water conservations facilities, 120: other land, 126: bare land.
Ijgi 10 00172 g006
Figure 7. The spatial distribution of disturbed rate (a) and transforming rate (b) in MFOZs from 2009 to 2018.
Ijgi 10 00172 g007
Figure 8. Changes area of naturally ecological land in in MFOZs from 2009 to 2018.
Ijgi 10 00172 g008
Figure 9. Change area for each ecological land in APZs from 2009 to 2018. (a) Forest land; (b) Grassland; (c)Wetland; (d) Bare land.
Ijgi 10 00172 g009
Table 1. Classification of ecological land according to the 2nd National Land Use Survey Data.
Ecological Land ClassThe 2nd National Land Use Survey Class
Forest landWoodland, Shrubbery land, Sparsely forested woodland
GrasslandNatural pasture land, Cultivated pasture land, Other grasslands
WetlandRiver, Lake, Reservoir, Pond, Beach and tidal flat, Inland mudflat, Glaciers and permanent snow, Swamp and marsh
Bare landDesert, Barren land
Table 2. The areas and changes of ecological land in MFOZs from 2009 to 2019.
ZoneForest LandGrasslandWetlandBare LandTotal
ODZs2009 (million ha)2.800.362.450.115.72
2018 (million ha)2.790.322.300.095.49
D-value (million ha)−0.01−0.04−0.15−0.02−0.23
change rate (%)−0.37−12.46−6.19−18.80−4.00
KDZs2009 (million ha)36.8922.936.824.5771.20
2018 (million ha)36.5522.666.654.4870.33
D-value (million ha)−0.34−0.27−0.17−0.09−0.87
change rate (%)−0.91−1.18−2.44−2.01−1.22
APZs2009 (million ha)66.0952.2611.7031.59161.65
2018 (million ha)65.5951.8011.4931.48160.35
D-value (million ha)−0.50−0.46−0.21−0.11−1.30
change rate (%)−0.76−0.89−1.83−0.36−0.80
KEFZs2009 (million ha)148.18211.7820.20115.93496.09
2018 (million ha)147.76211.2620.17115.83495.02
D-value (million ha)−0.42−0.52−0.03−0.10−1.07
change rate (%)−0.28−0.24−0.13−0.09−0.22
Table 3. Statistics of ecological land changed area from 2009 to 2018 in MFOZs.
Major Function
Oriented Zones
Forest Land
(ha)
Grassland
(ha)
Wetland
(ha)
Bare Land
(ha)
Total
(ha)
ODZsIncrease17,389.864861.5320,151.652630.4845,033.52
Decrease74,390.6553,532.73183,126.3125,733.84336,783.53
KDZsIncrease60,452.2068,807.4750,929.2113,387.30193,576.18
Decrease467,412.48381,144.06263,469.34102,387.661,214,413.54
APZsIncrease46,090.9769,150.1756,517.7523,799.21195,558.10
Decrease483,568.78443,179.01243,423.98137,306.771,307,478.54
KEFZsIncrease75,413.99112,414.5757,184.0723,499.71268,512.34
Decrease445,736.49654,134.89104,114.78138,991.281,342,977.44
Publisher’s Note: MDPI stays neutral with regard to jurisdictional claims in published maps and institutional affiliations.

