
Evolution of the Beaches in the Regional Park of Salinas and Arenales of San Pedro del Pinatar (Southeast of Spain) (1899–2019)


 and
and
Abstract
:1. Introduction
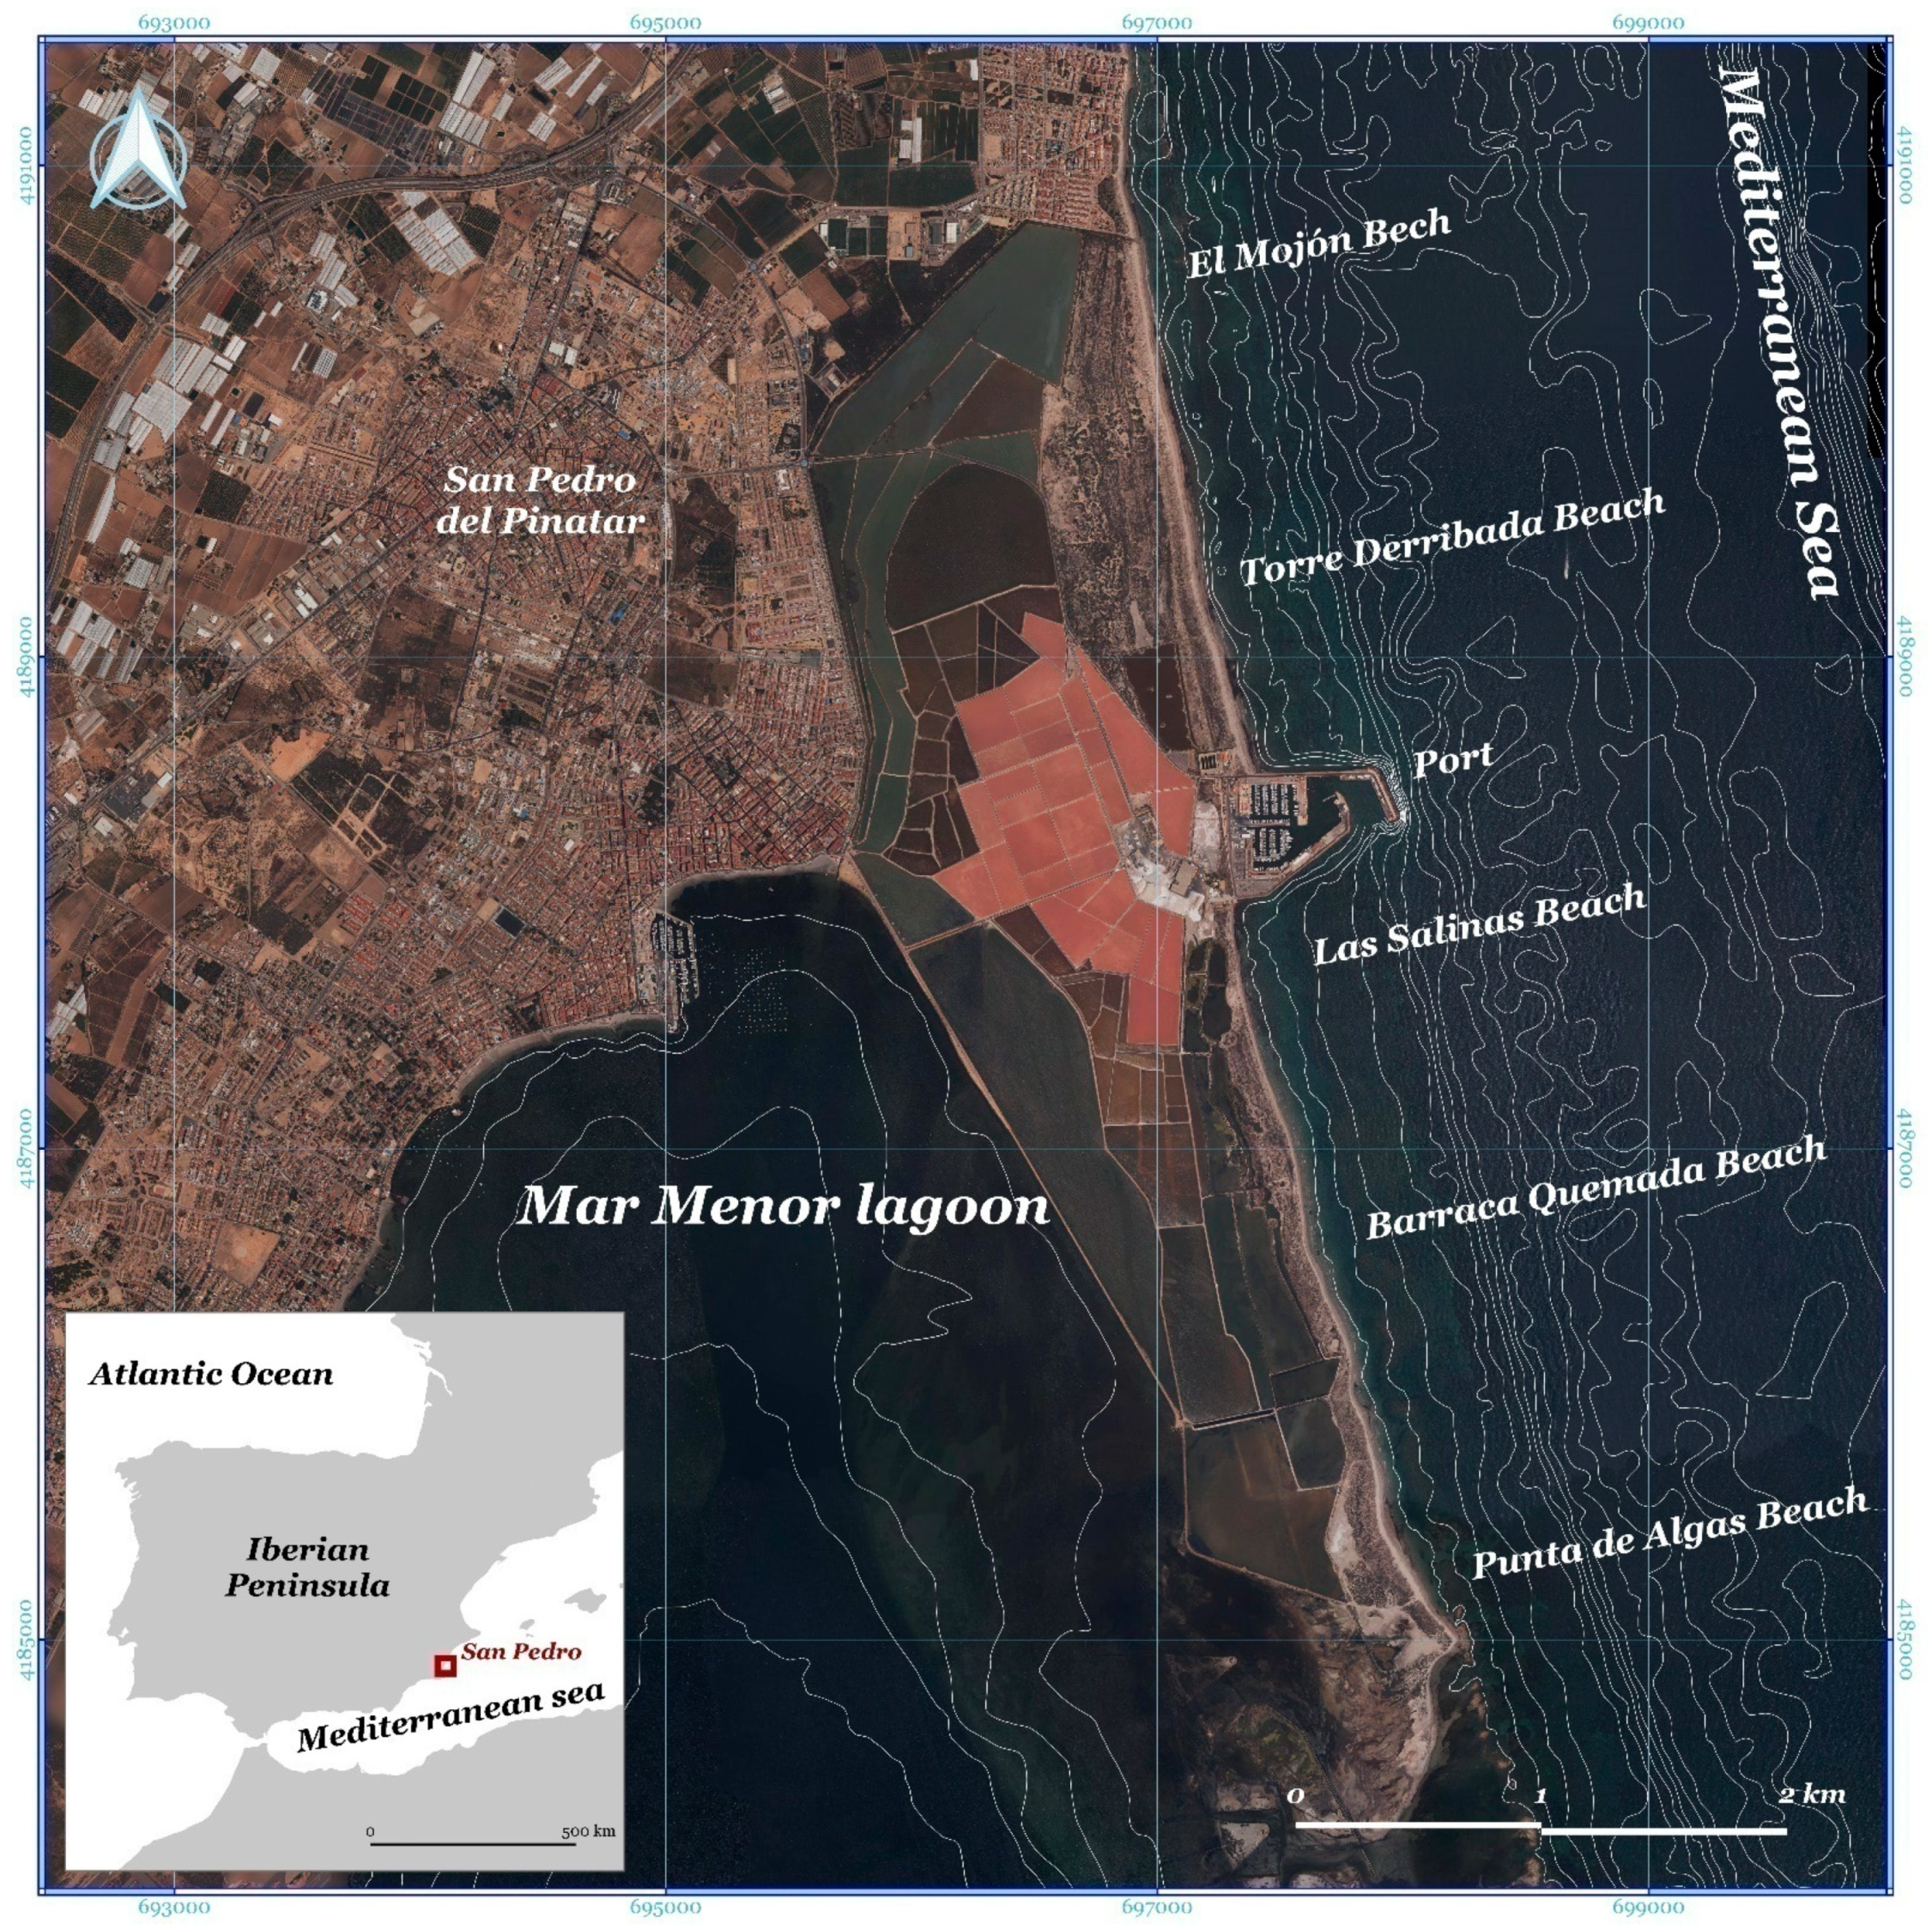
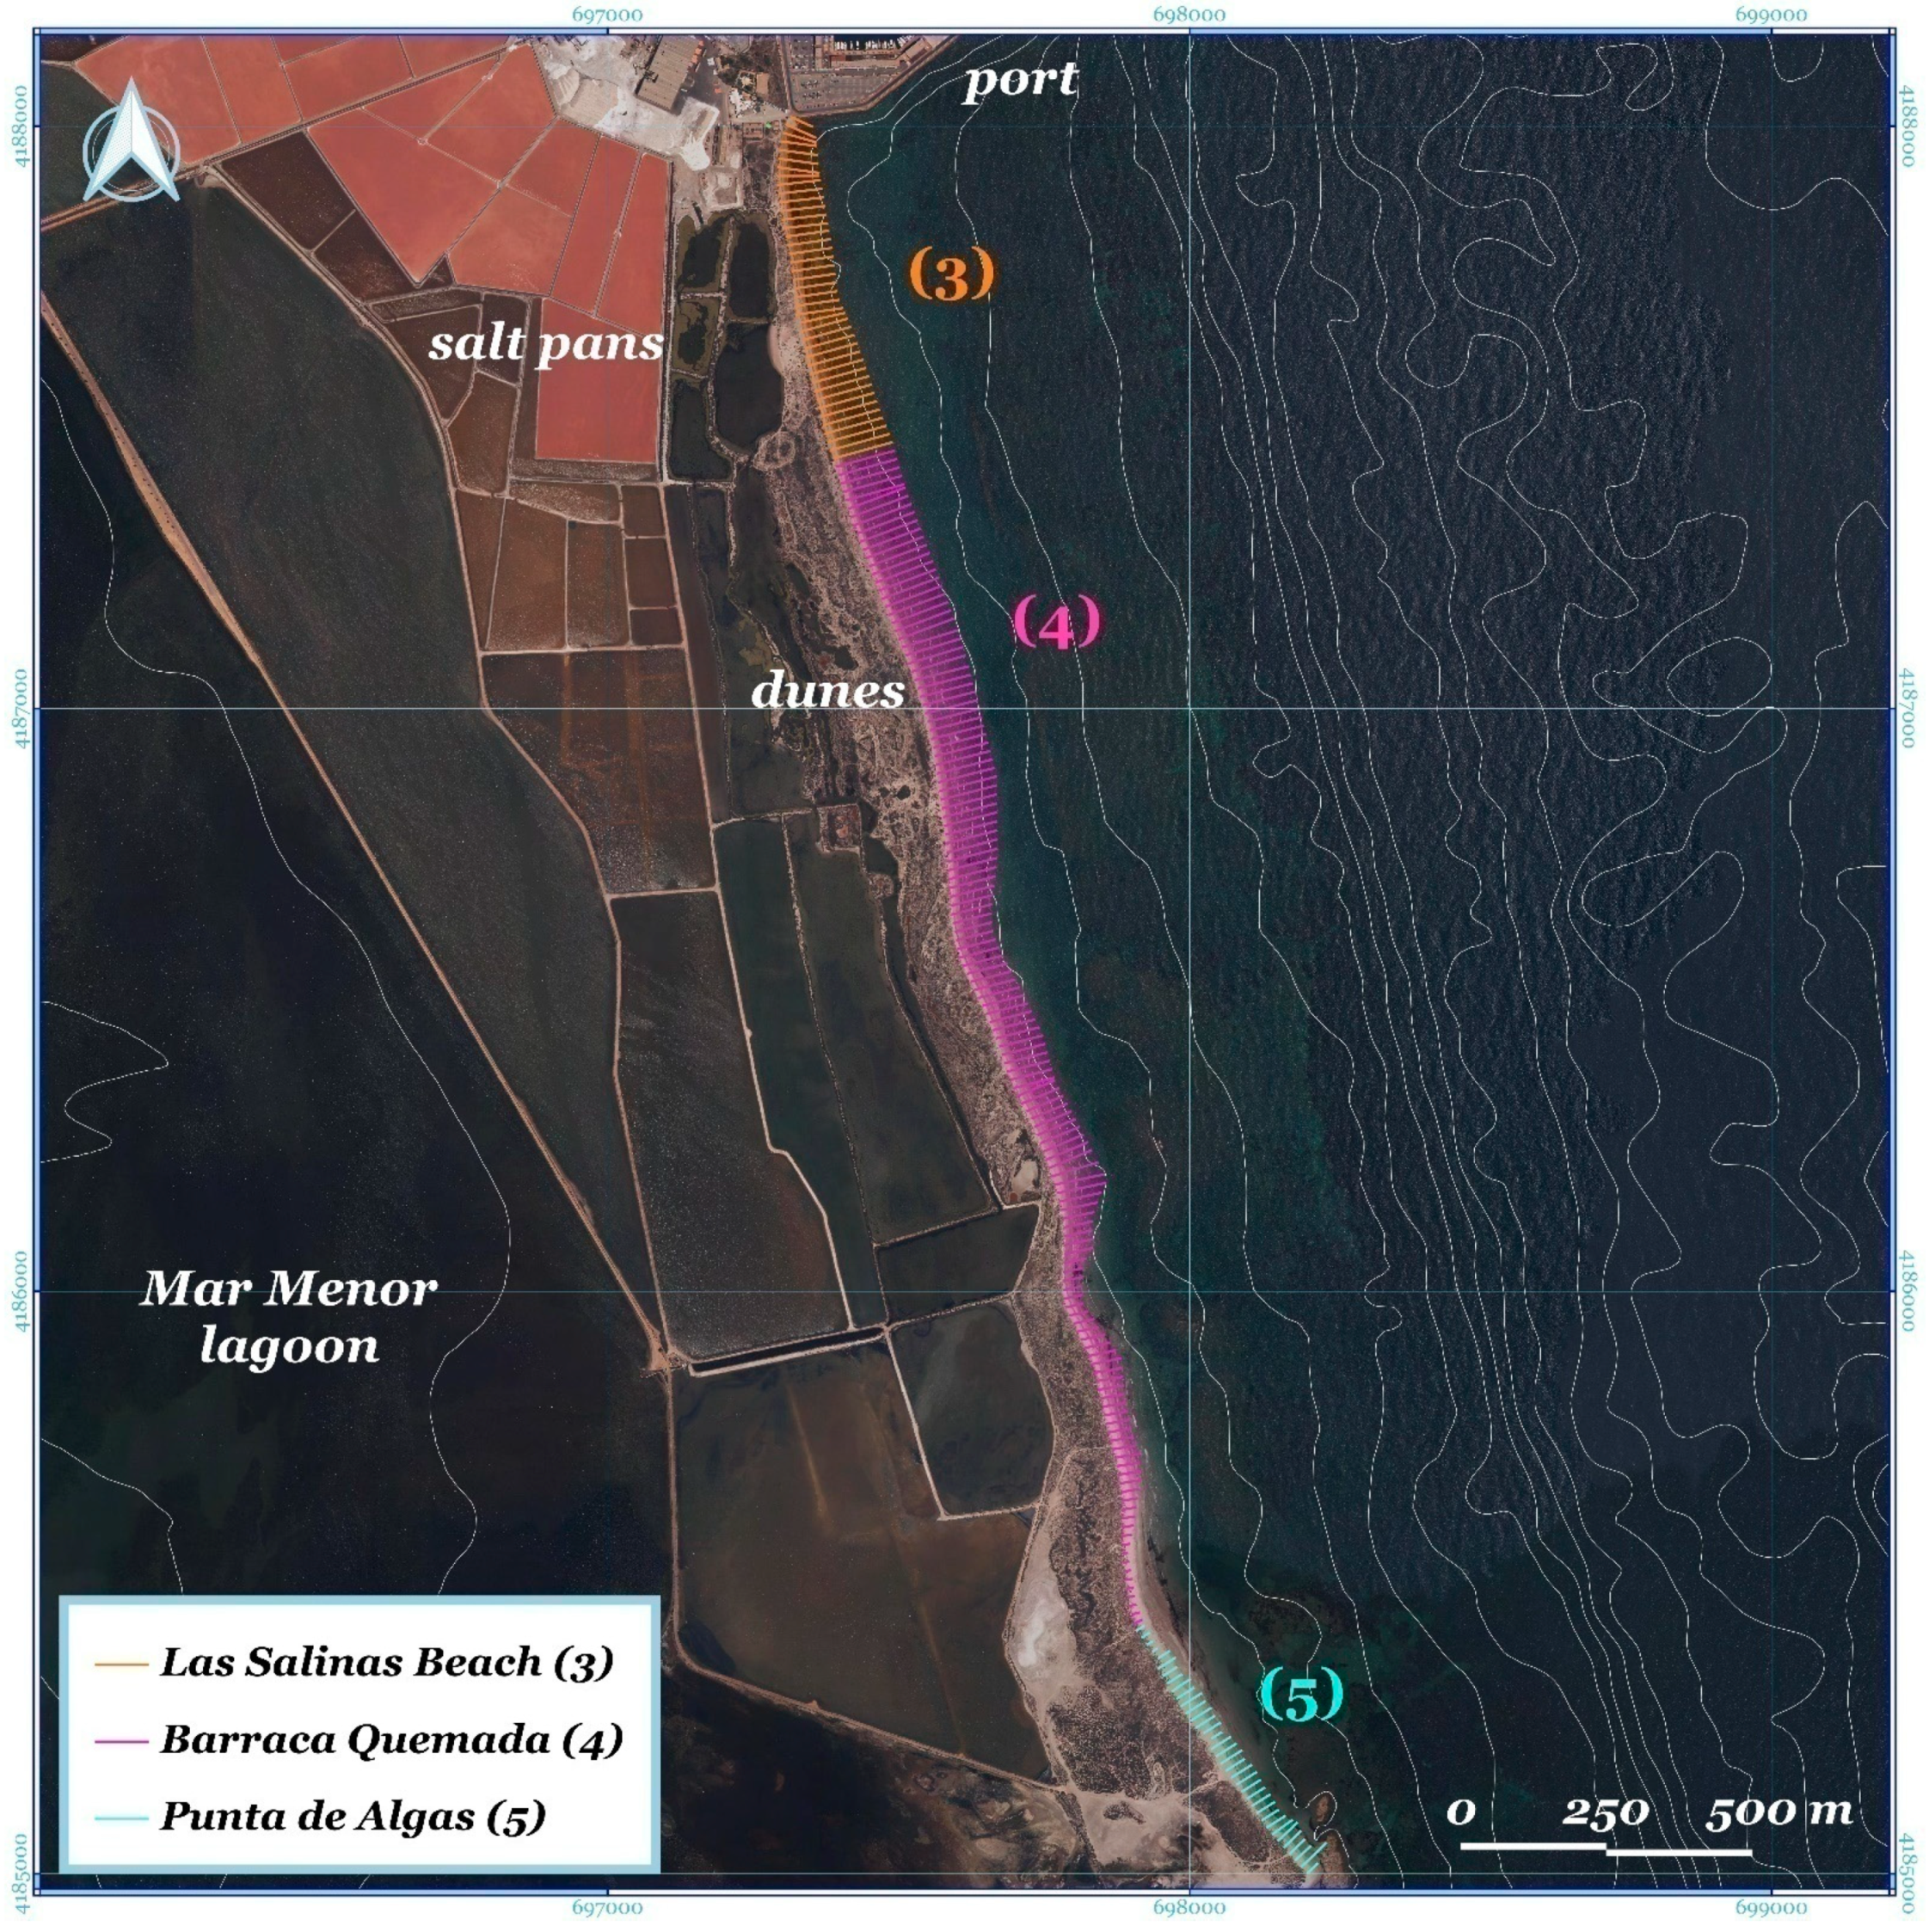
Study Area
2. Materials and Methods
2.1. Software Used
2.2. Sediment Transport Models and Active Depths
2.3. Cartography and Aerial Photographs
2.4. Definition and Digitization of the Beach Surface and Coastline
2.5. Generation of Transects
2.6. Areas, Distances, and Erosion Rates
2.7. Calculation of Errors in Digitization from Aerial Photographs
- Digitization error: error associated with the coastline digitization process. The digitization has been repeated several times by a single specialist. The error has been calculated from the standard deviation of them.
- Error in geometric correction: expressed as the mean square error of the rectification process [43]. It is the distance between the control points established in the aerial photographs.
- Scanning or pixel error: represented by the resolution of the different images [44]. The larger the pixels, the greater the uncertainty in the interpretation of the coastlines. For this purpose, the length of the pixel side is used.
3. Results
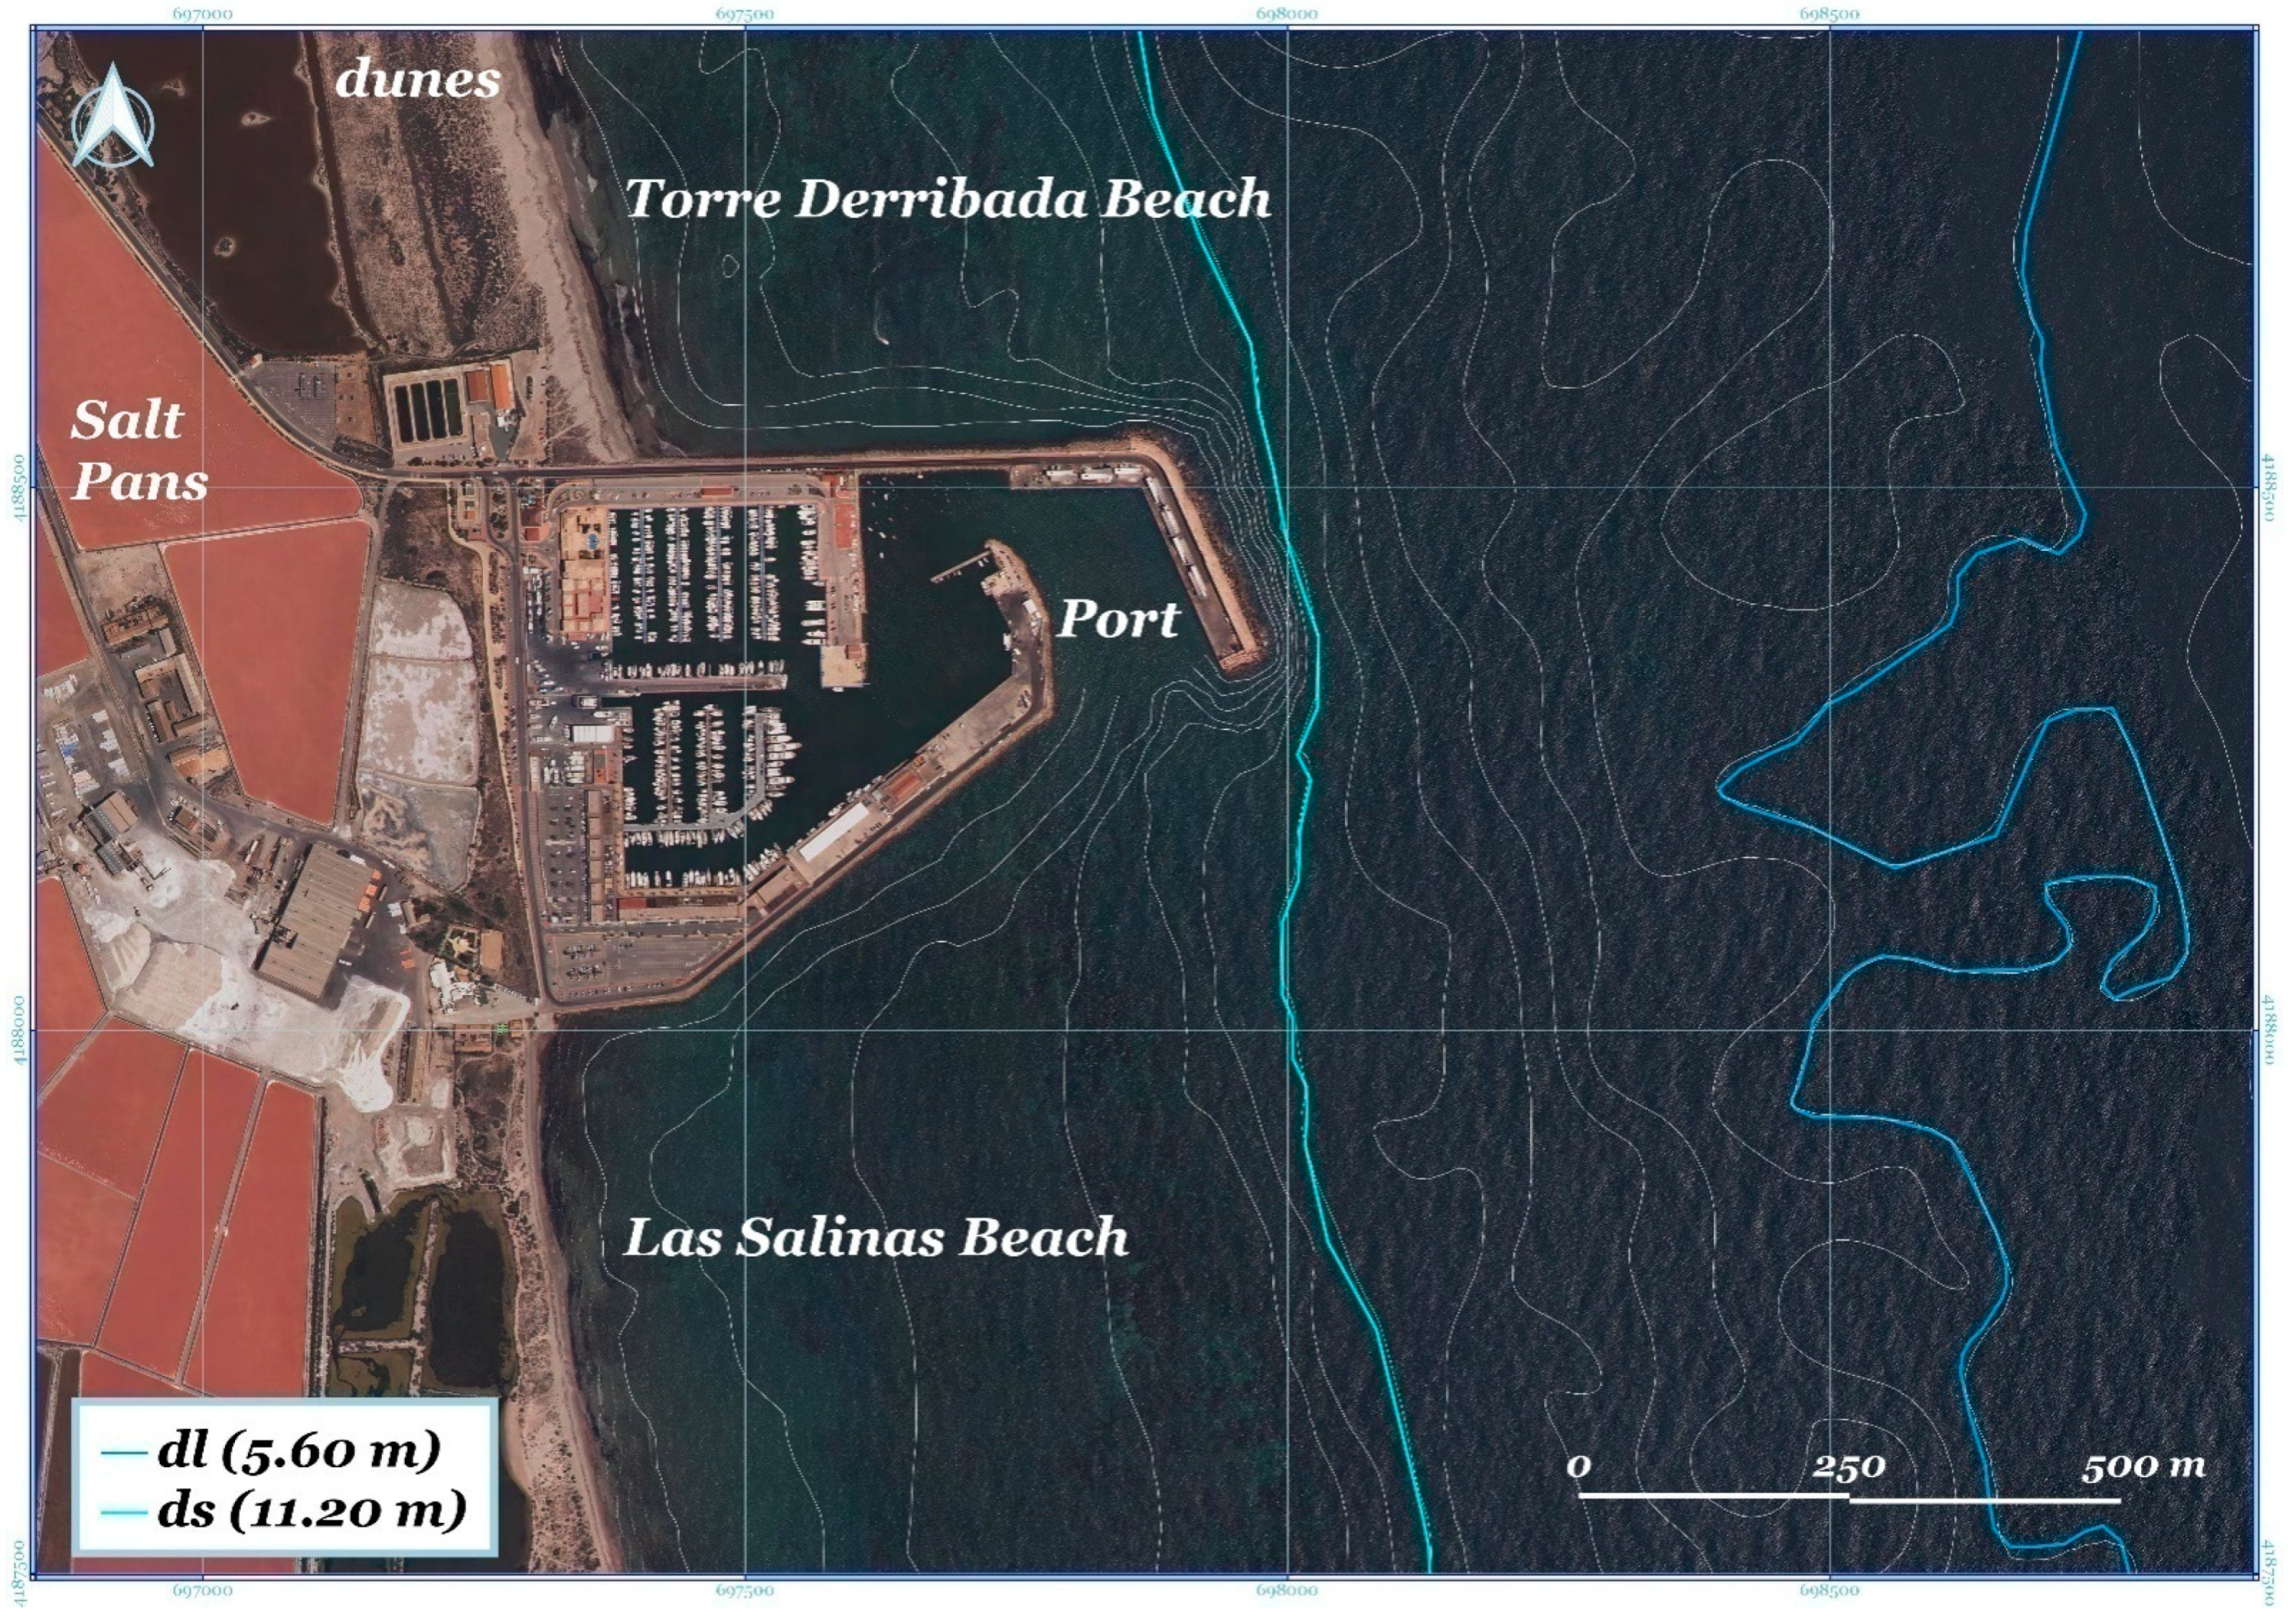
3.1. Drift, Sediments, and Depth
3.2. Erosion and Accretion of the Beaches of the Salinas and Arenales Regional Park in San Pedro del Pinatar
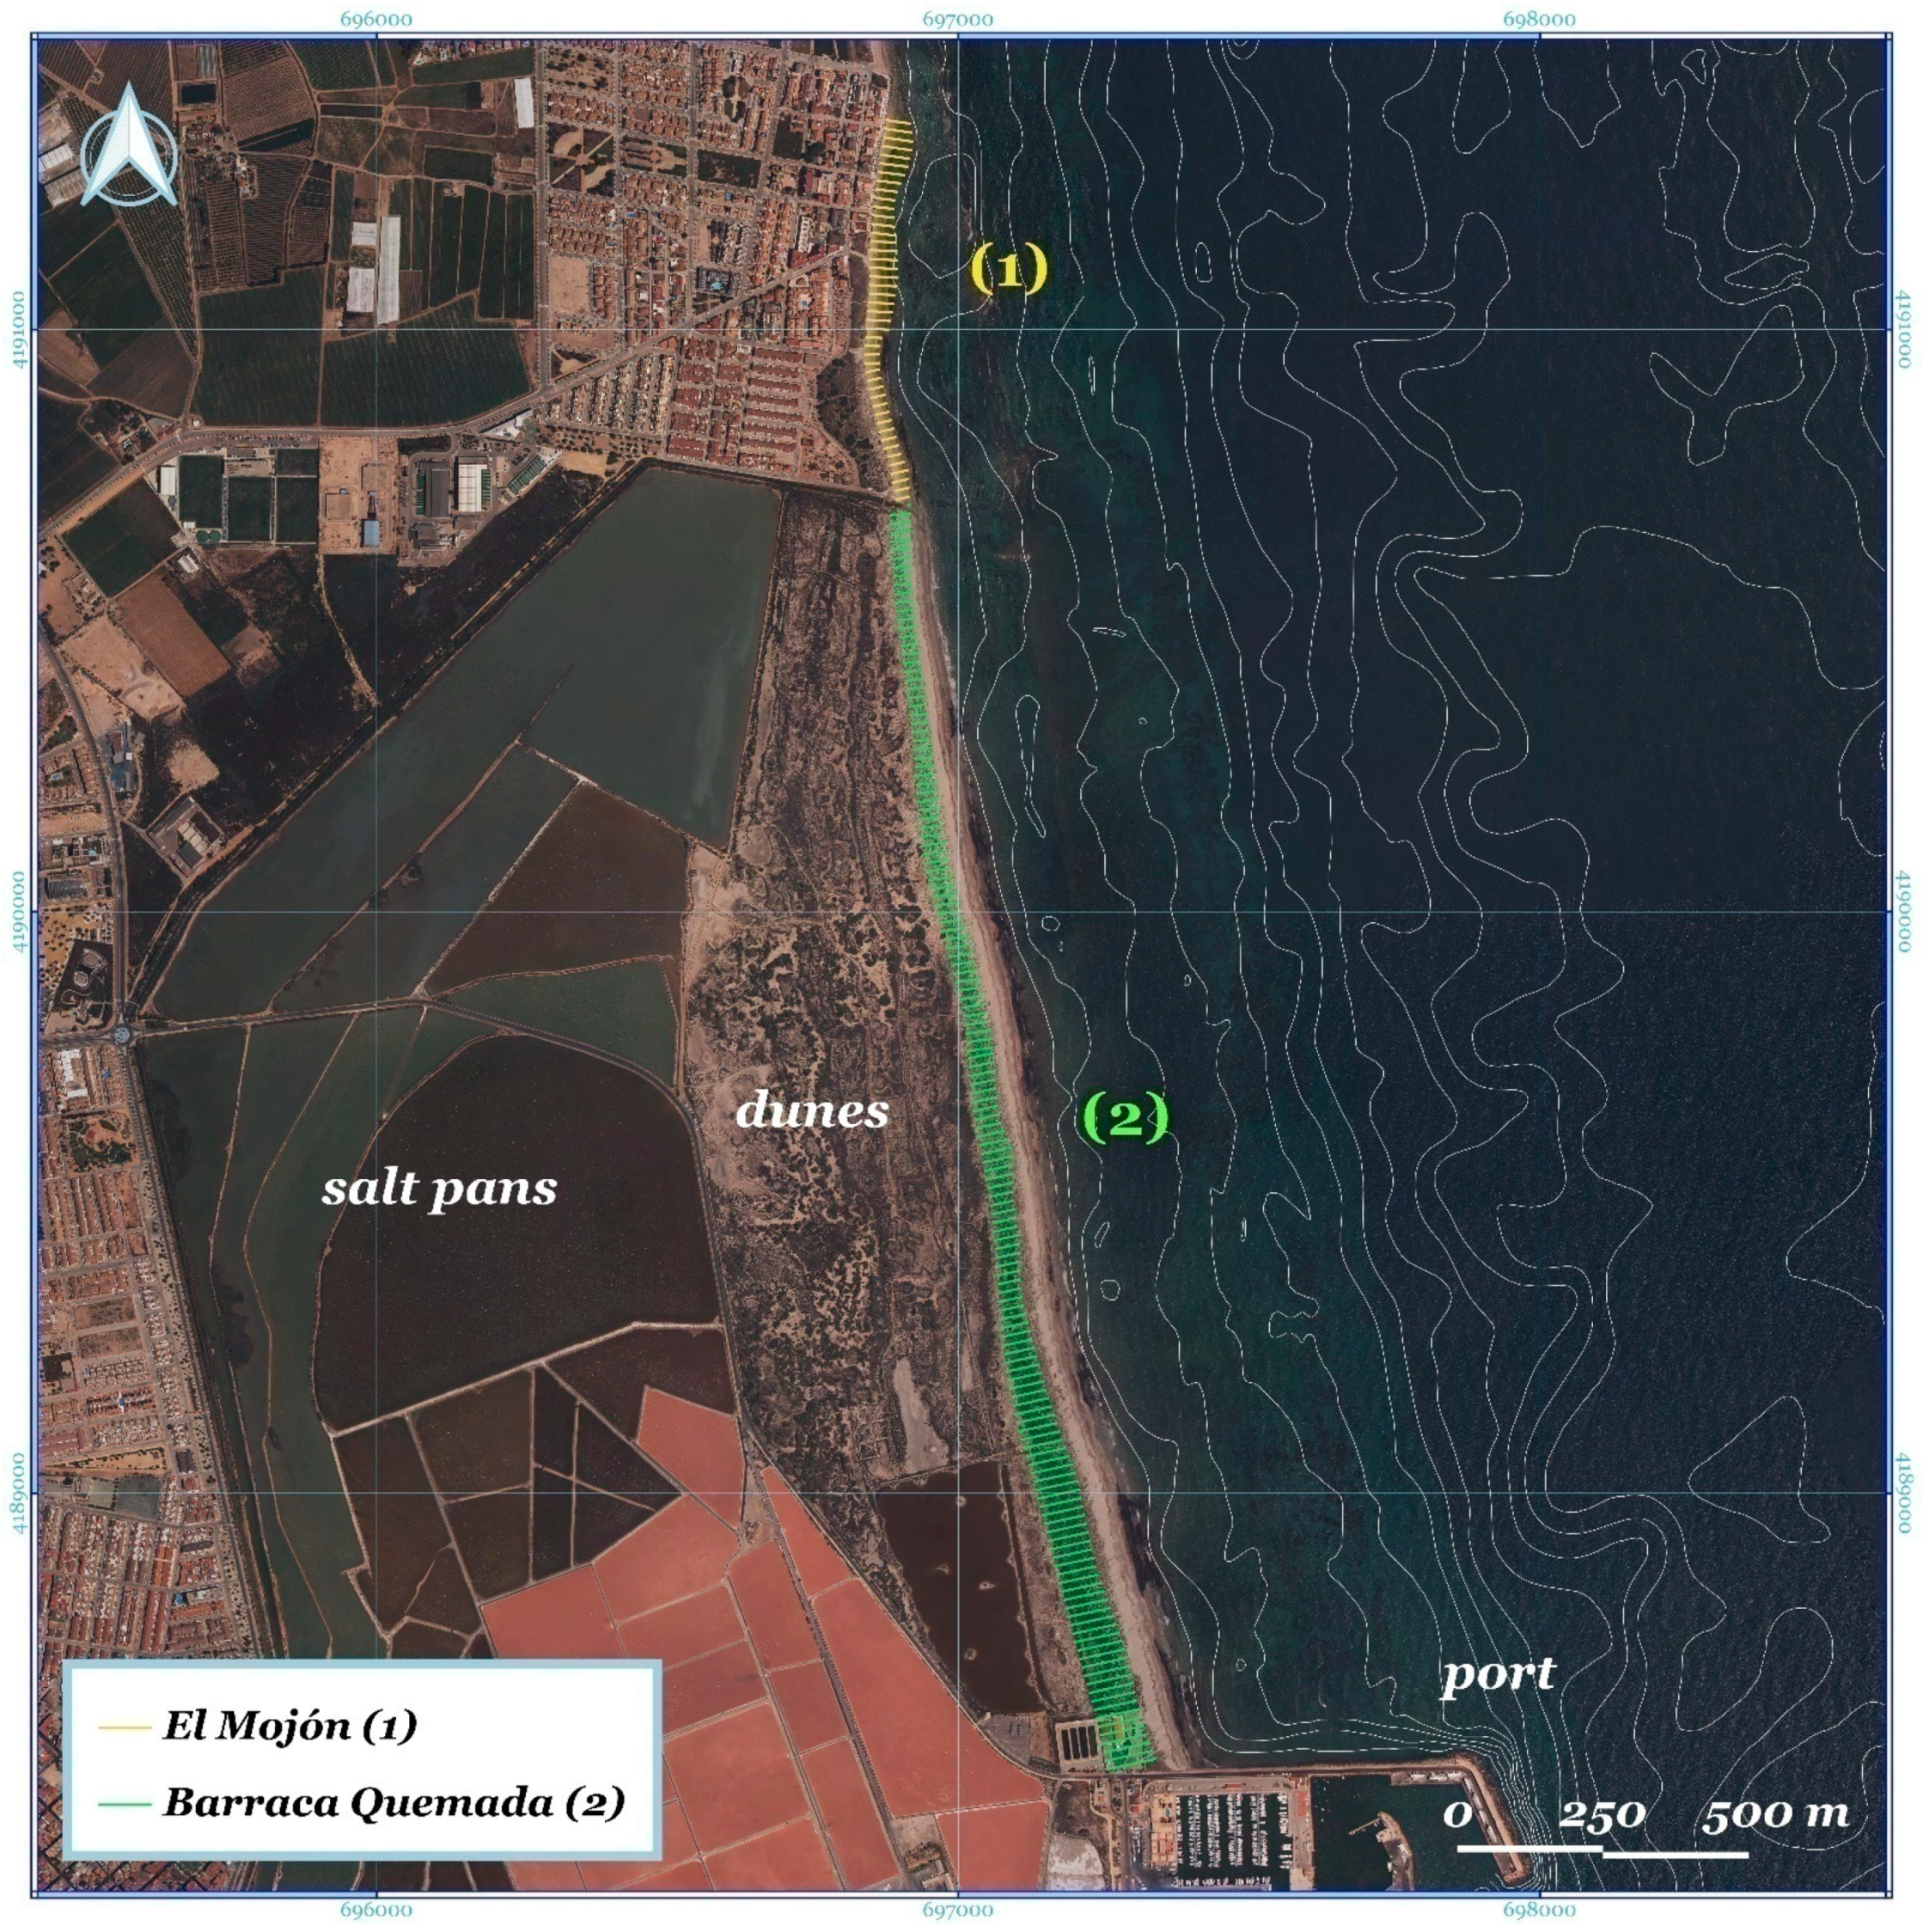
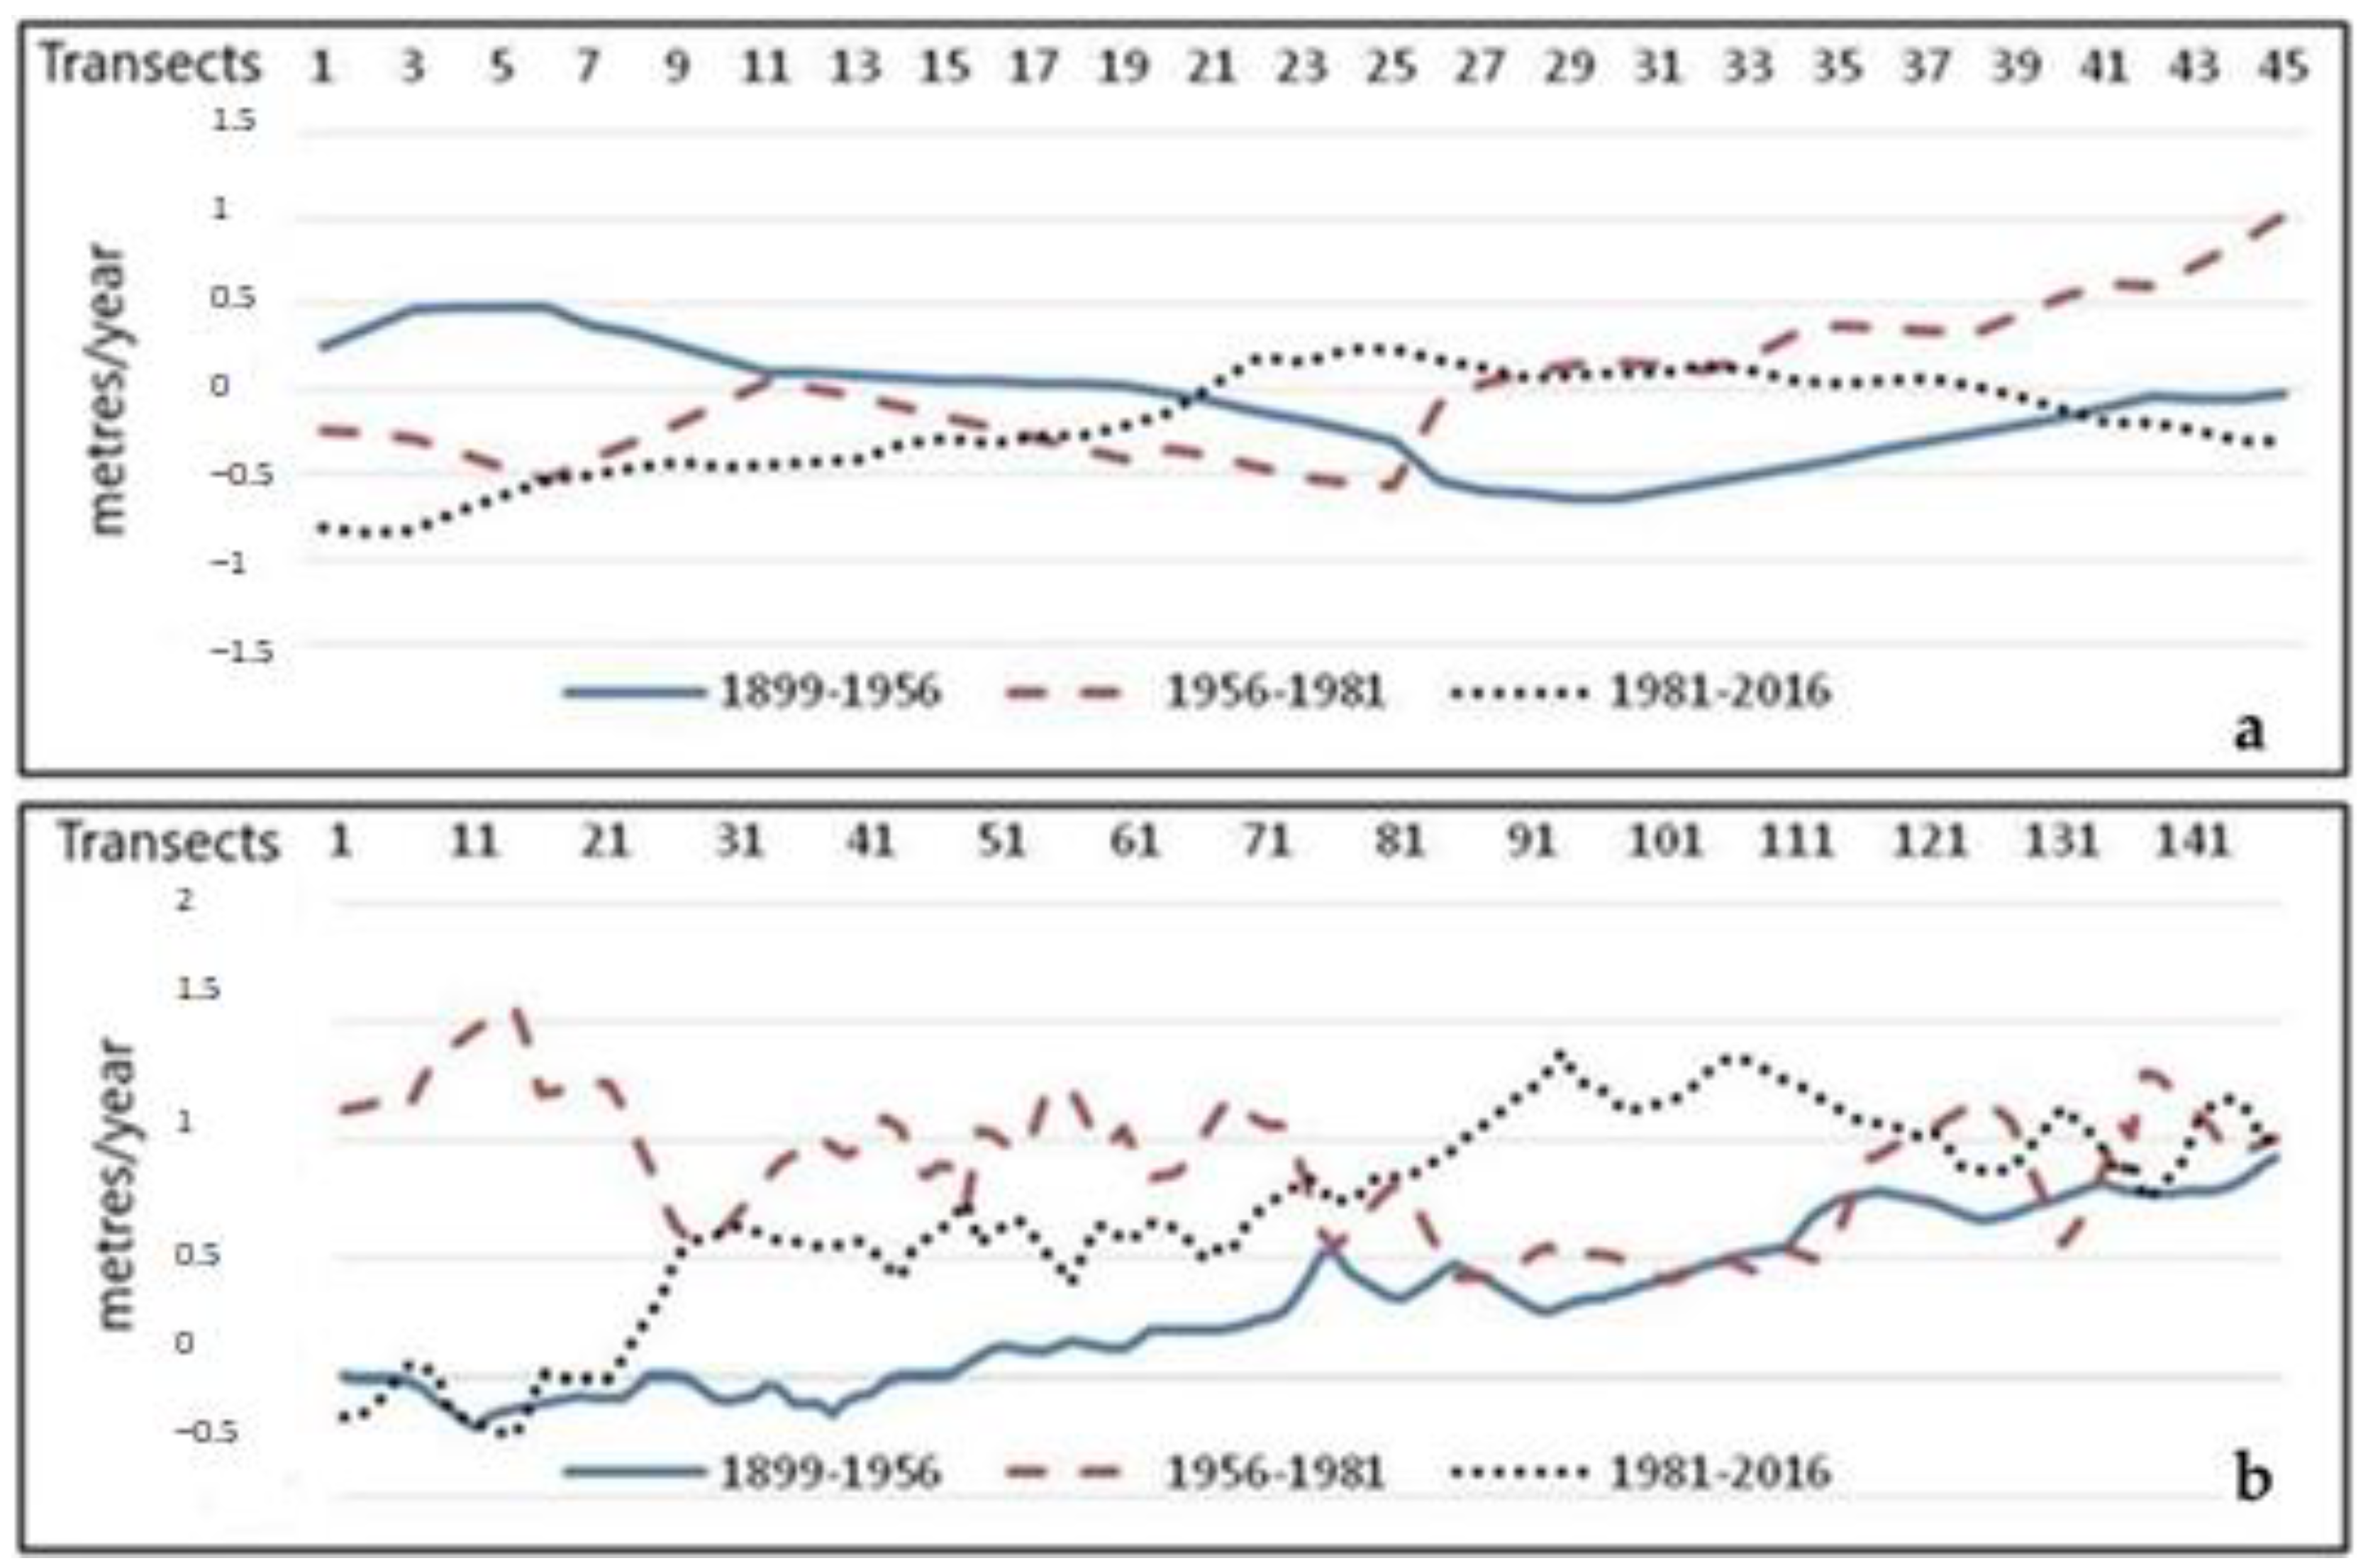
3.3. Sections Located North of the Port
3.4. Sections Located South of the Port
4. Discussion
5. Conclusions
Author Contributions
Funding
Institutional Review Board Statement
Informed Consent Statement
Data Availability Statement
Acknowledgments
Conflicts of Interest
References
- Absalonsen, L.; Dean, R.G. Characteristics of the shoreline change along Florida sandy beaches with an example for Palm Beach County. J. Coast. Res. 2011, 27, 16–26. [Google Scholar] [CrossRef]
- Del Río, L.; Gracia, F.J.; Benavente, J. Shoreline change patterns in sandy coasts. A case study in SW Spain. Geomorphology 2013, 196, 252–266. [Google Scholar] [CrossRef] [Green Version]
- Jackson, D.W.T.; Short, A. Sandy Beach Morphodynamics; Elsevier: Amsterdam, The Netherlands, 2020. [Google Scholar]
- Xue, Z.; Feng, A.; Yin, P.; Xia, D. Coastal erosion induced by human activities: A northwest Bohai Sea case study. J. Coast. Res. 2009, 25, 723–733. [Google Scholar] [CrossRef]
- Zhang, K.; Douglas, B.C.; Leatherman, S.P. Global warming and coastal erosion. Clim. Chang. 2004, 64, 41. [Google Scholar] [CrossRef]
- Dieng, H.B.; Cazenave, A.; Meyssignac, B.; Ablain, M. New estimate of the current rate of sea level rise from a sea level budget approach. Geophys. Res. Lett. 2017, 44, 3744–3751. [Google Scholar] [CrossRef]
- Nerem, R.S.; Beckley, B.D.; Fasullo, J.T.; Hamlington, B.D.; Masters, D.; Mitchum, G.T. Climate-change—driven accelerated sea-level rise detected in the altimeter era. Proc. Natl. Acad. Sci. USA 2018, 115, 2022–2025. [Google Scholar] [CrossRef] [Green Version]
- Van Rijn, L.C. Coastal erosion and control. OceanCoast. Manag. 2011, 54, 1–21. [Google Scholar] [CrossRef]
- Masria, A.; Iskander, M.; Negm, A. Coastal protection measures, case study (Mediterranean zone, Egypt). J. Coast. Conserv. 2015, 19, 281–294. [Google Scholar] [CrossRef]
- Doody, P.; Ferreira, M.; Lombardo, S.; Lucius, I.; Misdrop, R.; Neising, H.; Salman, A.; Smallegange, M. Living with Coastal Erosion in Europe: Sediment and Space for Sustainability—Results from the Erosion Study; EUCC: Leiden, The Netherlands, 2004. [Google Scholar]
- López Bermúdez, F.; Gomariz Castillo, F. Las ramblas, agentes reguladores del litoral mediterráneo ibérico. El ejemplo de la rambla de las Moreras. Murcia. In Geomorfología litoral i Quaternari; Eulàlia, S., Joan, F.M., Eds.; Publications of the University of Valencia (PUV): Valencia, Spain, 2006; pp. 245–257. [Google Scholar]
- Belmonte-Serrato, F.; Romero Díaz, A.; Rupérez Tirado, E.; Moreno Brotóns, J. El impacto de la agricultura intensiva en el uso turístico de las playas de Marina de Cope (Murcia). Cuad. Tur. 2011, 27, 23–38. [Google Scholar]
- Belmonte-Serrato, F.; Romero Díaz, A.; Ruiz Sinoga, J.D. Retroceso de la línea de costa en playas del sur de la Región de Murcia. Scr. Nova 2013, XVII, 443. [Google Scholar]
- Murali, R.; Babu, M.; Mascarenhas, A.; Choudhary, R.; Sudheesh, K.; Vethamony, P. Coastal erosion triggered by a shipwreck along the coast of Goa, India. Curr. Sci. 2013, 105, 990–996. [Google Scholar]
- Fletcher, C.; Rooney, J.; Barbee, M.; Lim, S.; Richmond, B.M. Mapping shoreline change using digital ortophotogrametry on Maui, Hawaii. J. Coast. Res. 2003, 38, 106–124. [Google Scholar]
- Shipman, B.; Stojanovic, T. Facts, fictions, and failures of integrated coastal zone management in Europe. Coast. Manag. 2007, 35, 375–398. [Google Scholar] [CrossRef]
- Barragán Muñoz, J.M.; Chica Ruiz, J.A.; Pérez Cayeiro, M.L. Iniciativa andaluza (España) para la gestión integrada de zonas costeras (GIZC). Rev. Geogr. Norte Gd. 2008, 41, 5–22. [Google Scholar] [CrossRef]
- Guisado Pintado, E.; Malvárez García, G.C. El estado morfodinámico de las playas a través de modelización numérica de propagación y asomeramiento del oleaje: El frente litoral de Doñana. GeoFocus 2015, 15, 163–180. [Google Scholar]
- Moller, I.; Spencer, T. Wave dissipation over macro-tidal saltmarshes: Effects of marsh edge typology and vegetation change. J. Coast. Res. 2002, 36, 506–521. [Google Scholar] [CrossRef]
- Adam, P. Saltmarshes in a time of change. Environ. Conserv. 2002, 29, 39–61. [Google Scholar] [CrossRef]
- Pethick, J. Coastal management and sea-level rise. Catena 2001, 42, 307–322. [Google Scholar] [CrossRef]
- Elginoz, N.; Kabdaslit, M.S. Effects of Posidonia Oceanica Seagrass Meadows on Storm Waves. J. Coast. Res. 2011, 64, 373–377. [Google Scholar] [CrossRef] [Green Version]
- Gómez-Pujol, L.; Orfila, A.; Álvarez-Ellacuría, A.; Terrados, J.; Tintor, J. Posidonia oceanica beach-cast litter in Mediterranean beaches: A coastal videomonitoring study. J. Coast. Res. 2013, 65, 1768–1773. [Google Scholar] [CrossRef] [Green Version]
- Hemminga, M.A.; Nieuwenhuize, J. Seagrass Wrack-induced Dune formation on a tropical coast. Estuarine. Coast. ShelfSci. 1990, 31, 499–502. [Google Scholar] [CrossRef]
- Ballesteros-Pelegrín, G.A. El Parque Regional de las Salinas y Arenales de San Pedro del Pinatar. ActividadesHumanas y Conservación; Universidad de Murcia: Murcia, Spain, 2014; Volume 512, p. 367. [Google Scholar]
- Larson, M.; Kraus, N.C. Representation of non erodible (hard) bottoms in beach profile change modeling. J. Coast. Res. 2000, 16, 1–14. [Google Scholar]
- Gallop, S.L.; Bosserelle, C.; Pattiaratchi, C.B.; Eliot, I. Hydrodynamic and morphological response of a perched beach during sea breeze activity. J. Coast. Res. 2011, 64, 75–79. [Google Scholar]
- Wright, L.D.; Short, A.D. Morphodynamic Variability of Surf Zones and Beaches: A Synthesis. Mar. Geol. 1984, 56, 93–118. [Google Scholar] [CrossRef]
- Wright, L.D.; Chappell, J.; Thom, B.G.; Bradshow, M.P.; Cowell, P. Morphodynamics of reflective and dissipative beach and inshore systems: Southeastern Australia. Mar. Geol. 1979, 32, 105–140. [Google Scholar] [CrossRef]
- Quetzalcóatl, O.; González, M.; Cánovas, V.; Medina, R.; Espejo, A.; Klein, A.; Tessler, M.A.; Almeida, L.R.; Jaramillo, C.; Garnier, R.; et al. SMC, a coastal modeling system for assessing beach processes and coastal interventions: Application to the Brazilian coast. Environ. Model. Softw. 2019, 116, 131–152. [Google Scholar] [CrossRef]
- Qgis Development Team. QGIS Geographic Information System. Open Source Geospatial Foundation Project. 2019. Available online: http://qgis.osgeo.org (accessed on 25 November 2020).
- Kamphuis, J.W. Alongshore Sediment Transport Rate. Journal of Waterway, Port. Coast. Ocean Eng. 1991, 117, 624–640. [Google Scholar] [CrossRef]
- Córdova-López, L.F.; Torres-Hugues, R. Modelo matemático para la determinación del transporte longitudinal para playas del Caribe. Tecnol. Cienc. Agua 2011, II, 127–140. [Google Scholar]
- Hallermeier, R.J. A profilezonationforseasonalsandbeachesfrom wave climate. Coast. Eng. 1981, 4, 253–277. [Google Scholar] [CrossRef]
- Peña Olivas, J.M.; Sánchez Palomar, F.J. Diques exentos: Inventario y comportamiento en las costas españolas. Rev. Ing. Civil. 2008, 149, 65–76. [Google Scholar]
- Boak, E.H.; Turner, I.L. Shoreline Definition and Detection: A Review. J. Coast. Res. 2005, 21, 688–703. [Google Scholar] [CrossRef] [Green Version]
- Fernández, M.; Díaz, P.; Ojeda, J.; Prieto, A.; Sánchez, N. Multipurpose line for mapping coastal information using a data model: The Andalusian coast (Spain). J. Coast. Conserv. 2015, 19, 461–474. [Google Scholar] [CrossRef]
- Bartoletti, L. QGIS Python Plugin: Station Lines. Available online: https://plugins.qgis.org/plugins/stationlines/,2014,consulta7.11.2019 (accessed on 11 July 2019).
- Thieler, E.R.; Himmelstoss, E.A.; Zichichi, J.L.; Ergul, A. Digital Shoreline Analysis System (DSAS) Version 4.0: An ArcGis Extension for Calculating Shoreline Changes; Open-file Report; U.S. Geological Survey: Reston, VA, USA, 2009.
- Dolan, R.; Fenster, M.S.; Holme, S.J. Temporal analysis of shoreline recession and accretion. J. Coast. Res. 1991, 7, 723–744. [Google Scholar]
- Genz, A.S.; Fletcher, C.H.; Dunn, R.A.; Frazer, L.N.; Rooney, J. The predictive accuracy of shoreline change rate methods and alongshore beach variation on Maui, Hawai. J. Coast. Res. 2011, 23, 87–105. [Google Scholar] [CrossRef] [Green Version]
- Cowart, L.; Walsh, J.P.; Corbett, D.R. Analyzing Estuarine Shoreline Change: A Case Study of Cedar Island, North Carolina. J. Coast. Res. 2010, 26, 817–830. [Google Scholar] [CrossRef]
- Martín Prieto, J.A.; Roig Munar, F.X.; Rodríguez Perea, A.; Mir Gual, M.; Pons Buades, G.X.; Gelabert Ferrer, B. La erosión histórica de la playa de saRàpita (S. Mallorca). Investig. Geográficas 2016, 66, 135–154. [Google Scholar] [CrossRef] [Green Version]
- Morton, R.A.; Speed, F.M. Evaluation of shorelines and legal boundaries controlled by water levels on sandy beaches. J. Coast. Res. 1998, 14, 1373–1384. [Google Scholar]
- Coyne, M.A.; Fletcher, H.; Richmond, B.M. Mapping coastal erosion hazards in Hawaii: Observations and errors. J. Coast. Res. 1999, 28, 171–184. [Google Scholar] [CrossRef] [Green Version]
- Semeoshenkova, V.; Newton, A. Overview of erosion and beach quality issues in three Southern European countries: Portugal, Spain and Italy. Ocean. Coast. Manag. 2015, 118, 12–21. [Google Scholar] [CrossRef]
- Ballesteros, C.; Jiménez, J.A.; Valdemoro, H.I.; Bosom, E. Erosion consequences on beach functions along the Maresme coast (NW Mediterranean, Spain). Nat. Hazards 2018, 90, 173–195. [Google Scholar] [CrossRef] [Green Version]
- Molina, R.; Manno, G.; Re, C.L.; Anfuso, G.; Ciraolo, G. A Methodological Approach to Determine Sound Response Modalities to Coastal Erosion Processes in Mediterranean Andalusia (Spain). J. Mar. Sci. Eng. 2020, 8, 154. [Google Scholar] [CrossRef] [Green Version]
- Ibarra Marinas, A.D. Análisis y evolución de las playas de la Región de Murcia (1956–2013). Ph.D. Thesis, Universidad de Murcia, Murcia, Spain, 2016; p. 351. [Google Scholar]
- Lechuga Álvaro, A. Riesgos asociados al oleaje en zonas costeras. In Riesgos Naturales; Ayala Carcedo, F.J., Olcina Cantos, J., Eds.; Ariel Ciencia: Barcelona, Spain, 2002; pp. 1089–1098. [Google Scholar]
- Landlin, M.C.; Patin, T.R.; Davies, J.E.; Palermo, M.R.; Clarke, D.G. Environmental Restoration and Habitat Development using Dredged Material in US Waters. In Proceedings of the 14th World Dredging Congress—Dredging Benefits, WODA; Central Dredging Association: Delft, The Netherlands, 1995. [Google Scholar]
- Marbà, N.; Jordà, G.; Agustí, S.; Girard, C.; Duarte, C.M. Footprints of climate change on Mediterranean Sea biota. Front. Mar. Sci. 2015, 2, 1–11. [Google Scholar] [CrossRef]
- Tigny, V.; Ozer, A.; De Falco, G.; Baroli, M.; Djenidi, S. Relationship between the Evolution of the Shoreline and the Posidonia oceanica Meadow Limit in a Sardinian Coastal Zone. J. Coast. Res. 2007, 233, 787–793. [Google Scholar] [CrossRef]
- Ballesteros Pelegrín, G.A.; Fernández, J.; Belmonte, F.; Ibarra, D. Proyecto para la conservación de los hábitats y de las aves acuáticas en el LIC y ZEPA Salinas y Arenales de San Pedro del Pinatar (LIFE-SALINAS). In Conservación, Gestión y Restauración de la Biodiversidad, Proceedingsofthe XI Congreso Español y I Congreso Iberoamericano de Biogeografía, Santander, Spain, 22–25 June 2020; Carracedo, V., García-Codron, J.C., Garmendia, C., Rivas, V., Eds.; Asociación de Geógrafos Españoles (AGE): Santander, Spain, 2020; pp. 235–244. [Google Scholar]
- Alonso Sarriá, F.; Gomariz Castillo, F.; Cánovas García, F. Conocimiento abierto en sistemas de información geográfica. Una estrategia para la geografía física. Ninbus 2012, 29–30, 21–31. [Google Scholar]
- Dolan, R.; Hayden, B.P.; May, P.; May, S.K. The reliability of shoreline change measurements from aerial photographs. Shore Beach 1980, 48, 22–29. [Google Scholar] [CrossRef] [Green Version]
- Shoshany, M.; Degani, A. Shoreline detection by digital image processing of aerial photography. J. Coast. Res. 1992, 8, 29–34. [Google Scholar]
- Moore, L.J. Shoreline Mapping Techniques. J. Coast. Res. 2000, 16, 111–124. [Google Scholar]
- Guariglia, A.; Buonamassa, A.; Losurdo, A.; Saladino, R.; Trivigno, M.L.; Zaccagnino, A.A. Multiource approach for coastline mapping and identification of shoreline changes. Ann. Geophys. 2006, 49, 295–304. [Google Scholar] [CrossRef]
- Del Río, L.; Gracia, F.J. Error determination in the photogrammetric assessment of shoreline changes. Nat. Hazards 2013, 63, 2385–2397. [Google Scholar] [CrossRef] [Green Version]
- Quartel, S.; Kroon, A.; Ruessink, B.G. Seasonal accretion and erosion patterns of a microtidal sandy beach. Mar. Geol. 2008, 250, 19–33. [Google Scholar] [CrossRef]


| Beach | Sector | 1899–1956 (m2/Year) | 1956–1981 (m2/Year) | 1981–2016 (m2/Year) | 1899–2016 (m2/Year) |
|---|---|---|---|---|---|
| El Mojón | 1 | −56.06 | 7.24 | −200.64 | −63.65 |
| Torre Derribada | 2 | 768.66 | 1954.33 | 2227.66 | 1191.52 |
| Salinas | 3 | 1926.54 | −4,596.64 | −1,913.24 | −553.50 |
| Barraca Quemada | 4 | −765.59 | −663.11 | −881.36 | −640.76 |
| Punta de Algas | 5 | −131.35 | −396.47 | 635.97 | −4.83 |
| TOTAL | 1742.21 | −3694.65 | −131.60 | −71.22 | |
Publisher’s Note: MDPI stays neutral with regard to jurisdictional claims in published maps and institutional affiliations. |
© 2021 by the authors. Licensee MDPI, Basel, Switzerland. This article is an open access article distributed under the terms and conditions of the Creative Commons Attribution (CC BY) license (http://creativecommons.org/licenses/by/4.0/).
Share and Cite
Ibarra-Marinas, D.; Belmonte-Serrato, F.; Ballesteros-Pelegrín, G.A.; García-Marín, R. Evolution of the Beaches in the Regional Park of Salinas and Arenales of San Pedro del Pinatar (Southeast of Spain) (1899–2019). ISPRS Int. J. Geo-Inf. 2021, 10, 200. https://0-doi-org.brum.beds.ac.uk/10.3390/ijgi10040200
Ibarra-Marinas D, Belmonte-Serrato F, Ballesteros-Pelegrín GA, García-Marín R. Evolution of the Beaches in the Regional Park of Salinas and Arenales of San Pedro del Pinatar (Southeast of Spain) (1899–2019). ISPRS International Journal of Geo-Information. 2021; 10(4):200. https://0-doi-org.brum.beds.ac.uk/10.3390/ijgi10040200
Chicago/Turabian StyleIbarra-Marinas, Daniel, Francisco Belmonte-Serrato, Gustavo A. Ballesteros-Pelegrín, and Ramón García-Marín. 2021. "Evolution of the Beaches in the Regional Park of Salinas and Arenales of San Pedro del Pinatar (Southeast of Spain) (1899–2019)" ISPRS International Journal of Geo-Information 10, no. 4: 200. https://0-doi-org.brum.beds.ac.uk/10.3390/ijgi10040200