Article

The Road Map to Classify the Potential Risk of Wind Erosion

1
Faculty of Agrisciences, Mendel University in Brno, 613 00 Brno, Czech Republic
2
Research Institute for Soil and Water Conservation, 602 00 Brno, Czech Republic
3
Czech Hydrometeorological Institute, 616 67 Brno, Czech Republic
4
The State Land Office, Husinecká 1024/11a, 130 00 Žižkov, Czech Republic
*
Author to whom correspondence should be addressed.
ISPRS Int. J. Geo-Inf. 2021, 10(4), 269; https://0-doi-org.brum.beds.ac.uk/10.3390/ijgi10040269
Submission received: 12 March 2021 / Revised: 11 April 2021 / Accepted: 19 April 2021 / Published: 20 April 2021
(This article belongs to the Special Issue Multi-Hazard Spatial Modelling and Mapping)

Abstract

:
Environmental degradation, for example, by wind erosion, is a serious global problem. Despite the enormous research on this topic, complex methods considering all relevant factors remain unpublished. The main intent of our paper is to develop a methodological road map to identify key soil–climatic conditions that make soil vulnerable to wind and demonstrate the road map in a case study using a relevant data source. Potential wind erosion (PWE) results from soil erosivity and climate erosivity. Soil erosivity directly reflects the wind-erodible fraction and indirectly reflects the soil-crust factor, vegetation-cover factor and surface-roughness factor. The climatic erosivity directly reflects the drought in the surface layer, erosive wind occurrence and clay soil-specific winter regime, making these soils vulnerable to wind erosion. The novelty of our method lies in the following: (1) all relevant soil–climatic data of wind erosion are combined; (2) different soil types “sand” and “clay” are evaluated simultaneously with respect to the different mechanisms of wind erosion; and (3) a methodological road map enables its application for various conditions. Based on our method, it is possible to set threshold values that, when exceeded, trigger landscape adjustments, more detailed in situ measurements or indicate the need for specific management.

1. Introduction

Soil erosion, along with soil compaction, acidification, organic matter decline, soil biodiversity decline, soil pollution and others, is one of the crucial negative externalities of intense agricultural management that reduce both production and ecological soil functions. Mitigation measures to these degradation processes are frequently sought immediately after significant public interest and social demand are raised. Aroused legislative pressure in terms of soil degradation was, for instance, put on the filtering function of soil for groundwater and surface water protection [1]; nevertheless, the problems seemingly relevant only to agriculture have often been omitted so far. Soil degradation processes involving erosion globally threaten food security, human health, and ecosystem services and stability [2,3]. Various anthropogenic and natural disturbances of the landscape can increase the risks of wind erosion, which can be intensified with drought. It can be assumed that wind erosion will be even more serious in the future due to lower soil moisture content [4,5,6,7,8]. Dry and bare soil surfaces are highly susceptible to wind erosion, while soil particles driven by wind endanger emerging plants of agricultural crops. Long-term phenological data as a response to climate change and detected changes in their onset with a link to wind erosion in temperate climate were investigated by [9,10,11,12,13]. In terms of dry and semidry areas, [14] pointed to the important role of vegetation cover in wind erosion reduction.
However, according to [15], the majority of northern European countries claim anti-degradation of soil (or at least point pollution and water erosion and landslides) in their policy documents. Today a paradigm shift is needed in this matter: to move from environmental protection to sustainable use and management. Though it cannot be agreed upon more, specific tools for wind-erosion control have been neglected, partly due to a lack of appropriate methods of its evaluation. As the physics of wind erosion is complex, soil and atmospheric and land-surface processes must be taken into account to assess the wind-erosion susceptibility of soils. Webb and Pierre [16] critically reviewed the drivers of anthropogenic dust emissions and current evaluation approaches. The existence of gaps in the research into the soil-erosion processes in Europe, especially the wind-erosion processes was emphasized by [17]. The common indicators and measurements of wind erosion and air quality used for monitoring various ecosystems by scientists and land managers were summarized by [18] while also taking into account data availability and the technical difficulty of understanding how the measurements indicate the erosion risk or outcomes. Most of these models require detailed input data, which are not always easily available and cannot be simply adapted to conditions or climates different from those in which they were developed [19]. Studies on a regional scale produce varied percentages of the affected area, but the comparability of these data is limited by the differences in methodology and definitions.
Wind-erosion modelling started in the early 1960s for the semiquantitative estimation of soil losses, with the wind erosion equation (WEQ) [20] being considered a standard. This method was globally used to calculate the potential risk of wind erosion [21,22,23]. In contrast, some precise geographic information system (GIS)-based wind-erosion models, such as the Wind Erosion on European Light Soils (WEELS) assessment, are highly data demanding, and thus their practical application is limited.
Wind erosion is not only a concern for agricultural land degeneration but also air quality due to the emission of fine particulate matter into the atmosphere. Aeolian sediment transport and dust emission pose serious hazards to human health. Increasing pressures on land use leads to dust emission and atmospheric pollution in terms of particulate matter (PM) dispersion. The main source of PM in the countryside is traffic on unpaved roads, and even though wind erosion does not work by the same mechanism it can still contribute, especially when the soil surface is bare. Ref. [24] quantified anthropogenic dust emissions from agricultural land under arid conditions when all the dust schemes showed a dependence of anthropogenic dust on land cover over agricultural lands. Yulevitch et al. (2020) [25] identified wind-velocity-triggering dust emissions from loess soils as 4 m s−1. Dust emission processes have major implications for soil loss and human exposure to air pollution. [26] studied the impacts of soil disturbances by human activities on soil aggregation and dust fluxes, and recorded the substantial loss of PM10 under most experimental conditions. These researchers highlight the significant implications for soil nutrient resources in annual balance and management strategies, as well as for PM loading in the atmosphere and the risk of air pollution. Moreover, the atmosphere presents a new vehicle for microplastics, which can be transported by wind together with soil particles and then spread to a wider environment. The dependency of fibrous and nonfibrous airborne microplastics on wind while emphasizing the need to include airborne pathways when consolidating the impact of microplastics on the broader environment and human health indicated [27]. Fine suspended particulates in the atmosphere have also caused disruption to the operation of aircraft and vehicles, and present a health hazard to humans and animals.
The current state of erosion research lacks the knowledge of where and when wind erosion occurs in Europe, as well as the erosion intensity, which poses a threat to agricultural productivity [17].
For this reason, we present a general methodology to identify and spatially express the risk of wind erosion (as risk categories from 1 to 6) while emphasizing all phenomena that need to be taken into account. We do not intend to provide the results in the absolute values of soil loss but rather a relative comparison of areas with different exposure risks to wind erosion. Our study thus focuses on the potential wind erosion (PWE) that represents the soil–climatic-driven susceptibility to erosive wind. Alternatively, by means of the actual wind erosion (AWE), we understand real soil loss under the field conditions caused by a high wind velocity with an erosive effect. Additionally, we employ the case study for central European conditions to practically demonstrate the methodological protocol. The method might help to identify and prioritize areas with the highest risk of wind erosion and thus the highest need for anti-degradation measures, and management strategies and action. This approach also works as a supportive tool for financial and management decision making.

2. Materials and Methods

The aim of this study is to generate a methodology to identify and spatially express the risk of wind erosion by taking into account all necessary phenomena/factors (not only soil). The study is focused on PWE, and the methodology is applied and explained in a case study of the Czech Republic located in central Europe.

2.1. Description of the Case Study Area

The area of interest is located in central Europe (12°–19° E, 48°–51° N) and represents part of the Czech Republic, namely, the area where the risk of wind erosion is expected due to the relatively dry and windy climate (i.e., agricultural land up to an altitude of 500 masl)—see Figure 1. Ref. [28] reports a long-term (period 1990–2019) average annual precipitation of 614.4 mm, an average annual temperature of 9 °C, an average wind velocity of 2.5 m s−1 in the spring season (March–May) and an average wind velocity of 2.2 m s−1 in the autumn season (September–November). The lowest wind velocities occur during summer, while spring and autumn are windier [29].

2.2. Soil and Climate Factors of PWE

Wind erosion and dust emissions are controlled by climate, soil and vegetation properties [16]. The simplified PWE is given by the soil erosivity (SE) and climatic erosivity (CE).

2.2.1. Soil Erosivity (SE)

SE generally means the ability of a soil to resist wind forces. With a certain amount of generalization, we can follow the pattern of [30,31] and define SE as a combination of the wind-erodible fraction (EF) factor, soil-crust (SC) factor, vegetation-cover (VC) factor and surface-roughness (SR) factor.
The EF factor defined by [32] is based on the soil’s texture and chemical properties, such as the content of sand, silt and clay and the content of organic-matter calcium carbonate, while [33] simultaneously employed the clay and organic-matter content to obtain the SC factor.
We are fully aware that the mechanism of wind erosion differs with soil type. Across many studies (for instance [34]), clay soils are not considered to be vulnerable to wind erosion. That is why they are not generally linked to any risk category in terms of the PWE. Some authors [35,36,37,38,39,40] claim that specific clay soils are highly vulnerable to the erosive effects of wind after winter under specific weather conditions. Notably, mainly clay soils show substantial annual changes in soil cohesion. Periodic freezing and thawing of the soil profile together with an enormous water content cause aggregate disintegration. The combination of particular soil properties with a specific winter regime makes clay soil vulnerable to wind erosion [41].
In terms of the PWE estimation, we approached soil grouping with a certain measure of generalization. Soils with clay contents up to 45% were assigned as sandy-to-loam soils (throughout the whole paper, they were indexed as “SAND”). This category thus includes soils that have light texture, lighter to medium-heavy texture, and medium-heavy texture. That is, we include soils of sandy, loamy sand, sandy loam and loamy textures. The second group includes soils with a clay content above 45%, i.e., clay loam soils, clay soils and clay (hereafter indexed as “CLAY”). While speaking of sandy or clay soils, we indicate only that part of the soil profile that is directly exposed to climatic influence.
Nonetheless, the sandy soils generally evince a higher vulnerability to wind erosion than clay soil, so in terms of the SE degree, we assign them degrees of 2, 4 or 6, whereas clay soil is assigned degrees of 1, 3 or 5.
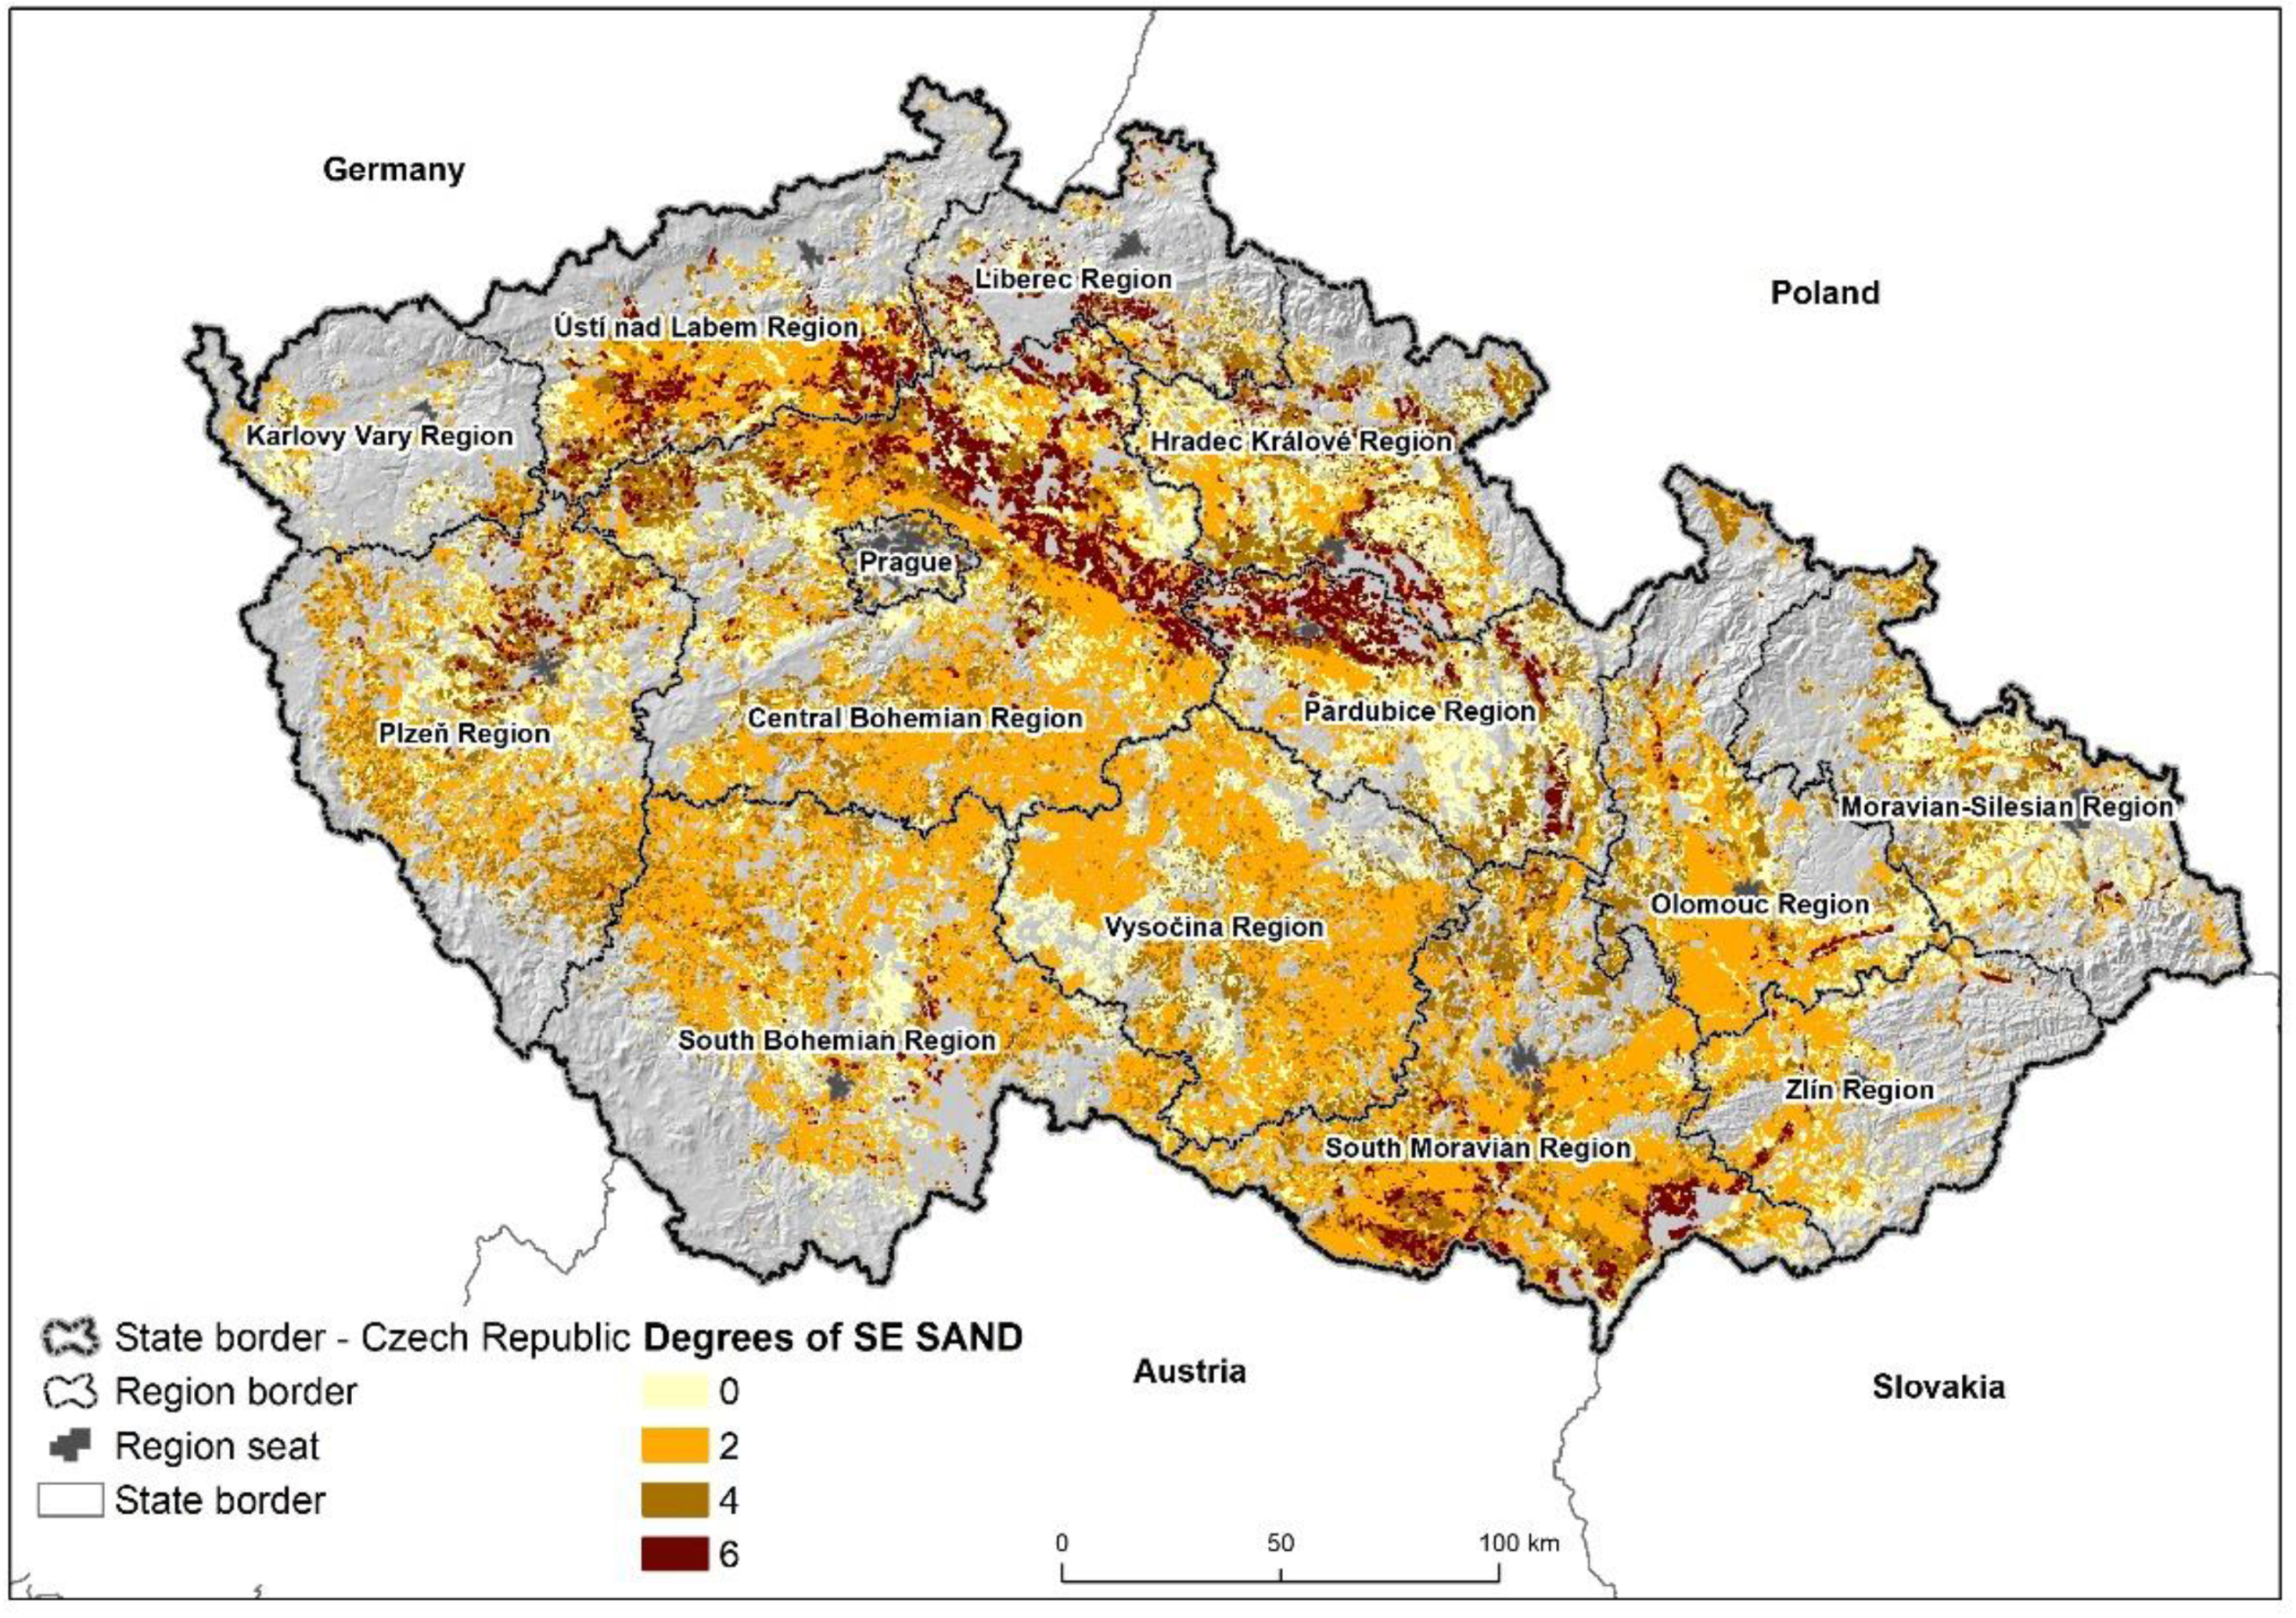
Soil erosivity of sandy soil (SESAND)
Lighter soils can generally be seen as having a higher proportion of macropores (lower overall porosity, larger mineral grains). These soils are typically characterized by higher aeration (hence, they are often more overheated than heavier soils) and better rainwater permeability. As they are not classified as medium-heavy soils, due to their low sorption capacity, they are often quite dry, showing a higher acidity and typically a lower content of mineral nutrients (and organic substances in general). Due to their predisposition, the lightest soils are very vulnerable to wind and water erosion. This susceptibility is because particles with a diameter of 0.05–0.08 mm (the boundary between dust and fine sand) are most easily transported by wind. According to the soil vulnerability factor, we differentiate the whole group according to Table 1 in order to obtain Degrees of SESAND (Table 2).
Case study on SESAND
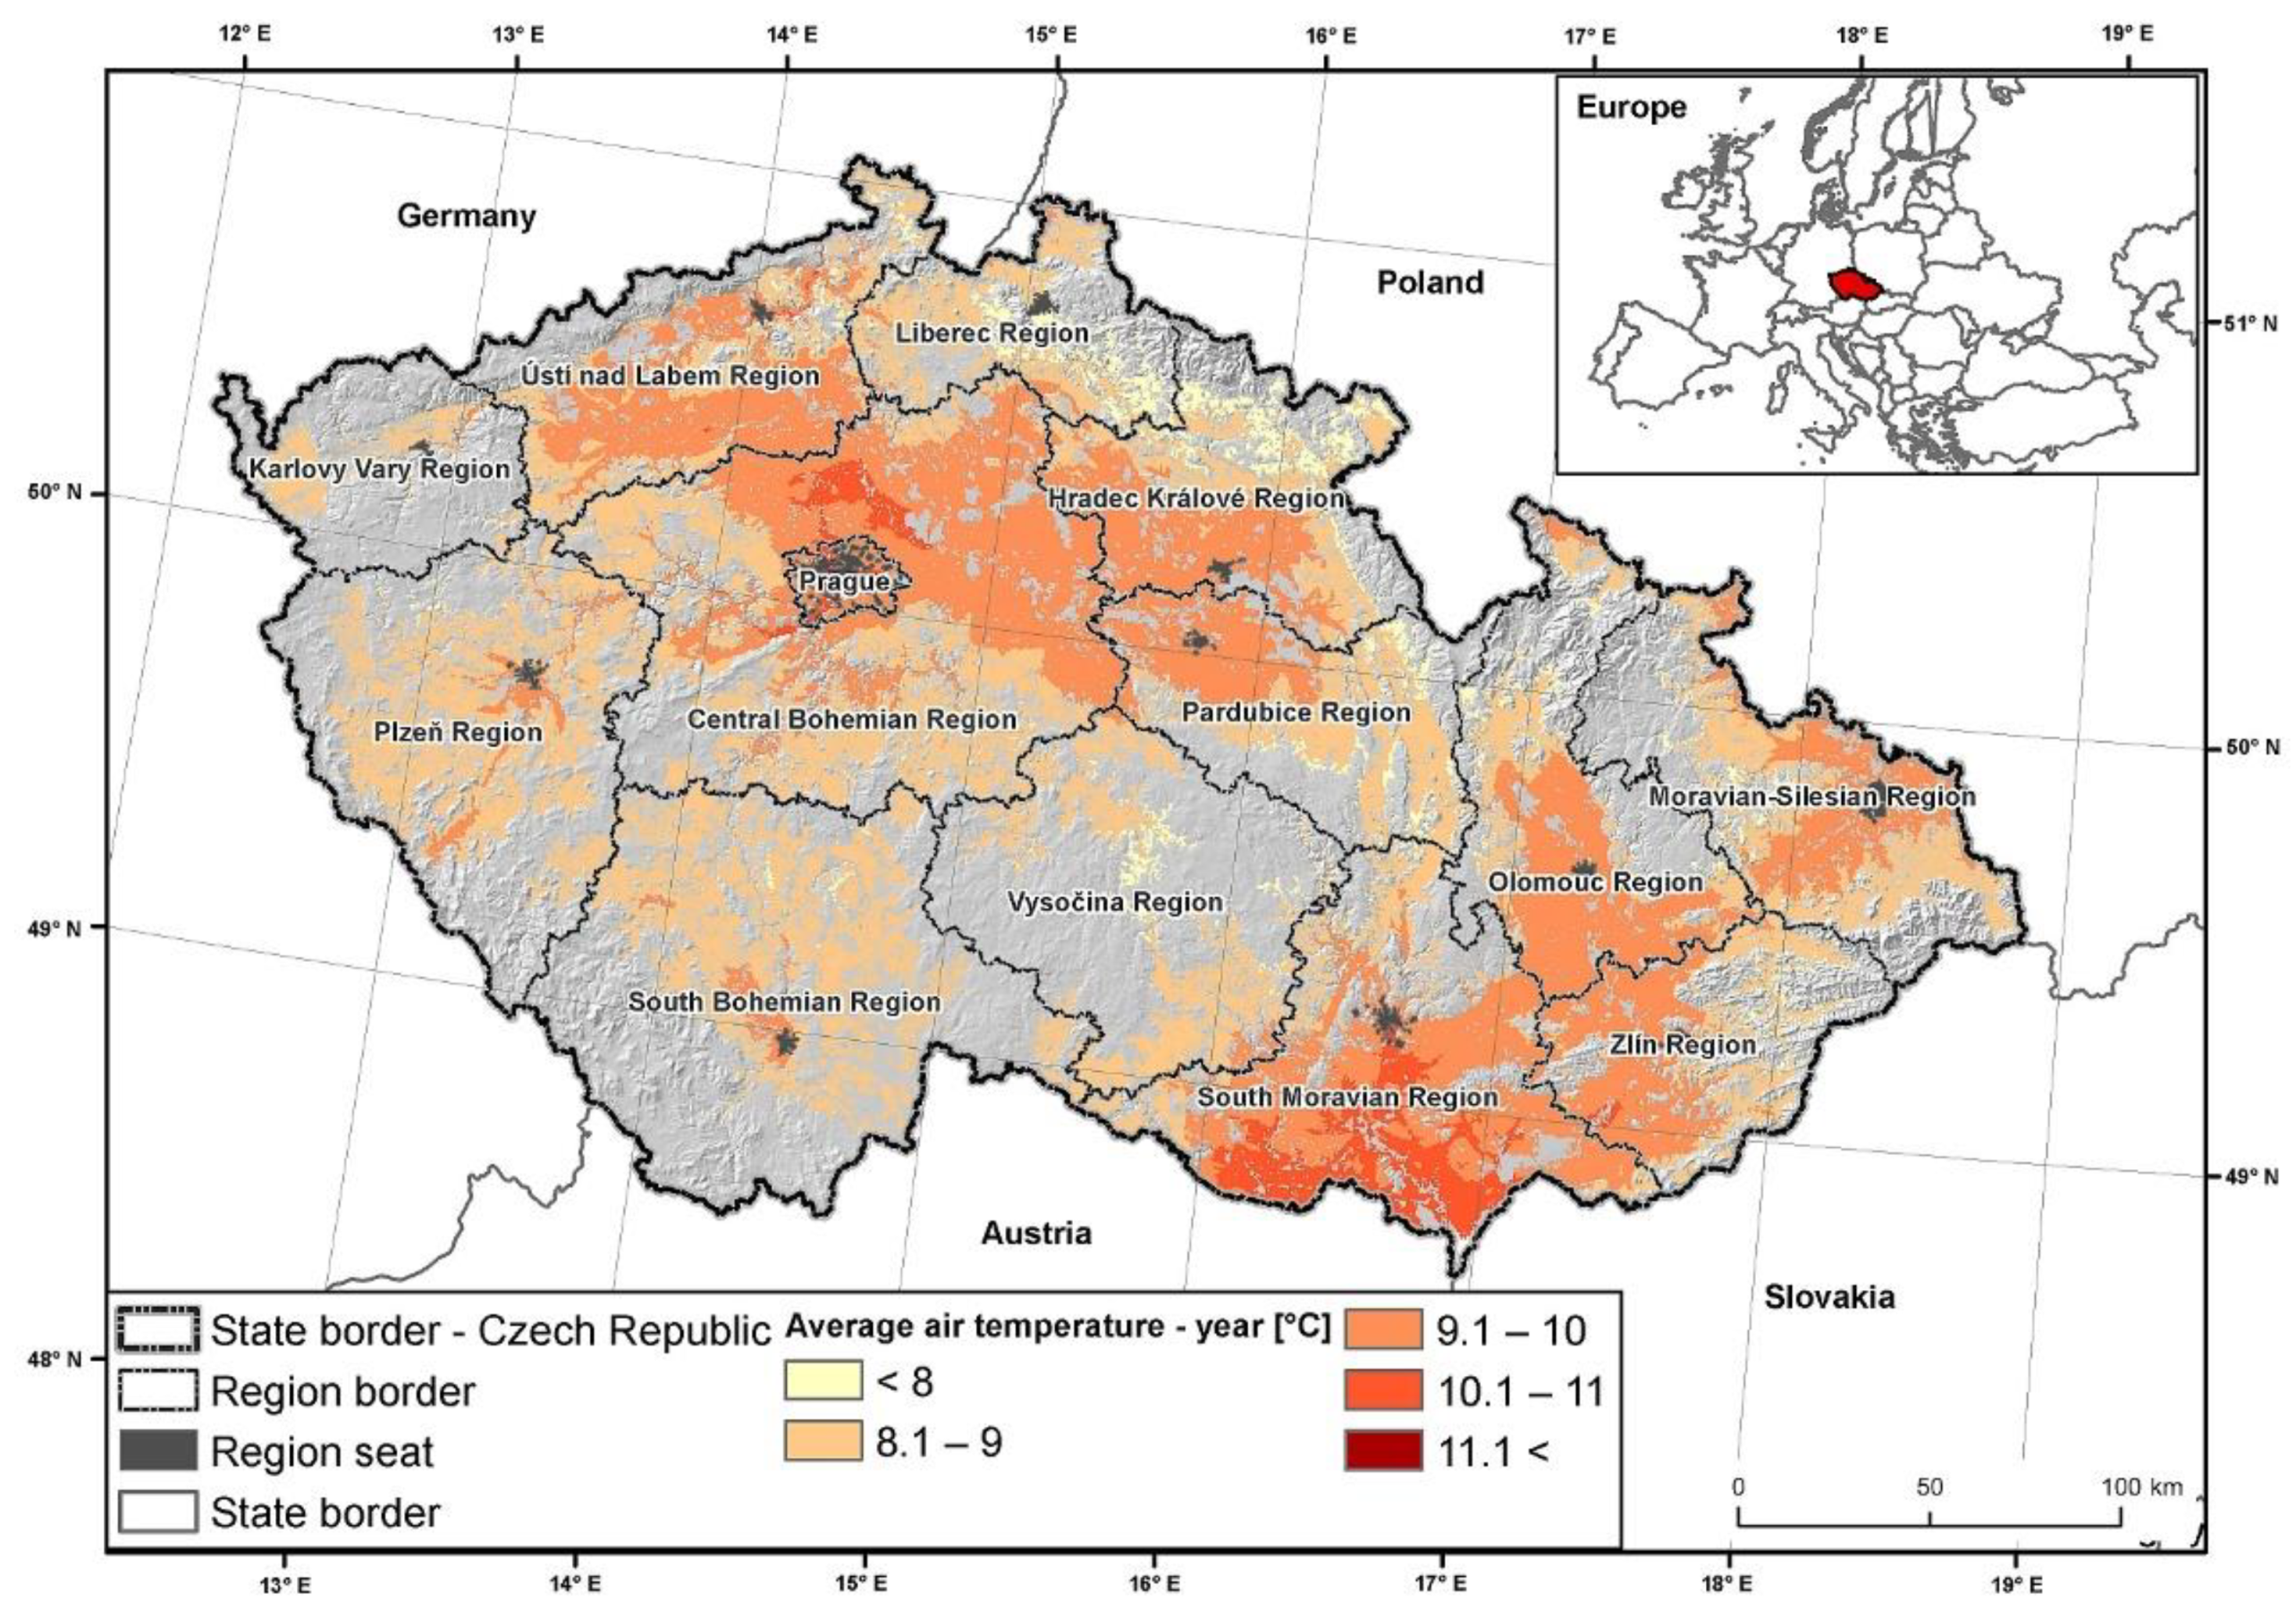
The data source for soil properties was the national soil database “Estimated Pedological Ecological Unit” (EPEU) in the form of a five-digit code developed in the Czech Republic in the 1970s to evaluate the main pedological and climatological conditions of agricultural land from its production ability viewpoint. The EPEU could be successfully used for the estimation of wind-erosion risk in terms of the SESAND degree (Figure 2).
Soil erosivity of clay soil (SECLAY)
Heavier soils are characterized by a lower proportion of macropores, thus showing lower water permeability for rainwater and overall aeration. If these soils accumulate rainwater at all, then due to high sorption capacity they lead poorly across the profile. As a result of all these phenomena, in heavier soils we encounter a double extreme; that is, in excess, the water concentrates on the soil surface and causes the site to become wet, and in the absence of water, hardening and cracking occur.
Some clay soils became vulnerable to wind erosion after they underwent the specific winter regime, which led to the creation of specific soil aggregates. The effects of moisture and temperature can cause significant changes in the aggregates and thus the erodibility of soil. Standardized methods allow aggregate-size distribution and aggregate stability, which affect wind erosion [42]. Bullock (1988) [43] measured the stability of soil aggregates throughout the year using wet sieving techniques. Major decreases in cohesion were found when the minimum daily air temperature fell to or below 0 °C during the winter and early spring months (caused by soil freezing at high water contents). Refs. [41,44] tried to identify the effects of freeze/thaw cycles and soil moisture on wind erosion with the help of wind-tunnel experiments. The surface-soil moisture content decreased in thawed soil and increased in frozen soil after wind erosion. The wind-driven sediment flow in the thawed soil was always greater than the flow of frozen soil with the same moisture content, but this difference became negligible at a moisture content above 3.38% (gravimetric moisture content) [44].
According to [41], the porosity of black soil with initial moisture contents on the surface of soil samples of 5–8% can increase by 1.4–1.5 times after the freeze/thaw process. The soil structure reaches a new stable state after 6 freeze/thaw cycles. The wind erosion increases with the number of freeze/thaw cycles. After 6–9 freeze/thaw cycles, the wind erosion of soil with moisture content of 5% and 7% increases by 1.2 and 2.0 times, respectively. The influence of freeze/thaw cycles on wind erosion is not significant when moisture exceeds 8%.
Therefore, in order to get SECLAY we defined soil potentially vulnerable to wind erosion (Table 3) and following criteria of the specific winter regime, which are combined according to Matrix 1 in Table 4):
(a)
soil properties SECLAY-SP (Table 1)
(b)
specific winter regime SECLAY-SWR
(i)
number of freeze–thaw and thaw–freeze episodes during the days without snow cover
(ii)
number of days with wet soil surface, allowing soil aggregate dispersion
Individual degrees of SECLAY brings Table 5.
Case study on SECLAY
The data source for soil properties was the national soil database EPEU. The data source for specific winter regime determination was the Czech Hydrometeorological Institute (CHMI) database, particularly the data on the “condition of bare soil surface” (CBSS) in combination with temperature data. The methodological approach to SECLAY is described in detail in [45]. The SECLAY degree for the area of the case study is presented in Figure 3.
Soil erosivity—vegetation cover factor (SEVC), soil surface roughness factor (SESR) and soil crust factor (SESC)
The SEVC factor comprises two different dimensions. First, the protective effect of soil coverage (SEVC-C)—mainly vegetation—and second, the protective effect of windbreaks (SEVC-W)—mainly tree shelters. Borrelli (2016) [46] and others expressed SEVC-C by using the percentage of the surface covered with nonerodible plant material. SEVC-W has often been based on optical porosity of windbreaks. The SESC factor affects wind erosion by dissipating the wind erosivity, while [46] used a land cover map to derive the roughness length.
We integrated both SEVC (i.e., SEVC-C and SEVC-W), and SESR factors indirectly by choosing the relevant periods for CE, i.e., spring and autumn, which are characterized by:
(i)
Little to no crop-vegetation cover and a flat and smooth soil surface with limited roughness (short before or after sowing).
(ii)
Low protective effect of tree windbreaks. The optimal efficiency of the windbreak is mainly given by the optimal porosity (39%) and structure of the windbreak—multiple-row design [47]. Ref. [48] suggested that porosity between 40% and 50% is the most efficient. The highest values of optical porosity (up to 50%) are achieved in the nonvegetation period. Almost full foliage of windbreaks occurs in approximately 10 days in the spring. Autumn leaf fall lasts longer, and a gradual change in the optical porosity is longer.
(iii)
With a tendency to be windier, according to [29], the average wind velocity is increasing by 1–2 m s−1 in the Czech Republic during these periods. It can be concluded that wind erosion is very intense at the beginning of spring, especially after the dry winter, and has a major impact on the regional agriculture.
SESC is relevant mainly to heavy textured soil “CLAY” and is reflected in their classification into the different risk categories in Table 3 and Table 5.

2.2.2. Climatic Erosivity (CE)

Kouchami-Sardoo (2019) [49] developed a quantification of wind-erosion risk by incorporating the assessments of consequence and vulnerability. The model used was evaluated by scenario testing, sensitivity analysis, and wind tunnel measurements, which provided reasonable estimates of the soil vulnerability, consequence and risk to/of wind erosion. The results showed that weather factors were among the most important parameters affecting wind erosion risk.
CE is basically defined as a measure of the climatic tendency to produce conditions conducive to wind erosion. Ref. [30] expressed the CE using the equation developed by [50] employing the mean monthly wind speed (m s−1) at a 2 m height and the potential evapotranspiration (mm) and the precipitation (mm). However, these are macroclimatic parameters that do not take into account the threshold wind speed and soil surface.
To obtain the CE degrees, we employed a complex approach that takes into account relevant climate variables, i.e., the drought in the surface layer (CE-DSL) and risk of erosive wind occurrence (CE-REW).
CE-DSL
Soils identified as vulnerable (see SE chapter) increase their susceptibility to wind erosion with the drought occurrence in their surface layer. In terms of wind erosion, the moisture of the soil surface is crucial mainly in the periods when the soil is uncovered by vegetation. Since the 1970s, remote sensing data have been of limited use for the purposes of assessing soil surface moisture [51,52]. For example, the successful use of the spatial resolution and frequency of imaging was not possible for the evaluation of soil-erosion hazards at the regional scale, especially when the land structure significantly differs. In those areas, it is worth applying data from sufficiently dense ground measurement networks of soil moisture if available.
CE-REW
Wind velocity is important for assessing wind erosion mainly in terms of the AWE. In this case, it is necessary to evaluate the actual wind velocity during a specific wind erosion event and relate it to real soil loss. In the case of the PWE, actual wind velocity is not taken into account, but average long-term wind conditions along with other parameters of SE and CE define the complex vulnerability of soil to wind erosion.
Wind direction and velocity measurements are normally performed 10 m above the surface. The wind speed required to initiate soil transport is referred to as the threshold wind speed (TWS). The TWS is a particularly important parameter but is difficult to determine it in wide-scale field studies. Most studies on the relationship between the particle size distribution of sediment and wind speed have focused on wind-tunnel experiments [53,54,55,56].
However, many factors that affect wind erosion and dust emission, e.g., clod structure, crusting, and soil shear strength, are difficult to simulate concurrently in a wind tunnel; thus, the results of wind-tunnel experiments cannot completely reflect the change in the particle-size distribution of sediment with wind speed [57]. It is preferable to study the effect of wind speed on the particle-size distribution of sediment through field observations. However, it is difficult to completely collect and accurately determine the particle-size distribution of sediments at different wind speeds in the field [58,59]. The divergence in the erodibility for different sizes of particles at different wind speeds plays a critical role in changing the regularity of the aggregate-size distribution of windblown sediment with increasing wind speed.
The TWS varies with soil type. Based on wind-tunnel experiments, [60] determined the TWC for various soil types (sandy, loamy–sandy, sandy–loamy and loamy) in dry and wet conditions (3.3 m s−1 for sandy and 22 m s−1 for loamy–sandy), with the lowest/critical value of 3.3 m s−1. According to [61], the TWS ranged from 8.0 m s−1 to 22.0 m s−1. For Hungarian soils (central Europe) on the basis of wind-tunnel experiments, [62] stated the TWSs for soils with sand texture (5.7–8.1 m s−1), loamy sand texture (6.1–9.1 m s−1), sandy loam texture (7.4–9.8 m s−1), loam texture (9.3–11.6 m s−1) and silt loam texture (10.0–11.6 m s−1). The wind data measured by weather stations at a height of 10 m can be easily interpolated to any height of 0 m to 10 m using models with the estimated parameters mentioned in [63]. This study provides results that were used for the derivation of the wind speed at ground level. It can be derived that wind speeds of 10 m s−1 and 10 m correspond to 3.3 m s−1 at ground level.
Considering two principally different mechanisms of wind erosion due to different soil types, we again distinguish between CE of sandy soils (CESAND) and CE of clay soils (CECLAY).
Climatic erosivity of sandy soil (CESAND)
Sandy soils, identified as vulnerable (see the SESAND chapter), increase their susceptibility to wind erosion with drought in their surface layer. Contrary to clay soils, the SESAND of sandy soils is not affected by a specific winter regime but is simply given by their texture, i.e., the content of the EF in both seasons with low SEVC and SESC (spring and autumn) factors are taken into account in terms of the drought in the surface layer.
(a)
Drought in the surface layer (CESAND-DSL)
Aware of the general comments on the CESAND, the spring and autumn periods were taken into account in terms of CESAND-DSL.
(b)
Risk of the erosive-wind occurrence (CESAND-REW)
Considering the general comments on the CECLAY, only the spring period was taken into account in terms of the CESAND-REW.
The CESAND-DSL and CESAND-REW, when joined together according to Matrix 2 (Table 6), reveal the degrees of CESAND.
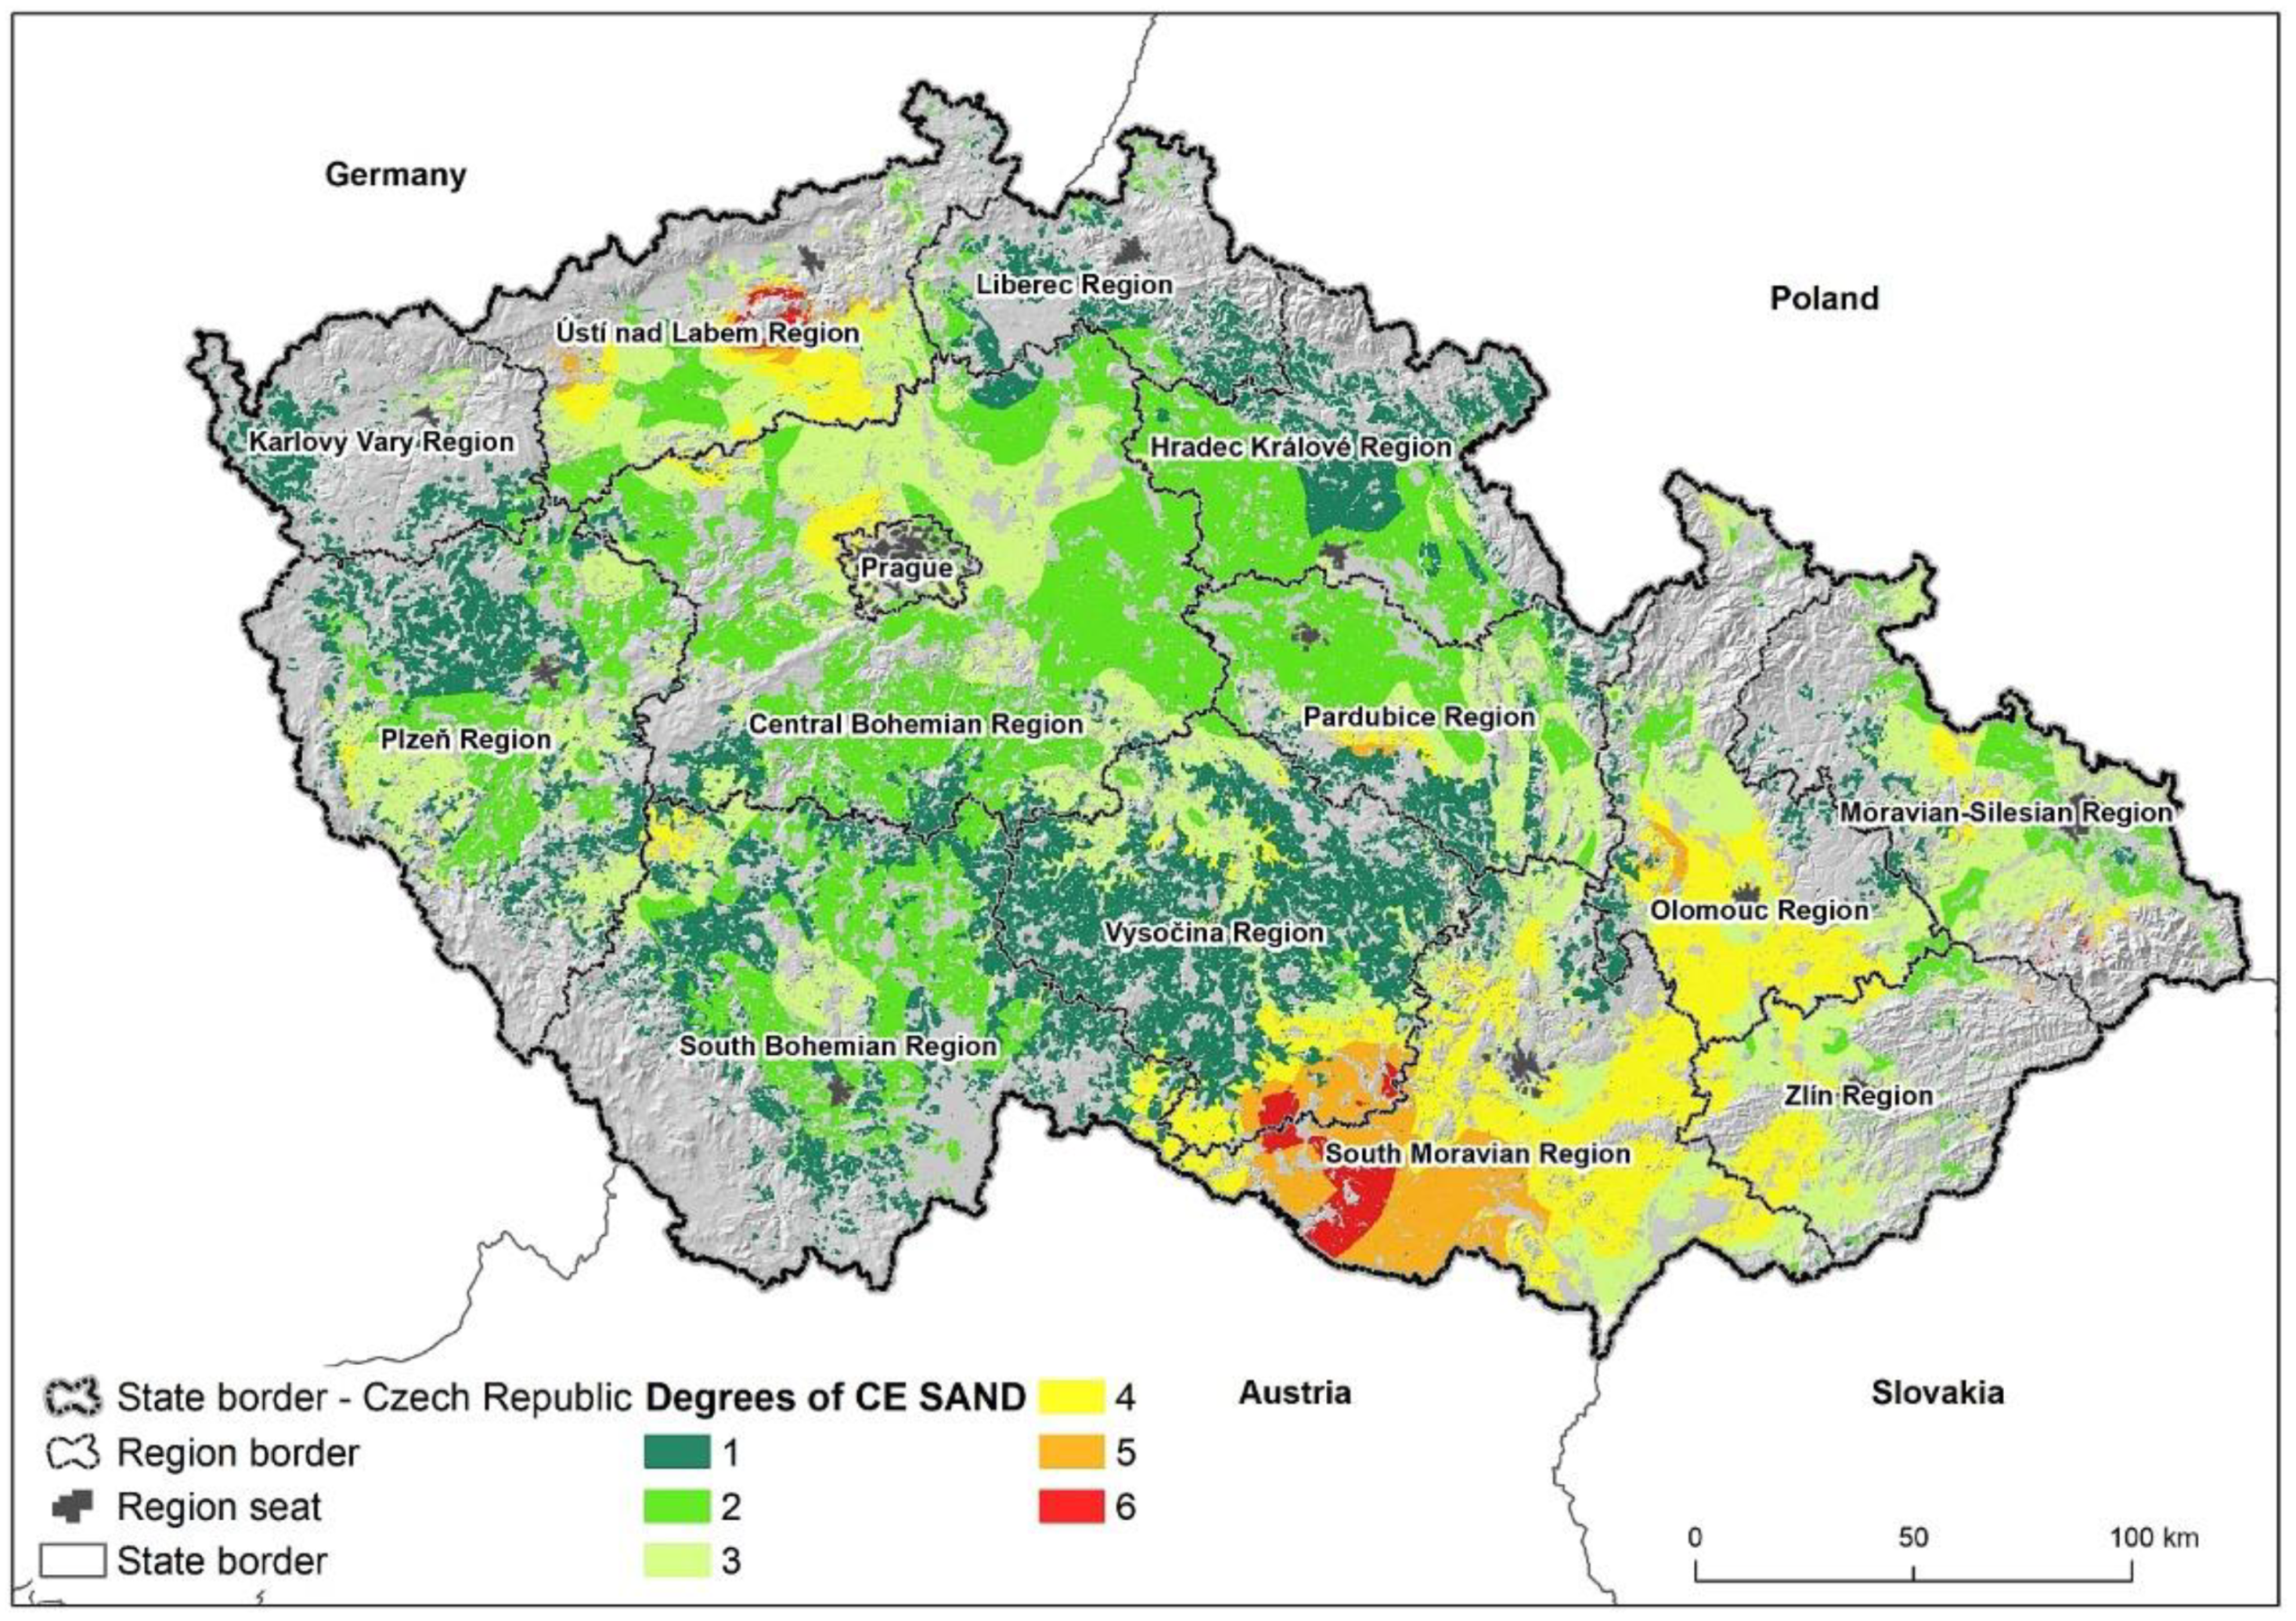
Case study on CESAND
CESAND-DSL
To identify drought in the soil-surface layer, we employed CBSS data. This indicator is specified in [45]. With respect to the spring and autumn vulnerability of sandy soils described above, CBSS data (code 0) from spring (March to May) and autumn (September to October) were employed for CESAND identification. CBSS code 0 is defined as: “soil surface is completely dry but not frozen; soil particles crumble to dust when squeezed, wind picks up dust from soil”. The long-term (30yr) average number of days with CBSS code 0 was calculated for 70 stations all over the area of interest. The area of interest was divided accordingly into 5 categories of the CESAND-DSL.
CESAND-REW
The risk of erosive winds in the spring and autumn was based on 10-min or 15-min wind speed data from 103 stations all over the area of interest for the longest possible (9 years) period in terms of data availability. The percentage of 10/15 min with a wind gust above 10 m s−1 of the total number of measurements (approx. 136,000 values for each station) was determined. The threshold value of the wind speed 10 m s−1 (measured at a height of 10 m above the surface) results from the conclusions of field measurements, when it was found that the ground wind speed is approximately one-third to one-half the wind speed at 10 m. A speed of 3.3 m s−1 is then the minimum towing speed for soil particles on dry light soil. The area of interest was divided accordingly into 5 categories of CESAND-REW.
The CESAND degree for the area of the case study is presented in Figure 4.
Climatic erosivity of clay soil (CECLAY)
In terms of the mechanism, CECLAY is analogous to CESAND with one modification. CECLAY deals with critical period determination. Due to the specific winter regime, which invokes the creation of aggregates removable by wind, the critical period for clay soils in terms of the drought occurrence is mainly early spring. In the spring months, these soils show considerable potential erodibility due to the disintegration of aggregates in the winter, while in the autumn they tend to be mostly compact, and unless they are damaged by inappropriate cultivation they are almost invulnerable to wind erosion. Therefore, only spring droughts were taken into account.
(a)
Drought in the surface layer (CECLAY-DSL)
Aware of the general comments on CECLAY, only the spring period was taken into account in terms of the CECLAY-DSL.
(b)
Risk of the erosive wind occurrence (CECLAY-REW)
Considering the general comments on CECLAY, only the spring period was taken into account in terms of the CECLAY-REW.
“Drought in surface layer” and “Risk of erosive wind occurrence” when joined together according to Matrix 2 (Table 6) reveal the degrees of CECLAY (Table 7).
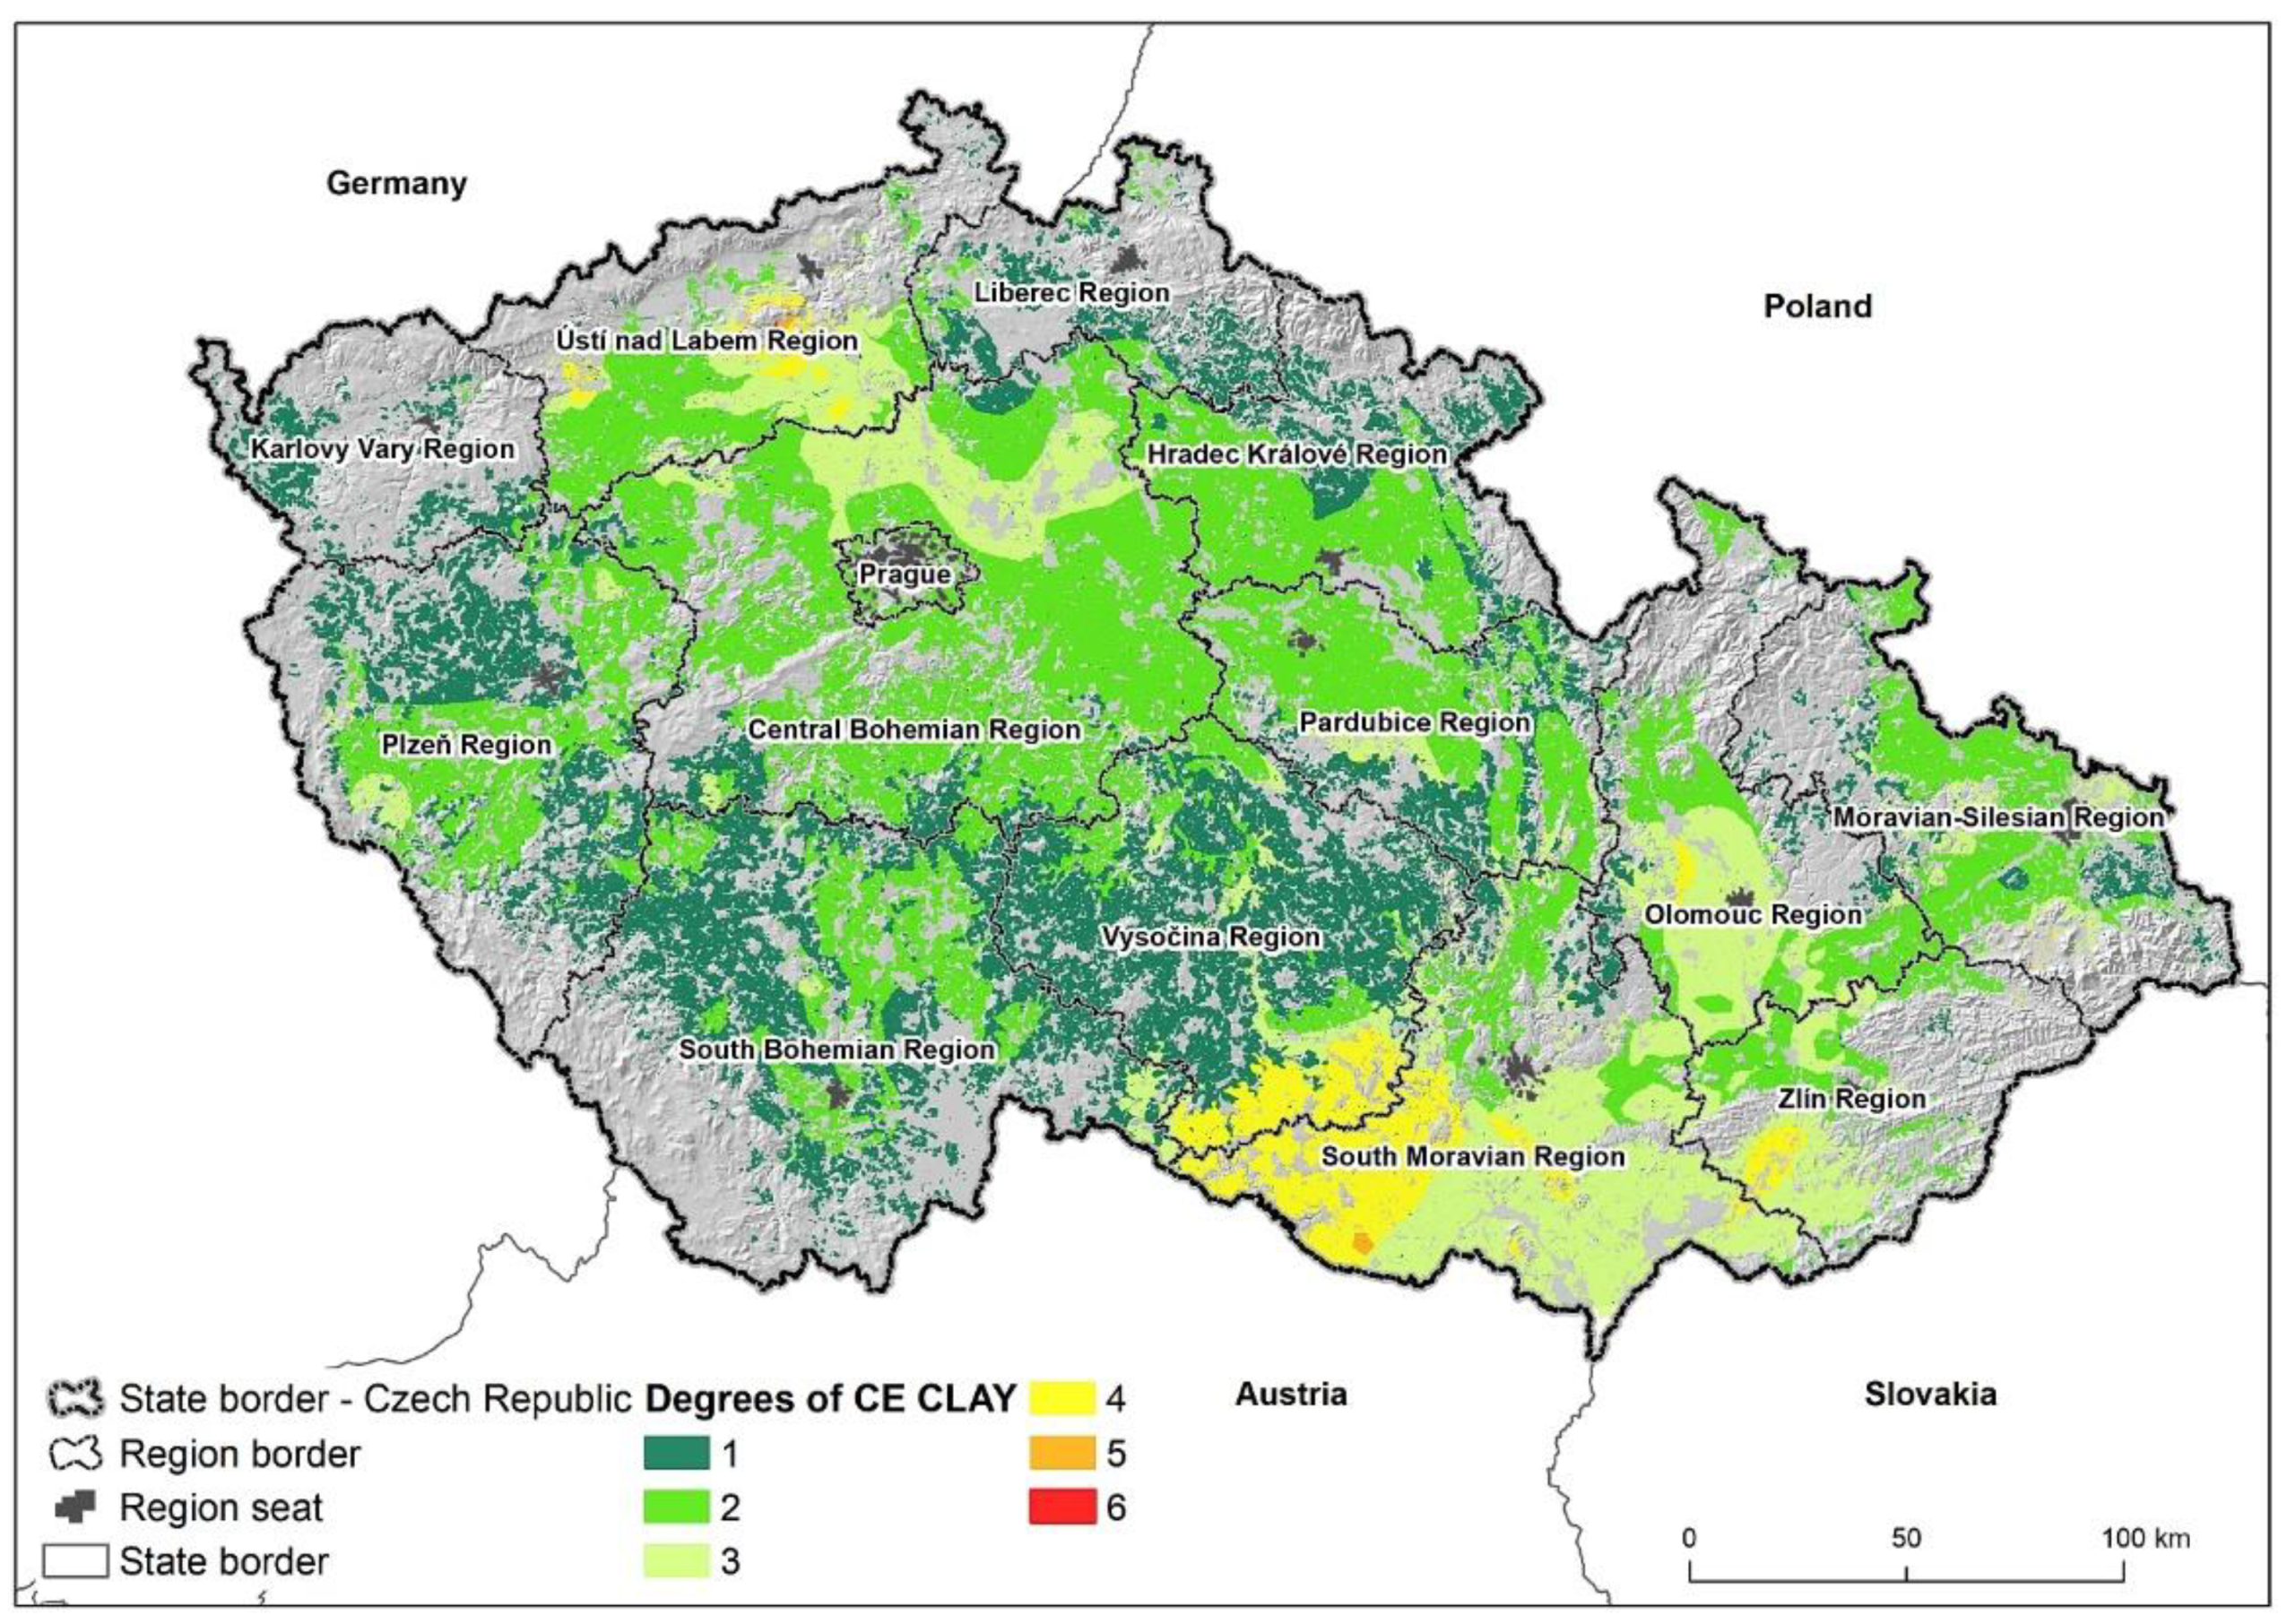
Case study on CECLAY
CECLAY-DSL and CECLAY-REW were estimated analogically to CESAND-DSL and CESAND-REW. However, with respect to the general definition of CECLAY, only data from the spring period were used.
The CECLAY degrees for the area of the case study are presented in Figure 5.

2.3. PWE

Overall PWE consists of both PWESAND (Table 8) and PWECLAY (Table 9).

2.3.1. PWESAND

Join SESAND 2, 4, 6 (see Table 2) with CESAND (see Table 6—Matrix 2).

2.3.2. PWECLAY

Join SECLAY 1, 3, 5 (see Table 5) with CECLAY (see Table 7—Matrix 3).
PWESAND and PWECLAY, when combined, reveal aggregate PWE degrees. The grouping according to Table 10 belongs to one of the risk categories of the PWE.
Case study on PWE
The resulting PWE combining both PWESAND and PWECLAY and respected categorization of the case study area is presented in Figure 6.

3. Results

The main goal of the paper was to develop a complex methodological protocol (expressed as “road map”—see Figure 7) to identify and classify the risk of wind erosion given as PWE degrees and their subsequent distribution into six PWE categories (Table 10). Particular steps of the road map creation are gradually and described in detail in the methodology. Figure 7 thus summarizes the whole methodological process of PWE derivation. We also bring the “road map” application to demonstrate the entire method on a particular case study area in central Europe that represents part of the Czech Republic. The indicators employed in the case study to express key soil–climatic elements are summarized in Table 11. The “road map” being applied to the case -study area classifies it as 46% out of exposure and 54% under exposure, while the majority of the area falls into subtle and slight exposure categories of PWE (Figure 8).

4. Discussion

Gradual progress in natural risk assessment, quantification and modelling of water erosion has been connected with development of computer science such as computer simulation, machine learning, artificial intelligence, geospatial technology and remote sensing in recent decades. Enhanced approaches such as concept of connectivity [64], which allows building models with a holistic approach to simulate system dynamics to design better measuring and modelling schemes for water and sediment dynamics are yet to reveal their potential.
On the contrary, advanced machine learning and related techniques have not been sufficiently applied on the issue of wind erosion except for several surveys, for instance [65]. Since wind erosion is actually an area-wide phenomenon its spatial variability and regional specificity cause methodological obstacles of its monitoring and modelling. Physical process-based models, such as the WEQ, the wind erosion prediction system (WEPS), and the revised wind erosion equation (RWEQ), in combination with GIS methods, are frequently used for soil-risk quantification. However, these models have mainly been developed for the agro–ecological conditions of North America. These methods are primarily applicable to relatively small areas that are known to be susceptible to wind erosion [66,67]. Furthermore, compromising methods of wind-risk estimation have been employed in Germany. The standard in question is DIN 19706:2013-02 “Soil quality—Determination of the soil erosion risk caused by wind”. The map “Potential risk of wind erosion on arable soils in Germany” is based on pedological (soil category, humus content) and climatic factors (mean annual wind speed at 10 m above ground level); the land-use information is derived from the CORINE land-cover data set. A similar concept for wind soil assessment in Iran (vegetation-cover data based on remote sensing from the Moderate Resolution Imaging Spectroradiometer Normalized Difference Vegetation Index—MODIS NDVI, a basic soil texture map and wind speed data from meteorological stations) was used by [68].
The findings of our case study were compared with various surveys on wind erosion previously conducted.
According to [46], who developed unified methodology of the wind risk estimation based on the CE, soil erodibility, vegetation cover and landscape roughness (Index of Land Susceptibility to Wind Erosion—ILSWE) for 36 European countries, the Czech Republic belongs among the countries with low land susceptibility to wind erosion (just 1.8% of the area falls into moderate susceptibility but not into high land susceptibility). Similarly, the analysis of wind-erosion risk based on the number of erosive days by [69] classifies the majority of the Czech Republic as slightly endangered (0.03–1.5 erosive days per year). It well corresponds to our findings given in our results. However, very high values of the erosivity index (mainly determined by the wind velocity and modified by the moisture conditions) and small or medium values of the erodibility index (mainly attributed to the texture and organic matter content) in the climate of the Czech Republic were reported by [70]. Analogically, a map of the distribution of wind-erosion risk within NUTS-x for the EU-27 in 2025 [71] classifies the majority of the Czech area as regions with high or the highest wind-erosion risk (2–5.57 and more than 5.57 t ha−1 year−1). An evaluation of topsoil loss by wind was published by [69]. The most extensive and severe wind erosion is mapped in southeastern Europe, Romania, Ukraine and Russia. According to this study, the Czech Republic is the most endangered among all countries of western and central Europe.
Unlike the abovementioned studies, our approach to PWE also encompassed a module of clay soils, which are not generally considered to be vulnerable to wind erosion. That is why they are not being linked to any risk category in terms of the PWE. However, some authors [35,36,41] claim that the combination of particular soil properties with a specific winter regime makes specific clay soils highly vulnerable to wind erosion. The periodic freezing and thawing of soil combined with enormous moisture cause aggregate disintegration. Previously, published and generally used methods of the PWE estimation (even though they are more profound in terms of soil-crust factors, crop factors, etc.) by [30,31,32,33] do not take into account one of the crucial climatic elements of the PWE, i.e., PWE long-term wind conditions. The areas that tend to be windier are logically under a higher risk of wind erosion than calm areas. However, it is important to emphasize that long-term wind conditions, as a key factor of PWE, cannot be mistaken for actual wind and are a key factor of the AWE.

5. Conclusions

This study contributes to worldwide land anti-degradation efforts and provides new insights into the methodological approach of wind-erosion risk assessment. We identified and employed key soil–climatic elements that make soil vulnerable to wind erosion. Only when all of them are combined it enables wind-erosion risk across various soil and climate environments to be evaluated. We provided a parallel application of the method on the particular case study, which also suggests usable indicators for each element. An interregional comparation is possible, as long as all employed indicators are homogenous across regions. However, following the road map, it is also possible to classify any region in terms of the wind-erosion risk even with the application of different indicators according to the data available. The novelty of our method lies in: (i) all relevant soil–climatic data of wind erosion are combined, (ii) different soil types “sand” and “clay” are evaluated simultaneously with respect to the different mechanisms of wind erosion, and (iii) a methodological road map enables its application for various conditions. To be effective, wind-erosion research requires the explicit articulation of its objectives, which should be interpreted and translated into real actions. Our results provide a useful tool for management decisions. High-quality data and analyses that can support decision making are demanding. Based on our method, it is possible to set threshold values that, when exceeded, trigger landscape adjustments, more detailed in situ measurements, or indicate a need for specific management.
Ongoing and planned future research will attempt to merge the map of the PWE with anti-erosion measures (windbreaks) and revise the PWE accordingly. The resulting GIS-based software would then allow not only an evaluation of the efficiency of existing measures, but also a judgment of various plans of the building of the new ones to accomplish healthy, resilient and sustainable landscapes.

Author Contributions

The project was initiated by Hana Středová and Jana Podhrázská. Conceptualization, Hana Středová and Jana Podhrázská; methodology, Tomáš Středa; software, Filip Chuchma and Josef Kučera; validation and formal analysis, Petra Fukalová and Martin Blecha; resources, Petra Fukalová; writing—original draft preparation, Hana Středová and Tomáš Středa; writing—review and editing, Tomáš Středa and Petra Fukalová. All authors have read and agreed to the published version of the manuscript.

Funding

This research was supported by the Ministry of Agriculture of the Czech Republic (National Agency of Agricultural Research Ministry of Agriculture of the Czech Republic) project No. QK1710197 Optimization of methods for the assessment of vulnerability to wind erosion and proposals of protective measures in intensively exploited agricultural countryside and QK1920280 Innovation of the Evaluated Soil-Ecological Units (BPEJ) for state administration needs.

Data Availability Statement

The data presented in this study are available on request from the corresponding author. The data are not publicly available due to licensing policy of data providers (Czech Hydrometeorological Institute and Research Institute for Soil and Water Conservation).

Conflicts of Interest

The authors declare no conflict of interest. The funders had no role in the design of the study; in the collection, analyses, or interpretation of data; in the writing of the manuscript, or in the decision to publish the results.

References

  1. Keesstra, S.D.; Geissen, V.; Mosse, K.; Piiranen, S.; Scudiero, E.; Leistra, M.; van Schaik, L. Soil as a filter for groundwater quality. Curr. Opin. Environ. Sust. 2012, 4, 507–516. [Google Scholar] [CrossRef]
  2. Gomez, J.A.; Ben-Gal, A.; Alarcon, J.; De Lannnoy, G.; De Roos, S.; Dostál, T.; Fereres, E.; Intrigliolo, D.S.; Krása, J.; Klik, A.; et al. SHui, an EU-Chinese cooperative project to optimize soil and water management in agricultural areas in the XXI century. Int. Soil Water Conserv. Res. 2020, 8, 1–14. [Google Scholar] [CrossRef]
  3. Devaty, J.; Dostal, T.; Hosl, R.; Krasa, J.; Strauss, P. Effects of historical land use and land pattern changes on soil erosion—Case studies from Lower Austria and Central Bohemia. Land Use Policy 2019, 82, 674–685. [Google Scholar] [CrossRef]
  4. Li, J.; Ma, X.; Zhang, C. Predicting the spatiotemporal variation in soil wind erosion across Central Asia in response to climate change in the 21st century. Sci. Total Environ. 2020, 709, 136060. [Google Scholar] [CrossRef] [PubMed]
  5. Podhrázská, J.; Kučera, J.; Chuchma, F.; Středa, T.; Středová, H. Effect of changes in some climatic factors on wind erosion risks—the case study of South Moravia. Acta Univ. Agric. Silvic. Mendelianae Brun. 2013, 61, 1829–1837. [Google Scholar] [CrossRef] [Green Version]
  6. Herceg, A.; Nolz, R.; Kalicz, P.; Gribovszki, Z. Predicting impacts of climate change on evapotranspiration and soil moisture for a site with subhumid climate. J. Hydrol. Hydromech. 2019, 67, 384–392. [Google Scholar] [CrossRef] [Green Version]
  7. Bartík, M.; Sitko, R.; Oreňák, M.; Slovik, J.; Škvarenina, J. Snow accumulation and ablation in disturbed mountain spruce forest in West Tatra Mts. Biologia 2014, 69, 1492–1501. [Google Scholar] [CrossRef]
  8. Bartík, M.; Holko, L.; Jančo, M.; Škvarenina, J.; Danko, M.; Kostka, Z. Influence of mountain spruce forest dieback on snow accumulation and melt. J. Hydrol. Hydromech. 2019, 67, 59–69. [Google Scholar] [CrossRef] [Green Version]
  9. Stehnová, E.; Středová, H. Phenological phases and their possible influence on soil erosion at maize. In Proceedings of the MendelNet 2017: International PhD Students Conference, Brno, Czech Republic, 8–9 November 2017; pp. 483–488. [Google Scholar]
  10. Lukasova, V.; Bucha, T.; Skvareninova, J.; Skvarenina, J. Validation and application of European Beech phenological metrics derived from MODIS data along an altitudinal gradient. Water 2019, 10, 60. [Google Scholar] [CrossRef] [Green Version]
  11. Lukasova, V.; Vido, J.; Skvareninova, J.; Bicarova, S.; Hlavata, H.; Borsanyi, P.; Skvarenina, J. Autumn phenological response of European Beech to summer drought and heat. Water 2020, 12, 2610. [Google Scholar] [CrossRef]
  12. Středa, T.; Cerkal, R.; Hájková, L.; Chuchma, F.; Khel, T.; Klimešová, J. GIS application in abiotic risks regionalization for spring barley. Contrib. Geophys. Geod. 2020, 50, 49–60. [Google Scholar] [CrossRef]
  13. Středa, T.; Středová, H.; Chuchma, F.; Kučera, J.; Rožnovský, J. Smart method of agricultural drought regionalization: A winter wheat case study. Contrib. Geophys. Geod. 2019, 49, 25–36. [Google Scholar] [CrossRef] [Green Version]
  14. Wolfe, S.A.; Nickling, W.G. The protective role of sparse vegetation in wind erosion. Prog. Phys. Geogr. Earth Environ. 1993, 17, 50–68. [Google Scholar] [CrossRef]
  15. Keesstra, S.; Mol, G.; De Leeuw, J.; Okx, J.; Molenaar, C.; De Cleen, M.; Visser, S. Soil-related sustainable development goals: Four concepts to make land degradation neutrality and restoration work. Land 2018, 7, 133. [Google Scholar] [CrossRef] [Green Version]
  16. Webb, N.P.; Pierre, C. Quantifying anthropogenic dust emissions. Earths Future 2018, 6, 286–295. [Google Scholar] [CrossRef] [Green Version]
  17. Borrelli, P.; Ballabio, C.; Panagos, P.; Montanarella, L. Wind erosion susceptibility of European soils. Geoderma 2014, 232–234, 471–478. [Google Scholar] [CrossRef]
  18. Webb, N.P.; Kachergis, E.; Miller, S.W.; McCord, S.E.; Bestelmeyer, B.T.; Brown, J.R.; Chappell, A.; Edwards, B.L.; Herrick, J.E.; Karl, J.W.; et al. Indicators and benchmarks for wind erosion monitoring, assessment and management. Ecol. Indic. 2020, 110, 105881. [Google Scholar] [CrossRef]
  19. Gross, J.; Barring, L. Wind erosion in Europe: Where and when. In Wind Erosion on Agricultural Land in Europe; Warren, A., Ed.; European Commission, Directorate-General for Research, Office for Official Publications of the European Communities; European Commission: Luxemburg, 2003; pp. 13–28. [Google Scholar]
  20. Woodruff, N.P.; Siddoway, F.H. A wind erosion equation. Soil Sci. Soc. Am. J. 1965, 29, 602–608. [Google Scholar] [CrossRef]
  21. Rizgalla, A.M. Prediction of potential wind erosion of some fields around Al Obied (North Kordofan State-Sudan). ARPN J. Sci. Technol. 2014, 4, 795–802. [Google Scholar]
  22. Klik, A. Wind erosion assessment in Austria using wind erosion equation and GIS. In Agricultural Impacts on Soil Erosion and Soil Biodiversity: Developing Indicators for Policy Analysis; Francaviglia, R., Ed.; Istituto Sperimentale per la Nutrizione delle Piante: Roma, Italy, 2004; pp. 145–154. [Google Scholar]
  23. Streďanský, J.; Lackóová, L.; Streďanská, A.; Varga, V. Determination of soil endangerment by wind erosion with consideration of legislative changes in acceptable soil loss. Ekologia 2015, 34, 1–6. [Google Scholar] [CrossRef]
  24. Xi, X.; Sokolik, I.N. Quantifying the anthropogenic dust emission from agricultural land use and desiccation of the Aral Sea in Central Asia. J. Geophys. Res. Atmos. 2016, 121, 12270–12281. [Google Scholar] [CrossRef]
  25. Yulevitch, G.; Danon, M.; Krasovitov, B.; Fominykh, A.; Swet, N.; Tsesarsky, M.; Katra, I. Evaluation of wind-induced dust-PM emission from unpaved roads varying in silt content by experimental results. Atmos. Pollut. Res. 2020, 11, 261–268. [Google Scholar] [CrossRef]
  26. Katra, I. Soil erosion by wind and dust emission in semi-arid soils due to agricultural activities. Agronomy 2020, 10, 89. [Google Scholar] [CrossRef] [Green Version]
  27. Wright, S.L.; Ulke, J.; Font, A.; Chan, K.L.A.; Kelly, F.J. Atmospheric microplastic deposition in an urban environment and an evaluation of transport. Environ. Int. 2020, 136, 105411. [Google Scholar] [CrossRef]
  28. Středová, H.; Fukalová, P.; Chuchma, F.; Středa, T. A complex method for estimation of multiple abiotic hazards in forest ecosystems. Water 2020, 12, 2872. [Google Scholar] [CrossRef]
  29. Tolasz, R. Atlas Podnebí Česka: Climate Atlas of Czechia; Český Hydrometeorologický Ústav: Praha, Czech Republic, 2007. (In Czech) [Google Scholar]
  30. Fenta, A.A.; Tsunekawa, A.; Haregeweyn, N.; Poesen, J.; Tsubo, M.; Borrelli, P.; Panagos, P.; Vanmaercke, M.; Broeckx, J.; Yasuda, H.; et al. Land susceptibility to water and wind erosion risks in the East Africa region. Sci. Total Environ. 2020, 703, 135016. [Google Scholar] [CrossRef]
  31. Borrelli, P.; Lugato, E.; Montanarella, L.; Panagos, P. A new assessment of soil loss due to wind erosion in European agricultural soils using a quantitative spatially distributed modelling approach. Land Degrad. Dev. 2017, 28, 335–344. [Google Scholar] [CrossRef] [Green Version]
  32. Fryrear, D.W.; Krammes, C.A.; Williamson, D.L.; Zobeck, T.M. Computing the wind erodible fraction of soils. J. Soil Water Conserv. 1994, 49, 183–188. [Google Scholar]
  33. Fryrear, D.W.; Saleh, A.; Bilbro, J.D.; Schomberg, H.; Stout, J.E.; Zobeck, T.M. Revised Wind Erosion Equation (RWEQ). USDA-ARS: Southern plains area cropping systems research laboratory—Wind erosion and water conservation research. Lubbock, USA. Tech. Bull. 1998, 1. [Google Scholar]
  34. Singer, M.J.; Shainberg, I. Mineral soil surface crusts and wind and water erosion. Earth Surf. Proc. Land 2004, 29, 1065–1075. [Google Scholar] [CrossRef]
  35. Chepil, W.S. Factors that influence clod structure and erodibility of soil by wind: I., Soil texture. Soil Sci. 1953, 75, 473–484. [Google Scholar] [CrossRef]
  36. Chepil, W.S. Seasonal fluctuations in soil structure and erodibility of soil by wind. Soil Sci. Soc. Am. J. 1954, 18, 13–16. [Google Scholar] [CrossRef]
  37. Hinman, W.C.; Bisal, F. Alterations of soil structure upon freezing and thawing and subsequent drying. Can. J. Soil Sci. 1968, 48, 193–197. [Google Scholar] [CrossRef]
  38. Skidmore, E.L.; Layton, J.B. Dry-soil aggregate stability as influenced by selected soil properties. Soil Sci. Soc. Am. J. 1992, 56, 557–561. [Google Scholar] [CrossRef] [Green Version]
  39. Sahin, U.; Anapali, O. The effect of freeze-thaw cycles on soil aggregate stability in different salinity and sodicity conditions. Span. J. Agric. Res. 2007, 5, 431–434. [Google Scholar] [CrossRef]
  40. Dagesse, D.F. Freezing cycle effects on water stability of soil aggregates. Can. J. Soil Sci. 2013, 93, 473–483. [Google Scholar] [CrossRef]
  41. Liu, T.; Xu, X.; Yang, J. Experimental study on the effect of freezing-thawing cycles on wind erosion of black soil in Northeast China. Cold Reg. Sci. Technol. 2017, 136, 1–8. [Google Scholar] [CrossRef]
  42. Tatarko, J.; Wagner, L.E.; Boyce, C.A. Effects of overwinter processes on stability of dry soil aggregates. In Soil Erosion Research for the 21st Century; Ascough, J.C., II, Flanagan, D.C., Eds.; American Society of Agricultural and Biological Engineers (ASABE): Honolulu, HI, USA, 2001; pp. 459–462. [Google Scholar] [CrossRef]
  43. Bullock, M.S.; Nelson, S.D.; Kemper, W.D. Soil cohesion as affected by freezing, water content, time and tillage. Soil Sci. Soc. Am. J. 1988, 52, 770–776. [Google Scholar] [CrossRef] [Green Version]
  44. Wang, L.; Shi, Z.H.; Wu, G.L.; Fang, N.F. Freeze/thaw and soil moisture effects on wind erosion. Geomorphology 2014, 207, 141–148. [Google Scholar] [CrossRef]
  45. Středová, H.; Spáčilová, B.; Podhrázská, J.; Chuchma, F. A universal meteorological method to identify potential risk of wind erosion on heavy-textured soils. Morav. Geogr. Rep. 2015, 23, 56–62. [Google Scholar] [CrossRef] [Green Version]
  46. Borrelli, P.; Panagos, P.; Ballabio, C.; Lugato, E.; Weynants, M.; Montanarella, L. Towards a pan-european assessment of land susceptibility to wind erosion. Land Degrad. Dev. 2016, 27, 1093–1105. [Google Scholar] [CrossRef]
  47. Torshizi, M.R.; Miri, A.; Davidson-Arnott, R. Sheltering effect of a multiple-row Tamarix windbreak—A field study in Niatak, Iran. Agric. For. Meteorol. 2020, 287, 107937. [Google Scholar] [CrossRef]
  48. Brandle, J.R.; Hodges, L.; Zhou, X.H. Windbreaks in North American agricultural systems. Agrofor. Syst. 2004, 61, 65–78. [Google Scholar] [CrossRef]
  49. Kouchami-Sardoo, I.; Shirani, H.; Esfandiarpour-Boroujeni, I.; Bashari, H. Application of a Bayesian belief network model for assessing the risk of wind erosion: A test with data from wind tunnel experiments. Aeolian Res. 2019, 41, 100543. [Google Scholar] [CrossRef]
  50. FAO. Report on the Second Meeting of the Working Group on Soil Degradation Assessment Methodology; Food and Agriculture Organization of the United Nations (FAO): Rome, Italy, 1979. [Google Scholar]
  51. Schmugge, T.; Jackson, T.J. Mapping surface soil moisture with microwave radiometers. Meteorol. Atmos. Phys. 1994, 54, 213–223. [Google Scholar] [CrossRef]
  52. Jackson, T.J.; Schmugge, T.J. Passive microwave remote sensing system for soil moisture: Some supporting research. IEEE Trans. Geosci. Remote Sens. 1989, 27, 225–235. [Google Scholar] [CrossRef]
  53. Shao, Y.; Raupach, M.R.; Findlater, P.A. Effect of saltation bombardment on the entrainment of dust by wind. J. Geophys. Res. Atmos. 1993, 98, 12719–12726. [Google Scholar] [CrossRef] [Green Version]
  54. Houser, C.A.; Nickling, W.G. The factors influencing the abrasion efficiency of saltating grains on a clay-crusted playa. Earth Surf. Proc. Land. 2001, 26, 491–505. [Google Scholar] [CrossRef]
  55. Xing, M.; Guo, L. The dust emission law in the wind erosion process on soil surface. Sci. China Ser. G. 2009, 52, 258–269. [Google Scholar] [CrossRef]
  56. Lackóová, L.; Halászová, K.; Kliment, M.; Urban, T. Wind erosion intensity determination using soil particle catcher devices. J. Cent. Eur. Agric. 2013, 14, 1347–1355. [Google Scholar] [CrossRef] [Green Version]
  57. Gillette, D.A.; Fryrear, D.W.; Xiao, J.B.; Stockton, P.; Ono, D.; Helm, P.J.; Gill, T.E.; Ley, T. Large-scale variability of wind erosion mass flux rates at Owens Lake: 1. Vertical profiles of horizontal mass fluxes of wind-eroded particles with diameter greater than 50 μm. J. Geophys. Res. Atmos. 1997, 102, 25977–25987. [Google Scholar] [CrossRef]
  58. Goossens, D.; Offer, Z.; London, G. Wind tunnel and field calibration of five aeolian sand traps. Geomorphology 2000, 35, 233–252. [Google Scholar] [CrossRef]
  59. Mendez, M.J.; Funk, R.; Buschiazzo, D.E. Field wind erosion measurements with Big Spring Number Eight (BSNE) and Modified Wilson and Cook (MWAC) samplers. Geomorphology 2011, 129, 43–48. [Google Scholar] [CrossRef]
  60. Pasák, V. Ochrana Půdy Před Erozí; Státní Zemědělské Nakladatelství (SZN): Praha, Czech Republic, 1984. (In Czech) [Google Scholar]
  61. Chepil, W.S. Soil Conditions that Influence Wind Erosion—Technical Bulletin 1185; United States Department of Agriculture: Washington, DC, USA, 1958.
  62. Négyesi, G.; József, L.; Buró, B.; Szabó, J.; Bakacsi, Z.; Pásztor, L. The potential wind erosion map of an area covered by sandy and loamy soils-based on wind tunnel measurements. Z. Geomorphol. 2015, 58, 59–77. [Google Scholar] [CrossRef] [Green Version]
  63. Chen, Y.C.; Bundy, D.; Hoff, S. Modeling the variation of wind speed with height for agricultural source pollution control. ASHRAE Tran. 1998, 104, 1685–1691. [Google Scholar]
  64. Keesstra, S.; Nunes, J.P.; Saco, P.; Parsons, T.; Poeppl, R.; Masselink, R.; Cerdà, A. The way forward: Can connectivity be useful to design better measuring and modelling schemes for water and sediment dynamics? Sci. Total Environ. 2018, 644, 1557–1572. [Google Scholar] [CrossRef] [PubMed]
  65. Gholami, H.; Mohammadifar, A.; Bui, D.T.; Collins, A.L. Mapping wind erosion hazard with regression-based machine learning algorithms. Sci. Rep. 2020, 10, 20494. [Google Scholar] [CrossRef]
  66. Webb, N.P.; McGowan, H.A.; Phinn, S.R.; McTainsh, G.H. AUSLEM (AUStralian Land Erodibility Model): A tool for identifying wind erosion hazard in Australia. Geomorphology 2006, 78, 179–200. [Google Scholar] [CrossRef]
  67. Leys, J. Wind erosion on agricultural land. In Aeolian Environments, Sediments and Landforms; Goudie, A.S., Livingstone, I., Stokes, S., Eds.; John Wiley & Sons, Ltd.: Chichester, UK, 1999; pp. 143–166. [Google Scholar]
  68. Mirmousavi, S.H. Regional modeling of wind erosion in the North West and South West of Iran. Eurasian Soil Sci. 2016, 49, 942–953. [Google Scholar] [CrossRef]
  69. European Environment Agency. Europe’s Environment: The Second Assessment, 2nd ed.; Elsevier: Aarhus, Denmark, 1998. [Google Scholar]
  70. Funk, R.; Reuter, H.I. Wind erosion. In Soil Erosion in Europe; Boardman, J., Poesen, J., Eds.; John Wiley & Sons, Ltd.: Chichester, UK, 2006; pp. 563–582. [Google Scholar]
  71. Bach, H.; Bakker, M.; Farrington, J.; Drillet, Z.; Duray, B.; Frederiksen, P.; Gyuró, K.E.; Henrichs, T.; Jansson, K.; Jensen, T.S.; et al. Indicators—Methodology and descriptions. In SENSOR Report Series 2008/09; Helming, K., Wiggering, H., Eds.; Leibniz-Zentrum für Agrarlandschaftsforschung (ZALF): Müncheberg, Germany, 2008; pp. 26–27. [Google Scholar]
Figure 1. Area of interest.
Ijgi 10 00269 g001
Figure 2. Map of the SESAND degrees for the area under the case study.
Ijgi 10 00269 g002
Figure 3. Map of SECLAY degrees for the area under the case study.
Ijgi 10 00269 g003
Figure 4. Map of the CESAND degrees for the area under the case study.
Ijgi 10 00269 g004
Figure 5. Map of the CECLAY degrees for the area under the case study.
Ijgi 10 00269 g005
Figure 6. PWE categories for the area under the case study.
Ijgi 10 00269 g006
Figure 7. Methodological road map to identify and classify the risk of wind erosion based on key soil–climatic elements.
Ijgi 10 00269 g007
Figure 8. PWE categories of the case-study area.
Ijgi 10 00269 g008
Table 1. Description of sandy soil potentially vulnerable to wind erosion.
Soil GroupDetail Description
AThe most vulnerable soils, i.e., those whose upper part of the soil profile shows a strongly arenic character. These sandy soils (or partly sandy loam soils) of different genesis are developed on light soil-forming substrates.These are mainly calcareous Aeolic sands, sandy sediments of marine Neogene, terraces or glaciofluvial sands, limnic tertiary sediments, chalk marlstones, greywacke, culm slate, arkose or kaolin sandstones. This group includes arenic subtypes of Chernozems, Albeluvisols, Regosols, Calcic Leptosols and Fluvisols.
BEndangered soils are formed by the sand-loam granularity and can be described as lighter to medium-heavy soils.They are developed on similar parent substrates as the most erosion-endangered soils, and even on the highest levels of the soil profile we can identify finer material, most often of eolic origin (i.e., loess) or solifluction sediments with a high proportion of marl detritus. In addition to the aforementioned soil types, which often acquire modal, stagnic or gleyic subtype, we can also include lighter Haplic Luvisols.
CSoils susceptible to wind erosion represent an aggregate group, which includes a varied mixture of soil types with the variable genesis of formation and soil-forming substrate and is mainly associated with the medium-heavy (loam) grain size of the upper part of the soil profile.They are the most fertile Chernozems and grey Phaeozems of the modal or luvic subtype. Furthermore, quality modal Rendzic Leptosols, Cambisols and lastly modal, gleyic and stagnic Fluvisols.
Table 2. Degrees of SESAND.
Soil Group of Sandy SoilsDegrees of SESAND
A2
B4
C6
Table 3. Description of clay soil potentially vulnerable to wind erosion.
Soil GroupDetail Description
AClay loam to clay Chernozems and Phaeozems, as deep-humid soils with a diagnostic phaeozem horizon, occurring in a relatively humid climate.Both soil types are developed on unconsolidated heavy substrates containing carbonates in the soil profile (in the Czech Republic especially on flysch rocks, limnic Tertiary, tuffs and tuffites or chalk marlstone) and usually without a significant skeleton. Phaeozems are bound to the depressed position of Chernozems, having a pronounced hydric regime, often prone to waterlogging and are characterized by an even higher carbon content than Chernozems. Typical representatives in these groups are Chernozems pelic, Phaeozems pelic, and Phaeozems pelic-gleyic. Vertisols exhibiting similar properties were not considered for their limited area or margin of interest in this study.
BHeavy Fluvisols, i.e., soils of flat areas along watercourses that are geologically built by fluvial or deluviofluvial sediments, respectively.They are mostly skeleton-free, rarely slightly skeleton-like and tend to temporarily get wet. The diagnostic feature is the stratification of the soil profile with an irregular distribution of organic substances. Typical representatives are Fluvisols pelic and Fluvisols pelic-gleyic, which then exhibit marked reductomorphic features less than 60 cm from the soil mineral surface. Heavy colluvisols (not defined in the World Reference Base for Soil Resources) were not considered for their non-significant incidence.
CSoils developed on solifluction deposits and regoliths of diagenetic carbonate-silicate rocks occurring mainly in flysch areas (typically marine lower Cenozoic claystones and marlstones). Less often, they are tied to the greywacke and slate of the culm, basic effusives, chalk marlstones or rocks of the limnic tertiary.They are modal pelozems (not defined in the World Reference Base for Soil Resources, Cambisols modal), Cambisols pelic, Regosols pelic and calcic Leptosols pelic. They are skeletonless to medium skeletal, and often take the form of a slightly stagnic character. If they are heavily stagnic with a tendency to temporarily get wet, then they are marked as stagnic or as Stagnosols pelic.
Table 4. Degrees of the specific winter regime—Matrix 1 adapted from [45].
Degrees Based on the Average Seasonal Number of Freeze-Thaw and Thaw-Freeze Episodes during the Days without Snow Cover
12345
Degrees based on seasonal number of days with wet soil surface, allowing the soil aggregates dispersion111234
212345
323456
434566
545666
Table 5. Degrees of SECLAY.
Risk CategoryDegrees of SECLAY
1–30
41
53
65
Table 6. Degrees of CESAND—Matrix 2.
CESAND-DSL (Spring and Autumn)
12345
Risk of erosive wind occurrence in spring and autumn111234
212345
323456
434566
545666
Table 7. Degrees of CECLAY—Matrix 3.
Drought in the Surface Layer in Spring
12345
Risk of erosive wind occurrence in spring111234
212345
323456
434566
545666
Table 8. PWESAND degrees—Matrix 4.
Degrees of SESAND
246
Degrees of CESAND1246
24812
361218
481624
5102030
6122436
Table 9. PWECLAY degrees—Matrix 5.
Degrees of SECLAY
135
Degrees of CECLAY1135
22610
33915
441220
551525
661830
Table 10. PWE categories.
PWE Category No.PWE Category—NamePWE Degree
0Out of exposure<1
1Subtle exposure(1, 6⟩
2Slight exposure(6, 12⟩
3Moderate exposure(12, 18⟩
4High exposure(18, 24⟩
5Very high exposure(24, 30⟩
6The highest exposure>30
Table 11. Indicators employed in the case study to express key soil–climatic elements.
Soil-Climatic Element Indicator Employed in the Case Study
SESANDSandy soil groups based mainly on texture
SECLAYClay (and loamy) soil groups based on texture, moisture regime a genesis
Number of winter days with a wet soil surface
Number of winter episodes freeze-thaw and thaw-freeze during the days without snow cover
CESANDSpring and autumn erosive wind occurrences
Spring and autumn drought in the surface layer
CECLAYSpring erosive wind occurrence
Spring drought in the surface layer
Publisher’s Note: MDPI stays neutral with regard to jurisdictional claims in published maps and institutional affiliations.

