
Spatial Characteristics of the Tourism Flows in China: A Study Based on the Baidu Index

1
School of Business, Ludong University, Yantai 264025, China
2
Department of Geography & Spatial Information Technology, Ningbo University, Ningbo 315201, China
*
Author to whom correspondence should be addressed.
ISPRS Int. J. Geo-Inf. 2021, 10(6), 378; https://0-doi-org.brum.beds.ac.uk/10.3390/ijgi10060378
Submission received: 20 April 2021
/
Revised: 28 May 2021
/
Accepted: 31 May 2021
/
Published: 3 June 2021
Abstract
:The characteristics of information flow, as represented by the Baidu index, reflect the pattern of tourism flows between different cities. This paper is based on the Baidu index and applies the seasonal concentration index and social network analysis (SNA) methods to study the spatial structure characteristics of tourism flows in China. The results reveal that: (1) both the search volume of the Baidu index in different cities and the online attention to different scenic areas exhibit obvious spatial heterogeneity and seasonal differences; (2) regions with strong tourism flow connections mainly occur in the areas between metropolises or among the inner cities of urban agglomerations, which are largely distributed on the southeast side of the Heihe–Tengchong Line; (3) the development of the whole tourism flow network in China is low, with an unbalanced development between tourism supply and demand, indicating that tourism resources are concentrated in a few cities and that most of the information interaction among cities occurs in core areas, while a weak interaction is observed in peripheral areas; (4) cities like Beijing and Wuhan attain obvious advantages in regard to their tourism resources, whereas other cities, including Beijing, Shanghai, Shenzhen and Guangzhou, exhibit a high demand for tourism. Moreover, tourism information flow networks are concentrated in several cities with an important role in the Chinese urban system, such as Beijing, Wuhan, and Chengdu, because they contain abundant tourism resources, well-developed transportation systems and advanced economic and societal development levels. (5) Cities such as Beijing, Lhasa, Wuhan, and Zhengzhou possess numerous advantages due to structural holes, and they thus occur at an advantageous position in the tourism flow network.
1. Introduction
With the increasing popularity of Internet technology in China, the Internet has become an important tool for people to obtain information and assist their decision-making processes. As of December 2018, the number of Internet users in China was 829 million, and the number of online travel reservations reached 410 million [1]. The Internet has become a popular method to obtain tourism information for an increasing number of people because of its low cost, convenient access and diversified methods to search for information [2]. The development of information technology, especially the Internet, has generated an important type of data acquisition method. Every time an individual interacts with the Internet, be it through a website, search engine, social media platform or mobile phone, interaction trace data are captured, stored, and analysed [3]. Travellers rely on the Internet to search trip information, including dining options, scenic areas, accommodations, and shopping and entertainment services, which provides useful information for research. Social network methods analysis plays important role in tourism research, especially with the continuous improvement of tourism, research using social network methods is gradually increasing [4,5,6,7]. With the development of information and communication technology and advancement of social network platforms and organizational structures, the space of flows has increasingly become a new model to study social space. The concept of the space of flows, proposed by Manuel Castells, represents the material arrangement enabling simultaneous social practices without territorial contiguity [8]. When the concept was first proposed, many scholars performed research from the perspective of the space of flows. Mitchelson (1994) adopted the U.S. Postal Service as an information source to study the functional linkage and hinterland scope of cities [9], and Zhen (2019) conducted research on the urban development model in Hebei Province, China, through economic and information flows [10]. Currently, an increasing number of scholars have carried out research based on the perspective of information [11,12], traffic [13,14] and resident activity flows [15,16]. As tourism plays an increasingly important role in society, research on tourism flows has gradually increased. Geography has as its central concerns a focus on place, space and environment, and has also long contributed to the study of tourism [17]. Hall (2009) reviewed the development of geographical contributions to the study of tourism [18], Geographical perspective and high-resolution data provide a broad space for tourism research. In the last decade, we have witnessed unprecedented advances in the collection and utilization of high-resolution data on tourist mobility [19]. Shoval (2020) examined the ability of incentives to shape the spatio-temporal behaviour of tourists [20]. Shoval (2017) presents novel methods in order to obtain a comprehensive and integrative understanding of tourists’ experience in time and space [21]. The importance of geographical network, combination with tourism flow and geographical, becoming increasingly prominent.
Tourism flows include passenger, information, logistics and technology flows. Related studies on tourism flows have mainly focused on the following aspects. Firstly, tourism flow research initially focused on the determination and prediction of spatiotemporal distribution characteristics. Balaz (1998) analysed the total number of Japanese tourists travelling to Europe and their spatial distribution pattern [22]. Zhu (2018) adopted a Frank copula-based model to examine tourism demand in Singapore from 1995 to 2013 [23]. Gil-Alana (2014) investigated the seasonal characteristics of inbound tourism in Kenya from 1975 Q1 to 2011 Q4 via examination of the degree of persistence of data series [24]. Qin (2019) examined the spatial characteristics of the inbound tourist flows in China from 2011 to 2017 through geotagged photos based on the data mining technique [25]. Second, research focused on the spatial structure and pattern of tourism flows; e.g., Stewart (1996) evaluated the multi-destination trip patterns of tourism flows [26]. Mckercher (2008) analysed the various movements of tourists within an urban destination [27]. Guo (2014) investigated the fluctuation patterns and dynamics of the inbound tourist flows in China via the complex network approach [28]. Third, Uysal (1984) adopted a set of models to identify the most important variable, among several selected, influencing international tourist flows to Turkey [29]. Eryiğit (2010) conducted gravity-based modelling to analyse the factors influencing the number of international tourists visiting Turkey based on the top 11 origin countries from 1995–2005 [30]. Zhang (2015) employed a gravity model to test the impacts of cultural values on international tourism flows [31]. Kim (2016) chose China and Japan as examples and revealed that the bilateral tourism relationship was influenced by a range of factors beyond the usual economic factors of the gross domestic product (GDP) and price and exchange rates [32]. Peng (2016) selected Lugu Lake in China and examined the spatial distribution and impact factors of cross-boundary tourist flows [5]. In addition, Garin-Munoz (2000) measured the impact of economic determinants on the international tourism flows in Spain [33].
Most traditional studies on tourism flows have been conducted based on quantitative data retrieved from statistical offices [28] and questionnaires [5] can be convenient to study the characteristics of tourism, which has become the most important method and data source for tourism research. With the increasing popularity of the Internet and data processing technology, more Internet-based big data sources are increasingly applied in tourism research. For example, Mou (2020) studied the spatial patterns of the tourist flows in Qingdao, China, based on online travel data [6], and Leung (2012) adopted travel note data to study the overseas tourist movement patterns in Beijing during the Olympics [34], while Zhu (2019) proposed a framework to reveal tourist groups and investigated tourist behaviour based on mobile phone call detail records [35]. Moreover, Mou (2020) considered Flickr data to research the inbound tourism flows in Shanghai [7]. The search behaviour of netizens leaves a large number of search traces, which can be quantified with the search index (also referred to as online attention) according to the location and search content. Due to its timeliness and convenience of data acquisition, Internet searching has become increasingly popular. Based on a certain topic, Google Trends and the Baidu index, the most commonly adopted approaches, facilitate continuous monitoring, which has been applied to many aspects, such as hotel room demand [36,37], tourist volume and flow [3,38,39,40], contagious disease outbreaks [41], consumer consumption [42], unemployment rate [43], and land cover change [44]. In 2018, Baidu (www.baidu.com, accessed on 19 April 2021), the largest Chinese search engine, occupied a market share of 70.3% of the search engine market in China. With its very large number of users, the Baidu index has become an important research and analysis tool in the big data era, and it also provides data support for related research in China. More importantly, many existing studies have verified that internal relations exist between the Baidu index and tourism demand [3,39]. Therefore, it is important to conduct research considering the Baidu index.
This paper focused on the spatial structure and pattern of tourism flows according to Stewart (1996) [26], Mckercher (2008) [27], and Guo (2014) [28], a complex network approach able to study well the spatial structure and pattern of tourism flows, thus using the method of social network analysis. This study considering the advantages and disadvantages of traditional data and online big data, adopted the social network analysis (SNA) method and applied search query volume data provided by Baidu to investigate the characteristics of the network spatial structure of the urban tourism information flows in China. The main questions to address were as follows: what are the characteristics of the tourism flow network in China from the perspective of information flow? What is the position of different cities in the network, and which cities occupy an important position in the network?
2. Materials and Methods
2.1. Data Source and Description
Baidu is the largest Chinese search engine, and the Baidu index was introduced in 2006 based on big data. The Baidu index is a free big data analysis service based on Baidu web search and news services, indicating the query volume of users who search given associated keywords within a specific region (with the city as the minimum area). The Baidu index reflects the popularity of a particular query and user interests at a given moment in time [3]. Currently, the Baidu index provides different functions, such as trend research, demand mapping, crowd portraits and information attention, and users may select a specific time or region to query the attention degree of given keywords according to their needs. When searching the Baidu index page, keywords are first entered and the search period, range and region are selected, and a trend line of the entered keywords is then obtained for the corresponding period and region. A trend map also shows the daily search amount of a certain keyword within the region selected with the mouse [39].
Scenic areas in China can be classified into five levels. Among them, the AAAAA scenic area classification indicates the highest level, representing the top-quality tourism resources in China, which has become an important object in tourism research. According to statistics obtained from the Ministry of Culture and Tourism of the People’s Republic of China, there were 259 AAAAA scenic areas at the end of April 2019. In this study, search keywords are entered based on the commonly used names of scenic areas. Since 20 scenic areas, including the Tangwang River in Yichun and Kashgar Old Town, are not included or have been included on a later date in the Baidu index, 239 scenic areas are researched. In this study, the Baidu index from 1 January to 31 December 2018, is analysed by using the Baidu index platform with the area names as search keywords and 365 cities (including county-level cities) as search regions. Basic research data are provided when relevant index data, after processing, are converted into a search volume data set concerning cities in accordance with the cities where scenic areas are located.
2.2. Methods
2.2.1. Annual Seasonal Concentration Index
The annual seasonal concentration index is an important indicator to study the characteristics of the tourism seasonal distribution. It has been mainly considered to carry out quantitative studies on the temporal distribution concentration of tourism flows. Its calculation equation is expressed below:
where R is the annual seasonal concentration index, is the proportion between the tourism flows in each month and those in the whole year and 8.33 is the proportion between the monthly and annual Baidu indices, which are calculated considering the absolute average over a whole year. With increasing value of R, more differences occur between the various seasons, with a certain seasonal distribution more concentrated and the gap between the low and peak season widening. If the value approaches zero, the seasonal distribution is relatively uniform, with few differences among seasons [45].
2.2.2. Social Network Analysis
SNA plays a key role in economics, management, and sociology [46]. A social network is defined as a finite set or sets of actors and any corresponding relation or relations [47]. This method has become a powerful means for the allocation of resources and information among members [48,49]. The network density, centrality, centralization, core–periphery structure model and cohesive subgroups were selected to study the whole network, and the selection centrality and structural holes were determined to examine the node structure. This study uses UCINET 6 software for social network analysis, UCINET 6 for Windows is a software package for the analysis of social network data based on nodes and the ties in the network, in this study, the nodes refers to the city nodes, the ties refers to the tourism information flow represented by the Baidu index. Network density, centrality, centralization, core-periphery structure, cohesive subgroups and structural holes are automatically calculated by UCINET 6.
(1) Network density
The network density reveals the tightness of the network structure, which is calculated as the ratio of the number of connections to the total possible number of connections in the tourism network. A density approaching 1 indicates that there exists strong coordination between groups. In the directed relationship graph, the equation is [46]:
where m denotes the number of arrows in the network, n denotes the number of nodes in the network, and n(n−1) is the theoretical highest connection value.
(2) Centrality
The centrality indicates the position or power of an individual or organization within a social network, and centrality analysis mainly involves the closeness centrality, degree centrality, and betweenness centrality [46].
a. Degree centrality
The degree centrality of a node refers to the number of nodes directly related to this node. The equation is as follows:
where is the degree centrality of i (the tourism node), n is the number of tourism nodes, and denotes the connections between i and j. In a directed network, the out-degree centrality and in-degree centrality apply. A higher in-degree indicates a higher influence (in terms of the choices received), and a higher out-degree is more central (in terms of the choices made).
b. Closeness centrality
The closeness centrality measures the centrality of a node. The closeness centrality is regarded as a measure of the time required for information to spread from node i to all other nodes sequentially, thus reflecting the accessibility of a given node to the other nodes. The closeness centrality of a node can be defined as:
where denotes the closeness centrality of node i, which is the reciprocal of the sum of the shortest distances from node i to all nodes in the network, and is the shortest distance between nodes i and j. The more central a node is, the smaller its total distance to all other nodes.
c. Betweenness centrality
The betweenness centrality is an index measuring the influence of nodes acting as mediators in the entire network. If a node occurs along the shortest path of many other tourism node pairs, this node exhibits a high betweenness centrality and exerts a greater influence than that of the other tourism nodes. The betweenness centrality quantifies the number of times a node acts as a bridge along the shortest path between two other nodes. The betweenness centrality can be expressed as:
where denotes the betweenness centrality of node i, is the total number of shortest paths from nodes s to t, and is the number of paths passing through node i.
(3) Centralization
Freeman’s centralization for a given centrality index is a measure of how central a vertex is regarding how central all the other vertices are with respect to the given index [50,51]. This parameter indicates the degree of centralization of the network, which is determined via quantitative analysis of the group rights, thus reflecting the overall balance and consistency of the network, including the degree centralization, betweenness centralization and closeness centralization.
(4) Core-periphery structure model
In the core-periphery structure model, nodes are divided into core and peripheral areas according to the closeness among nodes in the network, with the nodes in core areas occupying more important positions [52]. Analysis of the core-periphery structure model aims to study which nodes occur at the core and which nodes occur at the periphery. The concepts of the core and peripheral areas are relative since they are determined based on the relative density of the relationship among nodes in the network.
(5) Cohesive subgroups
Cohesive subgroups have always represented an important construct for sociologists who study individuals and organizations [53]. Cohesive subgroups constitute a typical analysis method of social network substructures, and this approach simplifies the complex network structure and enables researchers to identify substructures and their relationships within the network. If certain nodes in the network are close, they are combined into a subgroup, namely, a cohesive subgroup. The nodes within this group exhibit a relatively strong, direct and close relationship.
(6) Structural holes
Broken connections commonly occur between nodes in a network, which are referred to as structural holes [54]. For example, node A is connected to nodes B and C in a tourism network structure, but B is not connected to node C. Thus, there exists a structural hole between nodes B and C, and node A occurs in this structural hole. Generally, indices such as effective size, efficiency and constraint are adopted to measure structural holes.
3. Results and Discussion
3.1. Spatial Distribution Characteristics of the Tourism Flows
Based on the information flow perspective, this study analyses the spatial distribution characteristics of the tourism flows in China from three aspects: first, the spatial distribution of the Baidu index search volume in each city is considered, which reflects the level of the tourism demand in different cities to a certain extent. Second, the Baidu index search volume of each scenic spot is determined, i.e., the spatial distribution of the online attention regarding certain scenic spots, which reasonably reflects the overall tourism supply level. Third, the strength of the tourism flow connection between cities is evaluated. The maps generated in this study are divided into five levels for analysis purposes based on the Jenks method.
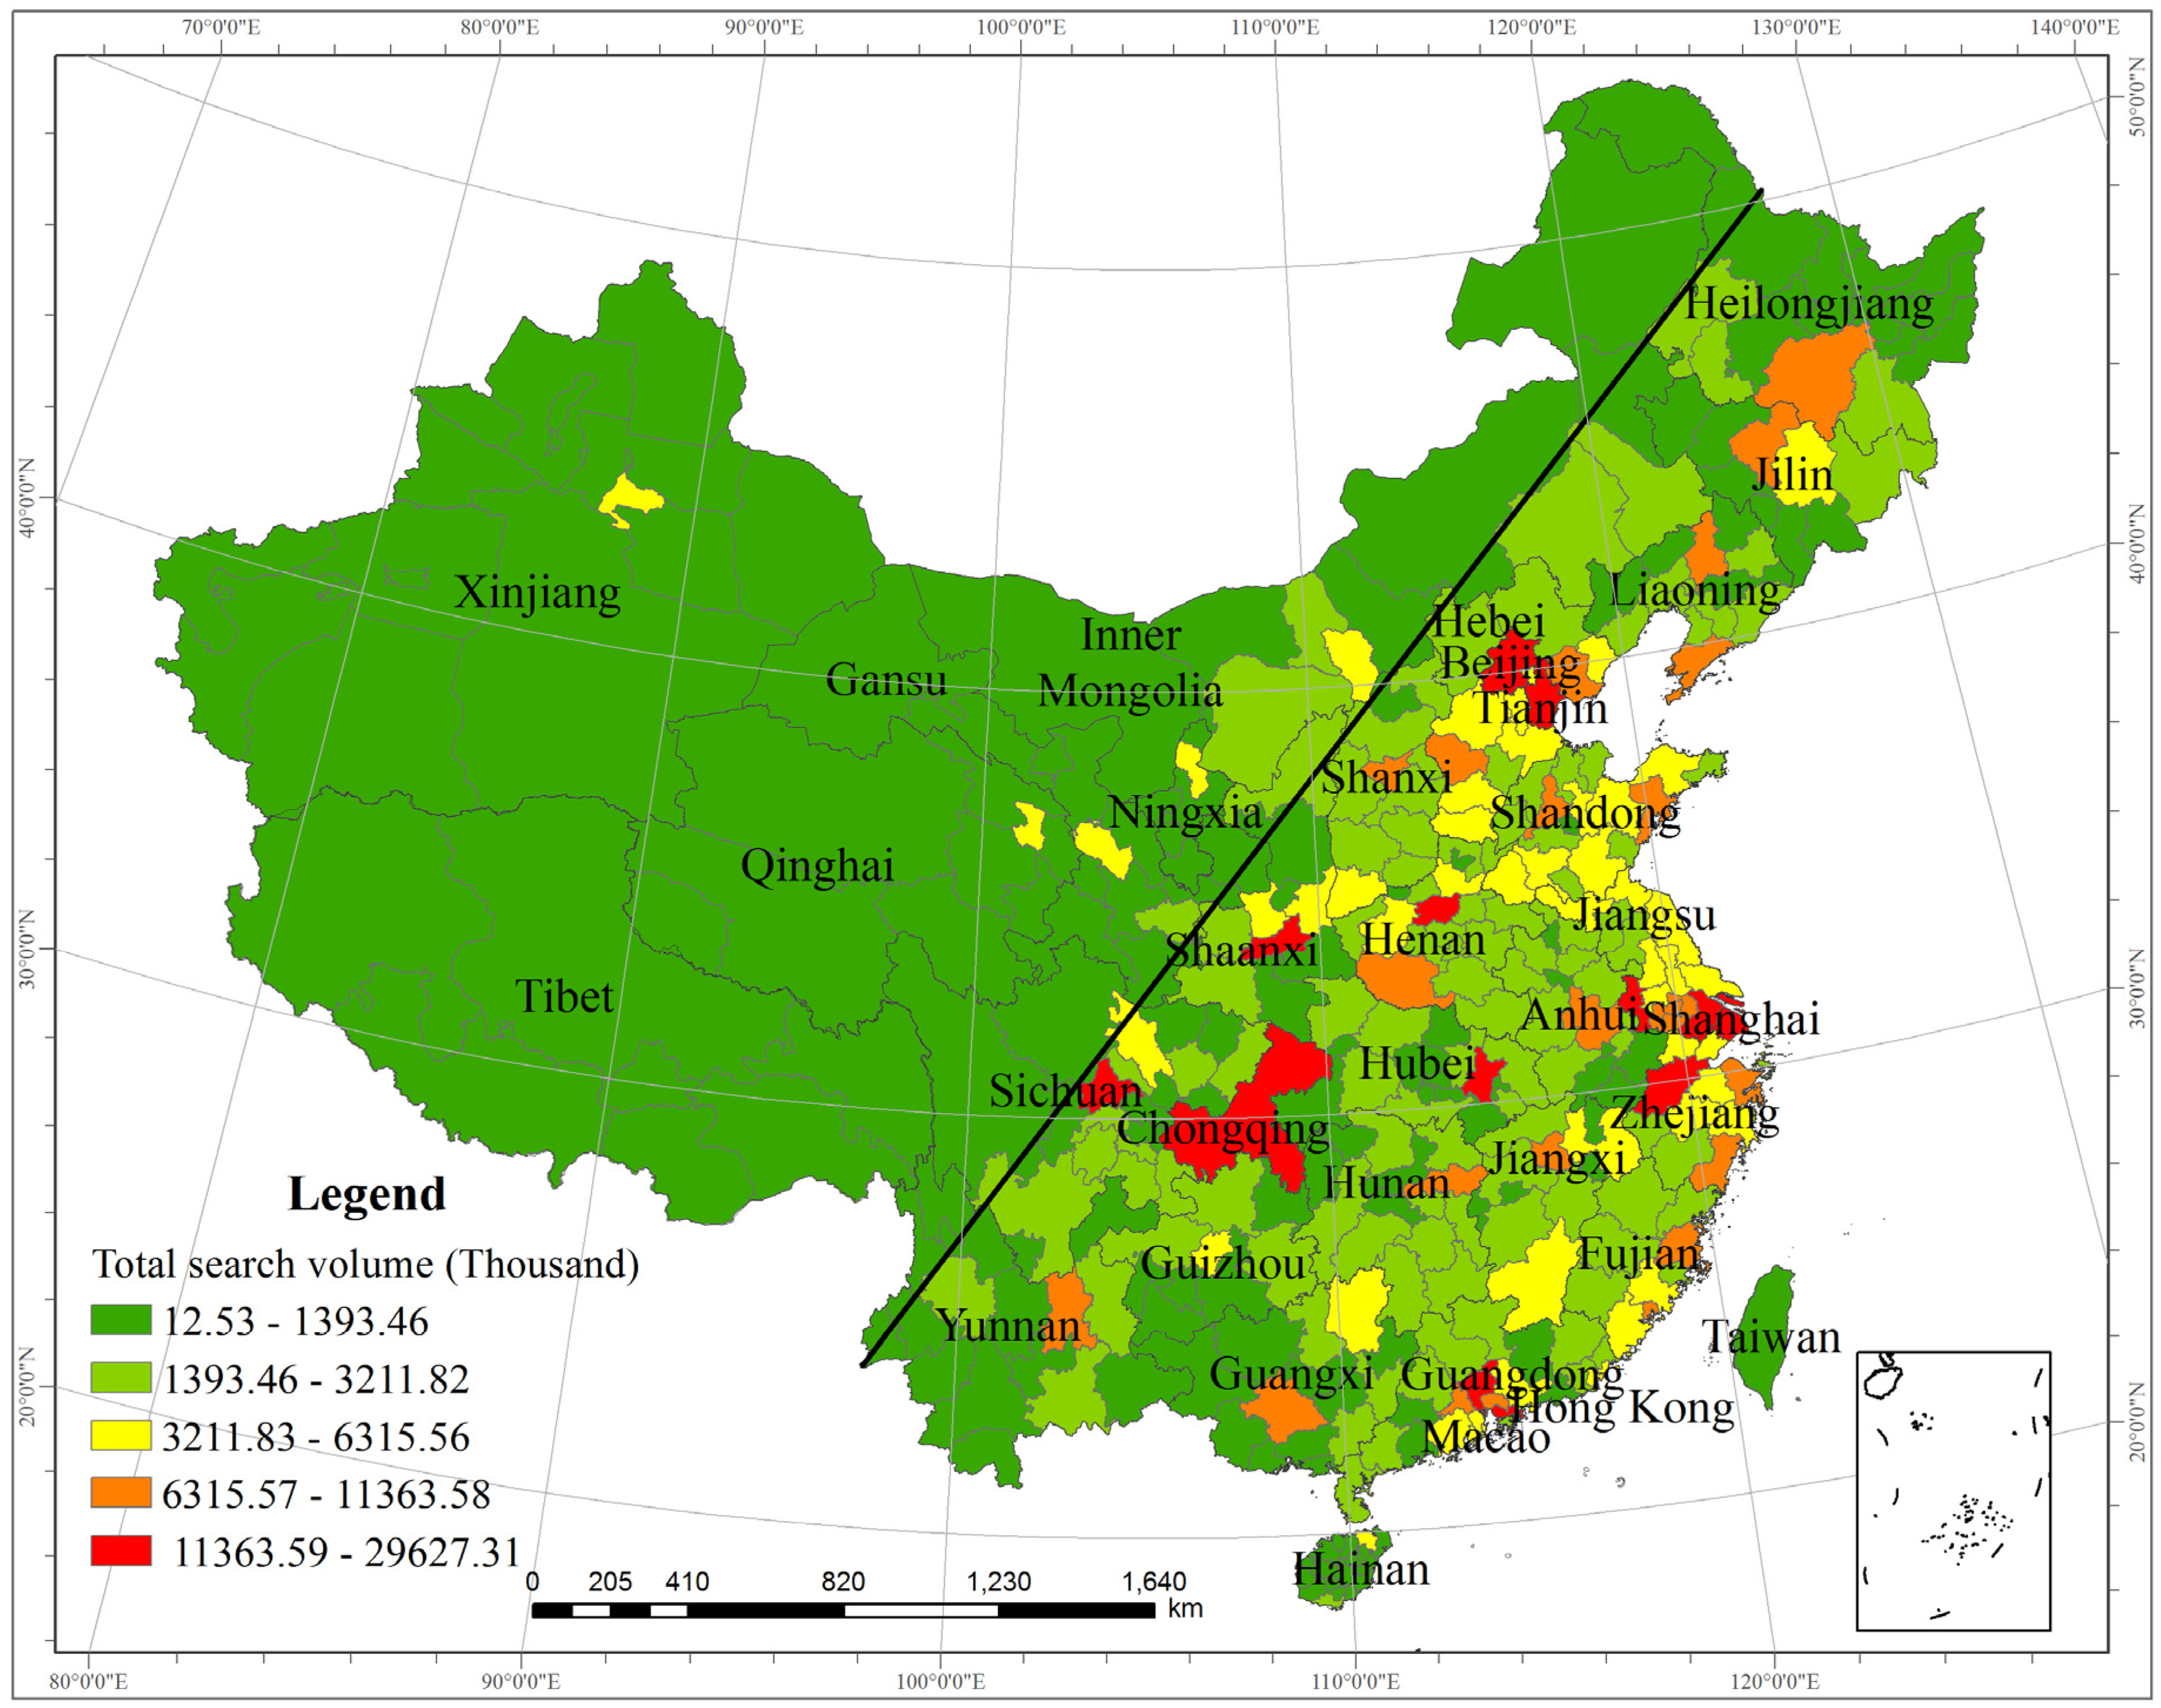
3.1.1. Spatial Distribution of the Baidu Index Search Volume at the City Level
The daily search volume pertaining to 364 cities was summed to obtain the total Baidu index of each city in 2018 (Figure 1). Selecting the Heihe-Tengchong Line as the boundary, a clear distribution trend is observed with a large search volume east of the line and a small search volume west of the line. Within the vast area associated with the line, only certain provincial capitals attain larger search volumes, such as Urumqi, the capital of Xinjiang, Xining, the capital of Qinghai, Lanzhou, the capital of Gansu, Yinchuan, the capital of Ningxia, and Hohhot, the capital of Inner Mongolia. To the east of the line, cities with a high level of economic development exhibit a larger search volume, mainly Beijing, Shanghai, Hangzhou, Chengdu, Shenzhen, Guangzhou, Suzhou, Zhengzhou, Nanjing, Xi’an, Wuhan, Chongqing, Tianjin and Changsha, and certain areas exhibit a larger search volume, such as the Beijing-Tianjin-Hebei, Yangtze River Delta, Pearl River Delta, Chengdu-Chongqing and Shandong Peninsula urban agglomerations. However, since the residents of Taiwan, Hong Kong and Macau do not often use the Baidu search engine, the total search number is relatively small in these areas.
With the use of Equation (1), the annual seasonal concentration index of each city is calculated (Figure 2). There are large differences among the various cities. The lowest index value is 0.51 in Ningbo, and the highest index value is 6.41 in Ledong. The overall value of the seasonal concentration index is relatively high, with the values of 109 cities ranging from 1.64 to 2.10, those of 69 cities ranging from 2.11 to 2.86 and those of 22 cities ranging from 2.87 to 6.41. Notable differences are observed on both sides of the Heihe–Tengchong Line. The value of the seasonal concentration index of most cities in the west is high, and the value in the east varies between 1.23 and 2.86.
3.1.2. Spatial Distribution of the Online Attention to Scenic Areas
The total volume of the online attention to scenic areas in 2018 was calculated (Figure 3). The total volume of the online attention to the Tu Nationality Park in Huzhu Tu Autonomous County, Qinghai, attains a minimum value of 27,020, while the Palace Museum attains a maximum value of 23,681,400. The latter value is 876 times the former value, indicating obvious differences between these scenic areas. Areas with total volumes exceeding 11,889,800 are largely well-known scenic areas, such as the Palace Museum in Beijing, the Huangshan Scenic Area in Huangshan, the Gulangyu Island Scenic Area in Xiamen, the Shaolin Temple in Dengfeng, Mount Tai in Tai’an, and West Lake in Hangzhou. These scenic areas are very popular in China and worldwide. There are only 44 areas with a total volume of online attention larger than 7,499,800, mainly located to the east of the line, while 160 areas exhibit a volume smaller than 4,241,600, indicating that they generally occur at a low level.
Calculating the annual seasonal concentration index of each city with Equation (1) (Figure 4). The minimum value is 0.6 in the Emei Mountain Scenic Area in Leshan, and the maximum value is 6.02 in the Baili Rhododendron Scenic Area in Bijie. Notably, all values of these areas are relatively high, but the total volume of the areas to the north of the Yellow River is larger than that of the areas to the south of the Yangtze River.
3.1.3. Association Strength of the Tourism Information Flows among Cities
The sum of the average daily volume between any two cities is employed to indicate the association strength of the tourism information flows among cities. The level I area (Figure 5a) includes 24 cities (32 city pairs in total), the level II area (Figure 5b) includes 105 cities (241 city pairs in total), the level III area (Figure 5c) includes 238 cities (1418 city pairs in total), the level IV area (Figure 5d) includes 331 cities (6625 city pairs in total) and the level V area (Figure 5e) includes 364 cities (32,541 city pairs in total). There is a very large difference in the association strength of the tourism information flows among cities. The maximum number of searches is 3985.88 in the Beijing–Tianjin city pair, while the minimum search number reaches only 0.16 in Xuancheng–Macau. Areas I, II and III with a higher association strength are basically distributed on the southeast side of the Heihe–Tengchong Line, among which area I largely occurs in major cities of the different city agglomerations, such as the Beijing–Qingdao, Beijing–Guangzhou, Beijing–Shanghai, Beijing–Jinan and Chengdu–Xi’an city pairs, and in inner cities of city agglomerations, such as Shanghai–Hangzhou, Nanjing–Suzhou, Guangzhou–Foshan, Chengdu–Leshan, and Luoyang–Zhengzhou. There exists a high concordance between their features and the overall development and connection in China. Areas with a lower association strength do not exhibit an obvious geographic differentiation and are widely distributed. Among them, there are 331 cities in area IV and 364 cities in area V. On the whole, the spatial association of the tourism information flows among cities is extremely complicated. Hence, further research is required from the perspective of the network structure.
This section research the spatial distribution characteristics and association strength of the tourism information flows, it is the basic analysis of the development of China’s tourism information flow. Especially for the annual seasonal concentration index, policy makers and tourism stakeholders need to formulate policies and measures to promote the development of tourism in the off-season and peak season according to their regional location.
3.2. Research on the Network Spatial Structure of the Tourism Flows
The network spatial structure of the tourism flows in China is analysed by using the SNA method from the information flow perspective. Before index calculation, the data are processed with the binarization method, and all index calculations are then completed in UCINET 6.
3.2.1. Network Density
The largest number of network connections comprising 364 nodes should be 132,132, while the actual number only reaches 21,188, and the network density is 0.160, which is relatively low. This indicates that the overall network development is relatively low and that the tourism information association among cities is not notable. The reason for this result is that there exist large differences in the geographical distribution among the AAAAA scenic areas in China, which is also related to the seasonality of tourism. In addition, the distribution differences of the Baidu index between both sides of the Heihe–Tengchong Line also contribute to a lower network density in China.
3.2.2. Centralization
According to the calculations, the out-degree centralization is 24.528%, and the in-degree centralization is 76.185%. The out-degree centralization is much lower than the in-degree centralization, indicating that the capacity of the different cities to export tourism information to other cities is comparatively balanced. However, a large difference occurs in the capacity to receive information, i.e., tourism destinations are concentrated in a few cities. The tourism flows are unevenly developed in space. Most tourism flows are concentrated in core cities, which is greatly affected by the attractiveness of destinations. The betweenness centralization is just 2.88%, revealing that there exists a large gap in the influence of city nodes, and tourism resources are focused on a few cities.
3.2.3. Core–Periphery Structure Model
The core–periphery structure model is used for analysis purposes, and the final fitness value is calculated at 0.766, demonstrating that the model fitness effect is good. The calculation result (Figure 6) indicates that the network of the tourism information flows in China exhibits a core-periphery structure. There are 103 nodes in core areas with a relationship density of 0.717 and 261 nodes in peripheral areas with a relationship density of only 0.015, which illustrates that tourism information interaction among cities often occurs in core areas and that tourism interaction in peripheral areas is limited. Most of the core areas are located in major urban agglomerations, such as the Beijing–Tianjin–Hebei, Pearl River Delta, Yangtze River Delta, and Shandong Peninsula urban agglomerations. This also verifies that this feature is consistent with economic development and population mobility in China.
3.2.4. Cohesive Subgroups
Cohesive subgroups reveal the tourism information flow association between cities and reflect the relationship between groups and the environment, among groups and among the individual members of groups. With the factions command in UCINET 6, cohesive subgroups are divided. When the number of factions is set to 6, the final proportion correct is 0.7932, yielding a better effect. Therefore, the network is divided into six sections (Figure 7), and the density of the cohesive subgroups is listed in Table 1. The network density of the fifth subgroup is much higher than that of the other subgroups, and interconnections among the subgroups mainly occur between the fifth subgroup and the other subgroups, indicating the important position of the fifth subgroup. The fifth subgroup primarily includes cities and urban agglomerations with a high development and abundant tourism resources, such as most cities in Shandong, Zhejiang, and Hebei provinces and Beijing, Shanghai, Tianjin, Hohhot, Changchun, Chengdu, Yinchuan, Huangshan, Taiyuan, Foshan and Guangzhou. The distribution of the other subgroups exhibits obvious features: the first subgroup mainly includes provinces such as Inner Mongolia, Ningxia, and Gansu, the second subgroup largely includes provinces such as Heilongjiang, Jilin, and Liaoning, the third subgroup mostly includes provinces such as Sichuan, Yunnan, Guizhou, Guangxi and Guangdong, the fourth subgroup primarily includes Qinghai, Xinjiang, Henan and Anhui provinces, and the sixth subgroup mainly includes Xinjiang, Hunan and Jiangxi provinces.
3.2.5. Centrality of the Nodes
In this study, the degree centrality and betweenness centrality are considered to analyse the node structure of the tourism information flows in China in order to evaluate the role of cities within the network.
(1) Degree Centrality
To accurately measure the role of each city in the Chinese tourism information flow network, it is necessary to calculate the in-degree centrality (Figure 8a) and out-degree centrality (Figure 8b) of cities with Baidu. A large difference is observed between the distribution characteristics of the out-degree centrality and in-degree centralities. The out-degree centrality exhibits obvious spatial concentration features, while those of the in-degree centrality are not obvious. Because of the long history, complex topography and unique characteristics of the cultural and natural resources in the different regions, areas with a high in-degree centrality are found in many cities, such as Beijing, Wuhan, Leshan, Aba, Tai’an, Zhengzhou, Jiaxing, Weinan, Hainan Tibetan Autonomous Prefecture, Huangshan, Lijiang, Hangzhou, Jinzhong, Lhasa, Suzhou, Xiamen, Chengdu, Xi’an, Xinzhou, Ji’an, Anshun, Yichang, Yanbian, Shiyan, Jiujiang, Nanping, Tongren, Shennongjia and Luoyang. These cities contain abundant tourism resources and tourist attractions, thus attracting more tourists. Cities with an in-degree centrality of 0 widely occur and are observed in every province, which further indicates that high-quality tourism resources in China are mainly concentrated in a few cities, and most cities in China contain relatively poor tourist attractions. As mentioned before, the out-degree centrality exhibits obvious spatial concentration features, where the out-degree centrality on the east side of the Heihe–Tengchong line is higher than that on the west side. Cities such as Beijing, Shanghai, Shenzhen, Guangzhou, Hangzhou, Suzhou, Chengdu, Nanjing, Wuhan, Xi’an, Changsha, Tianjin, Hefei, Shenyang, Jinan, Chongqing, Zhengzhou, Qingdao, Dongguan, and Nanning attain higher out-degree centrality values, which indicates that these cities comprise the core of the network and impose the greatest regional influence, thus reflecting that there exists a high tourism demand and an advanced development level.
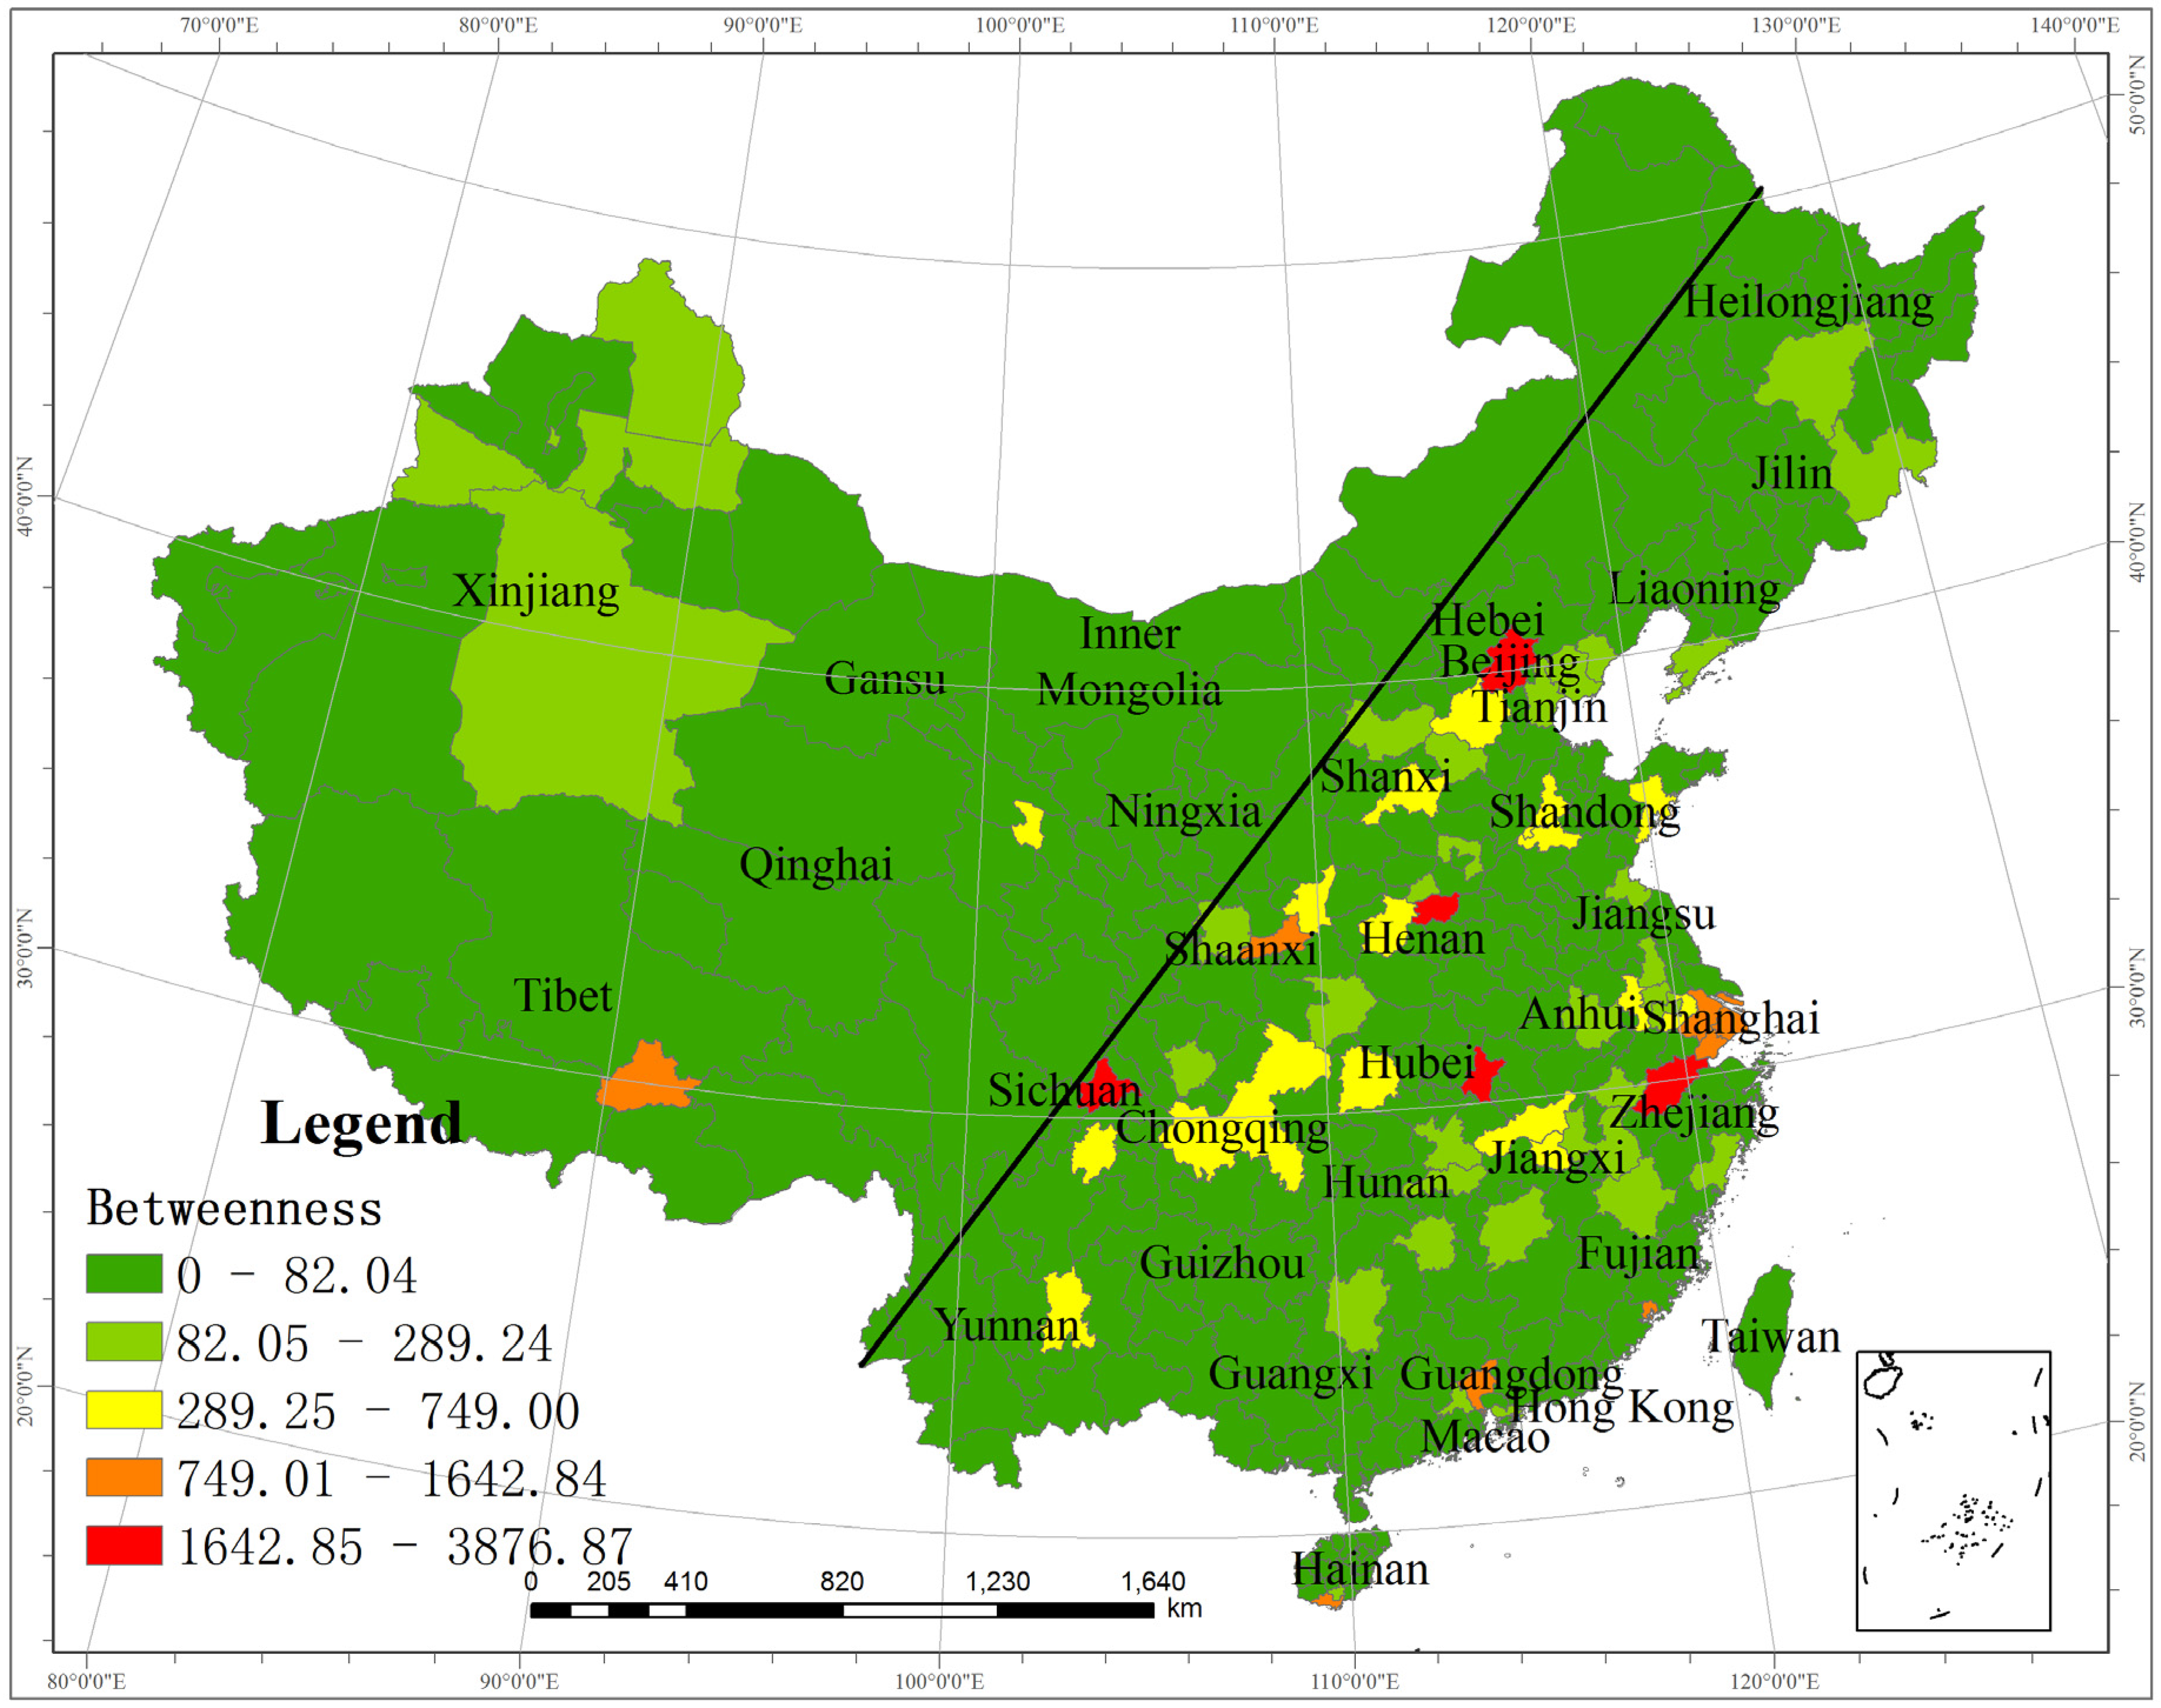
(2) Betweenness Centrality
The calculation result of the betweenness centrality (Figure 9) shows that there are only 13 cities higher than 749, namely, Beijing, Wuhan, Chengdu, Hangzhou, Zhengzhou, Suzhou, Xi’an, Sanya, Guangzhou, Xiamen, Lhasa, Jiaxing and Shanghai, which contain abundant tourism resources and occupy an important position in the urban system of China. Among these cities, Beijing, Shanghai, and Guangzhou are national central cities in China, and Wuhan, Chengdu, Zhengzhou, and Xi’an have become national central cities where the Chinese government clearly supports development, while Hangzhou and Lhasa are provincial capital cities. Moreover, regional development is prioritized in Suzhou, Sanya, Xiamen, and Jiaxing. These cities impose a strong influence on the Chinese tourism information flow network. Betweenness centrality values ranging from 289.25 to 749 are observed in 17 cities, including Weinan, Nanchang, Xining, Tai’an, Luoyang, Jinzhong, Wuxi, Chongqing, Leshan, Kunming, Yichang, Nanjing, Jiujiang, Qingdao, Jinan, Baoding, and Ji’an, which play an important role in regional development of the economy and transportation. The betweenness centrality values of 34 cities vary between 82.05 and 289.24, and the values of the remaining 300 cities are all lower than 82.04. In general, there are only a few cities with high betweenness centrality values due to their rich tourism resources, well-developed transportation system, advanced eco-social development level and important role in the Chinese urban system, thus exerting a superior tourism resource influence.
3.2.6. Structural Holes
This study considers effective size, efficiency and constraint to measure the structural holes of the network (Figure 10). Cities such as Beijing, Lhasa, Wuhan, Zhengzhou, Leshan, Hangzhou, Lijiang, Suzhou, Tai’an, Huangshan, Xiamen, Chengdu, Jinzhong, and Xi’an attain high effective size and efficiency values but low constraint values, which indicates that these cities are less affected by other cities. Hence, these cities occupy a favourable position in the entire network, with advantages in terms of their location and influence. Cities such as Dongfang, Shannan, Chengmai, Changjiang, Hotan, Wenchang, Wanning, Qamdo, Jinchang, Lincang and Gannan exhibit low effective size and efficiency values and high constraint values, demonstrating that these cities are more affected and thus strongly depend on other cities. Therefore, these cities must enhance their connection and cooperation levels with other cities. Cities with numerous structural holes are mainly located at core positions with abundant tourism resources and a notable superiority, whereas cities with a few structural holes largely occur in regions with relatively low economic and transportation development levels, such as Hainan, Tibet, Xinjiang, Gansu and Inner Mongolia.
Social network analysis plays a key role in this research, research can provide some guidance for China’s tourism development. The tourism connection of urban agglomerations is significantly higher than that of other regions. Therefore, when formulating regional development plans and urban agglomeration development plans, policy makers should fully consider the tourism infrastructure construction and driving effect of tourism development on regional development, and consider tourism as an important means to promote the development of urban agglomeration. At the same time, tourism stakeholders should focus on building the tourism image of the core city, and form characteristic tourism resources through infrastructure construction and brand publicity. On this basis, the comprehensive development of regional tourism from point to area can be realized.
4. Conclusions
Based on the relevant theories and methods of traditional research [5,28], this paper makes full use of the advantages of big data in tourism research [6,7,34,35], and studies the information flow network of China’s tourism through the Baidu index. Compared with existing research, this paper provides a perspective for the study of large-scale tourism flows using relatively easy data sources. At the same time, based on the perspective of geography, it can also provide some reference for the research methods of tourism geography research. Via the construction of the tourism information flow network among cities, the spatial structure characteristics of tourism information flows are analysed, and the conclusions are as follows:
- (1)
- There are apparent geographical and seasonal differences in the number of Baidu searches among cities. The number of searches to the east of the Heihe–Tengchong line is much larger than that to the west of the line. In the vast area on the west side of the Heihe–Tengchong line, only some provincial capital cities attain a larger search volume, while on the east side, most cities attain larger search volumes, which indicates a trend of high-value agglomeration. The annual seasonal concentration index of cities is relatively high in general, but notable spatial heterogeneity is observed. On the whole, the cities on the west side of the Heihe–Tengchong line attain a higher index than that of the cities on the east side. This shows that China’s tourism pattern is consistent with the spatial pattern of economic and social development. Policy makers and tourism stakeholders need to formulate policies and measures to promote the development of tourism in the off-season and peak season according to their regional location. The online attention to the various scenic areas greatly differs. Scenic areas with distinctive features and attractive tourism resources, such as the Palace Museum, the Huangshan Scenic Area in Huangshan and the Xiamen Gulangyu Island Area, receive more online attention than do the other scenic areas. In summary, the cities on the east side of the Heihe–Tengchong line attract more online attention. In addition, the seasonal concentration index of cities is relatively high overall, with the index of the scenic areas to the north of the Yellow River higher than that of the scenic areas to the south of the Yangtze River, revealing large differences among the various regions. This shows that scenic spots, especially those located in the north of the Yellow River, should dig deep into the characteristics of the scenic spots, develop tourism products adapted to different seasons, and improve the level of consolidation and development of the scenic spots.
- (2)
- The difference in the association strength of the tourism information flows among cities is very obvious. Areas with a high association strength are mainly distributed in the major cities of urban agglomerations (e.g., Beijing–Qingdao, Beijing–Guangzhou, Beijing–Shanghai and Chengdu–Xi’an) and in the cities occurring within urban agglomerations (e.g., Shanghai–Hangzhou, Nanjing–Suzhou, Guangzhou–Foshan, Chengdu–Leshan and Luoyang–Zhengzhou). Almost all these cities are located on the southeast side of the Tengchong–Heihe line.
- (3)
- Through analysis of the network density, network centrality, cohesive subgroups and core-periphery structure, the whole network structure of the tourism information flows in China is studied in detail. The results demonstrate that the tourism information flow network of China exhibits the following characteristics: network development is relatively low since the network density only reaches 0.16, indicating that the overall connection of the network is poor, which is directly related to the scenic area distribution and the very large difference in economic development between both sides of the Heihe–Tengchong line; there exists an obvious imbalance in the tourism supply and demand, namely, the out-degree centrality is much lower than the in-degree centrality, verifying that the tourism demand is relatively balanced. However, since most tourism destinations are concentrated in a few cities and the betweenness centrality is low, this further demonstrates that most tourism resources are located in a few cities; the network exhibits a distinct core–periphery structure, most of the tourism information flows occur in the core areas, while the flows among the peripheral areas are weak; and the network is divided into six cohesive subgroups with the cohesive subgroup analysis method, of which the sixth subgroup occupies the most important position in the tourism information network, including the major urban agglomerations and central cities in China. Policy makers and tourism stakeholders should fully understand the characteristics of the tourism information flow network, fully consider the regional tourism supply and demand, formulate reasonable development plans, and promote high-level development of regional tourism and economic society.
- (4)
- Further research is conducted considering the centrality and structural holes, and the results indicate that the nodes of cities have the following characteristics: the in-degree centrality does not exhibit obvious characteristics in regard to spatial agglomeration, indicating that the tourism resources in China are scattered, but cities such as Beijing, Wuhan, Leshan, Aba, Tai’an and Zhengzhou attain obvious advantages in regard to their tourism resources; the out-degree centrality exhibits obvious spatial agglomeration characteristics, demonstrating that the tourism demand in China is unbalanced, for example, cities such as Beijing, Shanghai, Shenzhen, Guangzhou, Hangzhou, Suzhou and Chengdu occur at the core of the network with a highly notable influence, and they exhibit a high tourism demand because of their economic advantages; tourism information flow network resources are mainly located in a few cities, including Beijing, Wuhan, Chengdu, Hangzhou, Zhengzhou, Suzhou, Xi’an, Sanya, Guangzhou, Xiamen, Lhasa, Jiaxing, Shanghai, Weinan, Nanchang, Xining, Tai’an, Luoyang, Jinzhong, Wuxi, Chongqing, Leshan, Kunming, Yichang, Nanjing, Jiujiang, Qingdao, Jinan, Baoding and Ji’an, because these cities contain abundant tourism resources, an advanced transportation system, a high development level and an important role in the Chinese urban system; cities such as Beijing, Lhasa, Wuhan, Zhengzhou, Leshan, Hangzhou, Lijiang, Suzhou, Tai’an, Huangshan, Xiamen, Chengdu, Jinzhong and Xi’an occupy a beneficial position in the tourism network, and they exert more influence. However, cities such as Dongfang, Shannan, Chengmai, Changjiang, Hotan, Wenchang, Wanning, Qamdo, Jinchang, Lincang and Gannan are restricted by other cities because they are dependent on these cities. Therefore, it is necessary to strengthen their connection and cooperation levels with other cities.
There are a number of limitations to our study. First, since scenic areas with few tourist attractions are included in the Baidu index to a lesser extent, the study constructs the urban tourism information flow network mostly based on AAAAA areas. Actually, with increasing information incorporated into the Baidu index, it is necessary to comprehensively investigate more types of scenic area in future research. Second, the spatial pattern of the tourism information flow network is examined based on 2018 data. Hence, certain deficiencies probably occur. In the future, in-depth research should be performed on spatiotemporal development and its development mechanism.
Author Contributions
Conceptualization, methodology, software, formal analysis, investigation, resources, data curation, writing—original draft, visualization, Yongwei Liu; writing—review and editing, validation, Wang Liao. All authors have read and agreed to the published version of the manuscript.
Funding
This research was funded by the Humanity and Social Science Foundation of Ministry of Education of China, No. 20YJCZH104.
Data Availability Statement
The data that support the findings of this study are available on reasonable request from the corresponding author.
Conflicts of Interest
The authors declare no conflict of interest.
References
- Center, C.I.N.I. China Internet Development Statistics Report; Internet Network Information Center: Beijing, China, 2019. [Google Scholar]
- Pan, B.; Fesenmaier, D.R. Online information search: Vacation planning process. Ann. Tour. Res. 2006, 33, 809–832. [Google Scholar] [CrossRef]
- Yang, X.; Pan, B.; Evans, J.A.; Lv, B. Forecasting Chinese tourist volume with search engine data. Tour. Manage. 2015, 46, 386–397. [Google Scholar] [CrossRef]
- Zeng, B.D. Pattern of Chinese tourist flows in Japan: A Social Network Analysis perspective. Tour. Geogr. 2018, 20, 810–832. [Google Scholar] [CrossRef]
- Peng, H.S.; Zhang, J.H.; Liu, Z.H.; Lu, L.; Yang, L. Network analysis of tourist flows: A cross-provincial boundary perspective. Tour. Geogr. 2016, 18, 561–586. [Google Scholar] [CrossRef]
- Mou, N.; Zheng, Y.; Makkonen, T.; Yang, T.; Tang, J.; Song, Y. Tourists’ digital footprint: The spatial patterns of tourist flows in Qingdao, China. Tour. Manage. 2020, 81, 104151. [Google Scholar] [CrossRef]
- Mou, N.; Yuan, R.; Yang, T.; Zhang, H.; Tang, J.; Makkonen, T. Exploring spatio-temporal changes of city inbound tourism flow: The case of Shanghai, China. Tour. Manage. 2020, 76, 103955. [Google Scholar] [CrossRef]
- Castells, M. The Informational City: Information Technology, Economic Restructuring, and the Urban-Regional Process; Oxford: Blackwell, UK, 1989. [Google Scholar]
- Mitchelson, R.L.; Wheeler, J.O. The Flow of Information in a Global Economy: The Role of the American Urban System in 1990. Ann. Assoc. Am. Geogr. 1994, 84, 87–107. [Google Scholar] [CrossRef]
- Zhen, F.; Qin, X.; Ye, X.; Sun, H.; Luosang, Z. Analyzing urban development patterns based on the flow analysis method. Cities 2019, 86, 178–197. [Google Scholar] [CrossRef]
- Li, H.; Liu, Y.; He, Q.; Peng, X.; Yin, C. Simulating Urban Cooperative Expansion in a Single-Core Metropolitan Region Based on Improved CA Model Integrated Information Flow: Case Study of Wuhan Urban Agglomeration in China. J. Urban Plan. Dev. 2018, 144, 05018002. [Google Scholar] [CrossRef]
- Yong, W.; Lai, P.; Sui, D. Mapping the Internet using GIS: The death of distance hypothesis revisited. J. Geogr. Syst. 2003, 5, 381–405. [Google Scholar]
- Goetz, A.R. Air Passenger Transportation and Growth in the U.S. Urban System, 1950–1987. Growth Chang. 2006, 23, 217–238. [Google Scholar] [CrossRef]
- Matsumoto, H. International urban systems and air passenger and cargo flows: Some calculations. J. Air Transp. Manag. 2004, 10, 239–247. [Google Scholar] [CrossRef] [Green Version]
- Lynch, C. Big data: How do your data grow? Nature 2008, 455, 28–29. [Google Scholar] [CrossRef]
- Zhen, F.; Cao, Y.; Qin, X.; Wang, B. Delineation of an urban agglomeration boundary based on Sina Weibo microblog ‘check-in’ data: A case study of the Yangtze River Delta. Cities 2017, 60, 180–191. [Google Scholar] [CrossRef]
- Hall, C.M.; Page, S.J. The Geography of Tourism and Recreation: Environment, Place and Space; Routledge: London, UK, 2014. [Google Scholar]
- Hall, C.M.; Page, S.J. Progress in Tourism Management: From the geography of tourism to geographies of tourism—A review. Tour. Manage. 2009, 30, 3–16. [Google Scholar] [CrossRef] [Green Version]
- Shoval, N. Sensing tourists: Geoinformatics and the future of tourism geography research. Tour. Geogr. 2018, 20, 910–912. [Google Scholar] [CrossRef]
- Shoval, N.; Kahani, A.; De Cantis, S.; Ferrante, M. Impact of incentives on tourist activity in space-time. Ann. Touris. Res. 2020, 80, 102846. [Google Scholar] [CrossRef]
- Shoval, N.; Schvimer, Y.; Tamir, M. Real-Time Measurement of Tourists’ Objective and Subjective Emotions in Time and Space. J. Travel Res. 2017, 57, 3–16. [Google Scholar] [CrossRef]
- Balaz, V.; Mitsutake, M. Japanese tourists in transition countries of Central Europe: Present behaviour and future trends. Tourism Manage. 1998, 19, 433–443. [Google Scholar] [CrossRef]
- Zhu, L.; Lim, C.; Xie, W.J.; Wu, Y. Modelling tourist flow association for tourism demand forecasting. Curr. Issues Tour. 2018, 21, 902–916. [Google Scholar] [CrossRef]
- Gil-Alana, L.A.; Mudida, R.; de Gracia, F.P. Persistence, long memory and seasonality in Kenyan tourism series. Ann. Touris. Res. 2014, 46, 89–101. [Google Scholar] [CrossRef] [Green Version]
- Qin, J.; Song, C.; Tang, M.D.; Zhang, Y.Y.; Wang, J.W. Exploring the Spatial Characteristics of Inbound Tourist Flows in China Using Geotagged Photos. Sustainability 2019, 11, 5822. [Google Scholar] [CrossRef] [Green Version]
- Stewart, S.I.; Vogt, C.A. Multi-destination trip patterns. Ann. Touris. Res. 1996, 37, 458–461. [Google Scholar] [CrossRef]
- McKercher, B.; Lau, G. Movement Patterns of Tourists within a Destination. Tour. Geogr. 2008, 10, 355–374. [Google Scholar] [CrossRef]
- Guo, Y.R.; Zhang, J.; Yang, Y.; Zhang, H.L. Modeling the Fluctuation Patterns of Monthly Inbound Tourist Flows to China: A Complex Network Approach. Asia Pac. J. Tour. Res. 2015, 20, 942–953. [Google Scholar] [CrossRef]
- Uysal, M.; Crompton, J.L. Determinants of demand for international tourist flows to Turkey. Tour. Manage. 1984, 5, 288–297. [Google Scholar] [CrossRef]
- Eryiğit, M.; Kotil, E.; Eryiğit, R. Factors affecting international tourism flows to Turkey: A gravity model approach. Tour. Econ. 2010, 16, 585–595. [Google Scholar] [CrossRef]
- Zhang, Y.; Wu, T.; Li, X. The Impacts of Cultural Values on Bilateral International Tourism Flows. Teach. Educ. Forum 2015, 59, 159–161. [Google Scholar]
- Kim, S.; Prideaux, B.; Timothy, D. Factors affecting bilateral Chinese and Japanese travel. Ann. Touris. Res. 2016, 61, 80–95. [Google Scholar]
- Garin-Munoz, T.; Amaral, T.P. An econometric model for international tourism flows to Spain. Appl. Econ. Lett. 2000, 7, 525–529. [Google Scholar] [CrossRef]
- Leung, X.Y.; Wang, F.; Wu, B.; Bai, B.; Stahura, K.A.; Xie, Z. A social network analysis of overseas tourist movement patterns in Beijing: The impact of the Olympic Games. Int. J. Tour. Res. 2012, 14, 469–484. [Google Scholar] [CrossRef]
- Zhu, X.; Sun, T.; Yuan, H.; Hu, Z.; Miao, J. Exploring Group Movement Pattern through Cellular Data: A Case Study of Tourists in Hainan. ISPRS Int. Geo Inf. 2019, 8, 74. [Google Scholar] [CrossRef] [Green Version]
- Rivera, R. A dynamic linear model to forecast hotel registrations in Puerto Rico using Google Trends data. Tour. Manage. 2016, 57, 12–20. [Google Scholar] [CrossRef] [Green Version]
- Yang, Y.; Pan, B.; Song, H. Predicting Hotel Demand Using Destination Marketing Organization’s Web Traffic Data. J. Travel Res. 2013, 53, 433–447. [Google Scholar] [CrossRef] [Green Version]
- Sun, S.; Wei, Y.; Tsui, K.-L.; Wang, S. Forecasting tourist arrivals with machine learning and internet search index. Tour. Manage. 2019, 70, 1–10. [Google Scholar] [CrossRef]
- Huang, X.; Zhang, L.; Ding, Y. The Baidu Index: Uses in predicting tourism flows –A case study of the Forbidden City. Tour. Manage. 2017, 58, 301–306. [Google Scholar] [CrossRef]
- Park, S.; Lee, J.; Song, W. Short-term forecasting of Japanese tourist inflow to South Korea using Google trends data. J. Travel Tour. Mark. 2016, 34, 357–368. [Google Scholar] [CrossRef]
- Carneiro, H.A.; Mylonakis, E. Google trends: A web-based tool for real-time surveillance of disease outbreaks. Clin. Infect. Dis. 2009, 49, 1557–1564. [Google Scholar] [CrossRef]
- Vosen, S.; Schmidt, T. Forecasting private consumption: Survey-based indicators vs. Google trends. J. Forecast. 2011, 30, 565–578. [Google Scholar] [CrossRef] [Green Version]
- Mihaela, S. Improving unemployment rate forecasts at regional level in Romania using Google Trends. Technol. Forecast. Soc. Chang. 2020, 155, 120026. [Google Scholar] [CrossRef]
- Zhao, Y.; Li, R.; Wu, M. Correlation Studies between Land Cover Change and Baidu Index: A Case Study of Hubei Province. ISPRS Int. Geo Inf. 2020, 9, 232. [Google Scholar] [CrossRef] [Green Version]
- Wang, H.; Liu, X.; Wang, Z. In The Online Attention of Class 5A Scenic Spots in Jiangsu Province, China: A Big Data Analysis of Based on Baidu Index. In Proceedings of the 2020 5th IEEE International Conference on Big Data Analytics (ICBDA), Xiamen, China, 8–11 May 2020; pp. 18–21. [Google Scholar]
- Huang, M.; Wang, Z.; Chen, T. Analysis on the theory and practice of industrial symbiosis based on bibliometrics and social network analysis. J. Clean Prod. 2019, 213, 956–967. [Google Scholar] [CrossRef]
- Wasserman, S.; Faust, K. Social Network Analysis: Methods and Applications; Cambridge University Press: Cambridge, UK, 1994; Volume 8. [Google Scholar]
- Lea, B.R.; Yu, W.B.; Maguluru, N.; Nichols, M. Enhancing business networks using social network based virtual communities. Ind. Manag. Data Syst. 2006, 106, 121–138. [Google Scholar] [CrossRef]
- Kurt, Y.; Kurt, M. Social network analysis in international business research: An assessment of the current state of play and future research directions. Int. Bus. Rev. 2020, 29, 101633. [Google Scholar] [CrossRef]
- Krnc, M.; Škrekovski, R. Centralization of transmission in networks. Discret. Math. 2015, 338, 2412–2420. [Google Scholar] [CrossRef]
- Freeman, L.C. Centrality in social networks conceptual clarification. Soc. Netw. 1978, 1, 215–239. [Google Scholar] [CrossRef] [Green Version]
- Borgatti, S.P.; Everett, M.G. Models of core/periphery structures. Soc. Netw. 2000, 21, 375–395. [Google Scholar] [CrossRef]
- Frank, K.A. Identifying cohesive subgroups. Soc. Netw. 1995, 17, 27–56. [Google Scholar] [CrossRef]
- Burt, R.S. Structural Holes; Harvard University Press: Cambridge, MA, USA, 1992. [Google Scholar]
Figure 1.
Spatial distribution of the total Baidu search volume.

Figure 2.
Spatial distribution of the seasonal concentration index.

Figure 3.
Spatial distribution of online attention in scenic areas.

Figure 4.
Spatial distribution of the seasonal concentration index in scenic areas.

Figure 5.
Association strength of the tourism information flows among cities. ((a) represents the baidu index from 2019.44 to 3985.88, (b) represents from 809.26 to 2019.43, (c) represents from 307.61 to 809.25, (d )represents from 84.55 to 307.60, (e) represents from 0.15 to 84.54).
Figure 5.
Association strength of the tourism information flows among cities. ((a) represents the baidu index from 2019.44 to 3985.88, (b) represents from 809.26 to 2019.43, (c) represents from 307.61 to 809.25, (d )represents from 84.55 to 307.60, (e) represents from 0.15 to 84.54).

Figure 6.
Core–periphery areas of the tourism information flows in China.

Figure 7.
Cohesive subgroups of the tourism information flows in China.

Figure 8.
Degree centrality of the tourism information flow network in China.

Figure 9.
Betweenness centrality of the tourism information flow network in China.

Figure 10.
Distribution structural holes index of the tourism information flows in China.


Table 1.
Distribution of the cohesive subgroup density.
| Subgroups | 1 | 2 | 3 | 4 | 5 | 6 |
|---|---|---|---|---|---|---|
| 1 | 0.04 | 0 | 0.01 | 0 | 0.23 | 0.01 |
| 2 | 0 | 0.04 | 0.01 | 0 | 0.29 | 0 |
| 3 | 0.01 | 0 | 0.05 | 0 | 0.37 | 0.01 |
| 4 | 0 | 0 | 0.01 | 0.01 | 0.24 | 0 |
| 5 | 0.06 | 0.05 | 0.06 | 0.01 | 0.61 | 0.04 |
| 6 | 0 | 0 | 0.02 | 0 | 0.35 | 0.03 |
Annotation: The diagonal value indicates the density within a given group, and the remaining values indicate the density among groups.
Publisher’s Note: MDPI stays neutral with regard to jurisdictional claims in published maps and institutional affiliations. |
© 2021 by the authors. Licensee MDPI, Basel, Switzerland. This article is an open access article distributed under the terms and conditions of the Creative Commons Attribution (CC BY) license (https://creativecommons.org/licenses/by/4.0/).
Share and Cite
MDPI and ACS Style
Liu, Y.; Liao, W. Spatial Characteristics of the Tourism Flows in China: A Study Based on the Baidu Index. ISPRS Int. J. Geo-Inf. 2021, 10, 378. https://0-doi-org.brum.beds.ac.uk/10.3390/ijgi10060378
AMA Style
Liu Y, Liao W. Spatial Characteristics of the Tourism Flows in China: A Study Based on the Baidu Index. ISPRS International Journal of Geo-Information. 2021; 10(6):378. https://0-doi-org.brum.beds.ac.uk/10.3390/ijgi10060378
Chicago/Turabian StyleLiu, Yongwei, and Wang Liao. 2021. "Spatial Characteristics of the Tourism Flows in China: A Study Based on the Baidu Index" ISPRS International Journal of Geo-Information 10, no. 6: 378. https://0-doi-org.brum.beds.ac.uk/10.3390/ijgi10060378
Note that from the first issue of 2016, this journal uses article numbers instead of page numbers. See further details here.