
A Cost Function for the Uncertainty of Matching Point Distribution on Image Registration

 , ,
, ,
Abstract
:1. Introduction
2. Methods
2.1. Derivation of HDOP
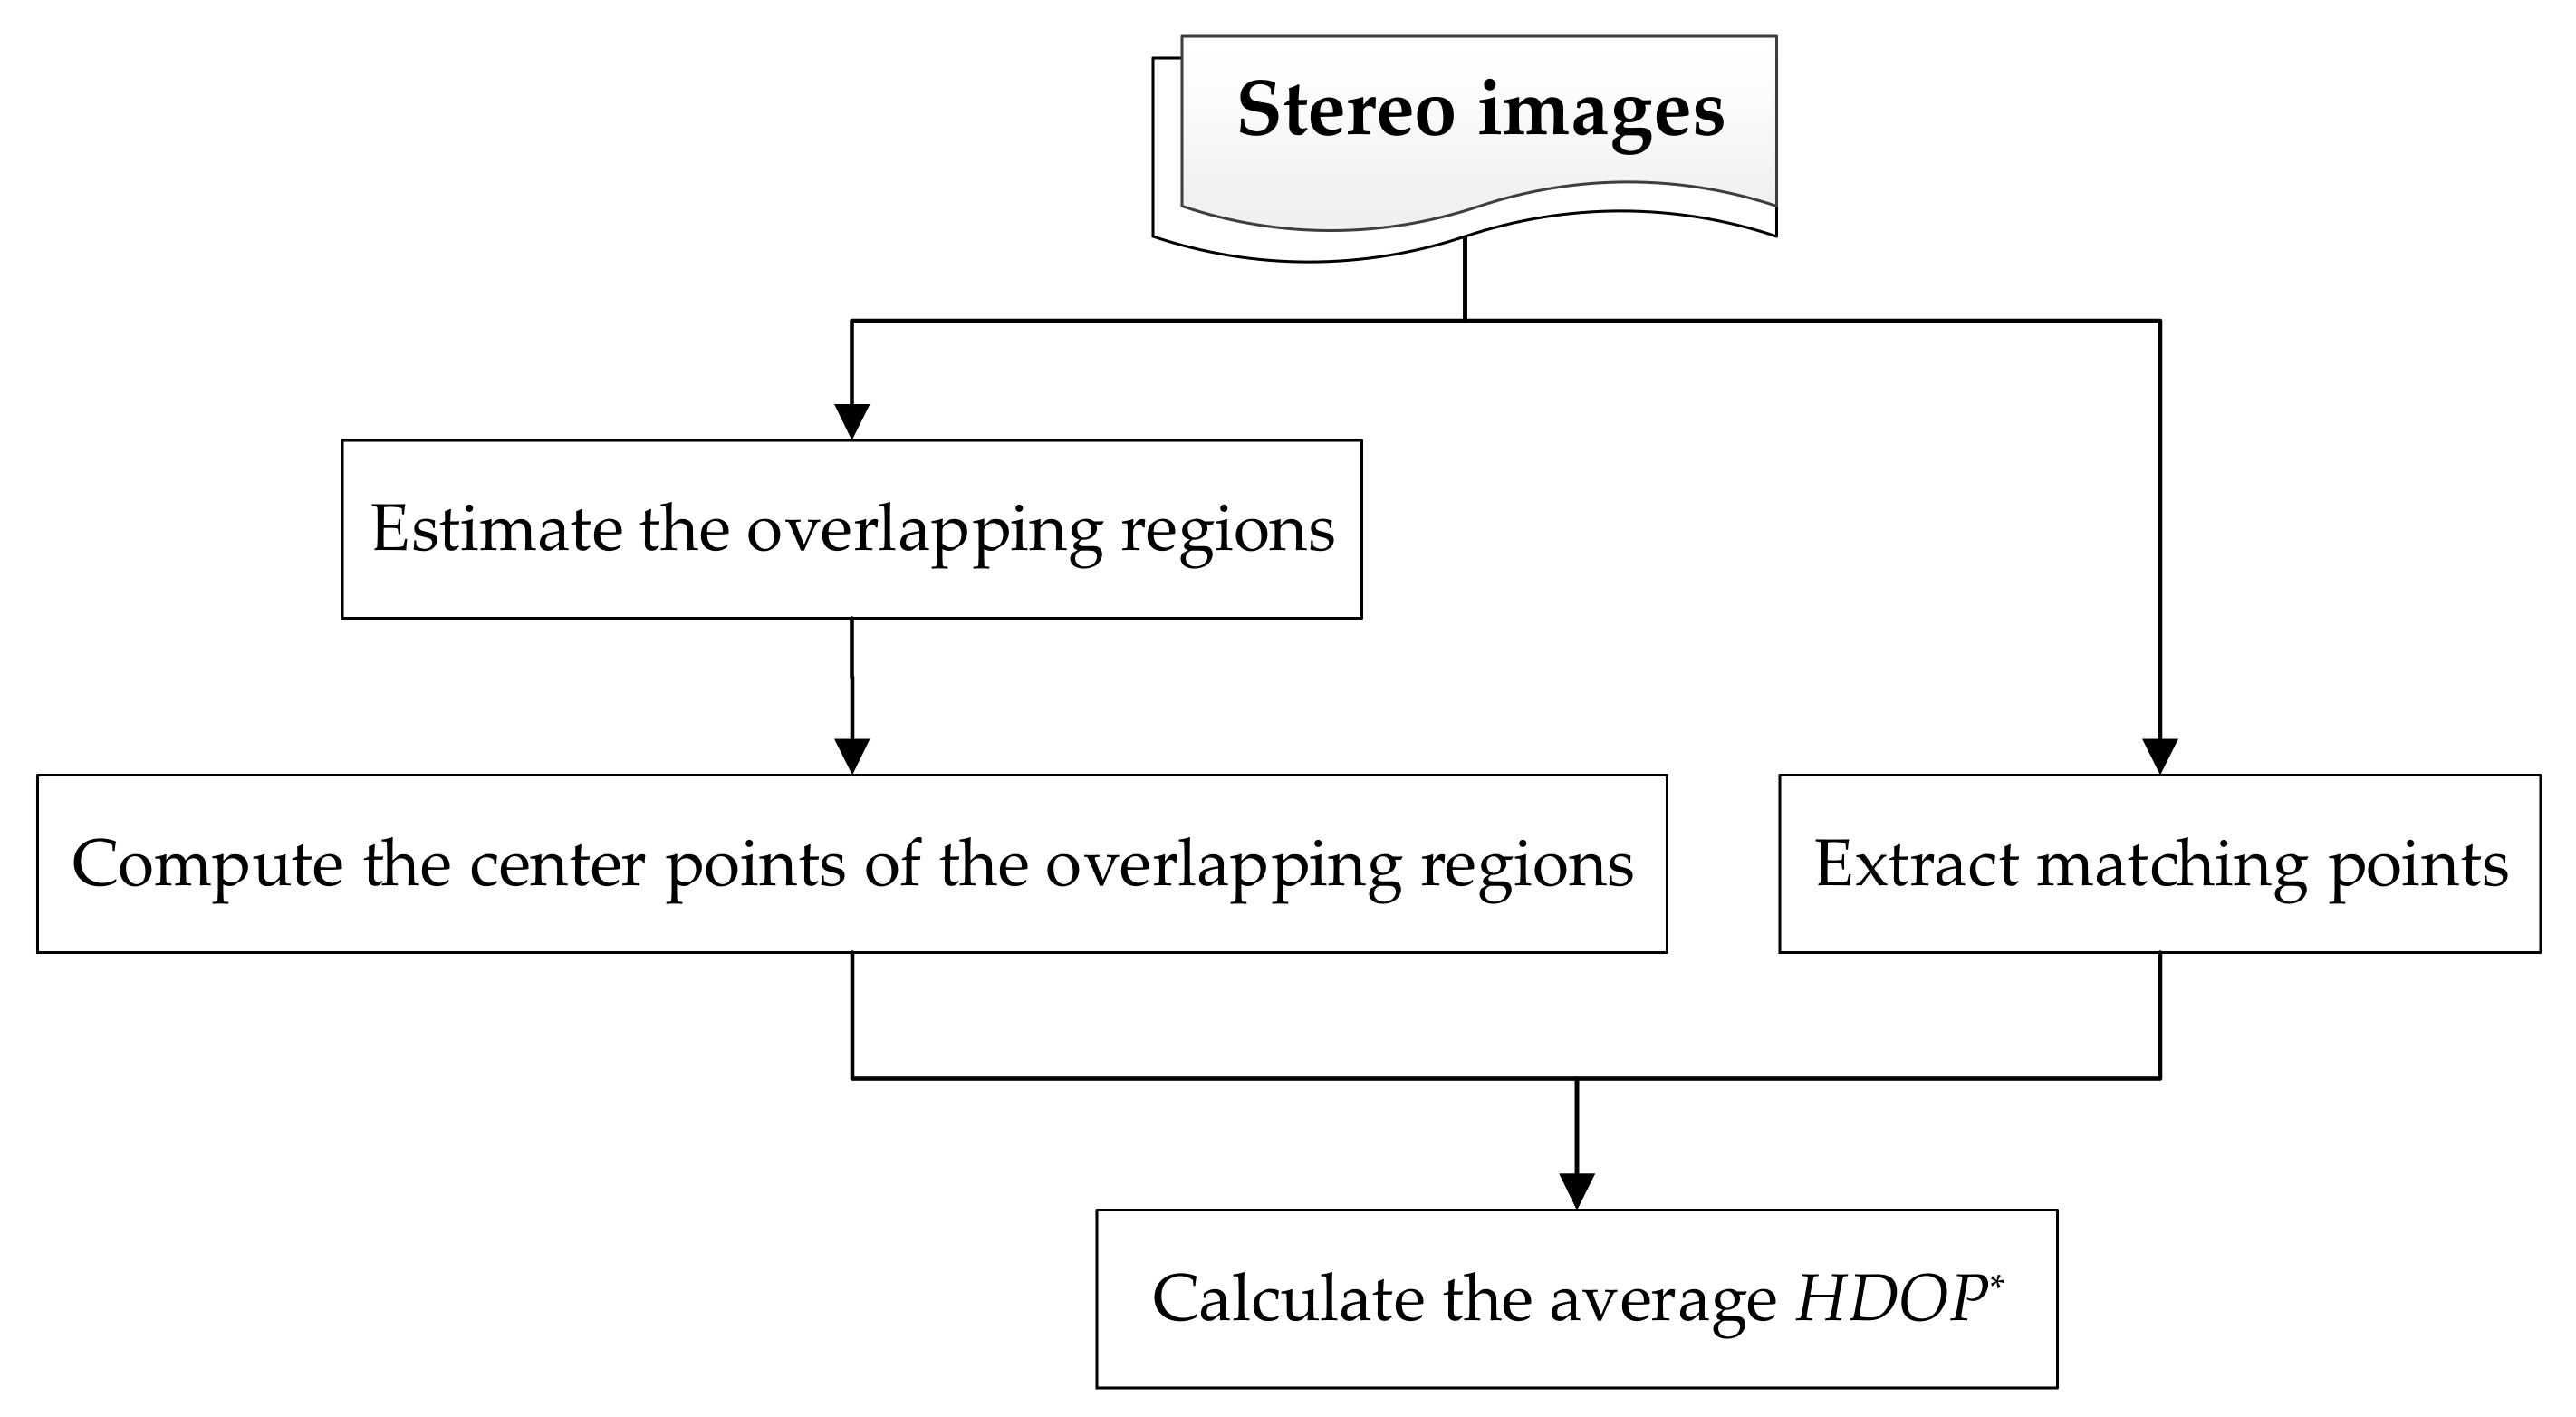
2.2. Design Process
3. Experiment
3.1. Simulation Scene
3.1.1. Data Source
3.1.2. Result Evaluation
- (1)
- Correctness of the proposed method
- (2)
- Rationality of the proposed method
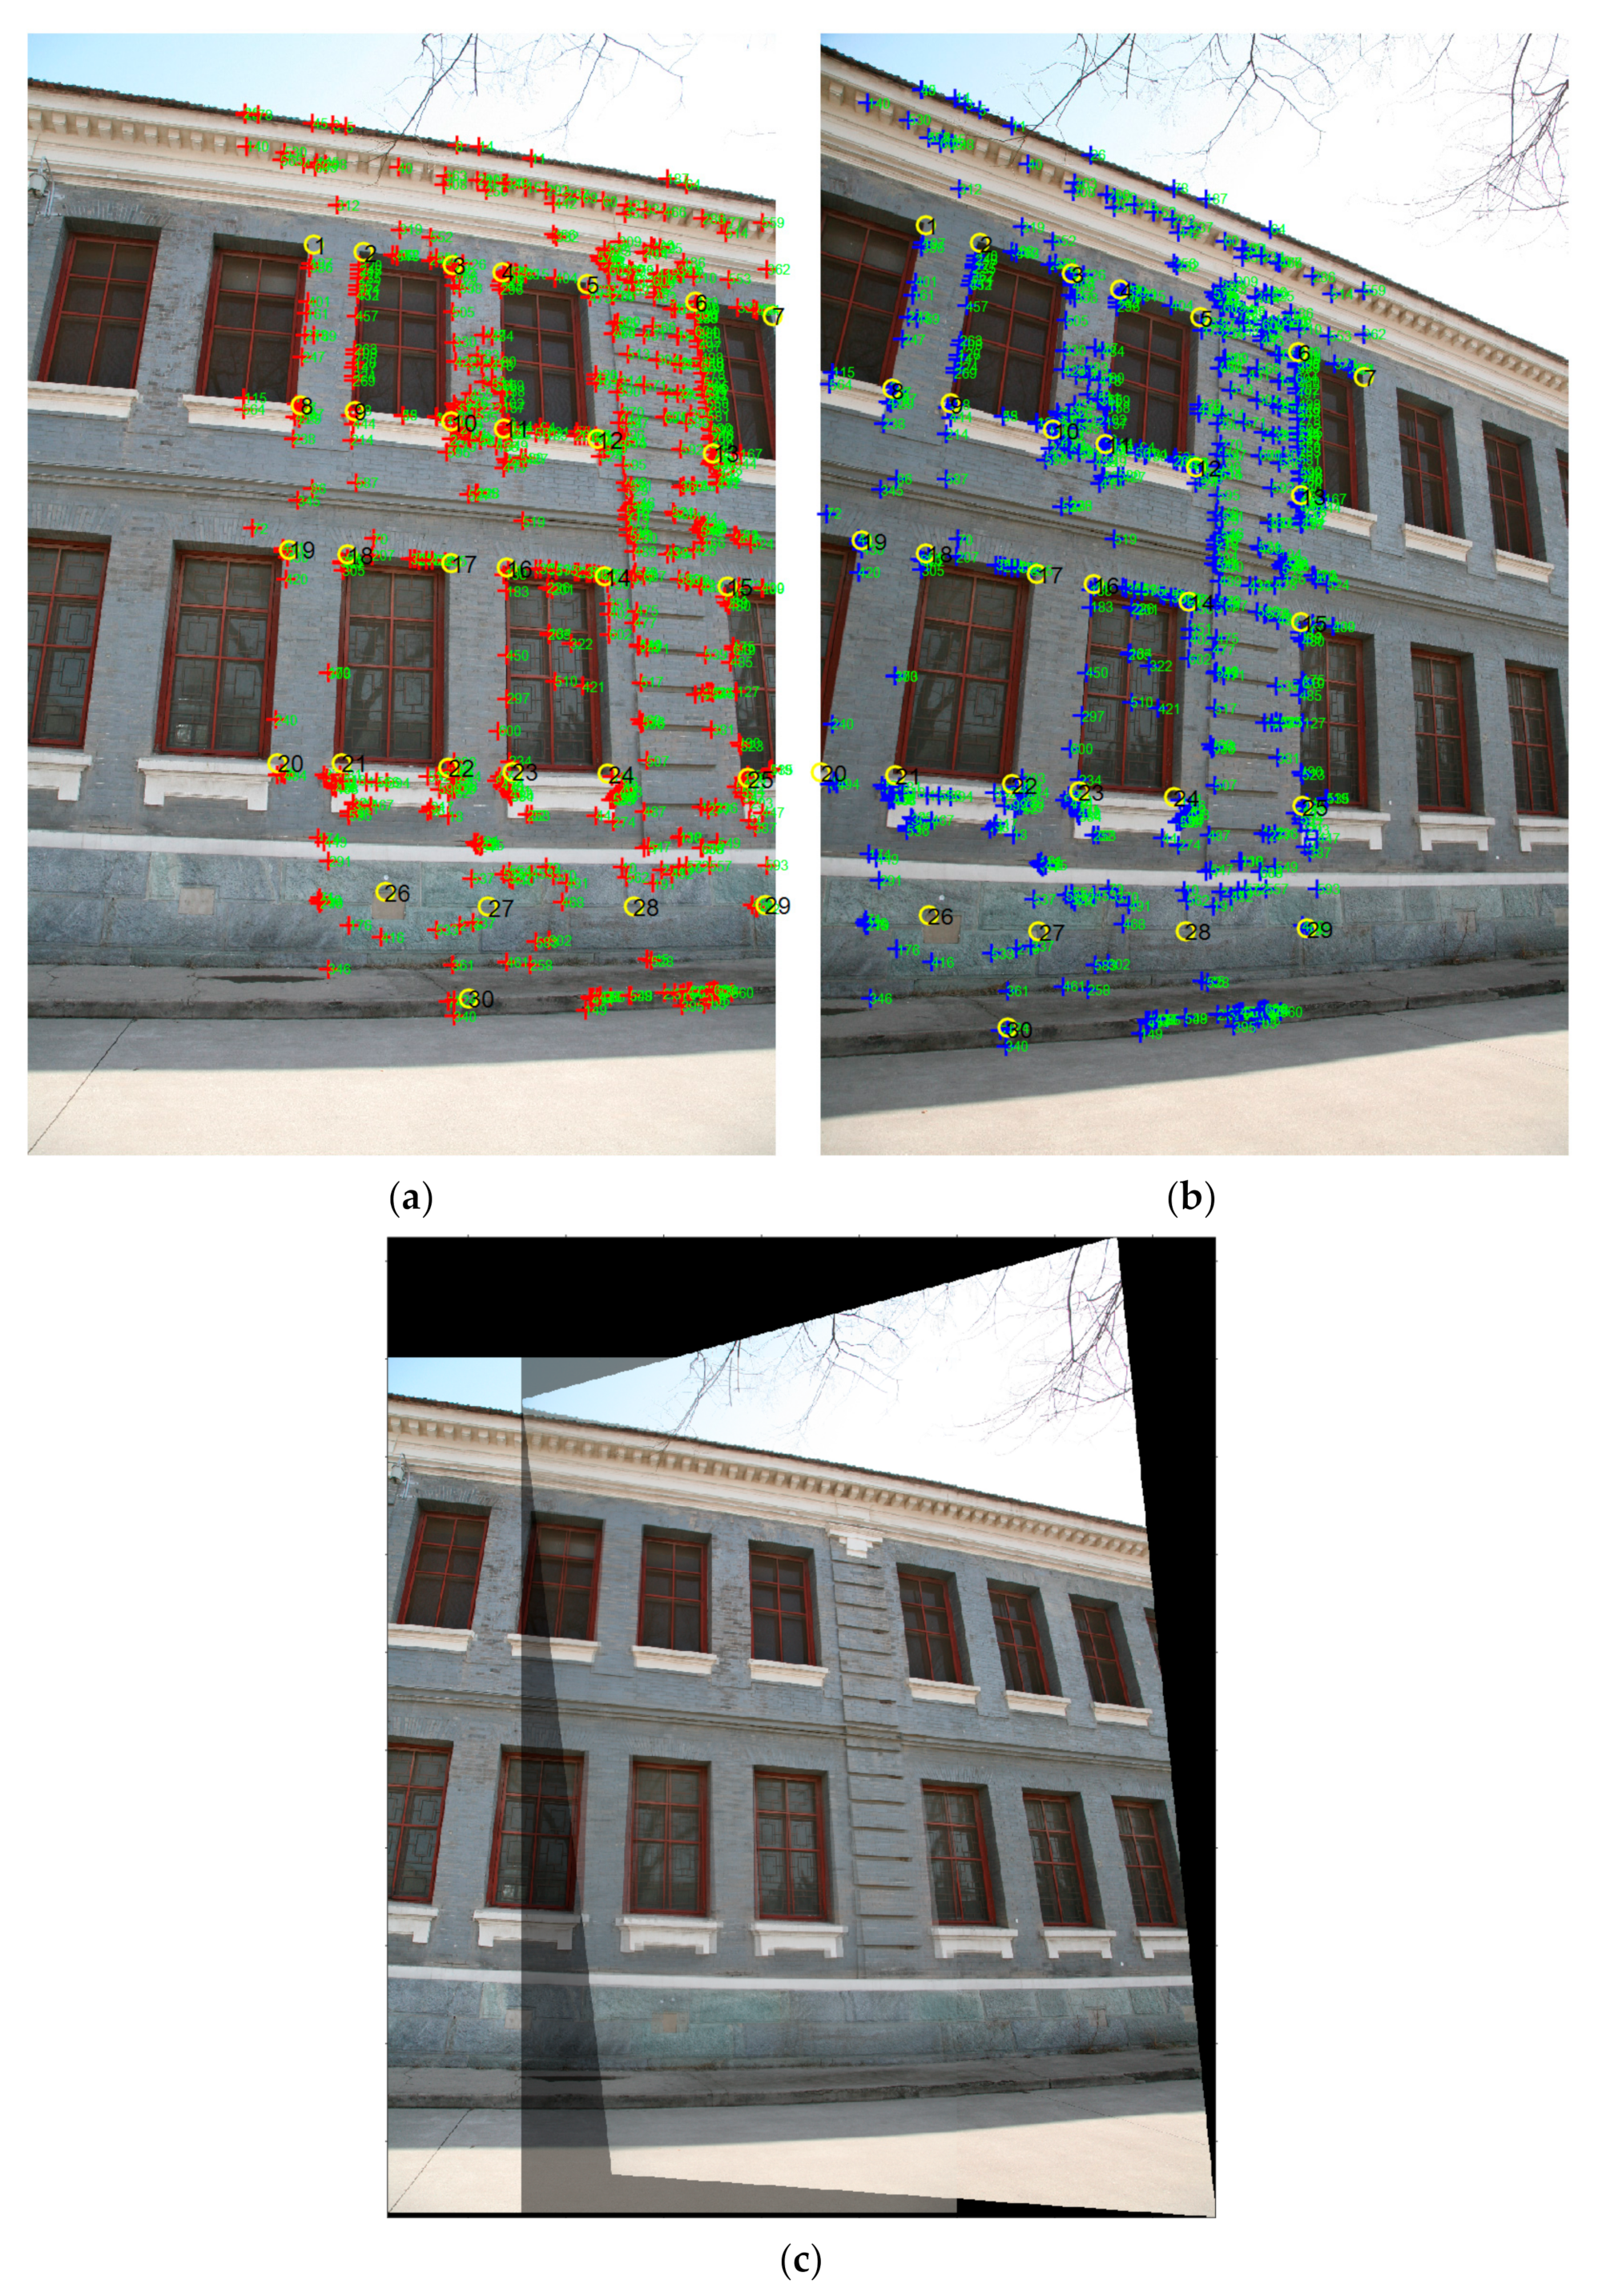
3.2. Real Scene
3.2.1. Data Source
3.2.2. Result Evaluation
4. Conclusions
- (1)
- The study derived the influence value of the known points on the position error of the fixed point, which is represented by HDOP.
- (2)
- is a function to measure the uncertainty of known point distribution and has a range of [0, 1]. Here, the aim of is to remove the effect of the number of known points.
- (3)
- The average function of the center points of the overlapping region was chosen to measure the uncertainty of matching point distribution.
5. Patents
Author Contributions
Funding
Institutional Review Board Statement
Informed Consent Statement
Data Availability Statement
Acknowledgments
Conflicts of Interest
References
- Brand, P.; Mohr, R. Accuracy in image measure. In Proceedings of the SPIE Conference on Videometrics, Boston, MA, USA, 6 October 1994. [Google Scholar] [CrossRef]
- Sankowski, W.; Włodarczyk, M.; Kacperski, D.; Grabowski, K. Estimation of measurement uncertainty in stereo vision system. Image Vis. Comput. 2017, 61, 70–81. [Google Scholar] [CrossRef]
- Weng, J.; Huang, T.; Ahuja, N. Motion and structure from two perspective views: Algorithms, error analysis, and error estimation. IEEE Trans. Pattern Anal. Mach. Intell. 1989, 11, 451–476. [Google Scholar] [CrossRef] [Green Version]
- Kanazawa, Y.; Kanatani, K. Do we really have to consider covariance matrices for image feature points? Electron. Commun. Jpn. 2002, 86, 1–10. [Google Scholar] [CrossRef]
- Brooks, M.J.; Chojnacki, W.; Gawley, D.; Hengel, A.V.D. What value covariance information in estimating vision parameters? In Proceedings of the IEEE International Conference on Computer Vision 2001, Vancouver, BC, Canada, 7–14 July 2001. [Google Scholar] [CrossRef] [Green Version]
- Haralick, R.M. Propagating Covariance in Computer Vision. Int. J. Pattern Recognit. Artif. Intell. 1996, 10. [Google Scholar] [CrossRef] [Green Version]
- Steele, R.M.; Jaynes, C. Feature Uncertainty Arising from Covariant Image Noise. In Proceedings of the IEEE Computer Society Conference on Computer Vision and Pattern Recognition, San Diego, CA, USA, 20–26 June 2005. [Google Scholar] [CrossRef]
- Di Leo, G.; Liguori, C.; Paolillo, A. Covariance Propagation for the Uncertainty Estimation in Stereo Vision. IEEE Trans. Instrum. Meas. 2011, 60, 1664–1673. [Google Scholar] [CrossRef]
- Fitzpatrick, J.; West, J. The distribution of target registration error in rigid-body point-based registration. IEEE Trans. Med Imaging 2001, 20, 917–927. [Google Scholar] [CrossRef] [PubMed]
- Fathy, M.E.; Hussein, A.S.; Tolba, M.F. Fundamental matrix estimation: A study of error criteria. Pattern Recognit. Lett. 2011, 32, 383–391. [Google Scholar] [CrossRef] [Green Version]
- Hartley, R.; Zisserman, A.; Faugeras, O. Multiple View Geometry in Computer Vision, 2nd ed.; Cambridge University Press: Cambridge, UK, 2003; pp. 93–139. [Google Scholar]
- Gui, Y.; Su, A.; Du, J. Point-pattern matching method using SURF and Shape Context. Int. J. Light Electron. Optics 2013, 124, 1869–1873. [Google Scholar] [CrossRef]
- Tong, G.; Wang, C.; Wang, P. Study on Improving Image Feature Points Detection and Matching Accuracy in Binocular Vision System. In Proceedings of the International Industrial Informatics and Computer Engineering Conference, Xi’an, China, 10–11 January 2015. [Google Scholar] [CrossRef] [Green Version]
- Zhao, Y.; Su, J. Local sharpness distribution–based feature points matching algorithm. J. Electron. Imaging 2014, 23, 13011. [Google Scholar] [CrossRef]
- Hu, M.; Liu, Y.; Fan, Y. Robust Image Feature Point Matching Based on Structural Distance. In Proceedings of the Chinese Conference on Image and Graphics Technologies, Berlin, Germany, 10–12 March 2015. [Google Scholar] [CrossRef]
- Mai, H.Y.; Lee, D.-H. Impact of Matching Point Selections on Image Registration Accuracy between Optical Scan and Computed Tomography. BioMed Res. Int. 2020, 2020, 1–7. [Google Scholar] [CrossRef] [PubMed]
- Tan, X.; Sun, C.; Sirault, X.; Furbank, R.; Pham, T.D. Feature Correspondence with Even Distribution. In Proceedings of the International Conference on Digital Image Computing Techniques and Applications, Perth, Australia, 14 July 2012. [Google Scholar] [CrossRef]
- Tan, X.; Sun, C.; Sirault, X.; Furbank, R.; Pham, T.D. Feature matching in stereo images encouraging uniform spatial distribution. Pattern Recognit. 2015, 48, 2530–2542. [Google Scholar] [CrossRef]
- Guo, X.; Cao, X. Good match exploration using triangle constraint. Pattern Recognit. Lett. 2012, 33, 872–881. [Google Scholar] [CrossRef]
- Zhu, Q.; Wu, B.; Xu, Z.-X.; Qing, Z. Seed Point Selection Method for Triangle Constrained Image Matching Propagation. IEEE Geosci. Remote Sens. Lett. 2006, 3, 207–211. [Google Scholar] [CrossRef]
- Mahmood, M.T.; Lee, I.H. A Reliable Distribution Quality Measure in Image Registration. IEEE Access 2019, 7, 119367–119374. [Google Scholar] [CrossRef]
- Seo, J.-K.; Hong, H.-K.; Jho, C.-W.; Choi, M.-H. Two quantitative measures of inlier distributions for precise fundamental matrix estimation. Pattern Recognit. Lett. 2004, 25, 733–741. [Google Scholar] [CrossRef]
- Bian, Y.; Liu, X.; Wang, M.; Liu, H.; Fang, S.; Yu, L. Quantification Method for the Uncertainty of Matching Point Distribution on 3D Reconstruction. Int. J. Geo-Inf. 2020, 9, 187. [Google Scholar] [CrossRef] [Green Version]
- Zhang, X.-D. Matrix Analysis and Applications, 2nd ed.; Tsinghua University Press: Beijing, China, 2013; pp. 49–51. [Google Scholar]
- Bu, C.J.; Luo, Y.S. Matrix Theory; Harbin Engineer University Press: Harbin, China, 2003; pp. 164–174. [Google Scholar]
- Sheng, H.; Yang, J.S.; Zeng, F.L. The Minimum Value of GDOP in Pseudo-range Positioning. Fire Control Command Control 2009, 34, 22–24. [Google Scholar] [CrossRef]
- Li, J.; Li, Z.; Zhou, W.; Si, S. Study on the Minimum of GDOP in Satellite Navigation and its Applications. Acta Geod. Cartogr. Sin. 2011, 40, 85–88. [Google Scholar]
- Qu, Z.G. Image Structure Description and Matching based on Graph Theory. Ph.D. Thesis, National University of Defense Technology, Changsha, China, 2013. [Google Scholar]


| Test1-1 | Matching Points | Figure 4(a1) | Figure 4(b1) | Figure 4(c1) | Figure 4(d1) |
| Number | 112 | 56 | 28 | 14 | |
| Average of symmetric transfer errors | 1.7936 | 1.8933 | 2.0839 | 3.1605 | |
| 0.3061 | 0.3062 | 0.3173 | 0.3303 | ||
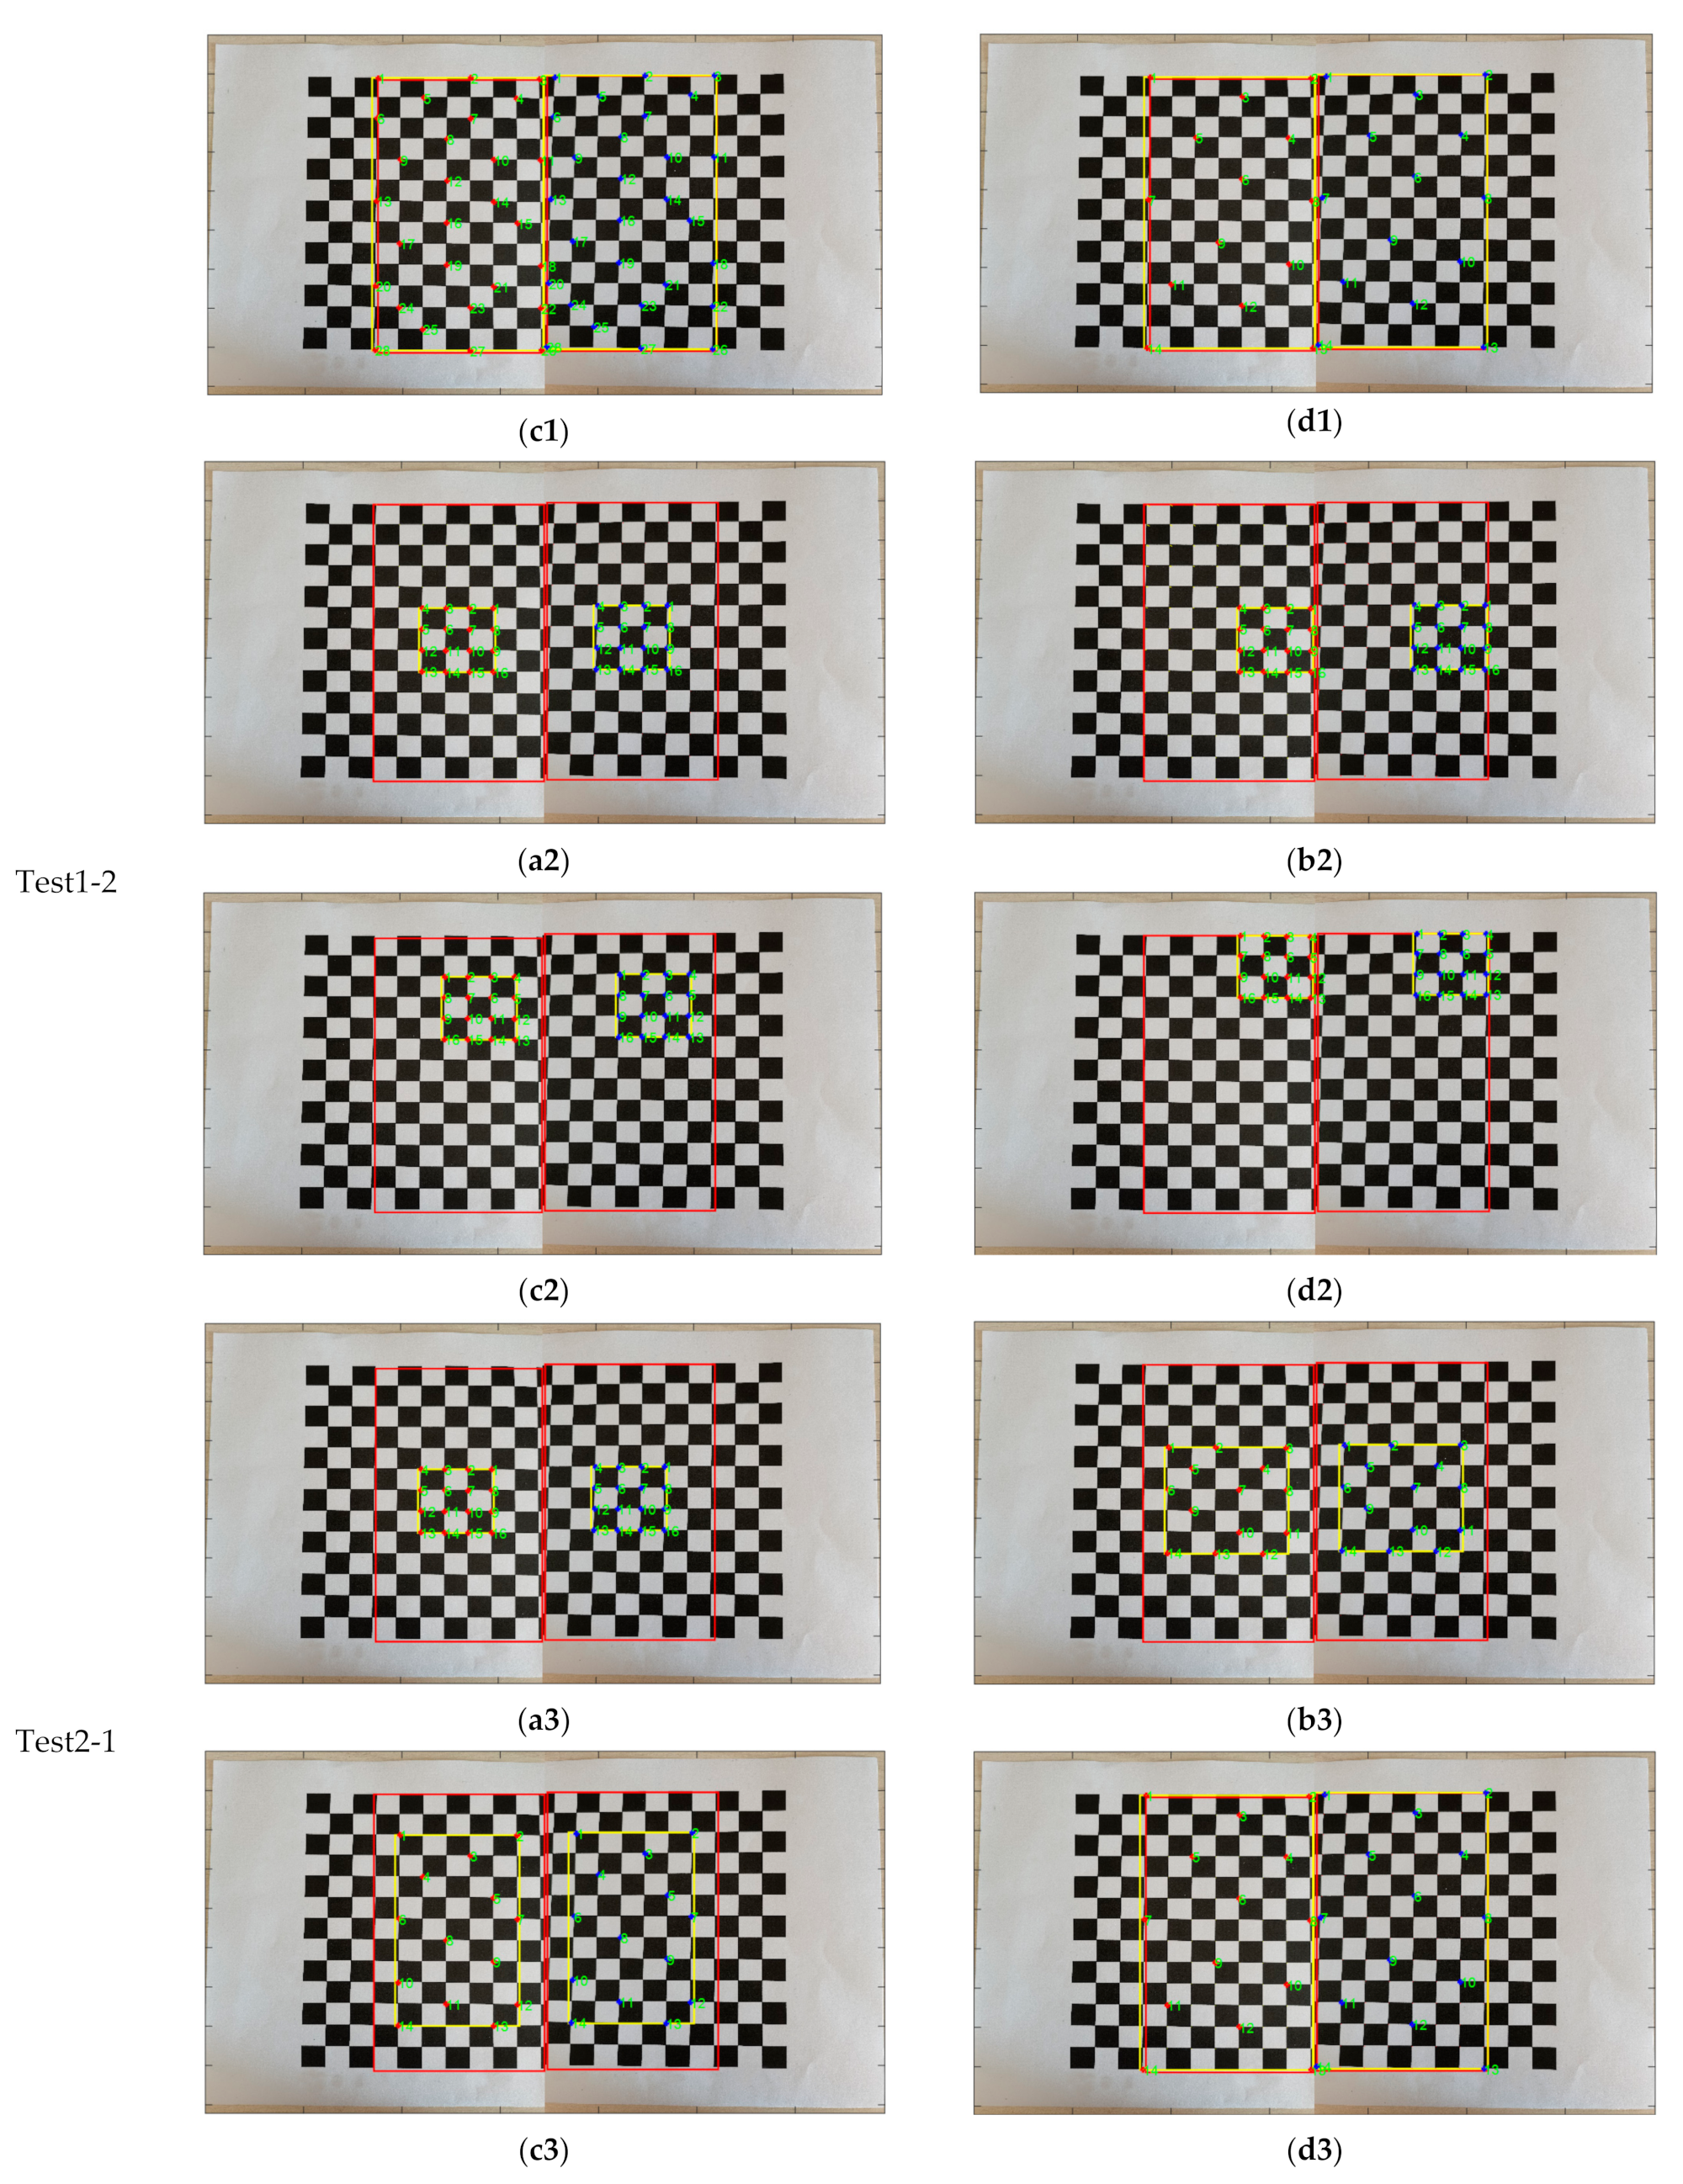
| Test1-2 | Matching Points | Figure 4(a2) | Figure 4(b2) | Figure 4(c2) | Figure 4(d2) |
| Deviation degree | 0 | 0.2536 | 0.4475 | 0.7452 | |
| Average of symmetric transfer errors | 1.1905 | 2.4518 | 3.4666 | 8.8725 | |
| 0.2523 | 0.2960 | 0.5897 | 0.7857 |
| Test2-1 | Matching Points | Figure 4(a3) | Figure 4(b3) | Figure 4(c3) | Figure 4(d3) |
| 0.2521 | 0.2526 | 0.2936 | 0.3254 | ||
| Distribution Uniformity | 598 | 801 | 1088 | 1404 | |
| Average of symmetric transfer errors | 1.4545 | 1.4886 | 1.7494 | 2.7627 | |
| Test2-2 | Matching Points | Figure 4(a4) | Figure 4(b4) | Figure 4(c4) | Figure 4(d4) |
| 0.8415 | 0.4217 | 0.2940 | 0.3045 | ||
| Distribution Uniformity | 543 | 781 | 1110 | 1309 | |
| Average of symmetric transfer errors | 37.1641 | 9.4210 | 1.4338 | 2.8030 | |
| Test2-3 | Matching Points | Figure 4(a5) | Figure 4(b5) | Figure 4(c5) | Figure 4(d5) |
| 0.8429 | 0.5222 | 0.3336 | 0.2878 | ||
| Distribution Uniformity | 731 | 1135 | 1311 | 1343 | |
| Average of symmetric transfer errors | 259.2704 | 12.5142 | 2.4113 | 1.9046 |
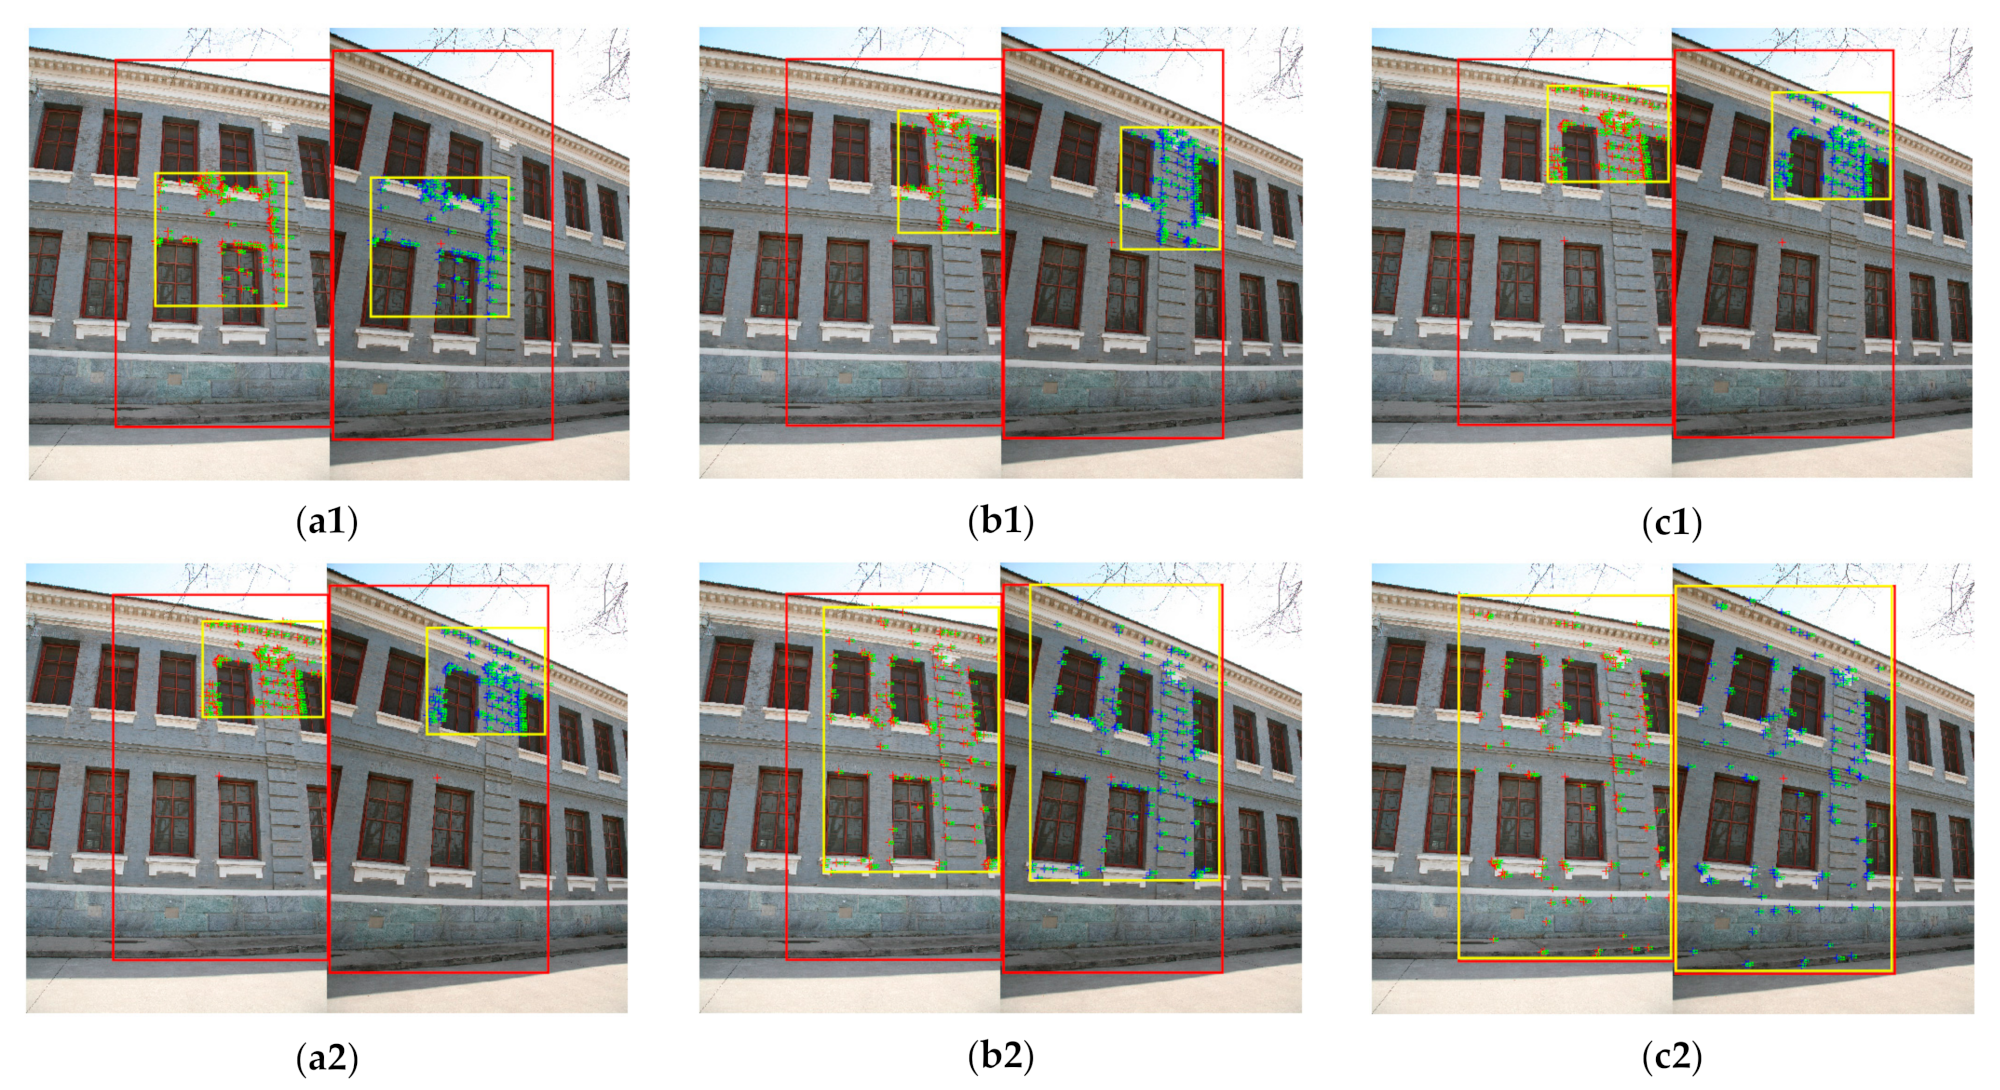
| Test-1 | Matching Points | Figure 6(a1) | Figure 6(b1) | Figure 6(c1) |
| 0.2531 | 0.5749 | 0.6258 | ||
| Average of symmetric transfer errors | 6.5353 | 8.4638 | 10.4455 | |
| Test-2 | Matching Points | Figure 6(a2) | Figure 6(b2) | Figure 6(c2) |
| 0.6258 | 0.2758 | 0.2789 | ||
| Average of symmetric transfer errors | 10.4455 | 7.1007 | 7.6965 |
Publisher’s Note: MDPI stays neutral with regard to jurisdictional claims in published maps and institutional affiliations. |
© 2021 by the authors. Licensee MDPI, Basel, Switzerland. This article is an open access article distributed under the terms and conditions of the Creative Commons Attribution (CC BY) license (https://creativecommons.org/licenses/by/4.0/).
Share and Cite
Bian, Y.; Wang, M.; Chu, Y.; Liu, Z.; Chen, J.; Xia, Z.; Fang, S. A Cost Function for the Uncertainty of Matching Point Distribution on Image Registration. ISPRS Int. J. Geo-Inf. 2021, 10, 438. https://0-doi-org.brum.beds.ac.uk/10.3390/ijgi10070438
Bian Y, Wang M, Chu Y, Liu Z, Chen J, Xia Z, Fang S. A Cost Function for the Uncertainty of Matching Point Distribution on Image Registration. ISPRS International Journal of Geo-Information. 2021; 10(7):438. https://0-doi-org.brum.beds.ac.uk/10.3390/ijgi10070438
Chicago/Turabian StyleBian, Yuxia, Meizhen Wang, Yongbin Chu, Zhihong Liu, Jun Chen, Zhiye Xia, and Shuhong Fang. 2021. "A Cost Function for the Uncertainty of Matching Point Distribution on Image Registration" ISPRS International Journal of Geo-Information 10, no. 7: 438. https://0-doi-org.brum.beds.ac.uk/10.3390/ijgi10070438