1. Introduction
The perception of inherent tensions between justice and injustice (or the disproportion of good and bad) often press a group of people (or even the whole society) to seek change concerning politics and power, for example in the form of protests [
1]. In the last few decades, the advent and rapid expansion of internet-based communication technologies transformed the way of seeking change through connective action, where besides the two main elements—the people and their intentions—the role of the information along with its spread and accessibility gained more and more significance [
2].
The data-driven approach, relying on social media posts and activities, has many strengths—especially considering its high temporal resolution and rapid user-response to certain news and information [
3]. Social movement research employs this approach to identify the sentiment of the masses during an event to discover an individual’s inner tension [
4,
5]. Another component of the research is devoted to identifying the sociopolitical event (e.g., murder, accident, or price rise) that initiates a mass movement [
6,
7,
8]. Social media can also be used to mobilize [
9,
10,
11] and sustain [
12] a protest by virtue of the connection’s immediacy and by increasing visibility among potential supporters [
13]. Additionally, the message functions of various social media sites (e.g., message sharing or liking) can enable users to create an identifiable leader from (and for) the masses [
14,
15,
16,
17].
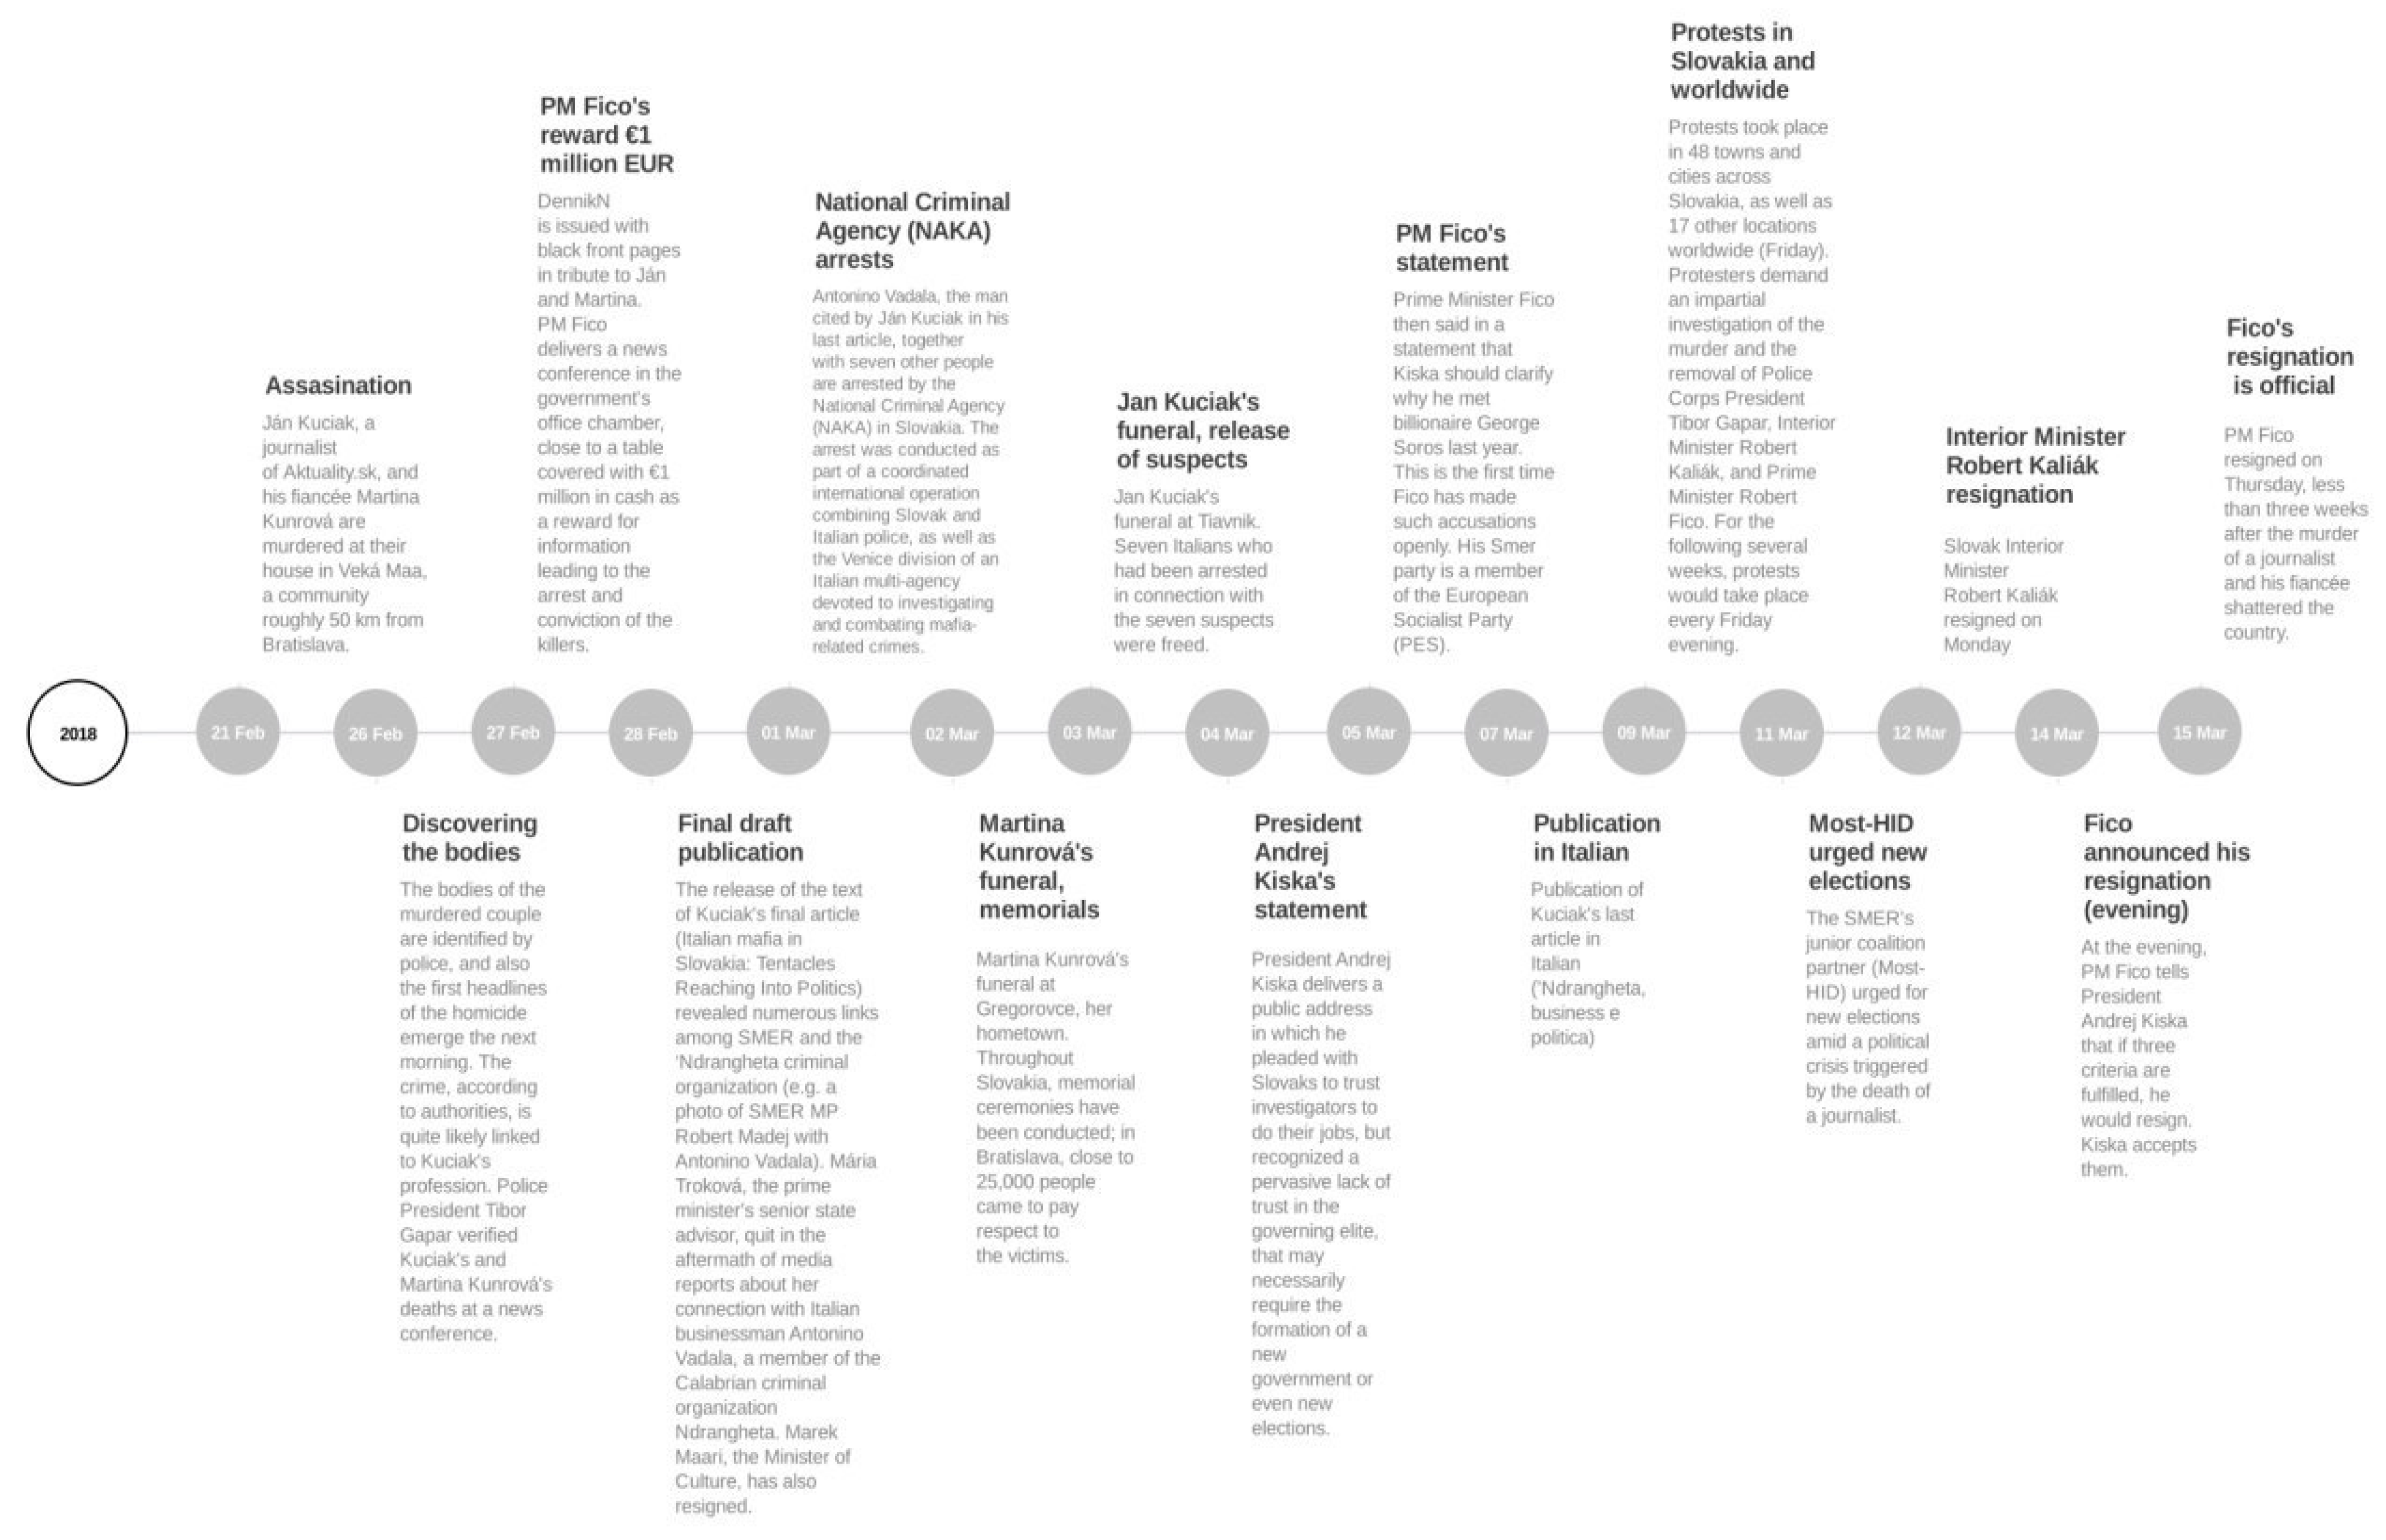
This paper investigates the public’s responses in social media to the widely discussed case of Ján Kuciak and his fiancée Martina Kušnírová, who suffered a deadly attack in their family home in Veľká Mača, Slovakia on the evening of 21 February 2018. The day after the first reports were published (26 February), gatherings were held around the country in tribute. On Friday, 2 March, up to 25,000 people gathered in Bratislava to express protest against the attacks. On 9 March, protests were held in another 48 towns in Slovakia, as well as 17 other cities around the world. In Bratislava alone, about 60,000 people held a protest march. The series of events culminated on 15 March, with the resignation of Prime Minister (PM) Fico and his cabinet [
18].
In our work, we examine the similarities and correlations of spatial, temporal, and sentimental markers of Twitter data by developing a new data-driven combined approach investigating the European influence of a Slovakian journalist’s (Ján Kuciak) assassination in 2018. Recently, the murder of Kuciak and the reaction of the people were analyzed on a wider timeframe (28 February–28 July 2018) by Kapanova and Stoykova [
19]. The authors applied a network-based analysis on the #AllforJan hashtags [
19]. The multi-spectral interpretation of the dynamic and challenging nature of the events requires an efficient analytical method to assist a more comprehensive understanding of the protest dynamics.
Thus, our work goes beyond the state of the art in two distinct ways. First, we demonstrate how georeferenced social media data can be used for analyzing political events, even at a smaller spatial and societal scale and in non-English languages. Second, from a methodological viewpoint, we propose a new algorithmic workflow that combines time-series clustering with semantic topic modelling and sentiment analyses on georeferenced social media data.
By presenting an original perspective considering the limitations of existing analyses, in this article we intend to answer the following research questions:
- 1.
Temporal aspects:
How tweeting activity related to the murder of Kuciak varied over time throughout Europe? (RQ1a)
Can we identify the influence of specific events and incidents, such as media reports or findings of the investigation based on this tweeting activity? (RQ1b)
- 2.
Content aspects:
How does the sentiment of the tweets vary over time, and how does it relate to specific events and news? (RQ2a)
Around what topics do the tweets revolve, beyond the murder itself? (RQ2b)
- 3.
Profiles:
How can we characterize the countries based on the temporal aspects of the tweeting activity and the sentiment of the tweets? (RQ3a)
Does the categorization of the countries also reflect differences in the identified topics or the changes of the sentiment values over time? (RQ3b)
2. Related Works
In the last decade, the use of social media data as a source of information has become increasingly widespread in a variety of fields ranging from medical research to urban planning [
20,
21,
22,
23]. The examination of information from social networking sites can be instrumental in achieving a thorough interpretation of the human environment and social dynamics. Such research projects usually utilize a so-called passive crowdsourcing approach, where data is generated collectively by users of a social media platform, but without direct contributions to a specific research or crowdsourcing project, as opposed to traditional (or active) crowdsourcing such as OpenStreetMap [
24,
25]. The emerging field of passive (or opportunistic) crowdsourcing relies on such data, granting empirical investigations that usually build on a semi-automated data collection process. The users either provide data in the form of text (e.g., Twitter) or images (e.g., Instagram), which are often paired with sensor-obtained information (e.g., location) and uploaded online [
26,
27]. Despite the unique usability of this research field, relatively few papers published so far have concentrated on multi-dimensional analysis applications of social media data in the analysis of collective actions, such as protests.
Although the social media-based analytical methods of collective actions have accelerated the slow and expensive conventional methods, such as surveys, they are still characterized by a variety of deficiencies, such as lack of representativeness or transferability of the results. Moreover, the widespread and well-established advantages of network modeling approaches on hashtags [
13,
14,
28,
29] or users [
30,
31] in recent literature analyzing protests based social media data, they are often not capable of handling the complexity of the sentiment, temporal, and spatial patterns of these actions in one approach. One limitation is that the analysis relies on Tweets having coordinates as an inherent part of the dataset [
32,
33], which—according to earlier studies—represents only a small subset of all tweets (approximately 1–10%) posted within a specified time period [
34]. Another limitation is that they focus only on a single language (usually English) that may also limit the spatial interpretability of the results [
35], especially in the case of movements that span over multiple countries. This is where the benefits of a thorough data pre-processing method, including translations and user location extraction, become relevant, which supports the more precise assessment of a post-event situation through extracting an additional information layer from the digital footprints of users by revealing contextual insights. This approach already exists in other fields, for example to uncover disaster footprints, but not in the case of social movements or unrest [
36,
37,
38].
This article suggests a comprehensive methodology to overcome limitations in the existing methods and handle the complexity of protest analyses. The proposed approach includes multi-lingual corpus translation, as well as location and sentiment extraction, using machine-learning topic modelling methods to reveal the hidden interests and motivators of collective action. Through this, our approach has a distinct advantage over the prior investigations that primarily focused either on hashtag-activism [
39,
40] (ignoring the spatial dimensions) or, on the contrary, using only location-specific hashtags [
41,
42], whereas by applying machine learning algorithms and techniques that are almost entirely automatable, we can have a much wider range of input data than existing studies, where the researchers solely evaluate posts manually [
7,
43].
3. Materials and Methods
3.1. Data
The Twitter data analyzed in this work were obtained using the Twitter Streaming Application Programming Interface [
44] for the period between 26 February and 15 March 2018. The starting date is adjusted to the first official report of the murder of Ján Kuciak while the final day is adapted to the earliest statement of the resignation of Prime Minister, Robert Fico. The dataset consists of the content of the tweets and additional attributes such as user name, user location, and the timestamp when the tweet was posted. In the first round we harvested tweets with relevant content (such as names: kuciak, kusnirova, fico) or hashtags (#AllforJan) within this period. This resulted in 13,176 tweets from all over the world. However, as our analysis approach requires geospatial analyses as well, we have implemented a secondary filtering on these datasets to identify relevant tweets by focusing on place attributes or the coordinates of a tweet, out of which at least one parameter should contain valuable data. Around 3000 tweets where user location was not specific enough (such as “World”, “Internet”, or “online”) have been excluded. Most of the tweets were posted from Europe, thereby for the rest of the analysis, we consider only European locations. By transforming user location into coordinates, we could further increase the amount of tweets used for the analysis, as the original dataset contained only 24 tweets with coordinates. Another 1800 tweets were also removed from our dataset as they were too short or no meaningful coordinate could have been attached to them. Overall, this two-step query and the following filtering resulted in 8069 Tweets distributing over an 18-days long timeframe for 39 countries (see
Figure 1 for the overview of the timeline).
3.2. Data Pre-Processing
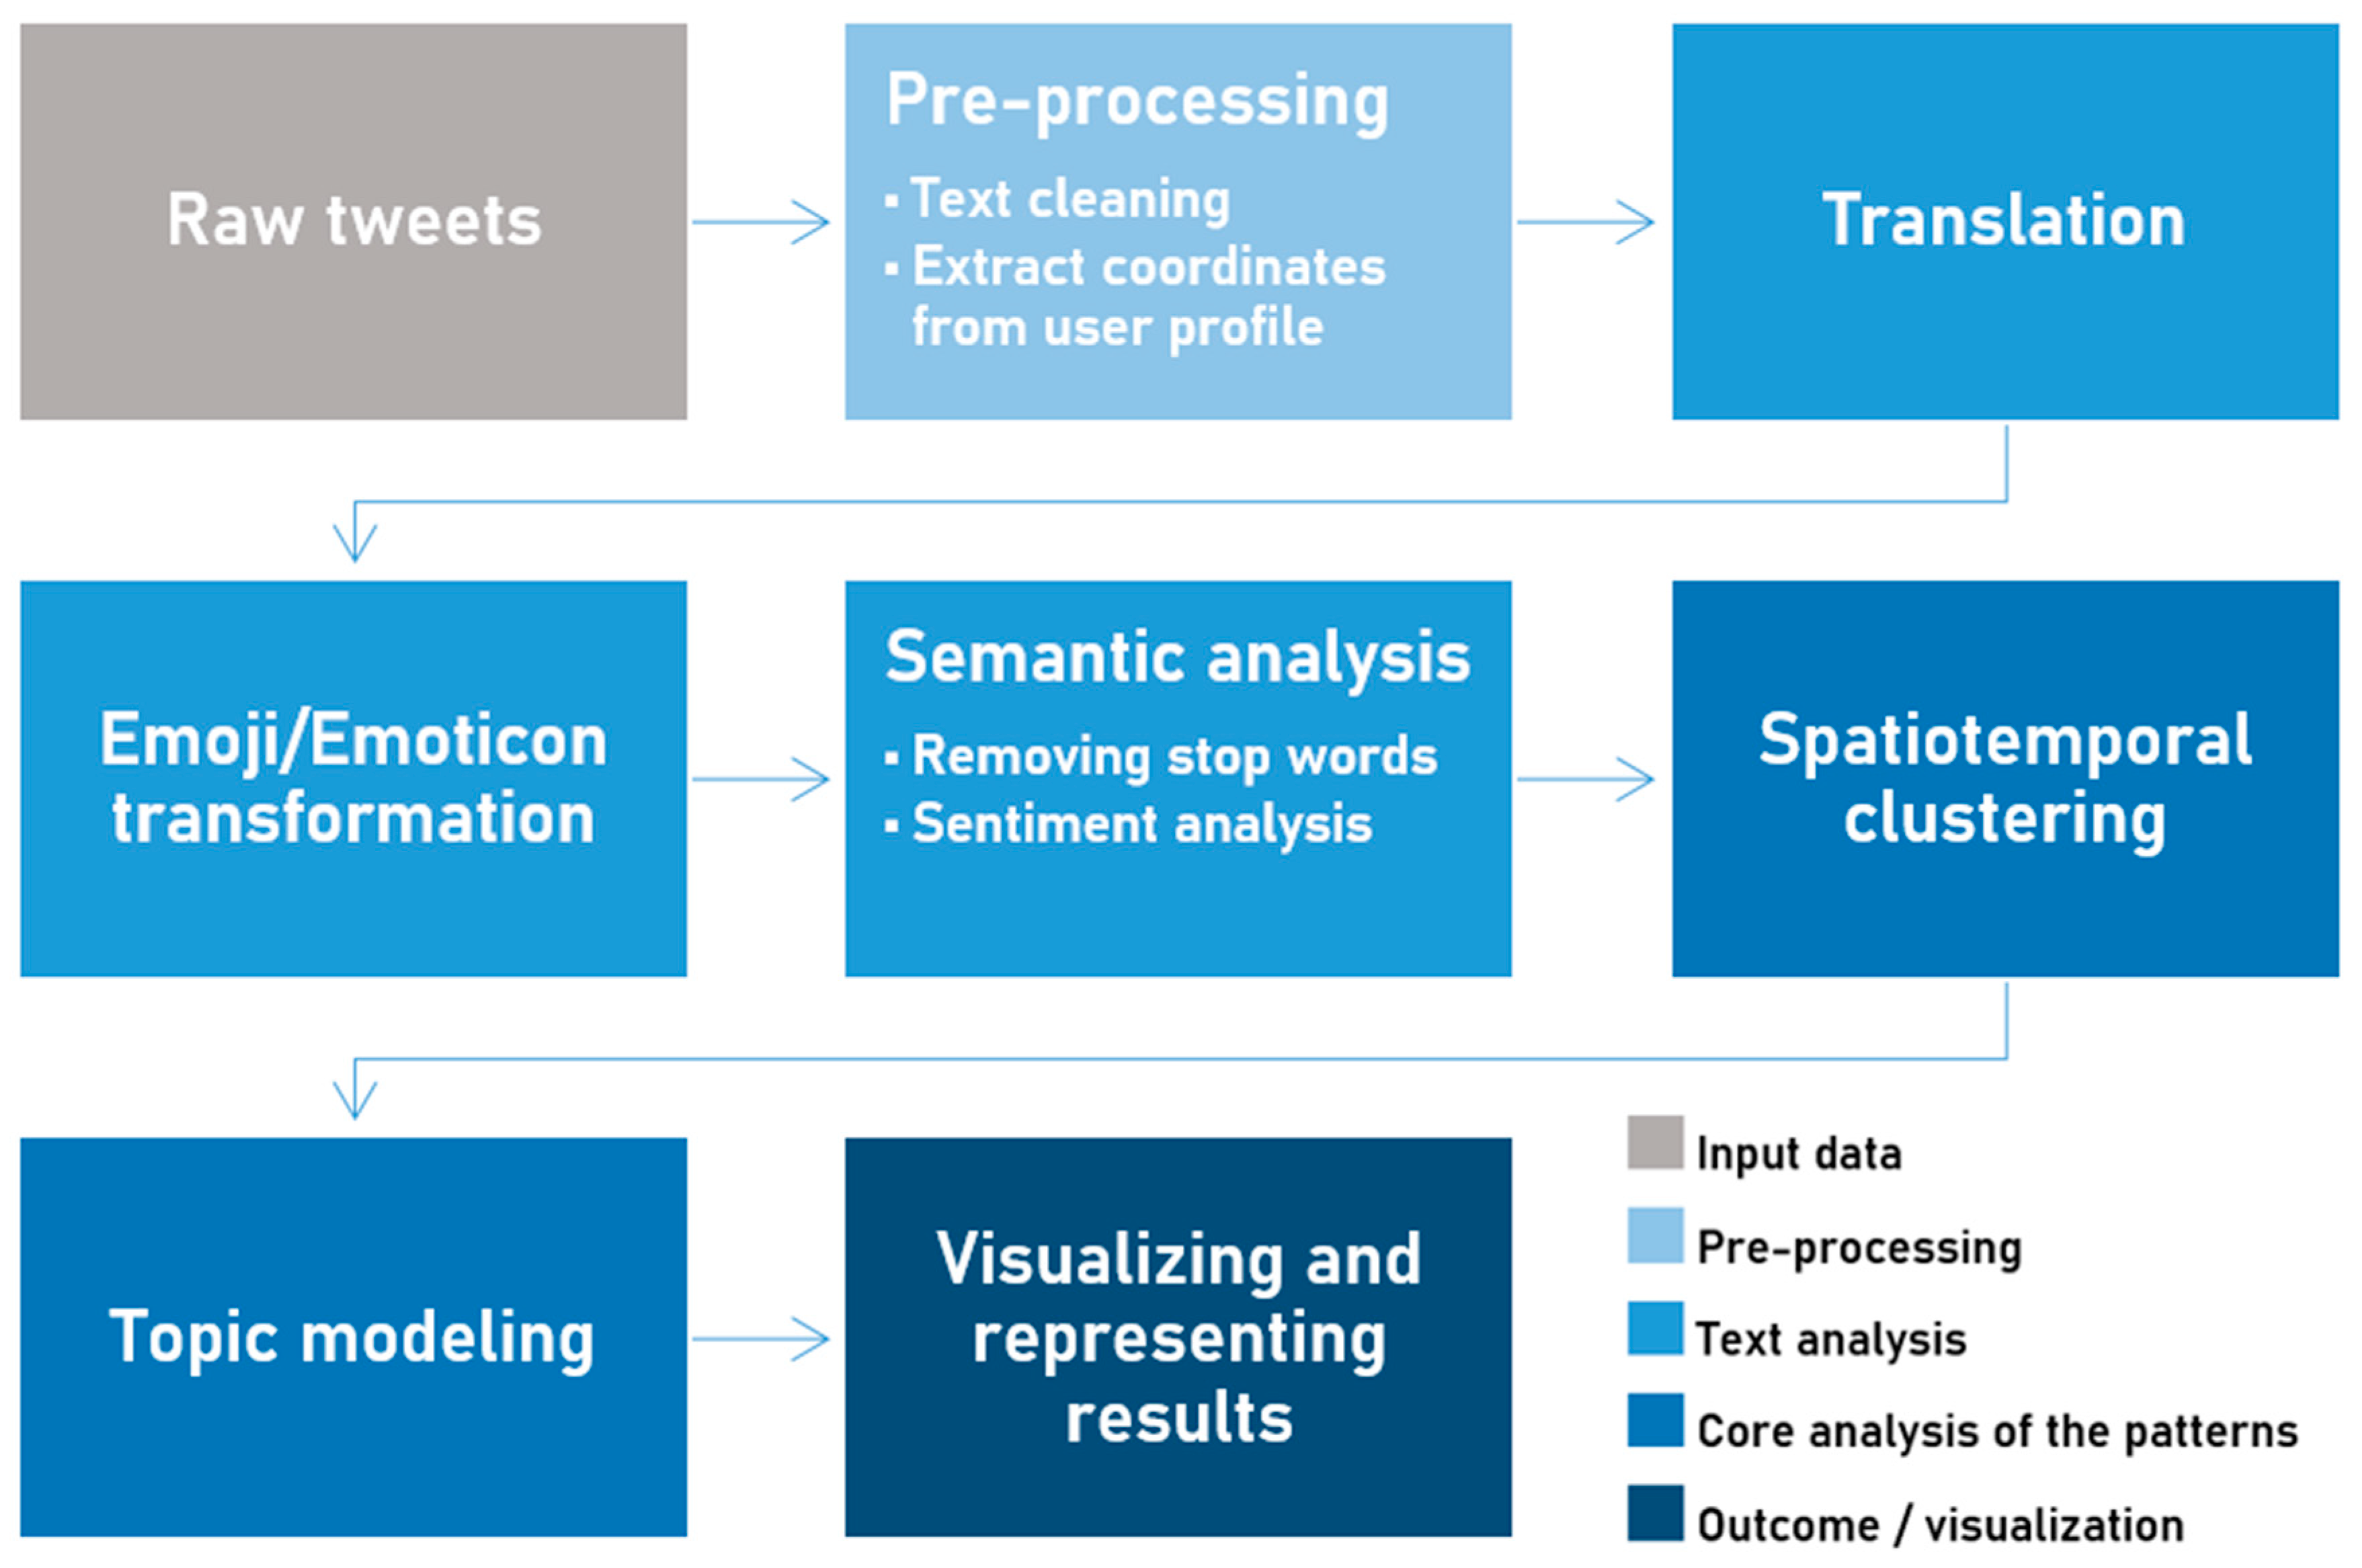
Figure 2 illustrates the key steps of our analysis performed on the dataset of the harvested tweets mentioned in
Section 3.1. Our pre-processing approach (Step 1 performed on the raw tweets) consists of a thorough text cleaning workflow and the transformation of available meaningful location information to coordinates for further utilization in the spatial analysis step (
Figure 2). In the first part of the pre-processing, we implement primary filtering on our dataset to ignore short tweets that hardly bear any semantic significance. Moreover, stop-words, rare, and too frequent words are removed to normalize the dataset and reduce the redundant noise from tweets [
45]. Then, we use the available location information of the user to localize the tweets without direct coordinates attached to a tweet (also called geoparsing, see further details in
Section 3.2.2) to further increase the size of the dataset for machine learning-based translation and spatiotemporal analysis.
3.2.1. Text Cleaning
The aim of this step is to increase the efficiency of the subsequent translation process. We remove short tweets (containing a single word), or those posts that contained only hashtags or URLs, because they hold unclear and hardly interpretable semantic value [
46]. Then, we remove replies (@user_name) from the text as that is considered as unnecessary noise in the analysis; in contrast, the hashtags are preserved but their sign (#) is removed. The consideration behind this step is that users tend to use hashtags as an integral part of the syntax [
47], e.g., “on Friday I’m also going to #Bratislava to protest” -> “on Friday I’m also going to Bratislava to protest”. As a final cleaning step, we remove new line characters as well as additional whitespaces from the tweets.
Figure 1.
Overview of the timeline for the analysis period (26 February to 15 March 2018) representing the most important events and news (based on
The Slovak Spectator [
48]).
Figure 1.
Overview of the timeline for the analysis period (26 February to 15 March 2018) representing the most important events and news (based on
The Slovak Spectator [
48]).
Figure 2.
Overview of the workflow.
Figure 2.
Overview of the workflow.
3.2.2. Locating Tweets Using Coordinates or User Profile Information
As our research questions heavily rely on spatial information, we attempted to process information of all Twitter fields that may contain relevant spatial attributes to increase the amount of tweets having an identifiable location at least at the country level. In general, the tweets that inherently include coordinates constitute only a small subset of all tweets. To overcome this limitation our analytical approach tried to locate those tweets that had no coordinates using location information available in the users’ profile.
In 2018 Twitter still allowed users to add the exact location of where they were tweeting from using coordinates; however, this feature is not available anymore. Such tweets contain precise latitude/longitude coordinates representing a point somewhere in the world, and this information comes from the built-in GPS receiver of the device. This location type does not include further information beyond the coordinates such as from which city or country was it exactly posted. To obtain address information for these coordinates, we used the Geopy Python client [
49] to access the geocoding web services provided by the OpenStreetMap API (Nominatim) [
50]. The location.raw (‘address’) function returns a dictionary of address components, such as country code, city, or road, allowing for a targeted query of relevant address information. The other location type, which can be assigned by the user to a tweet (the only way to add location information when this paper was written) is the so-called Twitter “Place” tag. This tag in contrast with adding only coordinates has further properties such as the name of the city or region, along with the country-code showing the country where the given “Place” is located. The source of this information is still the built-in GPS (or GNSS) receiver of the device, but how this information is visualized and presented is different from the option written above, where exact coordinates were attached to a tweet.
To increase the amount of tweets having some kind of spatial reference, we can extract location information from the profile of the Twitter users, which information can serve as a proxy to where this user might be active most of the time. Several data fields fall into this category, but all of them represent information that the users insert at the account level and not for each tweet separately; thus, the information’s credibility mainly relies on the user. Moreover, even if the location information at the account level is valid, it might not be correct for each individual tweet, for example if the person is traveling abroad. Generally, these values are not frequently altered and do not necessarily describe the tweet’s exact location, but they may represent the user’s residence at least on a city level. As our research considers tweets aggregated on a country level and not the exact location within a city or a country, we still find these data valuable as proxy in instances where no direct location information for a given tweet was provided. To obtain useful information on user_location data, first we ranked individual user_location data by frequency then used the built-in map function of Python [
51] and a translator dictionary developed by us to transform all location items and to group similar entries. For instance, “BaWü, DE” was transformed to “Baden-Württemberg, Germany” and similarly “B. Württemberg” was also converted to “Baden-Württemberg, Germany.” The second step after user_location transformation was to apply the Geolocator function of OpenStreetMap through Geopy, which provided latitude and longitude coordinates, that we will use for subsequent mapping applications. Originally, in our raw data set, out of all the tweets, only around 0.2% (24) hold coordinates; however, with the above-mentioned transformation approaches, we could provide coordinates for 8069 tweets that is 61.2% of the original dataset. The remaining 38.8% of the tweets were either posted outside of Europe, or it was impossible to locate them, whereas most of them were excluded as part of the text cleaning process described in
Section 3.2.1.
3.3. Translation Using Google API
The majority of the tweets (68%) were non-English and therefore had to be translated for the subsequent analysis steps. In order to translate these non-English tweets, we used TextBlob, a text-processing library written in Python. According to its documentation, TextBlob [
52] can also be used for part-of-speech tagging, parsing, sentiment analysis, spelling correction, and translation tasks. The algorithm relies on the most used online translation service, Google Translate’s API. One of the most significant benefits of this Translation API is that it has a pre-trained model that instantly identifies languages with high accuracy and can translate them into more than one hundred target languages, including all the European languages we used in this analysis. In 2011, as part of a comprehensive accuracy evaluation, 51 languages were translated using Google Translate to another language and the results showed that most of the European languages had reliable results. Thanks to a service update in 2016 by applying a Neural Machine Translation (NMT) model, the translation accuracy score increased from 3.694 (out of 6) to 4.263, close to a human-level score of 4.636 [
53]. This high value is acceptable for the next steps in our workflow, as our approach uses word-based analysis to extract sentiment values.
3.4. Emoji/Emoticon Transformation
In general, text pre-processing approaches tend to remove any emojis (small images) and emoticons (facial expression representation using keyboard characters and punctuations) from the text. The main problem of such approaches is that users use these small images and characters as the lingua franca of social media to express feelings or ideas, compressing a meaningful word in a short number of characters [
54]. In our methodology, we are not considering their removal as the appropriate solution since emojis and emoticons contain valuable information, particularly for the subsequent sentiment analysis. Thus, we convert them to word format using the Python emote library [
55] in order to preserve the emoji information for further analysis steps.
3.5. Semantic Analysis
The semantic text analysis process used in our approach is divided into two stages: first, we extend the list of stop words in the algorithm based on the characteristics of our data set and then we remove these words from the text, and second, we provide a dictionary-based sentiment analysis, which classifies the subjective sentiment information contained in each tweet.
3.5.1. Removing Stop Words
The literature considers auxiliary verbs, conjunctions and other parts of written text that do not bear significant semantic meaning as “stop words”. A list of these words is predefined by the Natural Language Toolkit (NLTK) [
56] in the algorithm we used. Nonetheless, we added further words to the stop word dictionary that are unique to the unedited text, or the analyzed corpus, including special first names “Martina”, “Marian”, “Andrej” or words like “gonna”, “wanna”. We remove these words from the dataset along with words with three or less characters, as they also have limited semantic significance.
3.5.2. Sentiment Analysis
Sentiment scores are used to identify how positive or negative the text of a given tweet is. This identification is performed by calculating the difference between the quantity of positive and negative terms using a vocabulary with positive and negative words in an automated way. We selected for this purpose the VADER (Valence Aware Dictionary and sEntiment Reasoner) lexicon, a rule-based sentiment analysis tool that uses a lexicon-driven method and heuristics to assess the input data. This method is standardized to the sentiments presented in social media, and it has a higher classification accuracy than other methods in the light of the recent literature [
57]. In the comparative study of Hutto and Gilbert it was found that the VADER correlation coefficient (
r) was nearly equal to human raters’ performance (
r = 0.881 vs. 0.888). However, when they inspected the classification accuracy for social media text analysis (F1) it outperformed the human raters (F1 = 0.96 vs. 0.84), and other eleven highly regarded analysis tools such as the Hu-Liu04 opinion lexicon or WordNet [
57].
Generally, if the score is lower than zero, the sentence or text element is assumed to include a “negative sentiment,” whereas it is considered a “positive sentiment” if this sentiment value is higher than zero. If the score equals zero, then the sentence is identified as “neutral.” The main problem of this arrangement with only three classes is that the algorithm has shortcomings in determining unambiguous negative or positive scores for sentiment rates around zero because they are either indeed neutral or misclassified with a relatively high probability. The VADER algorithm uses the so-called compound score, that is calculated by adding the valence scores of all words in the lexicon, adjusting them according to the given rules of the algorithm, and then normalizes the value to fall between −1 (the most extreme negative value) and +1 (the most extreme positive value). It is a useful metric if we seek a single unidimensional assessment of a sentence’s emotion. Thus, we categorize the tweets with the compound score into five categories:
Very positive ‘5’—(0.55–1.00)
Positive ‘4’—(0.10–0.55)
Neutral ‘3’—(−0.10–0.10)
Negative ‘2’—(−0.55–0.10)
Very negative ‘1’—(−1.00–0.55)
This does not propose that all the tweets with the sentiment value of 0.1 and −0.1 are neutral; however, we could reduce the number of neutral tweets using this categorization.
3.6. Spatiotemporal Data Processing and Clustering
To understand the escalation of protests based on social media activity, we also performed spatiotemporal analysis using the tweets. Most of the tweets in our query results were posted from European countries; therefore, to keep the analysis concise we only considered countries from Europe, including Russia and Turkey. We kept the data aggregated at country level, as language and the political characteristics of a country might influence the tweeting behavior stronger than other characteristics at city level or other finer spatial scales. Furthermore, most of the time (except in Slovakia) the protests were held only in the capital.
Once the tweets were pre-processed and filtered (see
Section 3.1 and
Section 3.2) we performed clustering to find countries with similar tweeting trends about Kuciak’s murder, which would probably also indicate when protests took place or the presence of other influencing parameters such the media or politics. For this purpose, we used Time Series Clustering in ArcGIS Pro 2.8, where time series data can be clustered based on three criteria: having similar values across time, tending to increase and decrease at the same time, or having similar repeating patterns. By identifying countries with similar pattern, we might be able to reveal the influencing parameters and how these parameters changed over time. Moreover, it provides a more concise and informative visualization and interpretation of the result than statistical values for 39 countries one by one.
For our analysis, we performed clustering based on the number of tweets over time for each country, to track the tweeting activity of the citizens in general. This means that we considered the second type of clusters (where values tend to increase and decrease at the same time but their absolute value is less relevant). For example, a time series with values (1, 0, 1, 0, 1) is more similar to a time series with values (10, 0, 10, 0, 10) than it is to a time series with values (1, 1, 1, 1, 1) because the values increase and decrease at the same time and stay in a consistent proportion. Therefore, we are able to avoid problems related to different population sizes and no normalization based on the population is needed for the clustering.
3.7. Topic Modeling Using Latent Dirichlet Allocation (LDA) Method
3.7.1. Preparing Steps for Topic Modeling
The first step of topic modeling is tokenization, which is a technique for segmenting texts into smaller units. This algorithm divides the text at each space character to generate a list of separate tokens (unique words, numbers, and signs). We used the Gensim library’s simple pre-process function for this step, which iteratively converts tokens to Unicode strings, removing accent marks and lowercasing the string [
58]. Tokens shorter than three letters are discarded.
To filter out the most common bi- and trigrams (two and three-word expressions) from a stream of sentences we used the Gensim library. However, in order to set a proper filtering threshold, we first manually explored these multi-word expressions with the help of the scikit-learn CountVectorizer [
59], which converts the text to a matrix of token counts. Then, we set up the Gensim threshold to ignore those bi- and trigrams that bear well-known information such as the fact of the murder or the victim’s occupation or the location of the assassination (e.g., “journalist jan”, “murder of”, “in slovakia”, “the murder of”, “of journalist jan”) for each cluster identified in the spatiotemporal analysis.
3.7.2. Lemmatization and Vectorization
The aim of this step is to reduce inflectional and derivationally related forms of a word to a common base form similarly to a stemming approach. However, in the case of lemmatization, the part of speech of a word (POS tag) such as symbols, numbers or verbs should be first determined and the normalization rules will be different for the different parts of speech thus it is lexically more sophisticated. This method also involves the grouping of the inflected forms of each word, identified by the word’s lemma, or dictionary form (for instance, “better” is lemmatized as “good”, “cars” as “car”), so they can be analyzed as a single item, thus enhancing the significance of the topic–word associations [
60]. For lemmatizing, we use the spaCy Lemmatizer [
60] that provides a rule-based lemmatization with the setting to allow only proper nouns, verbs, and nouns related to our LDA corpus because our research is concentrating on topics that primarily answer the question of who did what and where. It shall be noted that in an earlier step (see
Section 3.5.1) we already removed stop words (e.g., auxiliary verbs), which increased the speed and accuracy of the sentiment analysis; however, this step is not necessary for topic modeling since the spaCy Lemmatizer is effectively capable to filter out certain POS tags, such as auxiliary verbs.
As a final step, the text corpus has to be converted into a vector format because LDA requires a document-word-count matrix and a word dictionary to create a “bag-of-words” corpus, i.e., a collection of words without information on the proper syntax.
3.7.3. Performing the LDA Topic Modeling
For topic modeling, we used LDA with the Gensim library on the final set of geolocated tweets in Python [
61]. To date, there is no generally established a priori parameter modeling approach for LDA. In order to find the most suitable parameters, the alpha, beta and the number of topics extractable from the dataset, we apply hyperparameter optimization that seeks after the best setting in a validation corpus set (75%). We used the topic coherence measure (C_v) for performance comparison, which is considered to have the strongest correlations with human ratings [
62]. The value of C_v combines an indirect confirmation measure that uses normalized pointwise mutual information (NPMI), cosine similarity, a Boolean sliding window, and the one-set segmentation of the top words. We have applied this optimization approach to all clusters identified in the spatiotemporal analysis. Our hyperparameter optimization returned with the following parameter settings:
All cluster: α = symmetric, β = 0.91, and number_of_topics = 8.
Cluster 1 = α = 0.31, β = symmetric, and number_of_topics = 8.
Cluster 5 = α = 0.01, β = 0.91, and number_of_topics = 7.
The similar hyperparameter settings indicate that the corpus generally follows symmetric distribution in which the lower alpha indicates fewer topics, while the high beta represents increased topic-word density consequently the discussion revolved around a few themes. Finally, the tweets were classified according to the topic that produced the highest probability; then, we generated the 10 most frequent keywords for each topic. Keywords, however, sometimes are not able to make proper sense about the discussed topic, to overcome this limitation we also assigned the most representative tweet assigned to each topic (see
Section 4.4).
4. Results
4.1. General Spatial and Temporal Characteristics of the Tweets (RQ1)
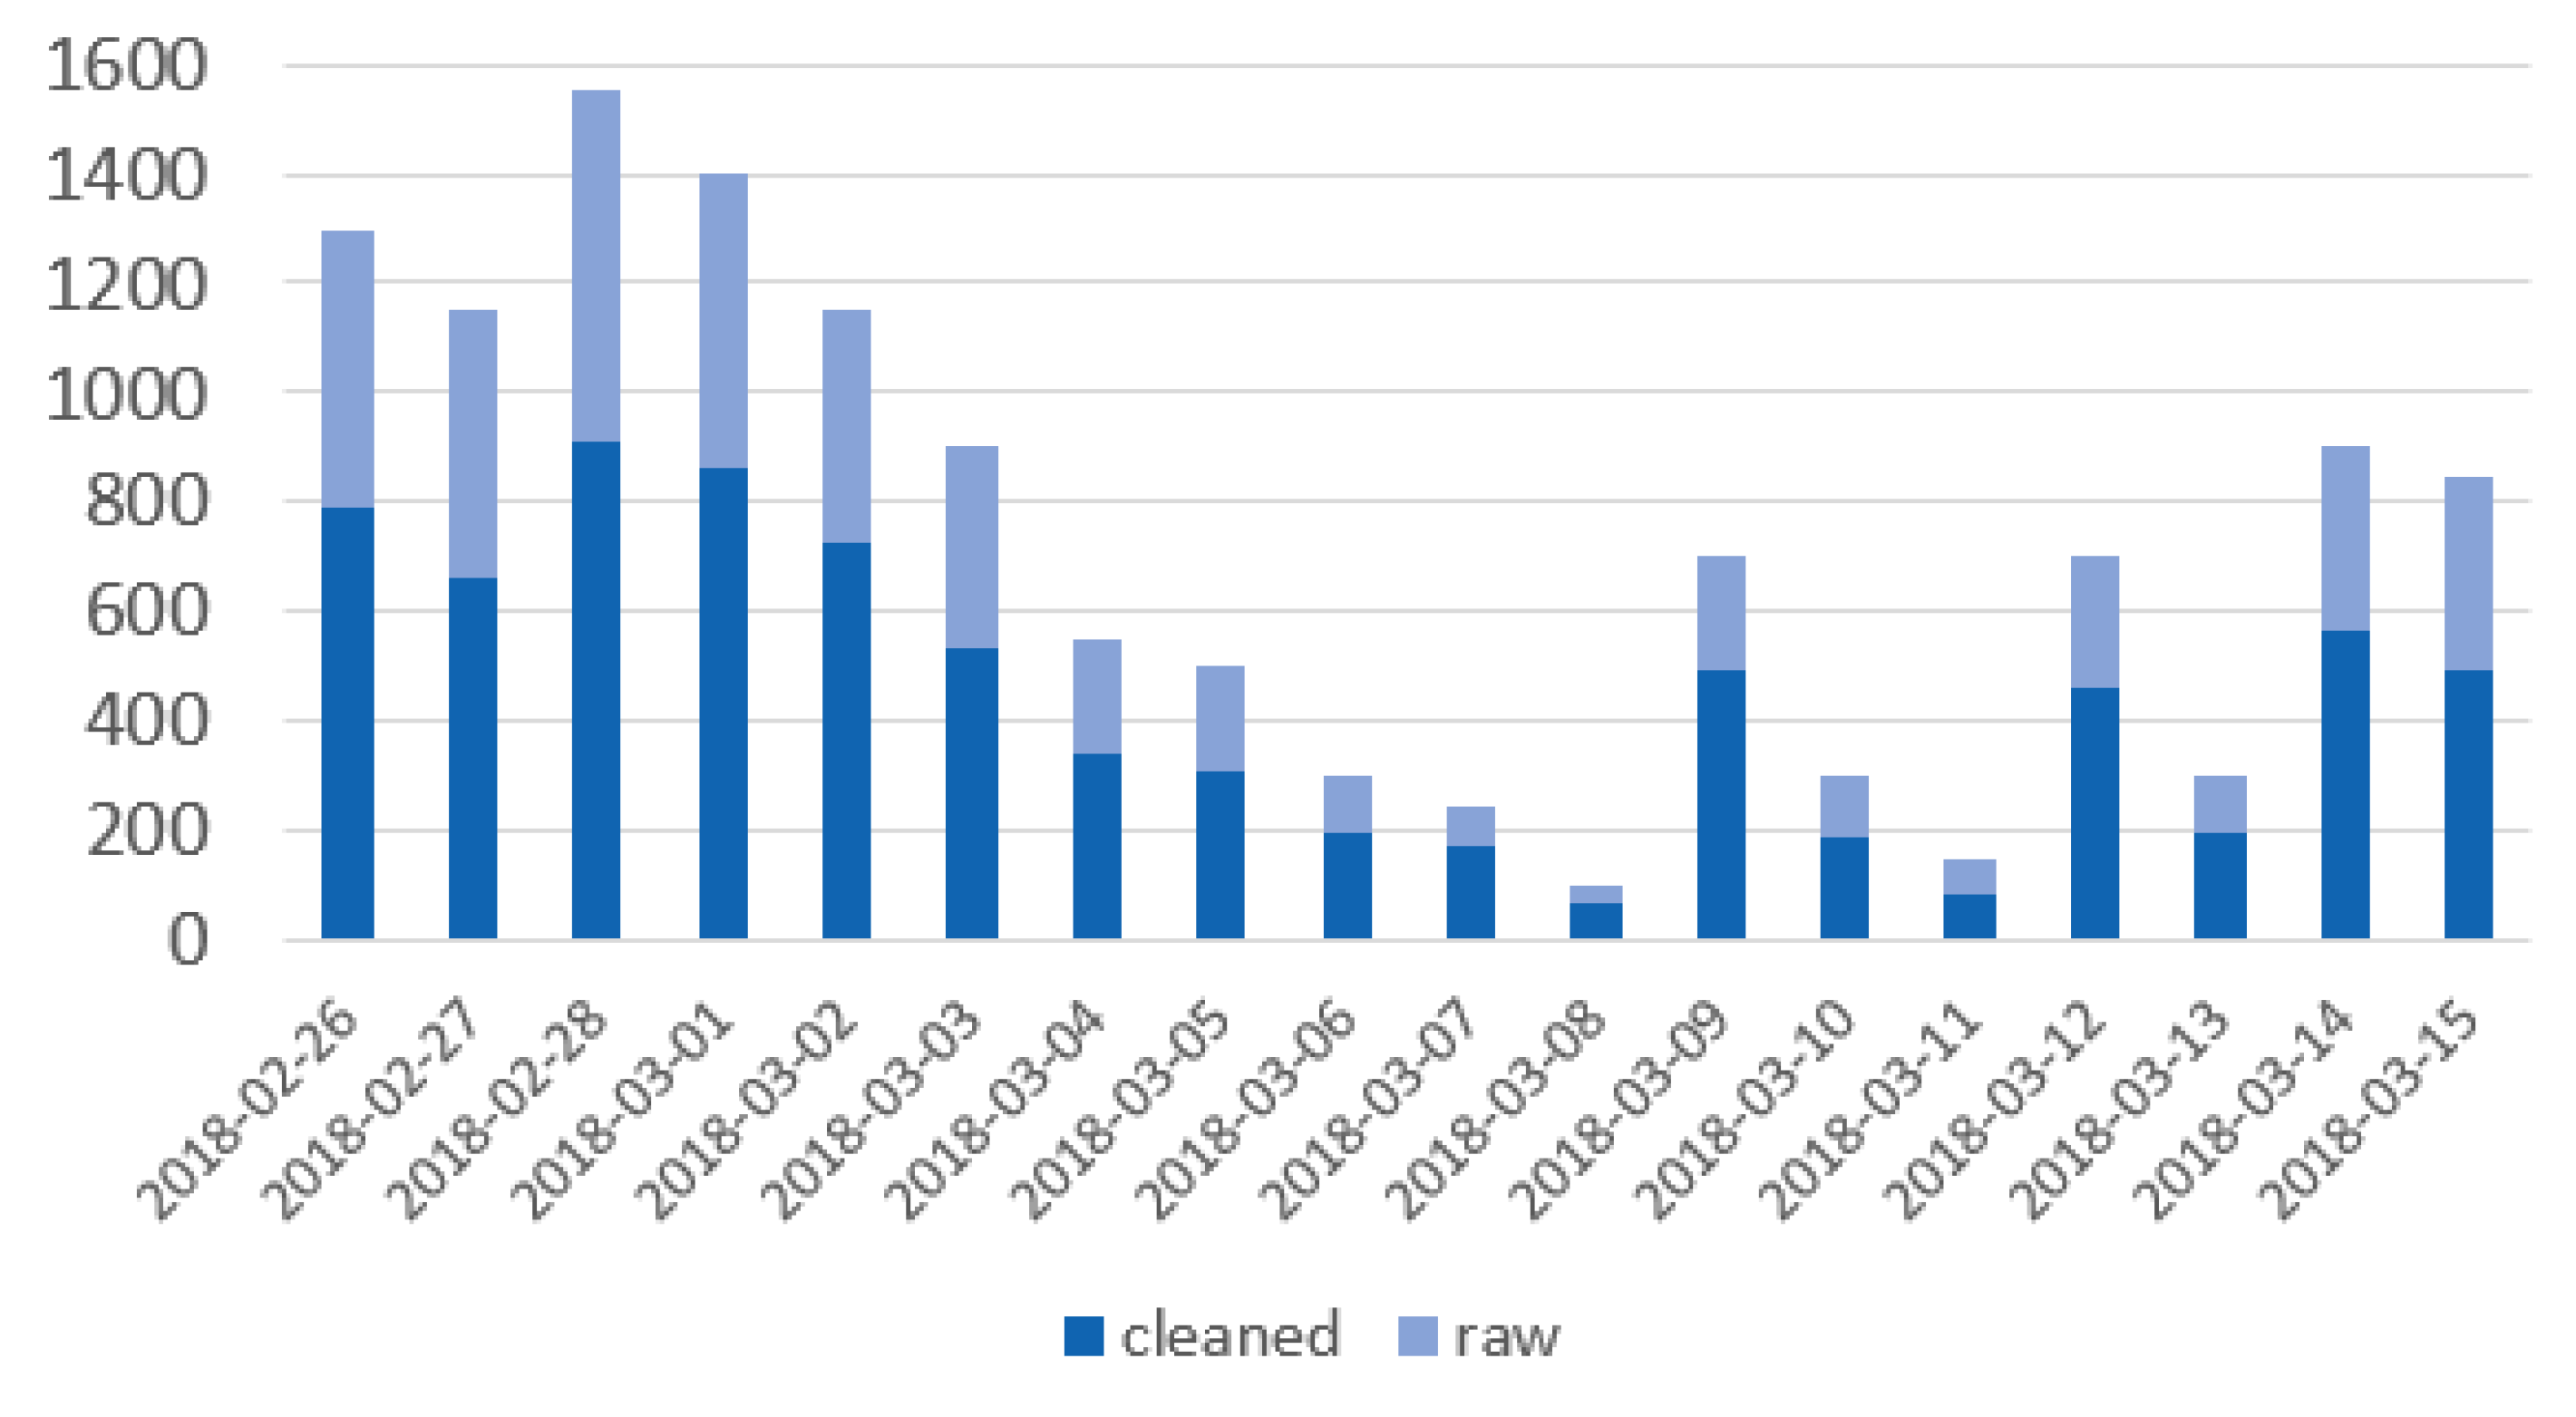
After performing the pre-processing steps, we had a dataset of over 8000 tweets.
Figure 3 shows how tweet counts varied daily in our analysis period for European countries. The most significant peak was observable on 28 February when Kuciak’s unfinished work was published about the connections of the Italian mafia and Slovakian politicians, whereas there are several smaller peaks from 9 March onwards. These most likely represent the main protest day (9 March) and the news around the resignation of the Minister of Interior and the PM in Slovakia (12 and 14 March).
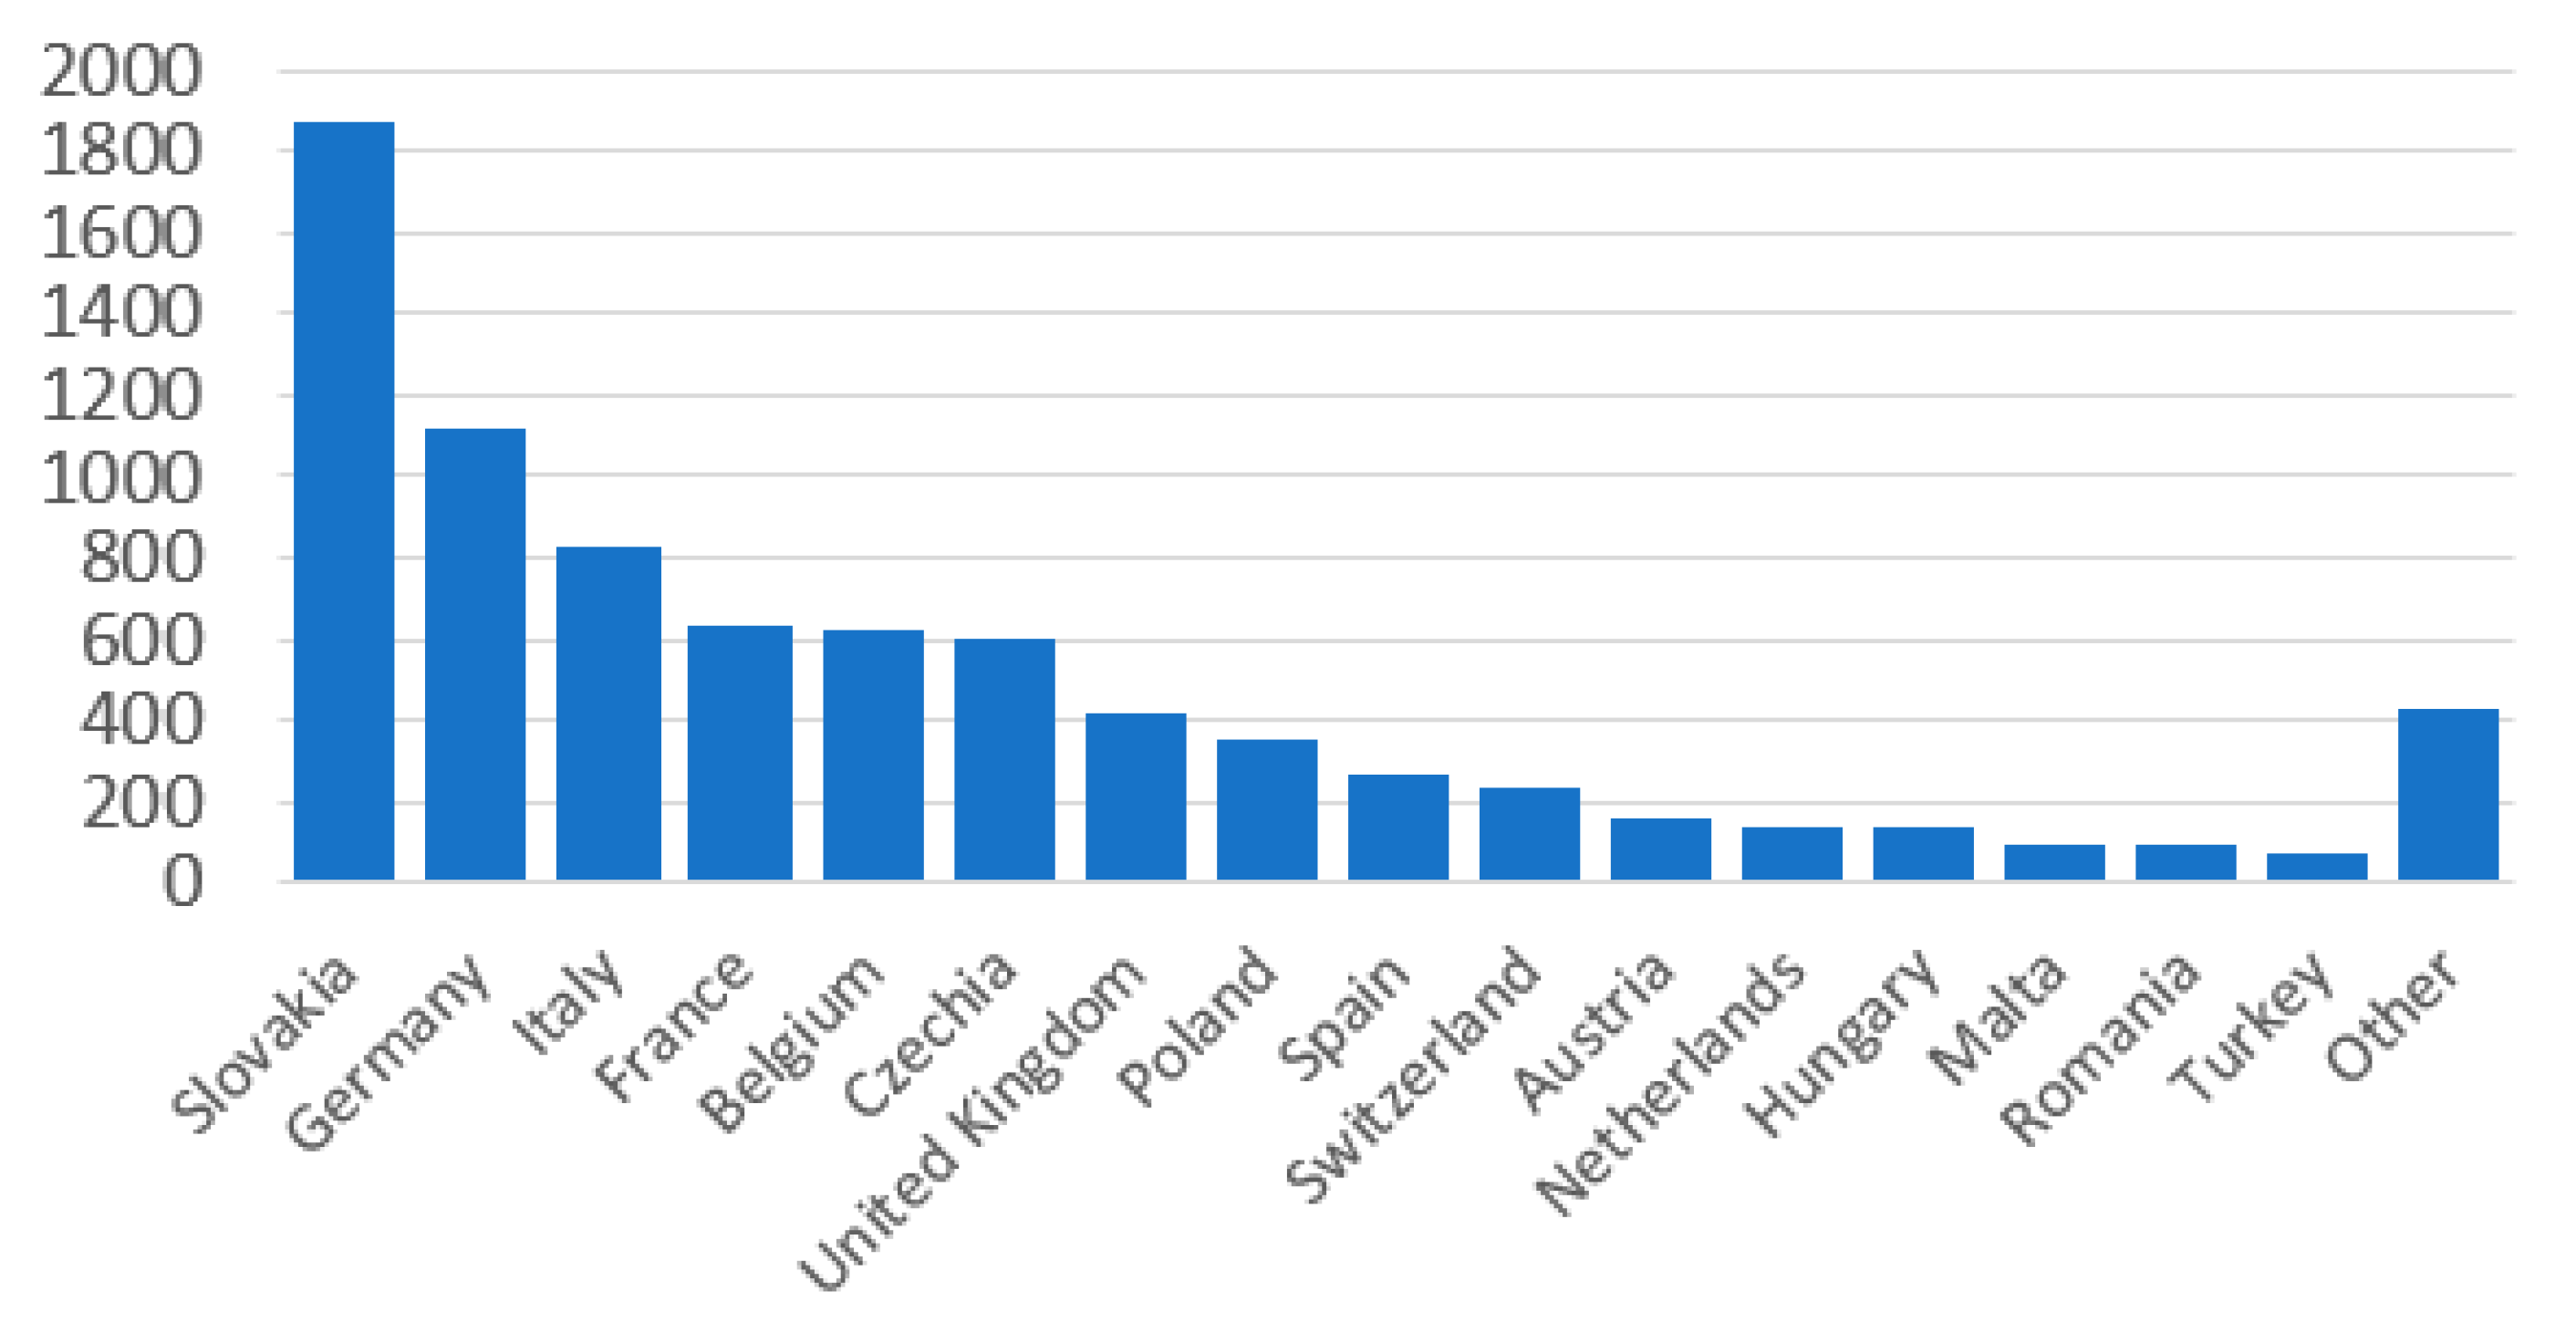
Figure 4 summarizes the absolute number of tweets per country. Users from Slovakia tweeted over 1800 times throughout the analysis period. The second most active country was Germany (ca. 1100), followed by Italy (around 800 tweets) and France (more than 500 tweets).
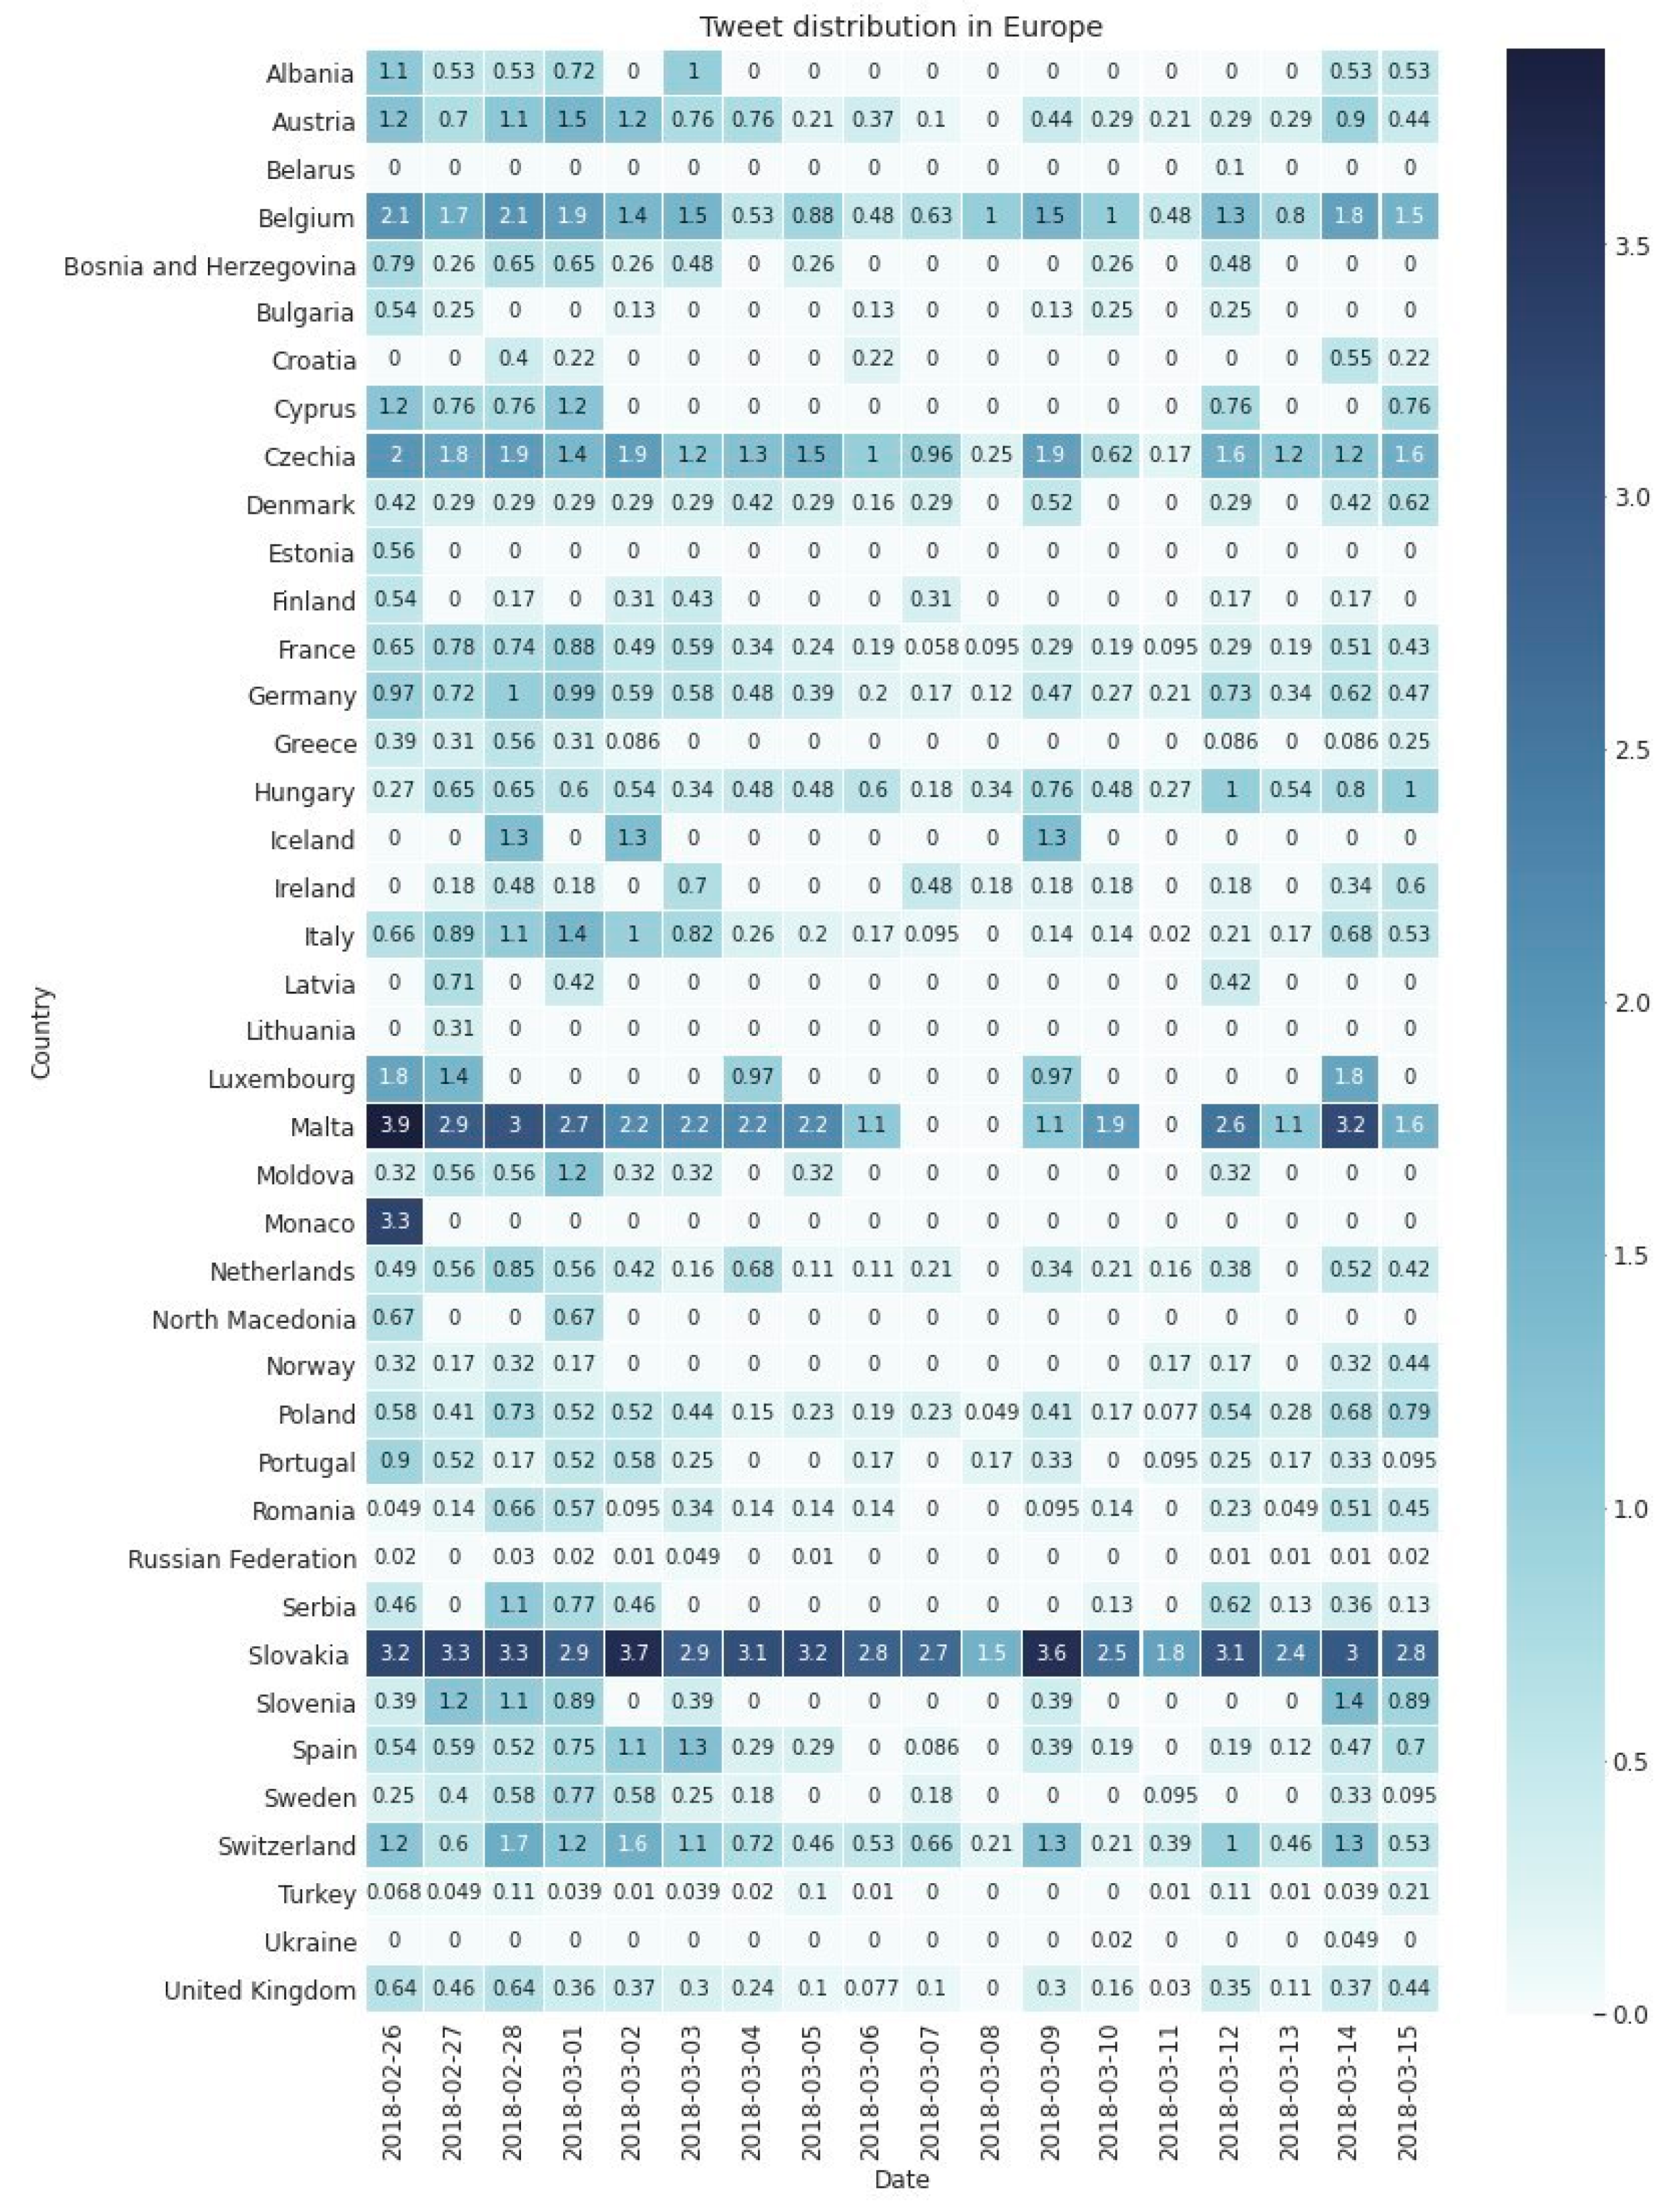
Of course, these countries also have large populations, so to exclude the influence of population sizes on the number of tweets,
Figure 5 visualizes also the daily distribution of tweets per country, normalized by their population to make countries more comparable. To calculate the normalized value on each day for a country we used the math.log1p() function in Python, which gives a reliable value also in the case of larger standard deviation and relatively small values.
There were eight countries, where there was continuous tweeting activity observable throughout the 18 days considered for our analysis: Belgium, Czechia, Germany, France, Hungary, Poland, Slovakia, and Switzerland. Czechia, Hungary, and Poland are neighboring countries with shared history in the past, so their interest in the topic can be easily explained. Users from Austria, as another neighboring country, also had high activity, except for the day of 8 March, where there was no related tweet posted. Germany, the United Kingdom, and France are big countries, and along with Belgium they represent strong political power in Europe or for the European Union, so this may also explain why they were also actively discussing the case. Malta, although being a small country and far away from Slovakia, also showed high interest in the topic, as a few months prior to the murder of Kuciak a journalist from Malta was also killed because of the investigations she was working on. The role of the Italian mafia was heavily discussed throughout the period due to the corruption among Slovakian politicians, so higher tweeting activity in Italy is also not surprising. The publisher of the journal that Kuciak was working for is in Switzerland, so this probably also explains the high interest there, most likely thanks to the media and news reports. Further statistics about the tweeting activity of users per country can be found in the
Supplementary materials.
4.2. Spatiotemporal Clustering (RQ1)
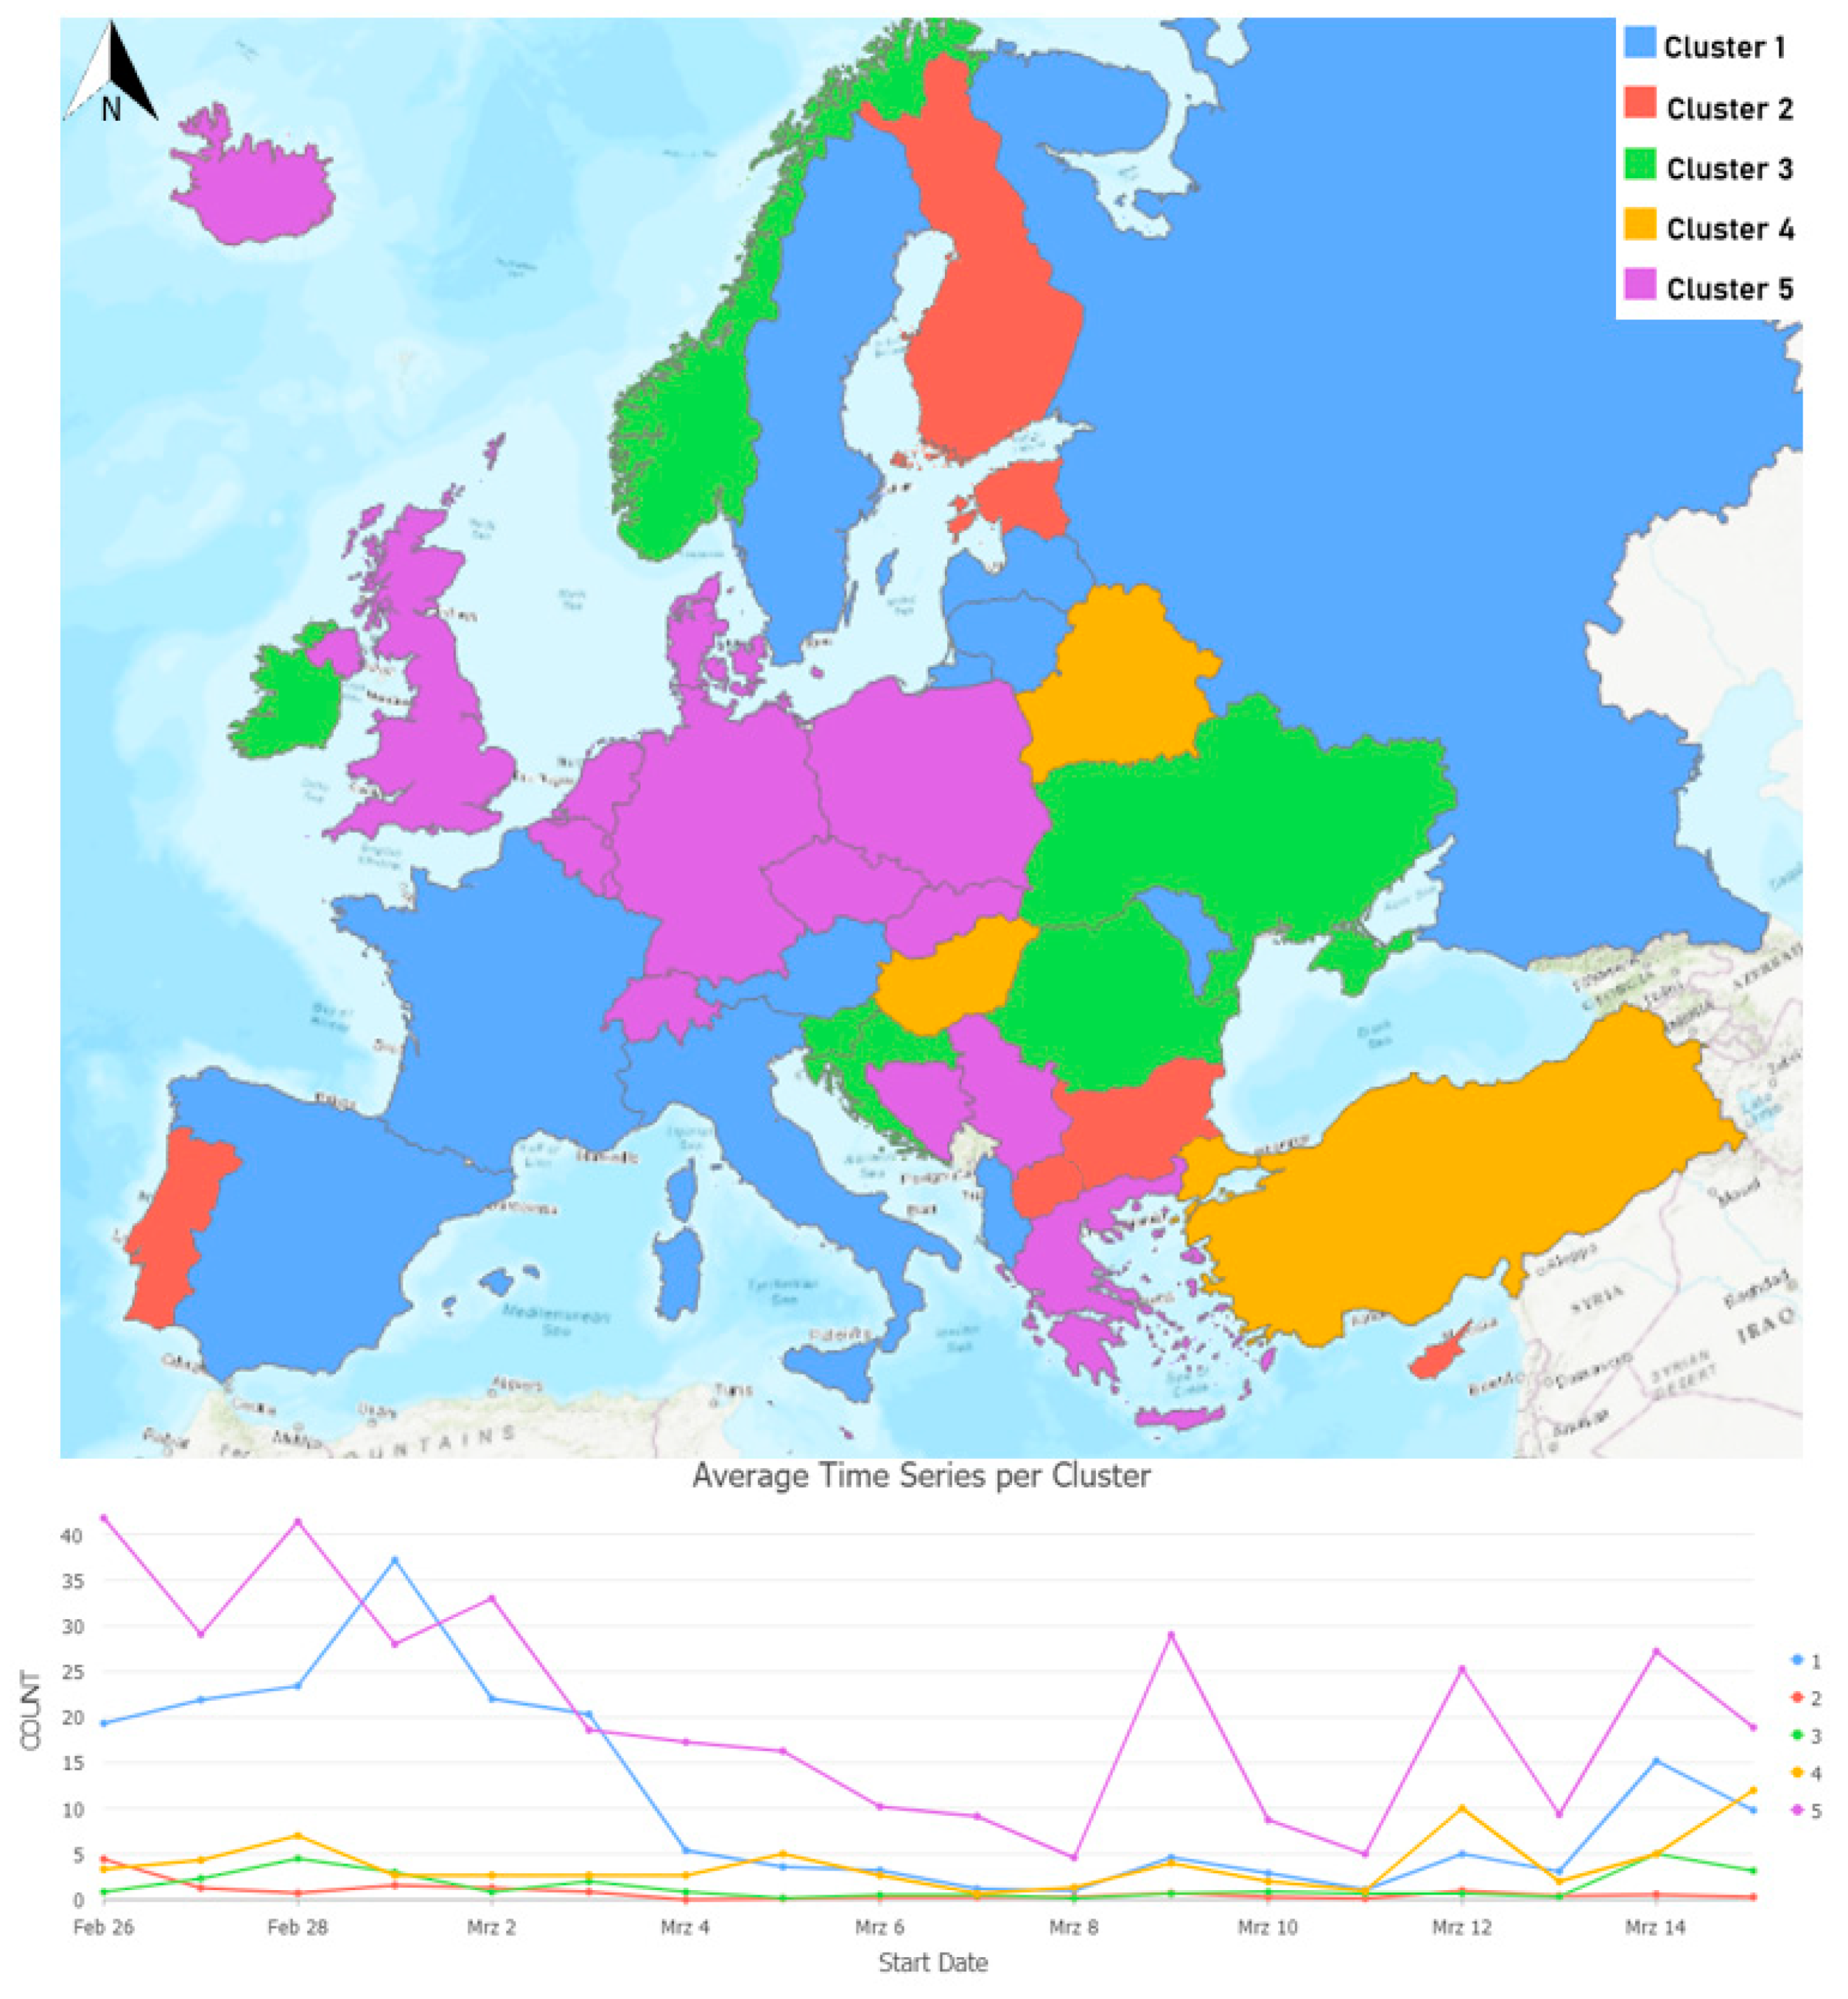
Figure 6 shows the results of the clustering based on the number of tweets per country and their dynamics over time. Whereas
Table 1 summarizes which countries belong to each cluster and the main characteristics of the time series. The first cluster (blue) contains countries where there was a high tweeting activity (peak: 1 March) in the first few days and a second, smaller peak at the end when PM Fico resigned (14 March). Italy is the country with the most tweets in this group, which is probably thanks to discussions about the responsibility of the Italian mafia in the murder and the corruption in Slovakia.
Users from the countries belonging to Cluster 2 (red) were the least active in terms of tweeting related to Kuciak’s murder. Tweeting activity in these countries remains low in the whole analysis period. Cluster 3 (green) has a similarly low activity level as Cluster 2, with two smaller peaks on 28 February and 14 March, which are the two most significant events related to the murder (see
Figure 1). Cluster 4 has only three countries and interestingly, there is no peak in the beginning when the murder and its motive were discovered. While 12 and 15 March are the peaks for these countries, that are more related to the resignation of the Prime Minister and other indirect influences of the murder or the journalist’s work. If we look at the topic modeling results of these countries, we can observe that there is a high chance that tweets discussing the murder and the following events might have a strong political narrative rooting in the political systems of the countries in this cluster. For more details on the interpretation of these topics, see
Section 4.4. Although the trend is clear, the absolute number of tweets is quite low (similarly to Cluster 3), which might also show that Twitter is not the most popular social media platform in these countries. Therefore, those who do use it, might be even less representative to the general population than in other countries, where significantly more tweets were harvested, potentially leading to a distortion of the results. Thus, in the more detailed analysis of the sentiment patterns and topic modeling we exclude these three clusters (Cluster 2–4) because they have not enough tweet for such in-depth analysis. On the contrary, Cluster 5 (purple) has the most tweets (over 5500), and is the group that Slovakia also belongs to. In this group, the highest peak was in the beginning, when the journalist was found dead and his unfinished work was discovered and published, then the activity slowly started to decrease, with the lowest number of tweets on 8 March, after which it starts to increase again and reach some secondary peaks on 9, 12, and 14 of March.
4.3. Temporal Patterns of the Sentiment Values per Cluster (RQ2 and RQ3)
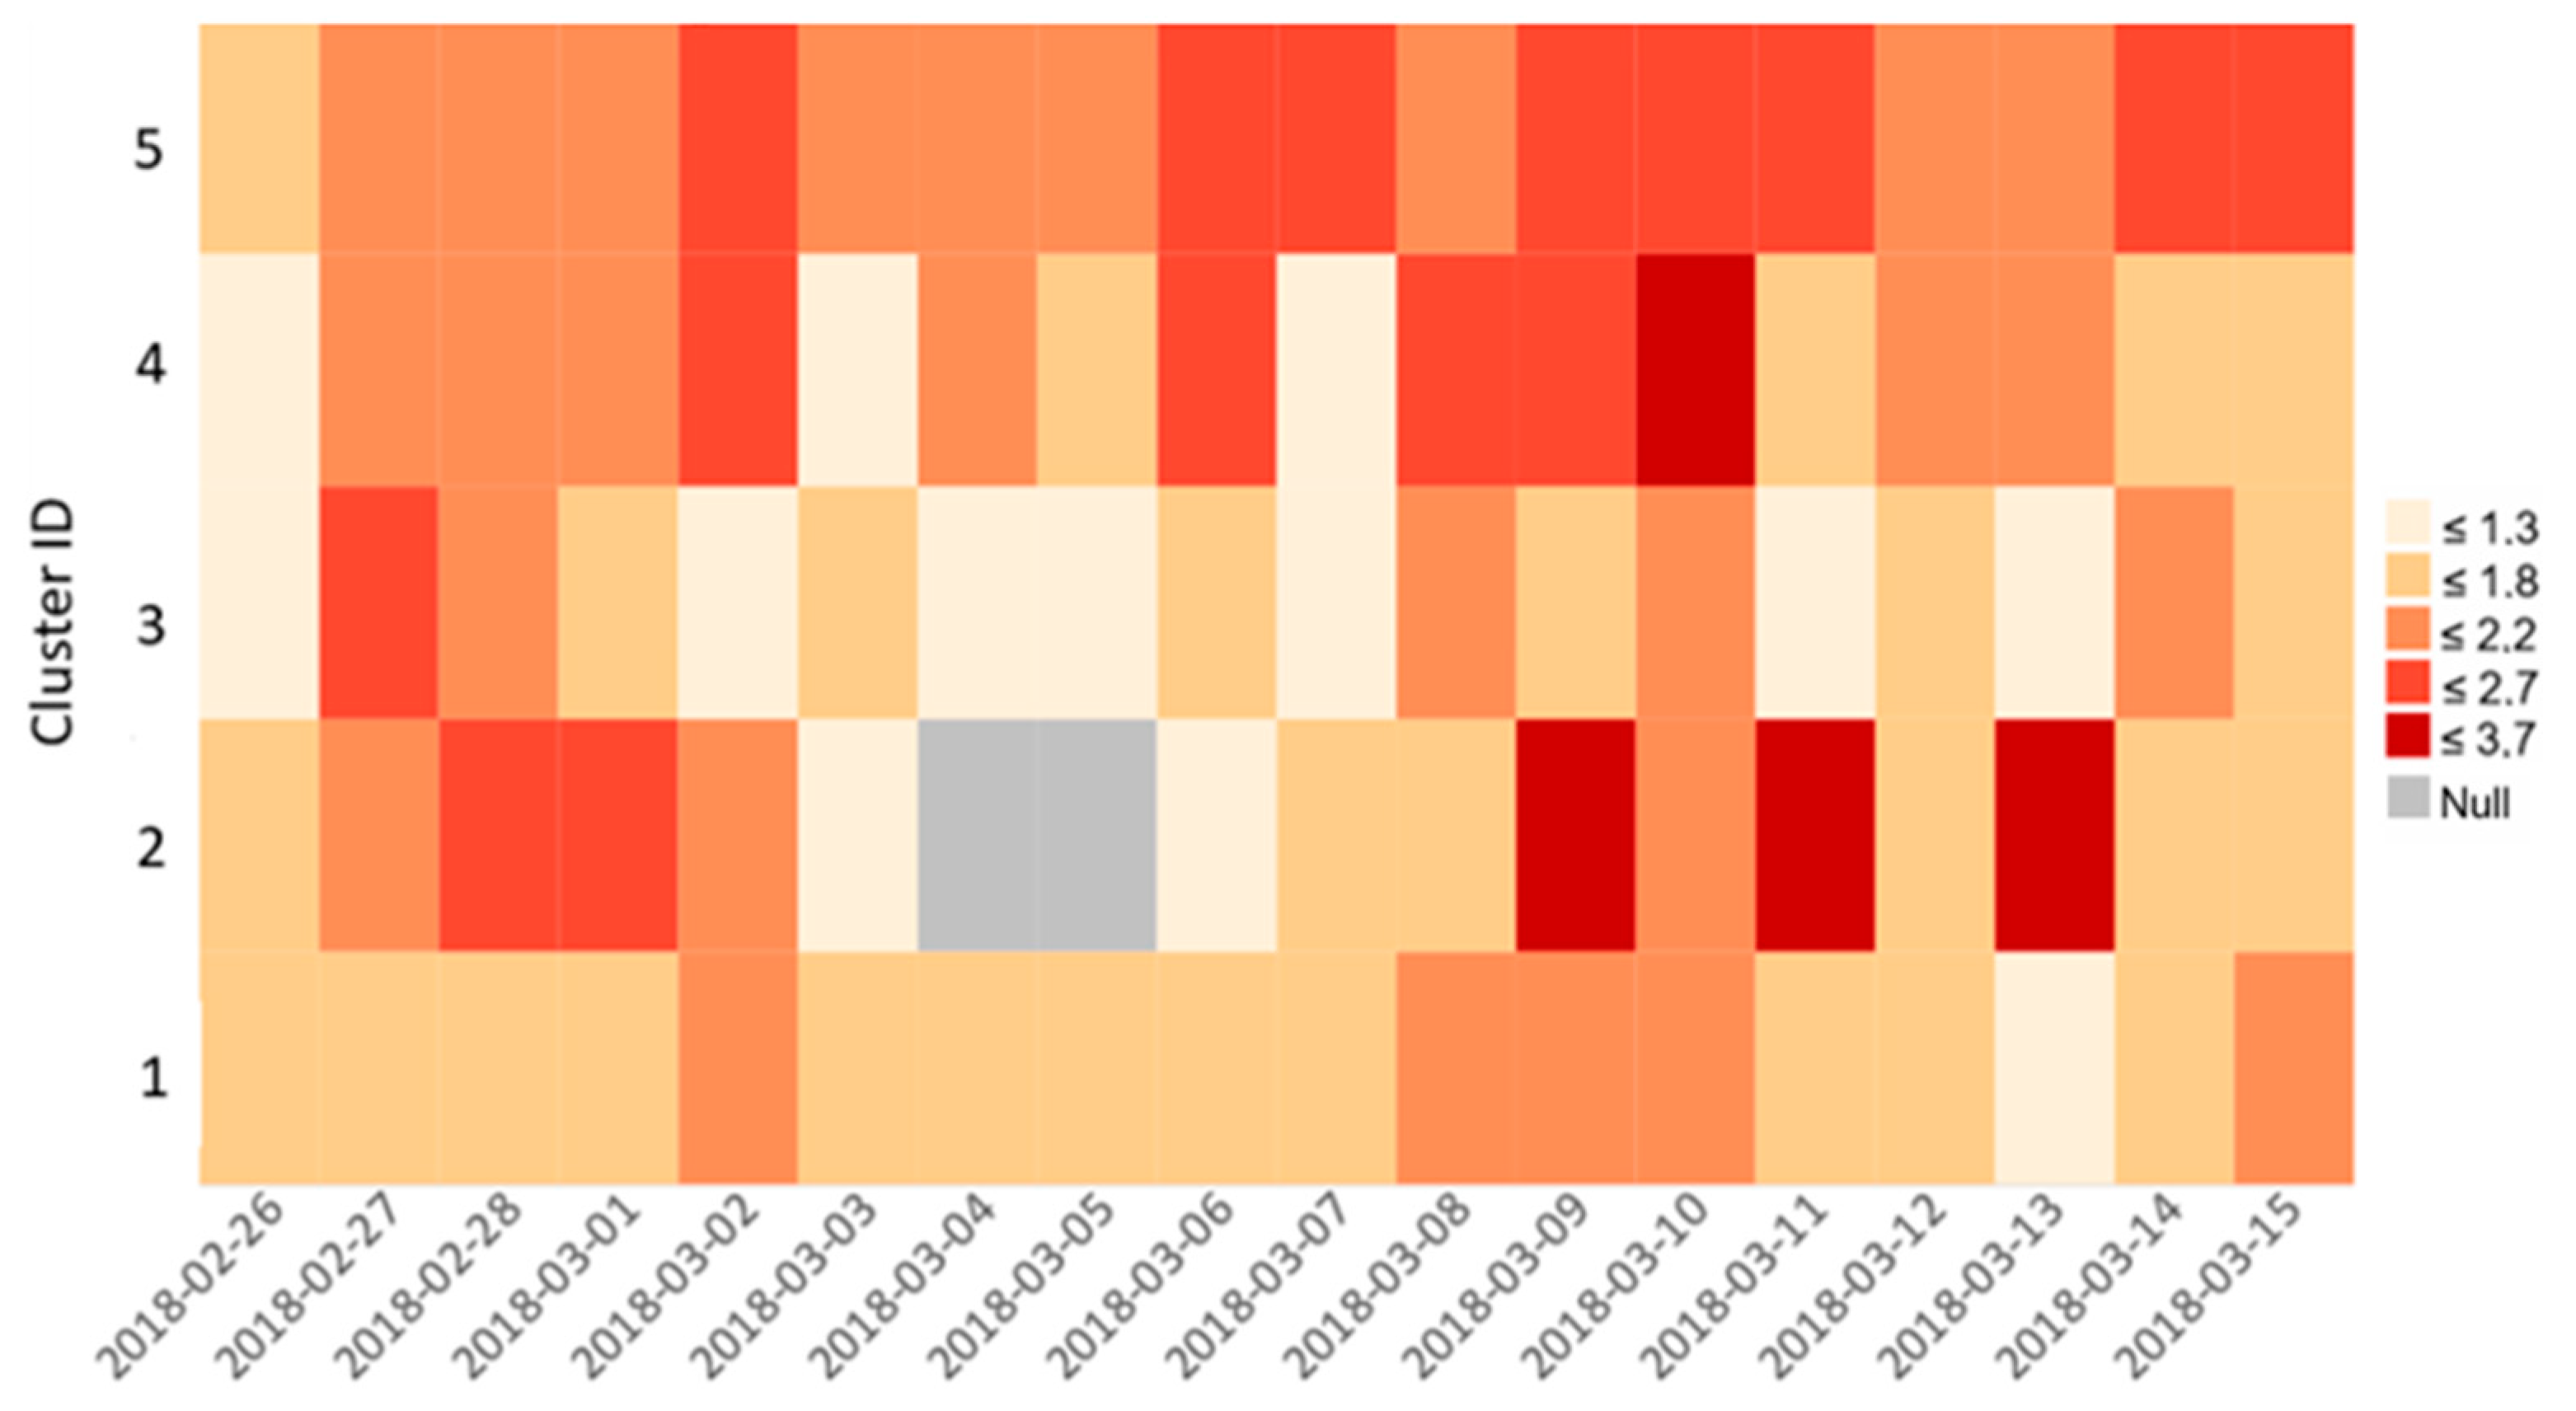
Figure 7 represents the daily mean sentiment values for each cluster calculated in
Section 3.5.2. The second half of the period (from March 6 on) is clearly more positive than the beginning. As Cluster 2–4 have only a few hundred tweets, we mainly focus on Cluster 1 and 5 in details (
Figure 8). Overall, Cluster 5 tends to be even more positive than Cluster 1.
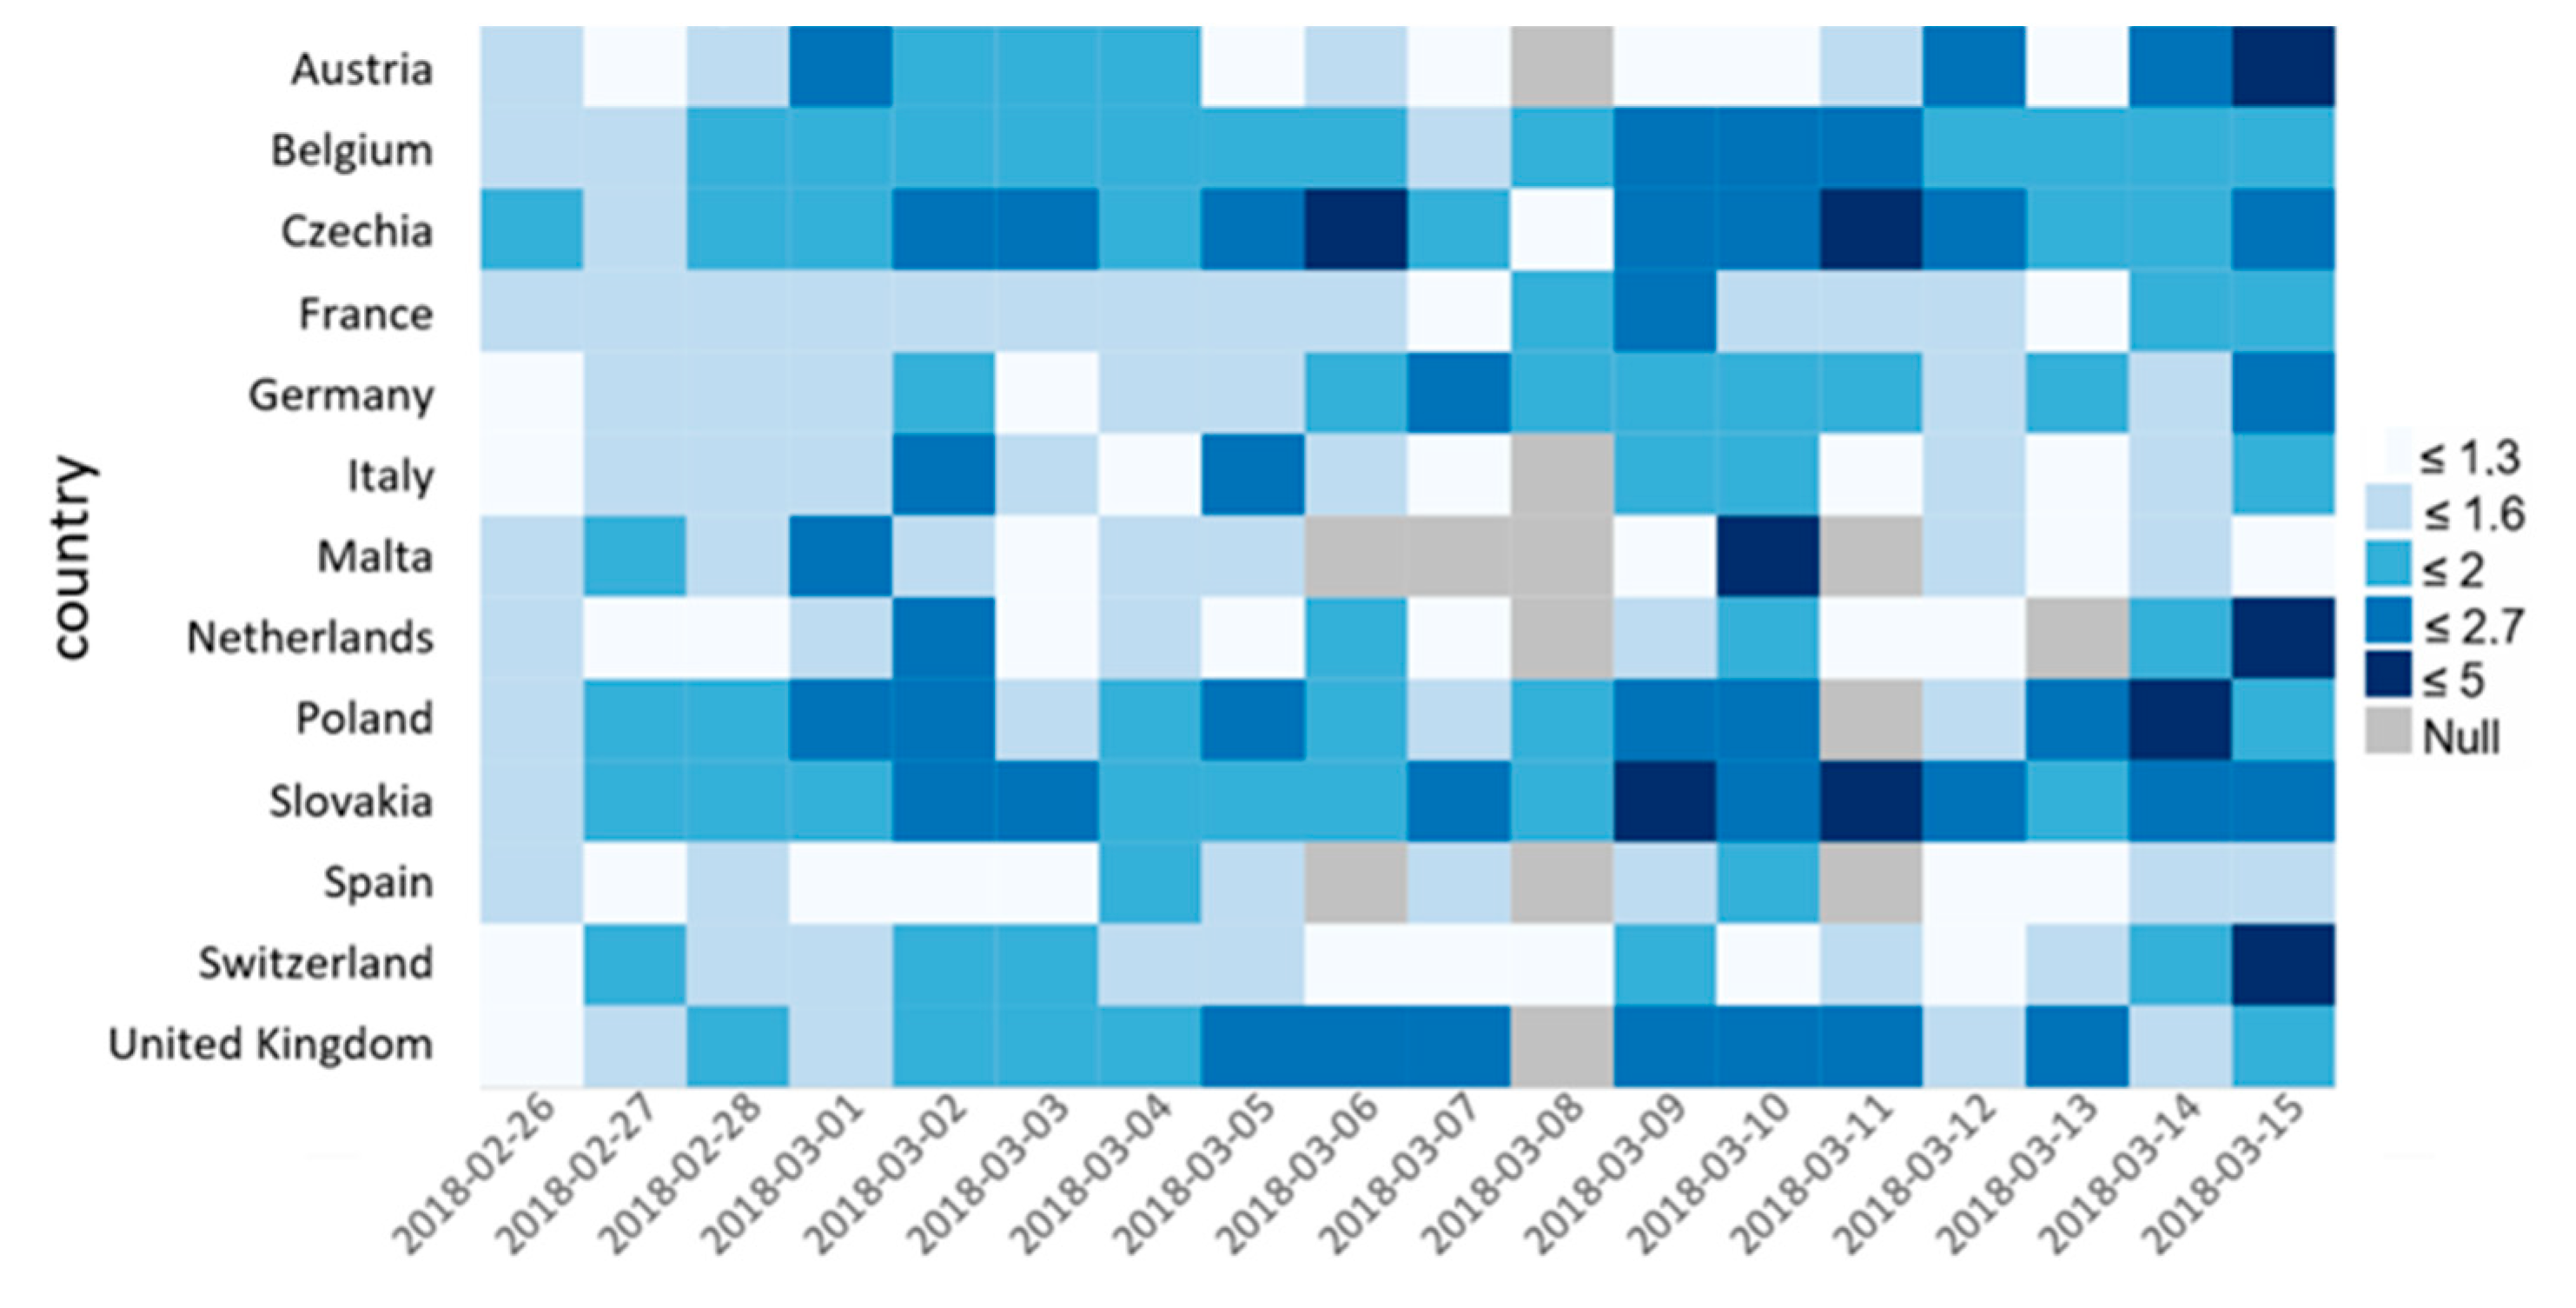
Figure 8 shows the country specific results, if we consider the mean compound score classes discussed in
Section 3.6, (ranging from 1 to 5, 5 being the most positive) for the countries in Cluster 1 and 5 and also exclude neutral tweets (class 3) to highlight the range of sentiments even more. The most positive category occurs after 6 March and interestingly Slovakia tends to be more positive in this period than any other country. By checking relevant tweets for these days, such as
“On friday, 9th March 2018 at 17:00 we will march again we demand a new and trustworthy government. Fico is over” and “finally, the president of slovakia has accepted the resignation of pm robertfico two weeks after the murder of a journalist, and elections are expected to choose a new government”
We can conclude that this most of the people supported the claims considering the connections between the government and the mafia and they were satisfied with the political consequences, such as the resignation of the PM.
Additionally, if we check statistical significance for these trends using the original calculated compound score (before applying sentiment classes), we found that among the countries, where there was at least one tweet each day in the analysis period, Slovakia and Germany has this increasing trend also statistically verified. (Germany 95% confidence level, whereas Slovakia was 99%).
4.4. Result of the Topic Modeling per Cluster (RQ2 and RQ3)
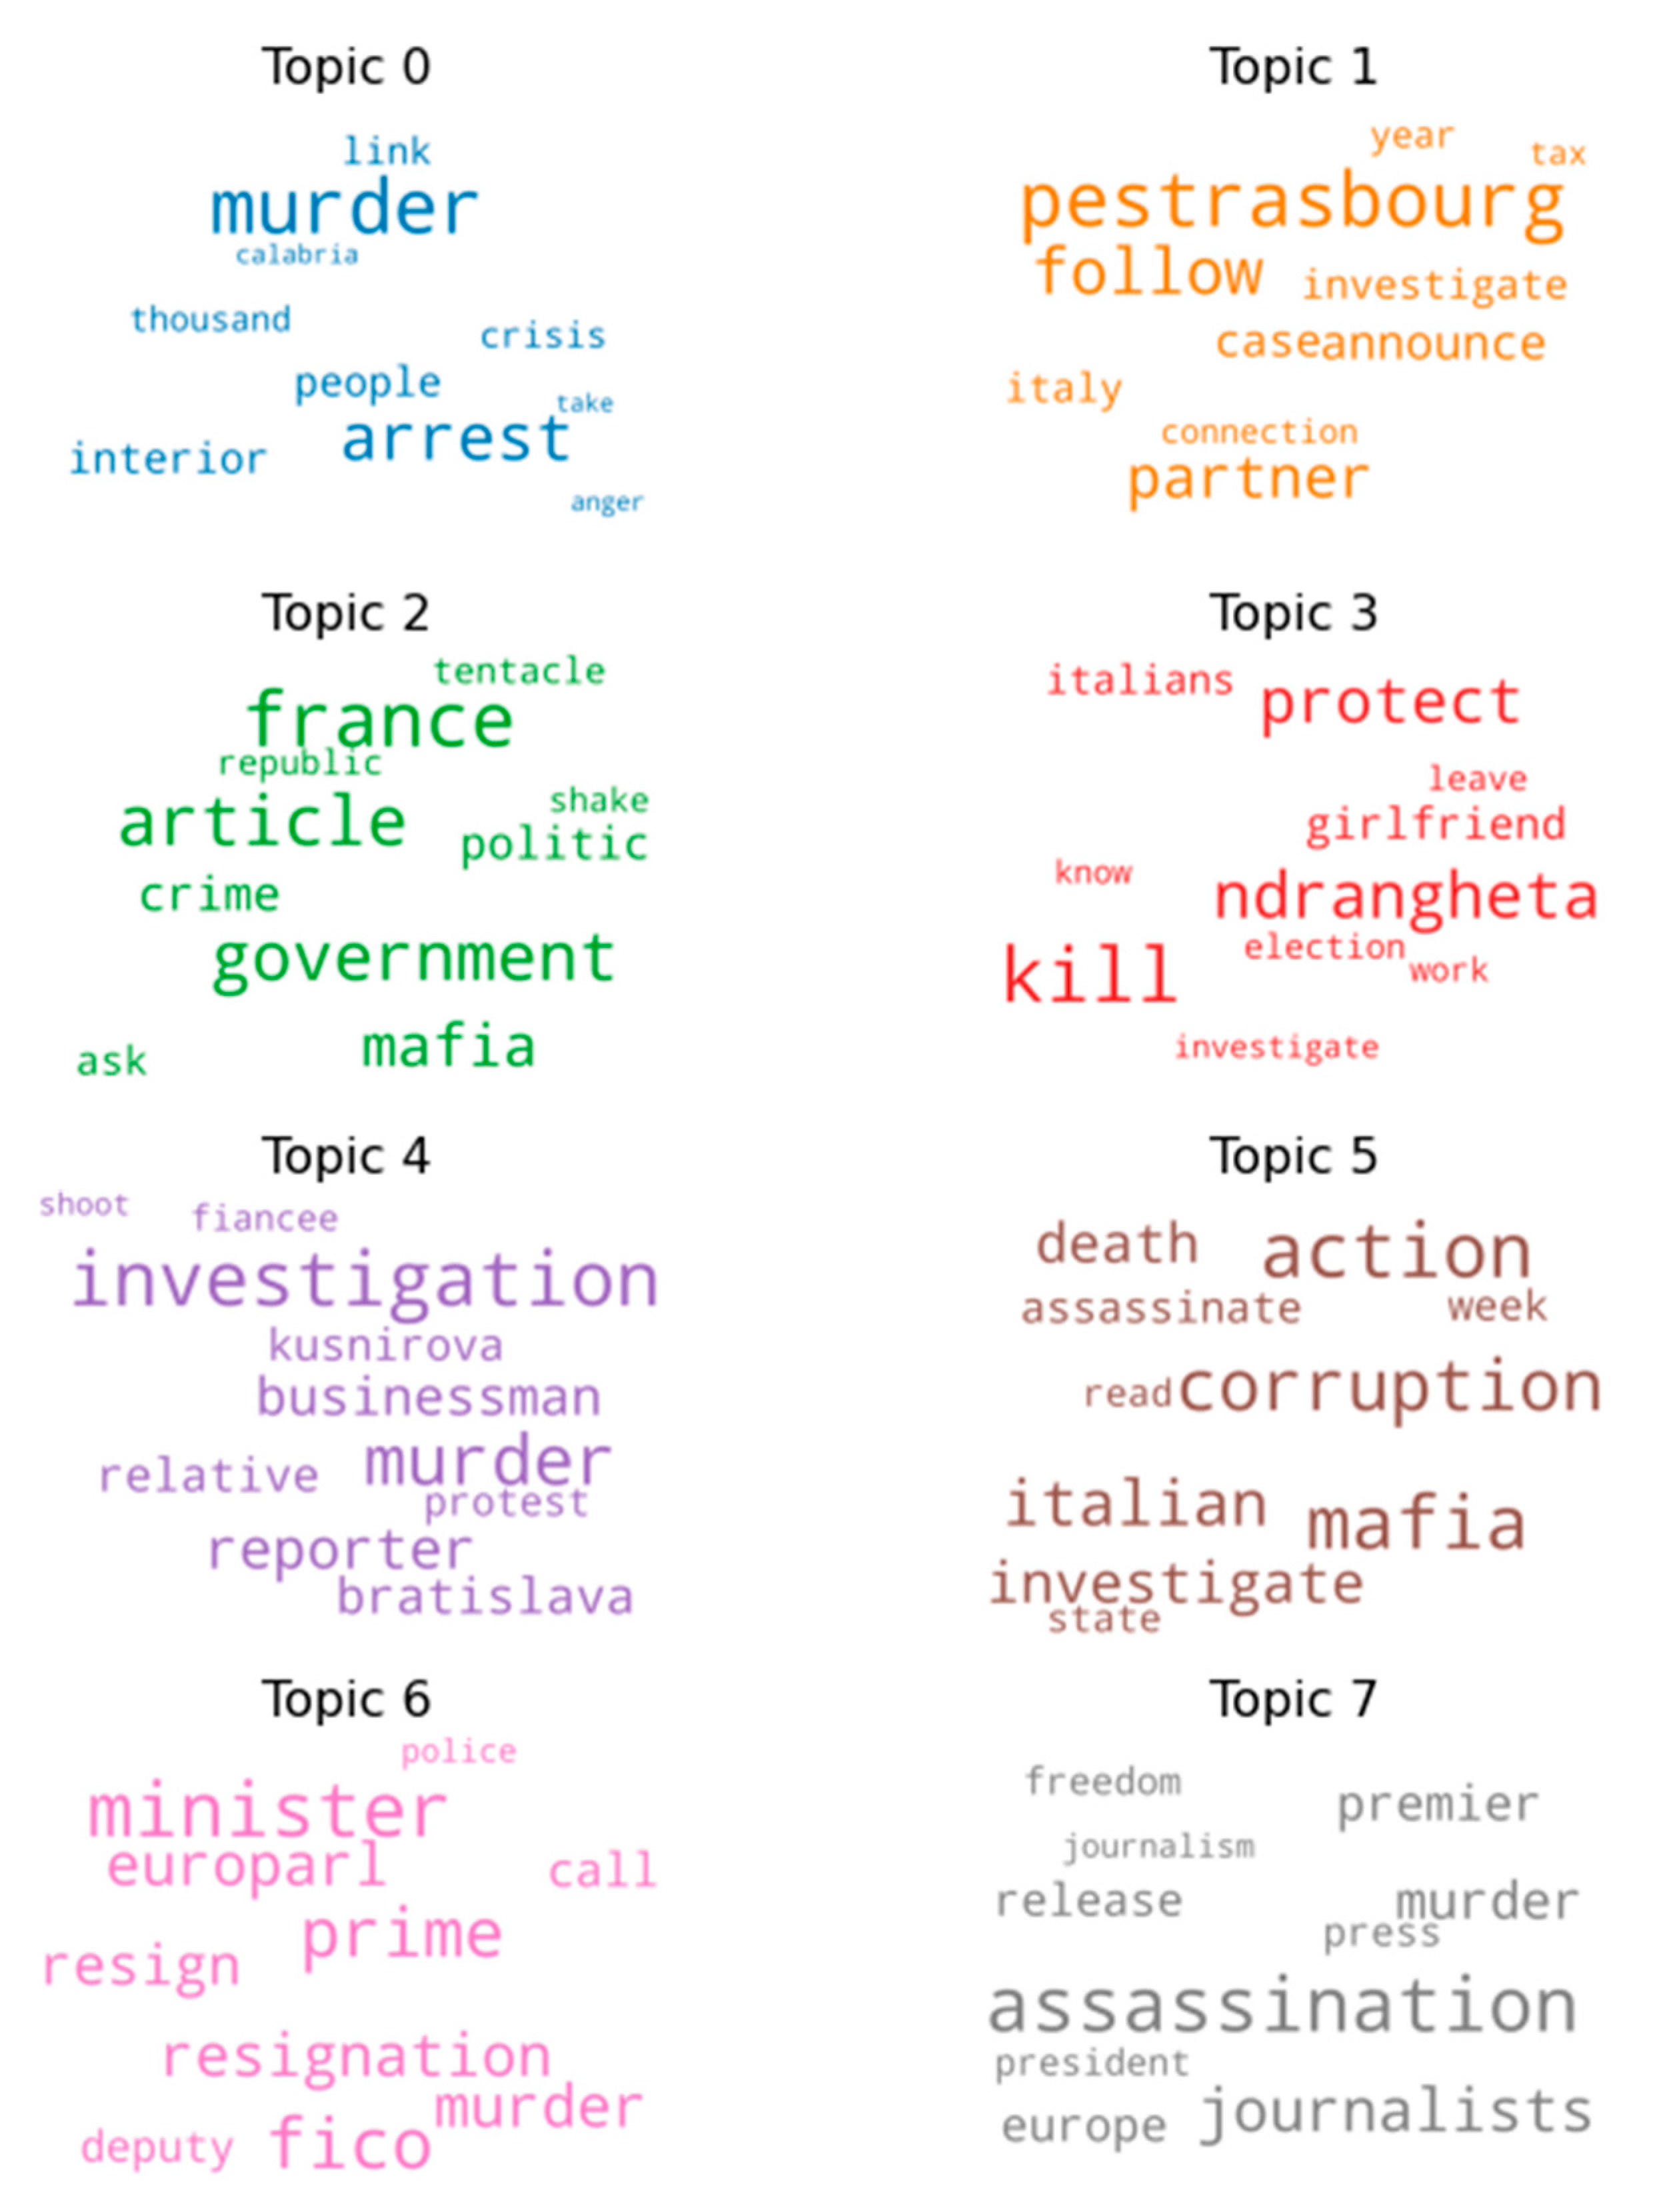
Figure 9 shows the eight most significant topics identified based on the tweets in Cluster 1. The topics touch upon the events and news related to the peaks, such as the resignation of the PM, the Italian mafia, or the role of the European Union. Overall, the most significant topic was identified in tweets that condemn the murder, they are followed by worrying voices about press freedom and security. The third most discussed topic in Europe was Kuciak’s article, which was published after his death on February 28 in English and Slovakian, followed by in other languages later on (e.g., in French). The article revealed several connections between the Slovakian governing elite and organized crime. Remaining topics discuss further findings of Kuciak’s article (i.e., “Ndrangheta mafia in Slovakia, and the European echoes of the event”).
Table 2 shows the contribution of each topic in percentages, which represents how likely it is that the representative tweet of that topic was discussing that topic or included those keywords. Values around 0.7 (70%) means that there is a 30% chance that the tweet discussed other topic than this.
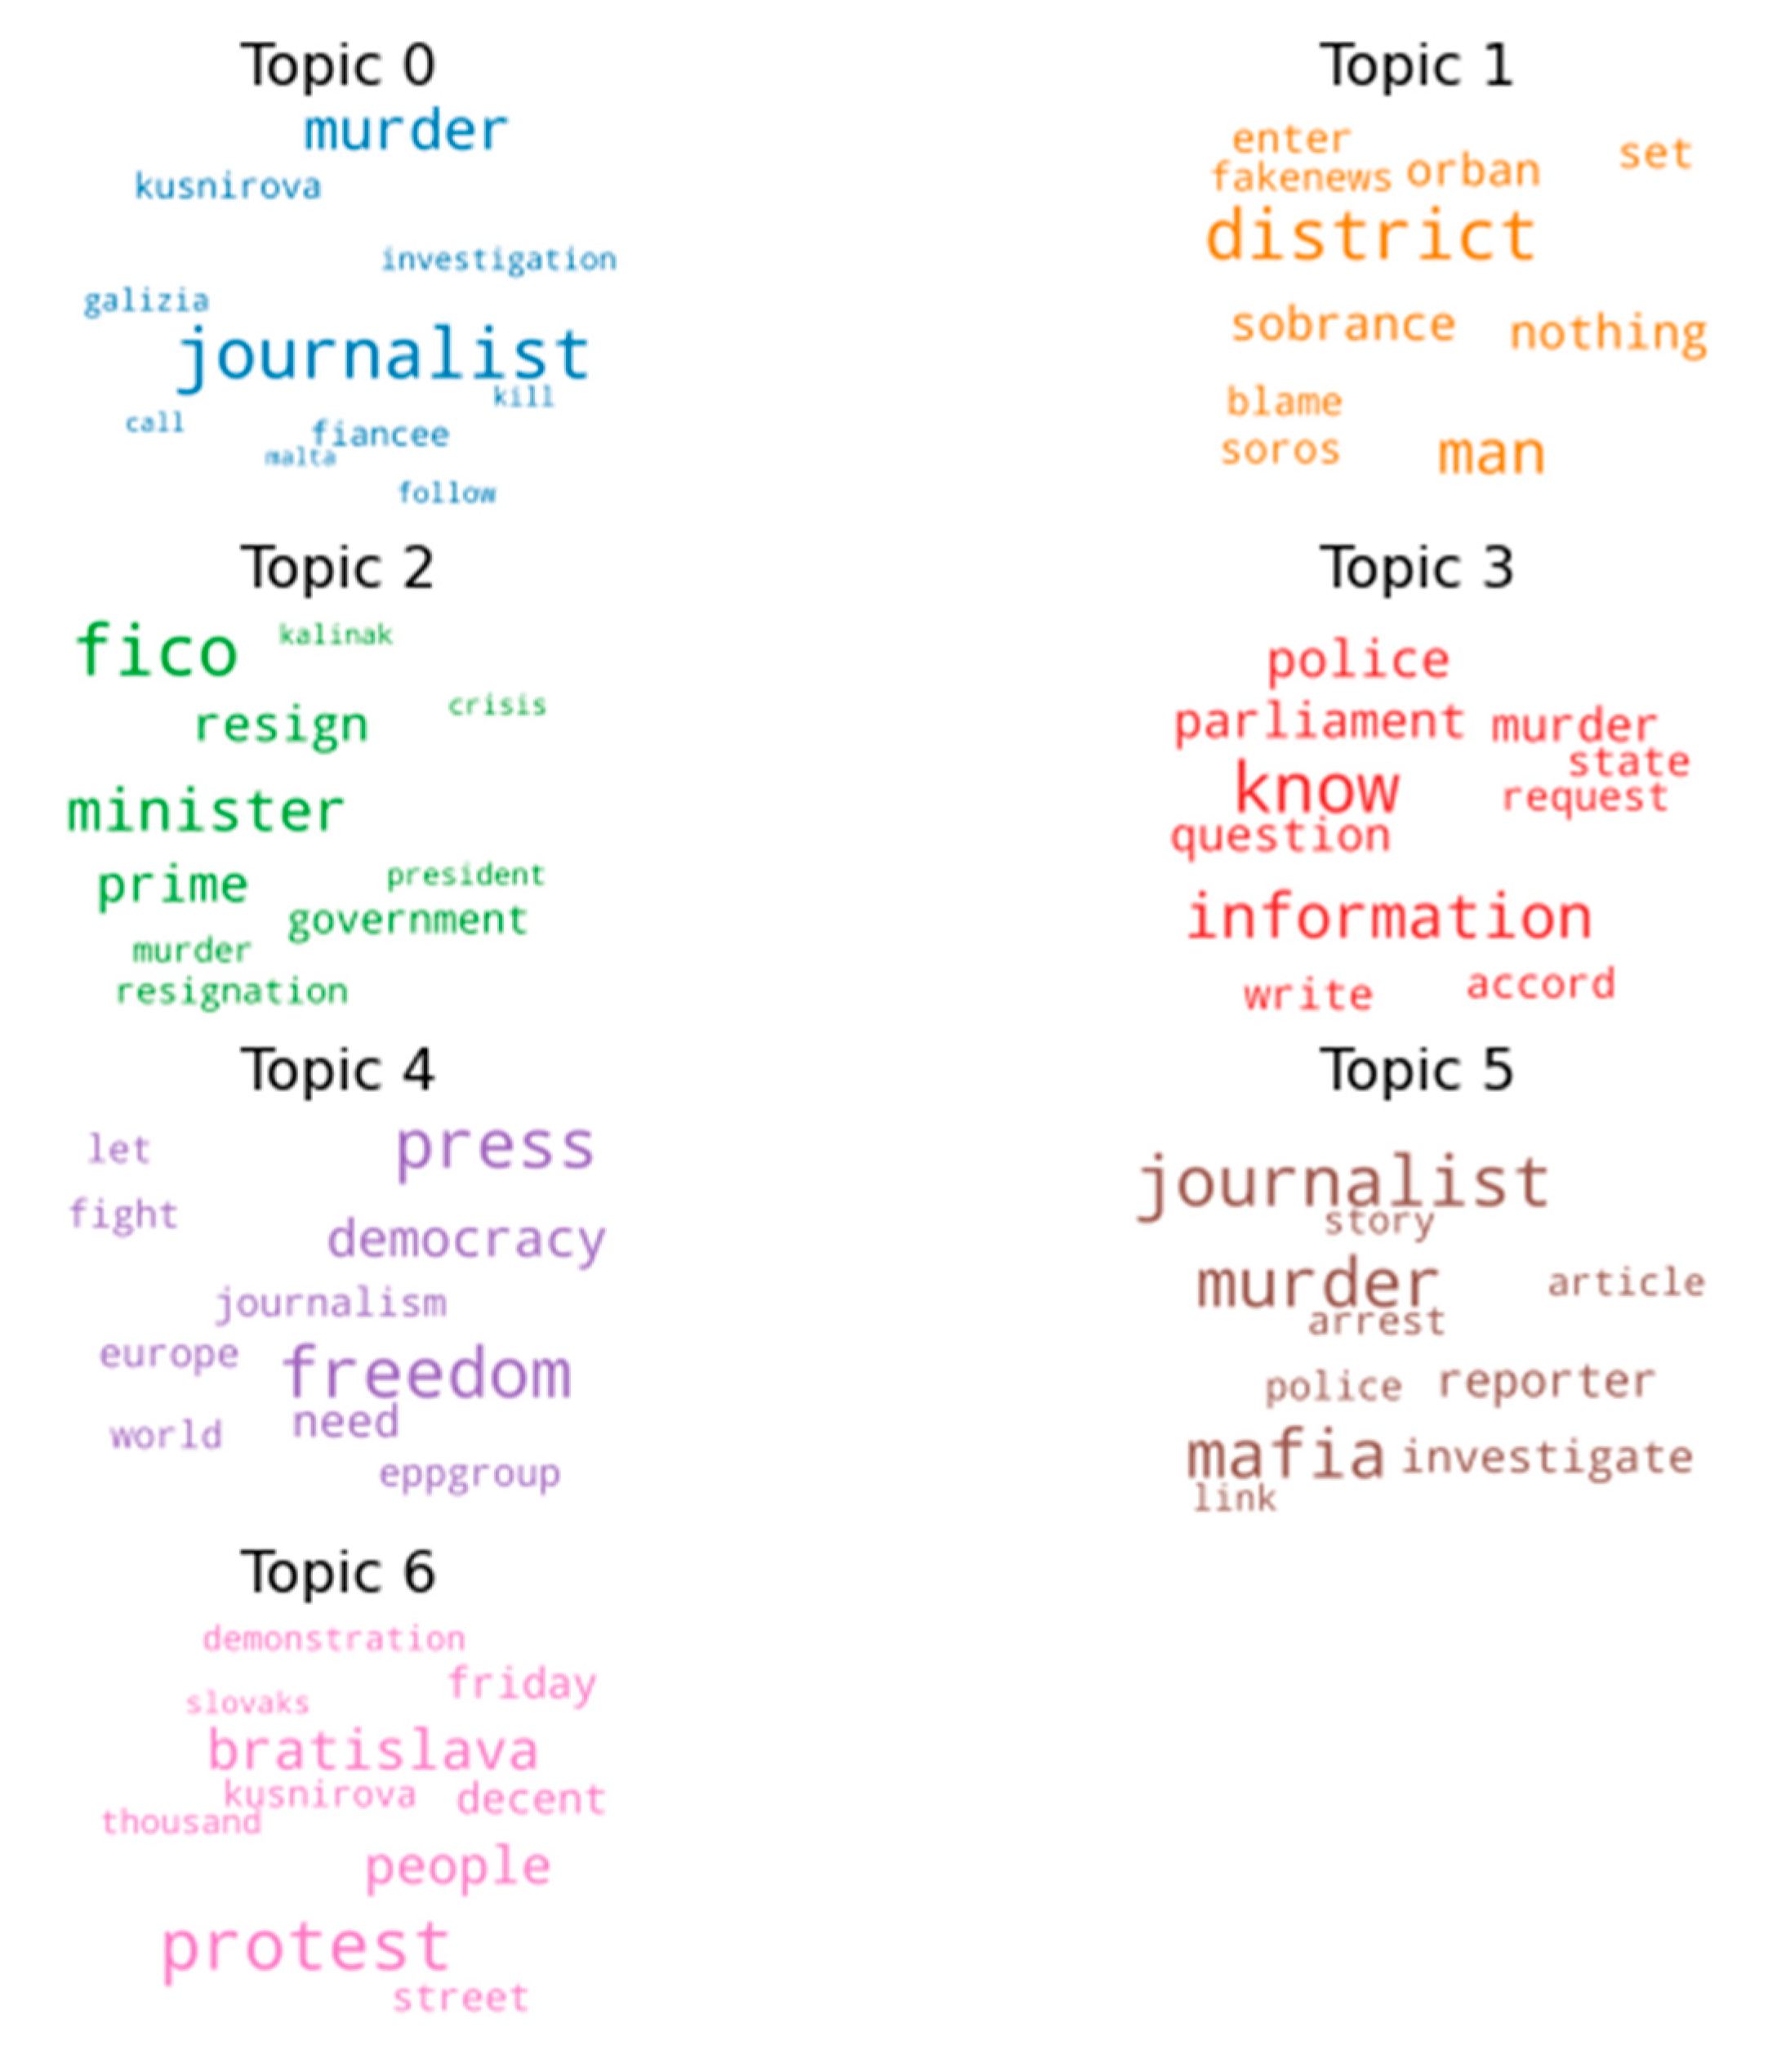
If we check the topic modeling results for Cluster 5 (
Figure 10,
Table 3) there are seven topics identifiable. These topics are more distinct ((
Table 3) Topic contribution percent values are higher) compared to the topics in Cluster 1, discussing not only the PM but also the whole government’s role, the protests, the mafia, the fiancé of Kuciak, and interestingly also Viktor Orban, the Hungarian PM, although Hungary was not in this cluster or among the most active countries in terms of tweeting behavior. The representative tweet of the most significant topic (Topic 2) revolved around the political crisis in Slovakia, especially through the discussion about the resignations and the possibility of new elections. The next topic discusses the situation of press freedom in Europe, and its urgency is further pressed by the fact that some tweets made a direct connection between the assassination of Kuciak and Daphne Caruana Galizia, a Maltese investigative journalist, who was assassinated only a few months earlier, on 16th October 2017 [
63]. The overrepresentation of this theme (Topic 4 and Topic 0) shows that the dissatisfied voices about the Caruana Galizia’s case further strengthened the Kuciak movement in the online sphere. The tweets that made a connection between the death of Galizia’ and the case of Kuciak’s fiancée could also be interpreted as a clear representation of the condemnation of the violence against women that may further strengthen this movement. Furthermore, Martina Kusnirova has a double representation among the topics as by name and as fiancée that may suggest that users of this cluster not only strictly condemned her death but they may differentiate between an innocent death and a death related to work. The topic modeling also identified tweets discussing the connection between the Hungarian PM and George Soros, who is a Hungarian-born American billionaire representing a frequent theme in different conspiracy theories and fake news [
64]. The reason for this relationship may be twofold. First, six months before the assassination of Kuciak, the Hungarian government started a countrywide billboard campaign portraying George Soros and saying “Don’t let George Soros have the last laugh”, thus generating a scapegoat from him regarding the refugee crisis in 2016 [
65]. It may have created a solid base for the Slovakian PM Fico who issued a political statement on 5 March 2018. In this statement the PM inquired into the connection of George Soros and Slovakian President Andrej Kiska, who had declared the possibility of new elections a day earlier. Through this political statement, PM Fico might have tried to discredit the president. The second reason may have been, that PM Orban also saw the “fingerprint” of George Soros behind the Slovakian crisis on 10 March [
66]. Overall, this representation of Soros among the topics may indicate similar political tendencies among different counties, for example as we have seen that the clustering algorithm put Hungary, Belarus, and Turkey in the same group.
5. Discussion
The current work provided an in-depth analysis of the tweets posted in Europe related to the assassination of Kuciak. Twitter has many advantages as a data source in analyzing collective actions, especially in terms of the high temporal resolution thanks to the immediate response of the people considering given events and news, which we intended to illustrate with our multilayered analysis. Although, there are no similar methods that can analyze social phenomena such as protests and reactions to such events at that large scale and fine temporal resolution, our methodology is also not free from limitations. It is well-known that Twitter is clearly not representative for the whole population in terms of demographics; however, we can also hypothesize that in the case of a protest or other follow-up events of a journalist’s murder elderly or very young generations are also not very likely to be highly active or involved.
Generally, user privacy is an important question of investigations that rely on the social media data of individuals. In this relation, it shall be noted that we do not use and communicate identifiable user data, in fact, our research focuses on the big scale and similar tendencies of various countries. Thereby individuals’ private data has no direct reflection in the outputs and throughout the whole analysis it is only used to group users at country level. Moreover, we were analyzing collective action, and most of the tweets were published in response to the murder, so we interpreted them directly and did not infer any further information that was not the original motivation of someone for posting a tweet.
To date there is only one study, which we are aware of, that analyzed the case of Kuciak and the reaction of the public to it, using social media data. Kapanova and Stoykova (2019) made a timeline event analysis about the murder of Ján Kuciak to analyze the social networks of relating #AllforJan hashtag on a wider temporal span (28 February–28 July 2018) focusing on Slovakia. Through this research, they examined the distribution of related hashtags. Their data collection comprises a total of 4611 tweets from 595 unique users (7.7 tweets per user), whereas our approach resulted in approximately 1800 tweets and 468 unique users for only 18 days in Slovakia.
The current study analyzed only one case so we cannot and should not draw general conclusions from the patterns we identified both in terms of spatiotemporal characteristics or the topics and the sentiments. Still, we can state that based on the news report and other official sources, our analysis is able to reflect what was going on in the countries we considered. Additionally, the workflow itself, containing the whole pre-processing and the follow-up analysis steps to cluster the countries and investigate topics and sentiments patterns in the data can be considered transferable and used for the analysis of similar cases. Moreover, the results of this general, exploratory analysis can provide a strong foundation for more specific analyses, for example country-specific investigation or focusing on a specific topic or day. Although we applied the current methodology based on Twitter data after a particular event already took place, it is worth noting that both the subject and the region of the analysis are interchangeable with other themes, as well as with other social media data resources that has the required attributes regarding the location. Moreover, by using unsupervised topic modeling methodologies and an automatable approach there is also the potential to adapt our workflow for early classification (for example in the emerging phase of a protest) to predict the overall gravity of the analyzed collective actions.
Future research can also compare other cases to the murder of Kuciak to see if there are indeed more general conclusions to draw about the connection of social media and protests or even social unrests. Based on some events in the past such as the riots after the death of George Floyd in the US [
67], other studies found a strong influence of pictures [
68,
69] or hashtags (#Ferguson, #oscargrant…) shared in social media on the consequences of a case in the society or politics [
70].
6. Conclusions
Our work investigated over 8000 tweets to analyze the users’ reaction to the murder of Ján Kuciak and its follow-up news and events in Europe. We provided a detailed pre-processing and data cleaning workflow to ensure high quality results for not only the spatiotemporal and sentiment analysis but especially in the case of topic modeling. Thanks to the transferable nature, this workflow can also be used for other case studies, where Twitter data is analyzed in the light of similar events.
Our topic modeling algorithm was able to identify the key topics, such as the connection to the Italian mafia, the murder of other journalists, or the resignation of the Prime Minister in Slovakia. The clustering algorithm was used to group countries with similar trends in terms of temporal patterns. Thus, we distinguished five groups, out of which two bigger one contained over 90% of the tweets and provided the most details about the activity peaks. The first cluster was less active in the second half of the analysis period where the funeral or the resignation of the PM happened. Countries like Italy, France, or Austria would belong here. The second big cluster includes Slovakia, Germany, and the UK, among others, and they have a bigger peak both in the beginning when the murder and the first connection of the Slovakian politicians to the Italian mafia were discovered and at the end (after 8 March) with the funerals taking place and the PM resigns. In terms of sentiments, this latter group was also more positive in this second half of the period, while Slovakia and Germany even have a statistically significant increasing trend for the sentiment of the tweets throughout the whole analysis period.
The scientific contribution of our paper is twofold. First, it shows that geo-social media data can be utilized for generating a better understanding of political events even at a smaller spatial and societal scale and in a non-English language. Second, our methodological workflow combines time series clustering with semantic topic modeling and sentiment analysis, performed on georeferenced social media data, which provides multi-modal insights into the public’s reactions to a specific political event.
Overall, the investigation of social media in the case of events such as the murder of a journalist seems an important tool to track and understand the immediate reaction of people, unlike any other method or source of information. Nevertheless, the current work only investigated one case study and therefore general conclusions about the flow of events should not be drawn. Yet, we showed the potential and also illustrated some possible future research directions to better understand this field of research by using novel analysis techniques.
Author Contributions
Conceptualization, Tamás Kovács, Anna Kovács-Győri and Bernd Resch; formal analysis, Tamás Kovács and Anna Kovács-Győri; methodology, Tamás Kovács, Anna Kovács-Győri and Bernd Resch; supervision, Bernd Resch; visualization, Tamás Kovács and Anna Kovács-Győri; writing—original draft, Tamás Kovács and Anna Kovács-Győri; writing—review and editing, Tamás Kovács and Anna Kovács-Győri. All authors have read and agreed to the published version of the manuscript.
Funding
We would like to express our gratitude to Land Salzburg for supporting the research at IDA Lab (Projekt-ID: 20102-F1901166-KZP and 20204-WISS/225/197-2019). We would also like to express our gratitude to the FWF for supporting the project “The Scales and Structures of Intra-Urban Spaces” (reference number P 29135-N29) and the project “Urban Emotions”, reference number I-3022.
Institutional Review Board Statement
Not applicable.
Informed Consent Statement
Not applicable.
Data Availability Statement
Examples for the codes used in this study can be found in the Supplementary files.
Conflicts of Interest
The authors declare no conflict of interest. The funders had no role in the design of the study; in the collection, analyses, or interpretation of data; in the writing of the manuscript, or in the decision to publish the results.
References
- Tilly, C. From Mobilization to Revolution; Addison-Wesley: Boston, MA, USA, 1978; ISBN 978-0-07-554851-5. [Google Scholar]
- Bennett, W.L.; Segerberg, A. The Logic of Connective Action: Digital Media and the Personalization of Contentious Politics. Inf. Commun. Soc. 2012, 15, 739–768. [Google Scholar] [CrossRef] [Green Version]
- Doerr, B.; Fouz, M.; Friedrich, T. Why Rumors Spread so Quickly in Social Networks. Commun. ACM 2012, 55, 70–75. [Google Scholar] [CrossRef]
- Thorpe, H.; Ahmad, N. Youth, Action Sports and Political Agency in the Middle East: Lessons from a Grassroots Parkour Group in Gaza. Int. Rev. Sociol. Sport 2015, 50, 678–704. [Google Scholar] [CrossRef]
- Jamal, A.A.; Keohane, R.O.; Romney, D.; Tingley, D. Anti-Americanism and Anti-Interventionism in Arabic Twitter Discourses. Perspect. Politics 2015, 13, 55–73. [Google Scholar] [CrossRef] [Green Version]
- Bastos, M.T.; Mercea, D.; Charpentier, A. Tents, Tweets, and Events: The Interplay between Ongoing Protests and Social Media. J. Commun. 2015, 65, 320–350. [Google Scholar] [CrossRef]
- Panagiotopoulos, P.; Bigdeli, A.Z.; Sams, S. Citizen–Government Collaboration on Social Media: The Case of Twitter in the 2011 Riots in England. Gov. Inf. Q. 2014, 31, 349–357. [Google Scholar] [CrossRef]
- Wang, C.-J.; Wang, P.-P.; Zhu, J.J.H. Discussing Occupy Wall Street on Twitter: Longitudinal Network Analysis of Equality, Emotion, and Stability of Public Discussion. Cyberpsychol. Behav. Soc. Netw. 2013, 16, 679–685. [Google Scholar] [CrossRef] [Green Version]
- Segesten, A.D.; Bossetta, M. A Typology of Political Participation Online: How Citizens Used Twitter to Mobilize during the 2015 British General Elections. Inf. Commun. Soc. 2017, 20, 1625–1643. [Google Scholar] [CrossRef]
- Theocharis, Y.; Lowe, W.; van Deth, J.W.; García-Albacete, G. Using Twitter to Mobilize Protest Action: Online Mobilization Patterns and Action Repertoires in the Occupy Wall Street, Indignados, and Aganaktismenoi Movements. Inf. Commun. Soc. 2015, 18, 202–220. [Google Scholar] [CrossRef]
- Coppock, A.; Guess, A.; Ternovski, J. When Treatments Are Tweets: A Network Mobilization Experiment over Twitter. Polit. Behav. 2016, 38, 105–128. [Google Scholar] [CrossRef]
- Oh, O.; Eom, C.; Rao, H.R. Research Note—Role of Social Media in Social Change: An Analysis of Collective Sense Making during the 2011 Egypt Revolution. Inf. Syst. Res. 2015, 26, 210–223. [Google Scholar] [CrossRef]
- Bruns, A.; Highfield, T.; Burgess, J. The Arab Spring and Social Media Audiences: English and Arabic Twitter Users and Their Networks. Am. Behav. Sci. 2013, 57, 871–898. [Google Scholar] [CrossRef] [Green Version]
- Meraz, S.; Papacharissi, Z. Networked Gatekeeping and Networked Framing on #Egypt. Int. J. Press/Politics 2013, 18, 138–166. [Google Scholar] [CrossRef] [Green Version]
- Gerbaudo, P. Social Media Teams as Digital Vanguards: The Question of Leadership in the Management of Key Facebook and Twitter Accounts of Occupy Wall Street, Indignados and UK Uncut. Inf. Commun. Soc. 2017, 20, 185–202. [Google Scholar] [CrossRef] [Green Version]
- Kardara, M.; Papadakis, G.; Papaoikonomou, A.; Tserpes, K.; Varvarigou, T. Large-Scale Evaluation Framework for Local Influence Theories in Twitter. Inf. Process. Manag. 2015, 51, 226–252. [Google Scholar] [CrossRef]
- Räbiger, S.; Spiliopoulou, M. A Framework for Validating the Merit of Properties That Predict the Influence of a Twitter User. Expert Syst. Appl. 2015, 42, 2824–2834. [Google Scholar] [CrossRef]
- Available online: https://spectator.sme.sk/c/22460585/jan-kuciak-murder-trial-court-sessions-highlights.html (accessed on 1 March 2021).
- Dimov, I.; Fidanova, S. Timeline Event Analysis of Social Network Communications Activity: The Case of Ján Kuciak. In Proceedings of the in Advances in High Performance Computing Results of the International Conference on “High Performance Computing”, Borovets, Bulgaria, 2–6 September 2019; Studies in Computational Intelligence. Springer International Publishing: Cham, Switzerland, 2021; pp. 118–131, ISBN 978-3-030-55347-0. [Google Scholar]
- Kovacs-Györi, A.; Ristea, A.; Kolcsar, R.; Resch, B.; Crivellari, A.; Blaschke, T. Beyond Spatial Proximity—Classifying Parks and Their Visitors in London Based on Spatiotemporal and Sentiment Analysis of Twitter Data. ISPRS Int. J. Geo-Inf. 2018, 7, 378. [Google Scholar] [CrossRef] [Green Version]
- Almatar, M.G.; Alazmi, H.S.; Li, L.; Fox, E.A. Applying GIS and Text Mining Methods to Twitter Data to Explore the Spatiotemporal Patterns of Topics of Interest in Kuwait. ISPRS Int. J. Geo-Inf. 2020, 9, 702. [Google Scholar] [CrossRef]
- Kovacs-Gyori, A.; Ristea, A.; Havas, C.; Resch, B.; Cabrera-Barona, P. #London2012: Towards Citizen-Contributed Urban Planning Through Sentiment Analysis of Twitter Data. Urban Plan. 2018, 3, 75–99. [Google Scholar] [CrossRef]
- Kamel Boulos, M.N.; Resch, B.; Crowley, D.N.; Breslin, J.G.; Sohn, G.; Burtner, R.; Pike, W.A.; Jezierski, E.; Chuang, K.-Y.S. Crowdsourcing, Citizen Sensing and Sensor Web Technologies for Public and Environmental Health Surveillance and Crisis Management: Trends, OGC Standards and Application Examples. Int. J. Health Geogr. 2011, 10, 67. [Google Scholar] [CrossRef] [Green Version]
- Connors, J.P.; Lei, S.; Kelly, M. Citizen Science in the Age of Neogeography: Utilizing Volunteered Geographic Information for Environmental Monitoring. Ann. Assoc. Am. Geogr. 2012, 102, 1267–1289. [Google Scholar] [CrossRef]
- Muller, C.L.; Chapman, L.; Johnston, S.; Kidd, C.; Illingworth, S.; Foody, G.; Overeem, A.; Leigh, R.R. Crowdsourcing for Climate and Atmospheric Sciences: Current Status and Future Potential. Int. J. Climatol. 2015, 35, 3185–3203. [Google Scholar] [CrossRef] [Green Version]
- Huang, Y.; Fei, T.; Kwan, M.-P.; Kang, Y.; Li, J.; Li, Y.; Li, X.; Bian, M. GIS-Based Emotional Computing: A Review of Quantitative Approaches to Measure the Emotion Layer of Human–Environment Relationships. ISPRS Int. J. Geo-Inf. 2020, 9, 551. [Google Scholar] [CrossRef]
- Peña-López, I.; Congosto, M.; Aragón, P. Spanish Indignados and the Evolution of the 15M Movement on Twitter: Towards Networked Para-Institutions. J. Span. Cult. Stud. 2014, 15, 189–216. [Google Scholar] [CrossRef]
- Bennett, W.L.; Segerberg, A.; Walker, S. Organization in the Crowd: Peer Production in Large-Scale Networked Protests. Inf. Commun. Soc. 2014, 17, 232–260. [Google Scholar] [CrossRef]
- Paul, I.; Khattar, A.; Kumaraguru, P.; Gupta, M.; Chopra, S. Elites Tweet? Characterizing the Twitter Verified User Network. In Proceedings of the 2019 IEEE 35th International Conference on Data Engineering Workshops (ICDEW), Macao, 8–11 April 2019; IEEE: Piscataway, NJ, USA, 2019; pp. 278–285. [Google Scholar]
- Haupt, M.R.; Jinich-Diamant, A.; Li, J.; Nali, M.; Mackey, T.K. Characterizing Twitter User Topics and Communication Network Dynamics of the “Liberate” Movement during COVID-19 Using Unsupervised Machine Learning and Social Network Analysis. Online Soc. Netw. Media 2021, 21, 100114. [Google Scholar] [CrossRef]
- Haffner, M. A Place-Based Analysis of #BlackLivesMatter and Counter-Protest Content on Twitter. GeoJournal 2019, 84, 1257–1280. [Google Scholar] [CrossRef]
- Felmlee, D.H.; Blanford, J.I.; Matthews, S.A.; MacEachren, A.M. The Geography of Sentiment towards the Women’s March of 2017. PLoS ONE 2020, 15, e0233994. [Google Scholar] [CrossRef]
- Howard, P.N.; Duffy, A.; Freelon, D.; Hussain, M.M.; Mari, W.; Maziad, M. Opening Closed Regimes: What Was the Role of Social Media during the Arab Spring? Social Science Research Network: Rochester, NY, USA, 2011. [Google Scholar]
- Morstatter, F.; Pfeffer, J.; Liu, H.; Carley, K.M. Is the Sample Good Enough? Comparing Data from Twitter’s Streaming API with Twitter’s Firehose. arXiv 2013, arXiv:1306.5204. [Google Scholar]
- Drüeke, R.; Zobl, E. Online Feminist Protest against Sexism: The German-Language Hashtag #aufschrei. Fem. Media Stud. 2016, 16, 35–54. [Google Scholar] [CrossRef]
- Resch, B.; Usländer, F.; Havas, C. Combining Machine-Learning Topic Models and Spatiotemporal Analysis of Social Media Data for Disaster Footprint and Damage Assessment. Cartogr. Geogr. Inf. Sci. 2018, 45, 362–376. [Google Scholar] [CrossRef] [Green Version]
- Wang, Z.; Ye, X.; Tsou, M.-H. Spatial, Temporal, and Content Analysis of Twitter for Wildfire Hazards. Nat. Hazards 2016, 83, 523–540. [Google Scholar] [CrossRef]
- Ye, X. A Multi-Dimensional Analysis of El Niño on Twitter: Spatial, Social, Temporal, and Semantic Perspectives. IJGI 2019, 8, 436. [Google Scholar] [CrossRef] [Green Version]
- Sinpeng, A. Hashtag Activism: Social Media and the #FreeYouth Protests in Thailand. Crit. Asian Stud. 2021, 53, 192–205. [Google Scholar] [CrossRef]
- LeFebvre, R.K.; Armstrong, C. Grievance-Based Social Movement Mobilization in the #Ferguson Twitter Storm. New Media Soc. 2018, 20, 8–28. [Google Scholar] [CrossRef]
- Conover, M.D.; Ferrara, E.; Menczer, F.; Flammini, A. The Digital Evolution of Occupy Wall Street. PLoS ONE 2013, 8, 1–5. [Google Scholar] [CrossRef] [Green Version]
- Croeser, S.; Highfield, T. Occupy Oakland and #oo: Uses of Twitter within the Occupy Movement. First Monday 2014, 19, 1–13. [Google Scholar]
- Maireder, A.; Schwarzenegger, C. A Movement of Connected Individuals. Inf. Commun. Soc. 2012, 15, 171–195. [Google Scholar] [CrossRef]
- Twitter Inc. 2018. Available online: https://developer.twitter.com/en/docs (accessed on 15 February 2021).
- Steiger, E.; Resch, B.; Zipf, A. Exploration of Spatiotemporal and Semantic Clusters of Twitter Data Using Unsupervised Neural Networks. Int. J. Geogr. Inf. Sci. 2016, 30, 1694–1716. [Google Scholar] [CrossRef]
- Pak, A.; Paroubek, P. Twitter as a Corpus for Sentiment Analysis and Opinion Mining. In Proceedings of the Seventh International Conference on Language Resources and Evaluation (LREC’10), Valletta, Malta, 17–23 May 2010; European Language Resources Association (ELRA): Valletta, Malta, 2010. [Google Scholar]
- Bansal, P.; Bansal, R.; Varma, V. Towards Deep Semantic Analysis of Hashtags. In Advances in Information Retrieval; Hanbury, A., Kazai, G., Rauber, A., Fuhr, N., Eds.; Lecture Notes in Computer Science; Springer International Publishing: Cham, Switzerland, 2015; Volume 9022, pp. 453–464. ISBN 978-3-319-16353-6. [Google Scholar]
- Kuciak Murder Investigation: A Timeline. Spectator.Sme.Sk. Compiled by Spectator. Available online: https://spectator.sme.sk/c/22298437/kuciak-murder-investigation-a-timeline.html (accessed on 9 January 2020).
- Esmukov, K. Geopy (Version 2.2.0) [Python Client]. 2019. Available online: https://pypi.org/project/geopy/#description (accessed on 19 March 2021).
- Licence. OpenStreetMap Foundation. 10 August 2021. Available online: https://wiki.osmfoundation.org/w/index.php?title=Licence&oldid=8605 (accessed on 19 August 2021).
- Van Rossum, G.; Drake, F.L., Jr. Python Reference Manual; Centrum voor Wiskunde en Informatica Amsterdam: Amsterdam, The Netherlands, 1995. [Google Scholar]
- Loria, S. Textblob Documentation. Release 0.15, 2. 2018. Available online: https://textblob.readthedocs.io/en/dev/ (accessed on 1 March 2021).
- Aiken, M. An Updated Evaluation of Google Translate Accuracy. Stud. Linguist. Lit. 2019, 3, 253–260. [Google Scholar] [CrossRef] [Green Version]
- Hasyim, M. Linguistic Functions of Emoji in Social Media Communication. Opción 2019, 35, 558–574. [Google Scholar]
- Emote. 2018. Available online: https://github.com/NeelShah18/emote (accessed on 18 April 2021).
- Bird, S.; Klein, E.; Loper, E. Natural Language Processing with Python: Analyzing Text with the Natural Language Toolkit; O’Reilly Media, Inc.: Newton, MA, USA, 2009. [Google Scholar]
- Hutto, C.; Gilbert, E. VADER: A Parsimonious Rule-Based Model for Sentiment Analysis of Social Media Text. In Proceedings of the International AAAI Conference on Web and Social Media, Ann Arbor, MI, USA, 1–4 June 2014; Volume 8, pp. 216–225. [Google Scholar]
- Rehurek, R.; Sojka, P. Gensim–Python Framework for Vector Space Modelling; NLP Centre, Faculty of Informatics, Masaryk University: Brno, Czech Republic, 2011; Volume 3. [Google Scholar]
- Pedregosa, F.; Varoquaux, G.; Gramfort, A.; Michel, V.; Thirion, B.; Grisel, O.; Blondel, M.; Prettenhofer, P.; Weiss, R.; Dubourg, V.; et al. Scikit-learn: Machine learning in Python. J. Mach. Learn. Res. 2011, 12, 2825–2830. [Google Scholar]
- Honnibal, M.; Montani, I. Spacy 2: Natural Language Understanding with Bloom Embeddings, Convolutional Neural Networks and Incremental Parsing. 2017. Available online: https://spacy.io/ (accessed on 1 March 2021).
- Campbell, J.C.; Hindle, A.; Stroulia, E. Latent Dirichlet Allocation. In The Art and Science of Analyzing Software Data; Elsevier: Amsterdam, The Netherlands, 2015; pp. 139–159. ISBN 978-0-12-411519-4. [Google Scholar]
- Röder, M.; Both, A.; Hinneburg, A. Exploring the Space of Topic Coherence Measures. In Proceedings of the Eighth ACM International Conference on Web Search and Data Mining, Shanghai, China, 2 February 2015; pp. 399–408. [Google Scholar]
- Galizia, D.C. Wikipedia. Available online: https://en.wikipedia.org/wiki/Daphne_Caruana_Galizia (accessed on 20 August 2021).
- Soros, G. Wikipedia. Available online: https://en.wikipedia.org/wiki/George_Soros (accessed on 20 August 2021).
- Than, K. Hungary’s Anti-Soros Posters ‘Recall Europe’s Darkest Hours’: Soros’ Spokesman. Reuters. Available online: https://www.reuters.com/article/us-hungary-soros-idUSKBN19W0XU (accessed on 11 July 2017).
- News, D. Orbán: Events in Slovakia ‘Bear Soros’s Fingerprints’. Daily News Hungary. Available online: https://dailynewshungary.com/orban-events-slovakia-bear-soross-fingerprints/ (accessed on 10 March 2018).
- Jones, L.K. #BlackLivesMatter: An Analysis of the Movement as Social Drama. Humanit. Soc. 2020, 44, 92–110. [Google Scholar] [CrossRef]
- Gerbaudo, P. Protest Avatars as Memetic Signifiers: Political Profile Pictures and the Construction of Collective Identity on Social Media in the 2011 Protest Wave. Inf. Commun. Soc. 2015, 18, 916–929. [Google Scholar] [CrossRef]
- Halfmann, D.; Young, M. War Pictures: The Grotesque as Mobilizing Tactic. Mobilization 2010, 15, 1–24. [Google Scholar] [CrossRef]
- He, J.; Hong, L.; Frias-Martinez, V.; Torrens, P. Uncovering Social Media Reaction Pattern to Protest Events: A Spatiotemporal Dynamics Perspective of Ferguson Unrest. In Social Informatics; Liu, T.-Y., Scollon, C.N., Zhu, W., Eds.; Springer International Publishing: Cham, Switzerland, 2015; Volume 9471, pp. 67–81. ISBN 978-3-319-27432-4. [Google Scholar]
| Publisher’s Note: MDPI stays neutral with regard to jurisdictional claims in published maps and institutional affiliations. |
© 2021 by the authors. Licensee MDPI, Basel, Switzerland. This article is an open access article distributed under the terms and conditions of the Creative Commons Attribution (CC BY) license (https://creativecommons.org/licenses/by/4.0/).


