Article

Automatic Building Detection with Polygonizing and Attribute Extraction from High-Resolution Images

by
Samitha Daranagama
1 and
Apichon Witayangkurn
2,*
1
Department of Information and Communication Technologies, School of Engineering and Technology, Asian Institute of Technology, Pathumthani 12120, Thailand
2
School of Information, Computer, and Communication Technology, Sirindhorn International Institute of Technology, Thammasat University, Pathum Thani 12120, Thailand
*
Author to whom correspondence should be addressed.
ISPRS Int. J. Geo-Inf. 2021, 10(9), 606; https://0-doi-org.brum.beds.ac.uk/10.3390/ijgi10090606
Submission received: 12 July 2021 / Revised: 26 August 2021 / Accepted: 9 September 2021 / Published: 14 September 2021
(This article belongs to the Special Issue Machine Learning for High Spatial Resolution Imagery)

Abstract

:
Buildings can be introduced as a fundamental element for forming a city. Therefore, up-to-date building maps have become vital for many applications, including urban mapping and urban expansion analysis. With the development of deep learning, segmenting building footprints from high-resolution remote sensing imagery has become a subject of intense study. Here, a modified version of the U-Net architecture with a combination of pre- and post-processing techniques was developed to extract building footprints from high-resolution aerial imagery and unmanned aerial vehicle (UAV) imagery. Data pre-processing with the logarithmic correction image enhancing algorithm showed the most significant improvement in the building detection accuracy for aerial images; meanwhile, the CLAHE algorithm improved the most concerning UAV images. This study developed a post-processing technique using polygonizing and polygon smoothing called the Douglas–Peucker algorithm, which made the building output directly ready to use for different applications. The attribute information, land use data, and population count data were applied using two open datasets. In addition, the building area and perimeter of each building were calculated as geometric attributes.

1. Introduction

With the development of and advances in remote sensing technology, high-resolution imagery, including spaceborne and airborne images, is commonly available and creates an ideal data source for producing up-to-date building maps [1,2,3]. Thus, with the high demand for urbanization and the availability of high-resolution remote sensing images, building footprint extraction has become an essential topic undergoing intense study in the research community [4]. Moreover, building footprints with precise boundaries in the vector polygon representation can be accessed directly by many geographic information system (GIS) platforms. Therefore, it can be directly applied to different real-world applications, such as urban expansion analysis, urban mapping, disaster risk assessment, and land use analysis [5].
Traditional building extraction techniques are based on manually delineating the building footprints by the “digitizing” process, which is time-consuming, costly, and more complex to human experts. Therefore, automatic building extraction is highly demanded owing to the productivity gain. In recent years, tremendous achievements have been made in applying deep learning (DL) techniques to the computer vision field because of innovations in computational capabilities and the accessibility of big data [6]. Recent research has shown that DL-based methods can effectively improve building extraction accuracy while addressing the issues that prevail in traditional building extraction techniques [7,8].
Although DL-based techniques are more powerful and accurate, automatic building extraction is still challenging owing to the varied characteristics of the buildings and the spatial and spectral characteristics of remote sensing images. Hence, more effective algorithms are required for automatic building footprint extraction processes with different environments and various building properties.
DL models for image segmentation require much labeled data in the training stage because segmentation using high-resolution images would have millions of parameters. However, many publicly available large remote sensing datasets can be used for building segmentation tasks with spatial resolutions ranging from 5 cm to 1 m [9]. Yuan et al. [9] summarized the accuracy and properties of different datasets available for the semantic segmentation of remote sensing imagery.
When considering image segmentation using machine learning (ML) or DL models, both the quality and quantity of the training dataset have a considerable influence on the performance of the specific model. In an image dataset, owing to camera illumination, insufficient brightness, contrast, image details, and feature extraction accuracy can be reduced [10]. As a solution to this issue, different pre-processing techniques can be applied to generate ML readable datasets by increasing the quality and quantity of the data. The quality of the training dataset can be improved by filtering images [11], data normalization [12], and image enhancement techniques [10]. The training dataset quantity can be increased using data augmentation techniques such as image rotation, flipping, rescaling, and color balancing [10,13].
The semantic segmentation process of building extraction involves classification by pixel-level labeling for all image pixels to categorize building footprints, resulting in a single label for the entire image. Among the different semantic segmentation architectures in DL, convolutional neural networks (CNNs) are widely used in the early stages [14,15,16]. However, the output feature map resolution is lower than that of the input images of these CNN-based methods, resulting in much coarser layers. This phenomenon reduces the accuracy of building identification and accurately labeling the building shape. Because of the limitations of CNNs, fully convolutional networks (FCNs) enable the input of an image of random size and generate a segmentation mask of the same size. In recent studies that used FCNs for automatic building extraction [2,17], the authors modified existing CNN architectures such as GoogLeNet [18] and VGG16 [19] to manage non-fixed size inputs and outputs for the model [20,21]. However, as a limitation of FCNs, building corners and edges are often neglected, and the global context information is not efficiently considered, often producing “blobby” extraction results. Furthermore, three-dimensional images cannot be easily transferred to the model [22].
Encoder–decoder-based DL architectures can effectively solve the end-to-end learning problem in semantic segmentation [22]. Most DL-based segmentation models follow the encoder–decoder technique [23]. However, encoder–decoder network models are more effective and popular in image-to-image translation problems, which learn to minimize the pixel value loss between the original input image and the desired output image. It has many instances, such as noise reduction, super-resolution, image synthesis, and image reconstruction. U-Net [24] architecture can be identified as a state-of-the-art method for building extraction among different encoder–decoder-based models. The U-Net model shows a better spatial refinement of the fine-grain details of input images through the decoding process by allocating all feature maps between the encoder and decoder. Many studies have been conducted by modifying this U-Net architecture to obtain better results [12,25,26,27,28,29,30,31].
Prathap and Afanasyev [12] proposed a U-Net architecture modified by adding batch normalization wrappers with an activation function for all layers. Guo et al. [25] proposed a multi-loss-based U-Net model with an attention block (AMUNet) for automatic building extraction with higher accuracy. Pan et al. [26] proposed a new approach for building segmentation based on a U-Net architecture containing a generative adversarial network that includes spatial and channel attention mechanisms. According to the building prediction results, this model outperformed several state-of-the-art approaches, including FCN [27], MLP [27], SegNet+ multi-task loss [28], mask R-CNN [29], 2-Levels U-Nets [30], and MSMT [31].
Building extraction results should not be the final product of a study; instead, it performs as intermediate data that can be applied to many different application areas. Most of the existing research considers only the building segmentation part instead of converting the results into a standard format that can be used as spatial data. Thus, to fill the gap between the DL field and the geospatial field, an effective post-processing technique is required to utilize the building segmentation results into a standard format of spatial data that can be directly used for many applications.
This research develops a modified version of the U-Net architecture that can extract building footprints from aerial images and unmanned aerial vehicle (UAV) images in different cities with diverse building architectures. Furthermore, we evaluate the results by fine-tuning a pre-trained DL architecture using transfer learning. It achieves almost similar accuracy with less training time compared to training the model from scratch. This approach is useful for adapting the model to building detection in a new context because it saves a significant amount of training data and considerable training time.
From the results, it is proved that data pre-processing with image-enhancing algorithms can improve the performance of DL models. However, not all image-enhancing algorithms can improve model performance. The building footprint detection results are converted into polygon shapefiles, and the results are compared with different polygon smoothing algorithms to obtain more regularized building polygon shapes. Moreover, smoothing leads to a reduction in the complexity of the building boundaries with a reduced file size, which would be more convenient to use the building extraction results in another application area. Two open datasets are used to add the population count and land use information to each building polygon. Furthermore, the area and perimeter of each building are calculated as geometric attributes. Finally, through this research, we produce a more regularized building polygon layer that includes beneficial attributes that can be used spontaneously in different applications.
The study’s main contributions are:
  • Proposing a modified version of U-Net architecture for building detection;
  • Determining the effect of image pre-processing using image-enhancing algorithms for the building detection accuracy of DL models;
  • Developing a post-processing technique that makes the building output directly ready to use for different applications by polygonizing the building detection results with more regularized building footprint boundaries; and
  • Extracting different attribute categories into the building footprint polygon layer by incorporating other data sources and basing it on the building geometry.

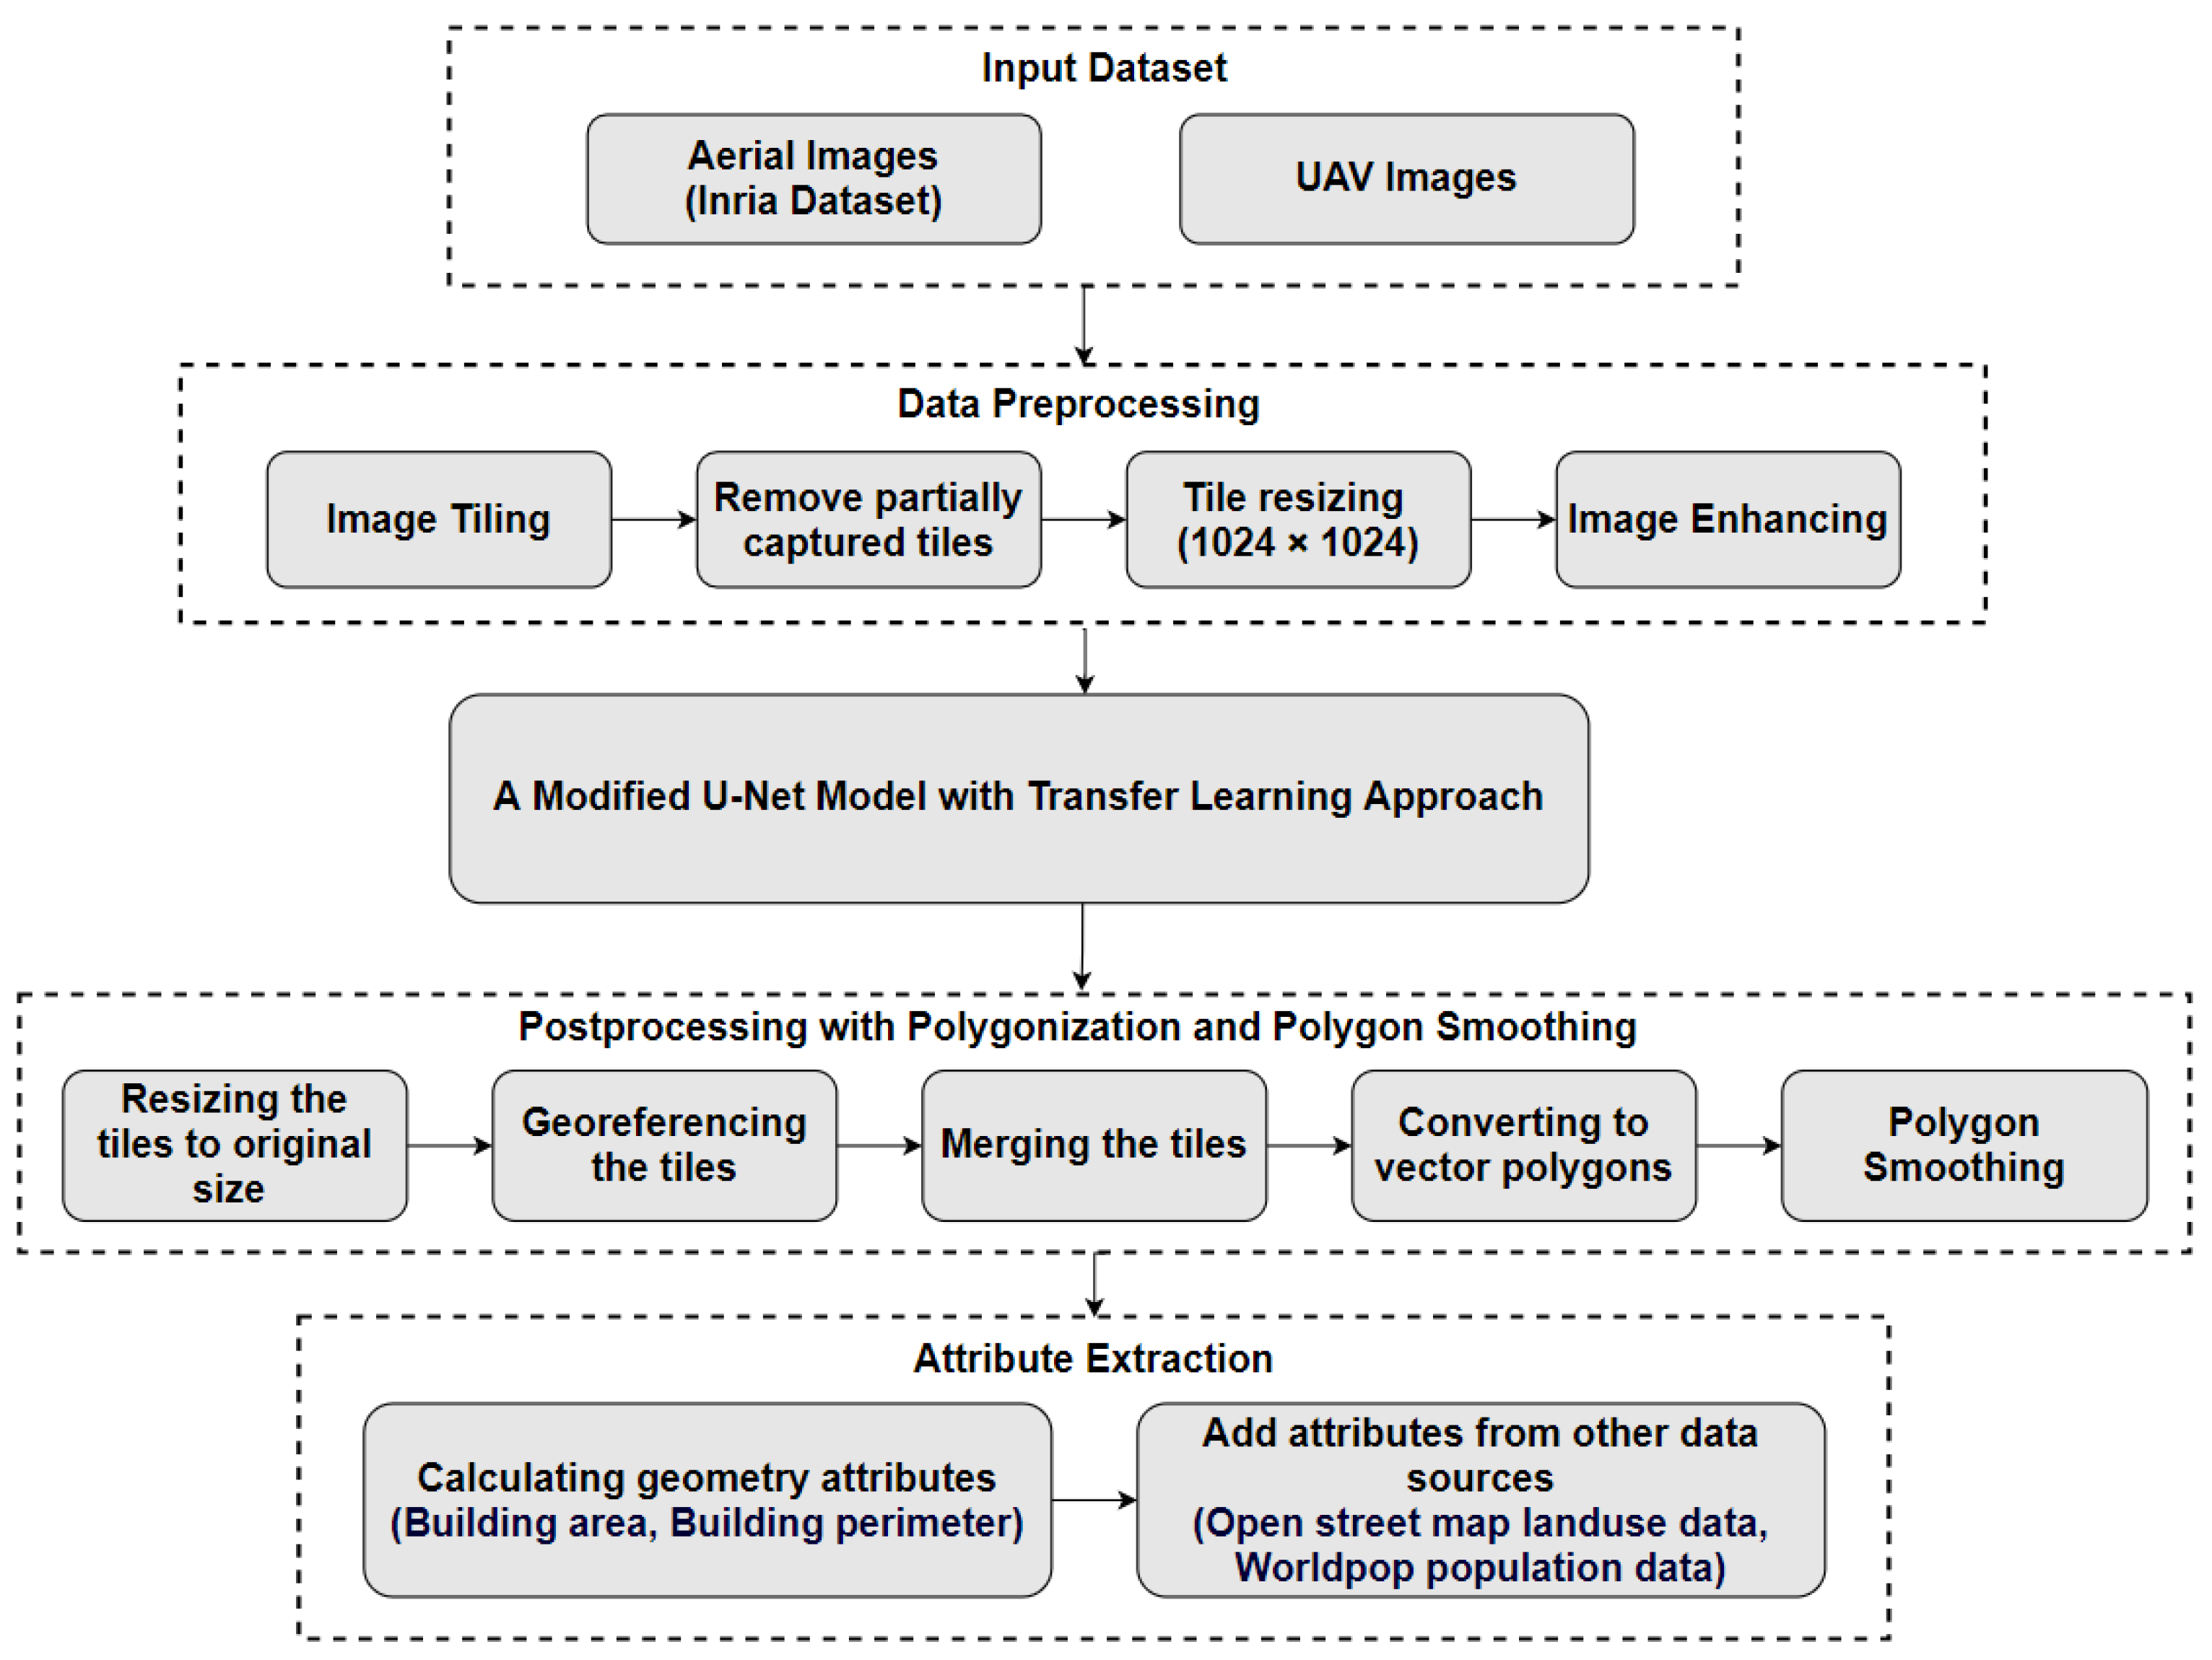
2. Materials and Methods

Figure 1 illustrates the study’s overall methodology, including data pre-processing, model fitting, post-processing, and attribute extraction. The input dataset contained both UAV and aerial images. Different pre-processing steps were performed to improve the quality of the dataset and to generate a readable ML dataset. A modified version of the U-Net architecture was used for the building detection process. The effectiveness of transfer learning was evaluated by pre-training the network structure using aerial images and transferring the weights into a new model for fine-tuning the building extraction process from UAV images. Figure 1 shows the post-processing and attribute extraction steps performed to make the building extraction output more beneficial in real-world applications.

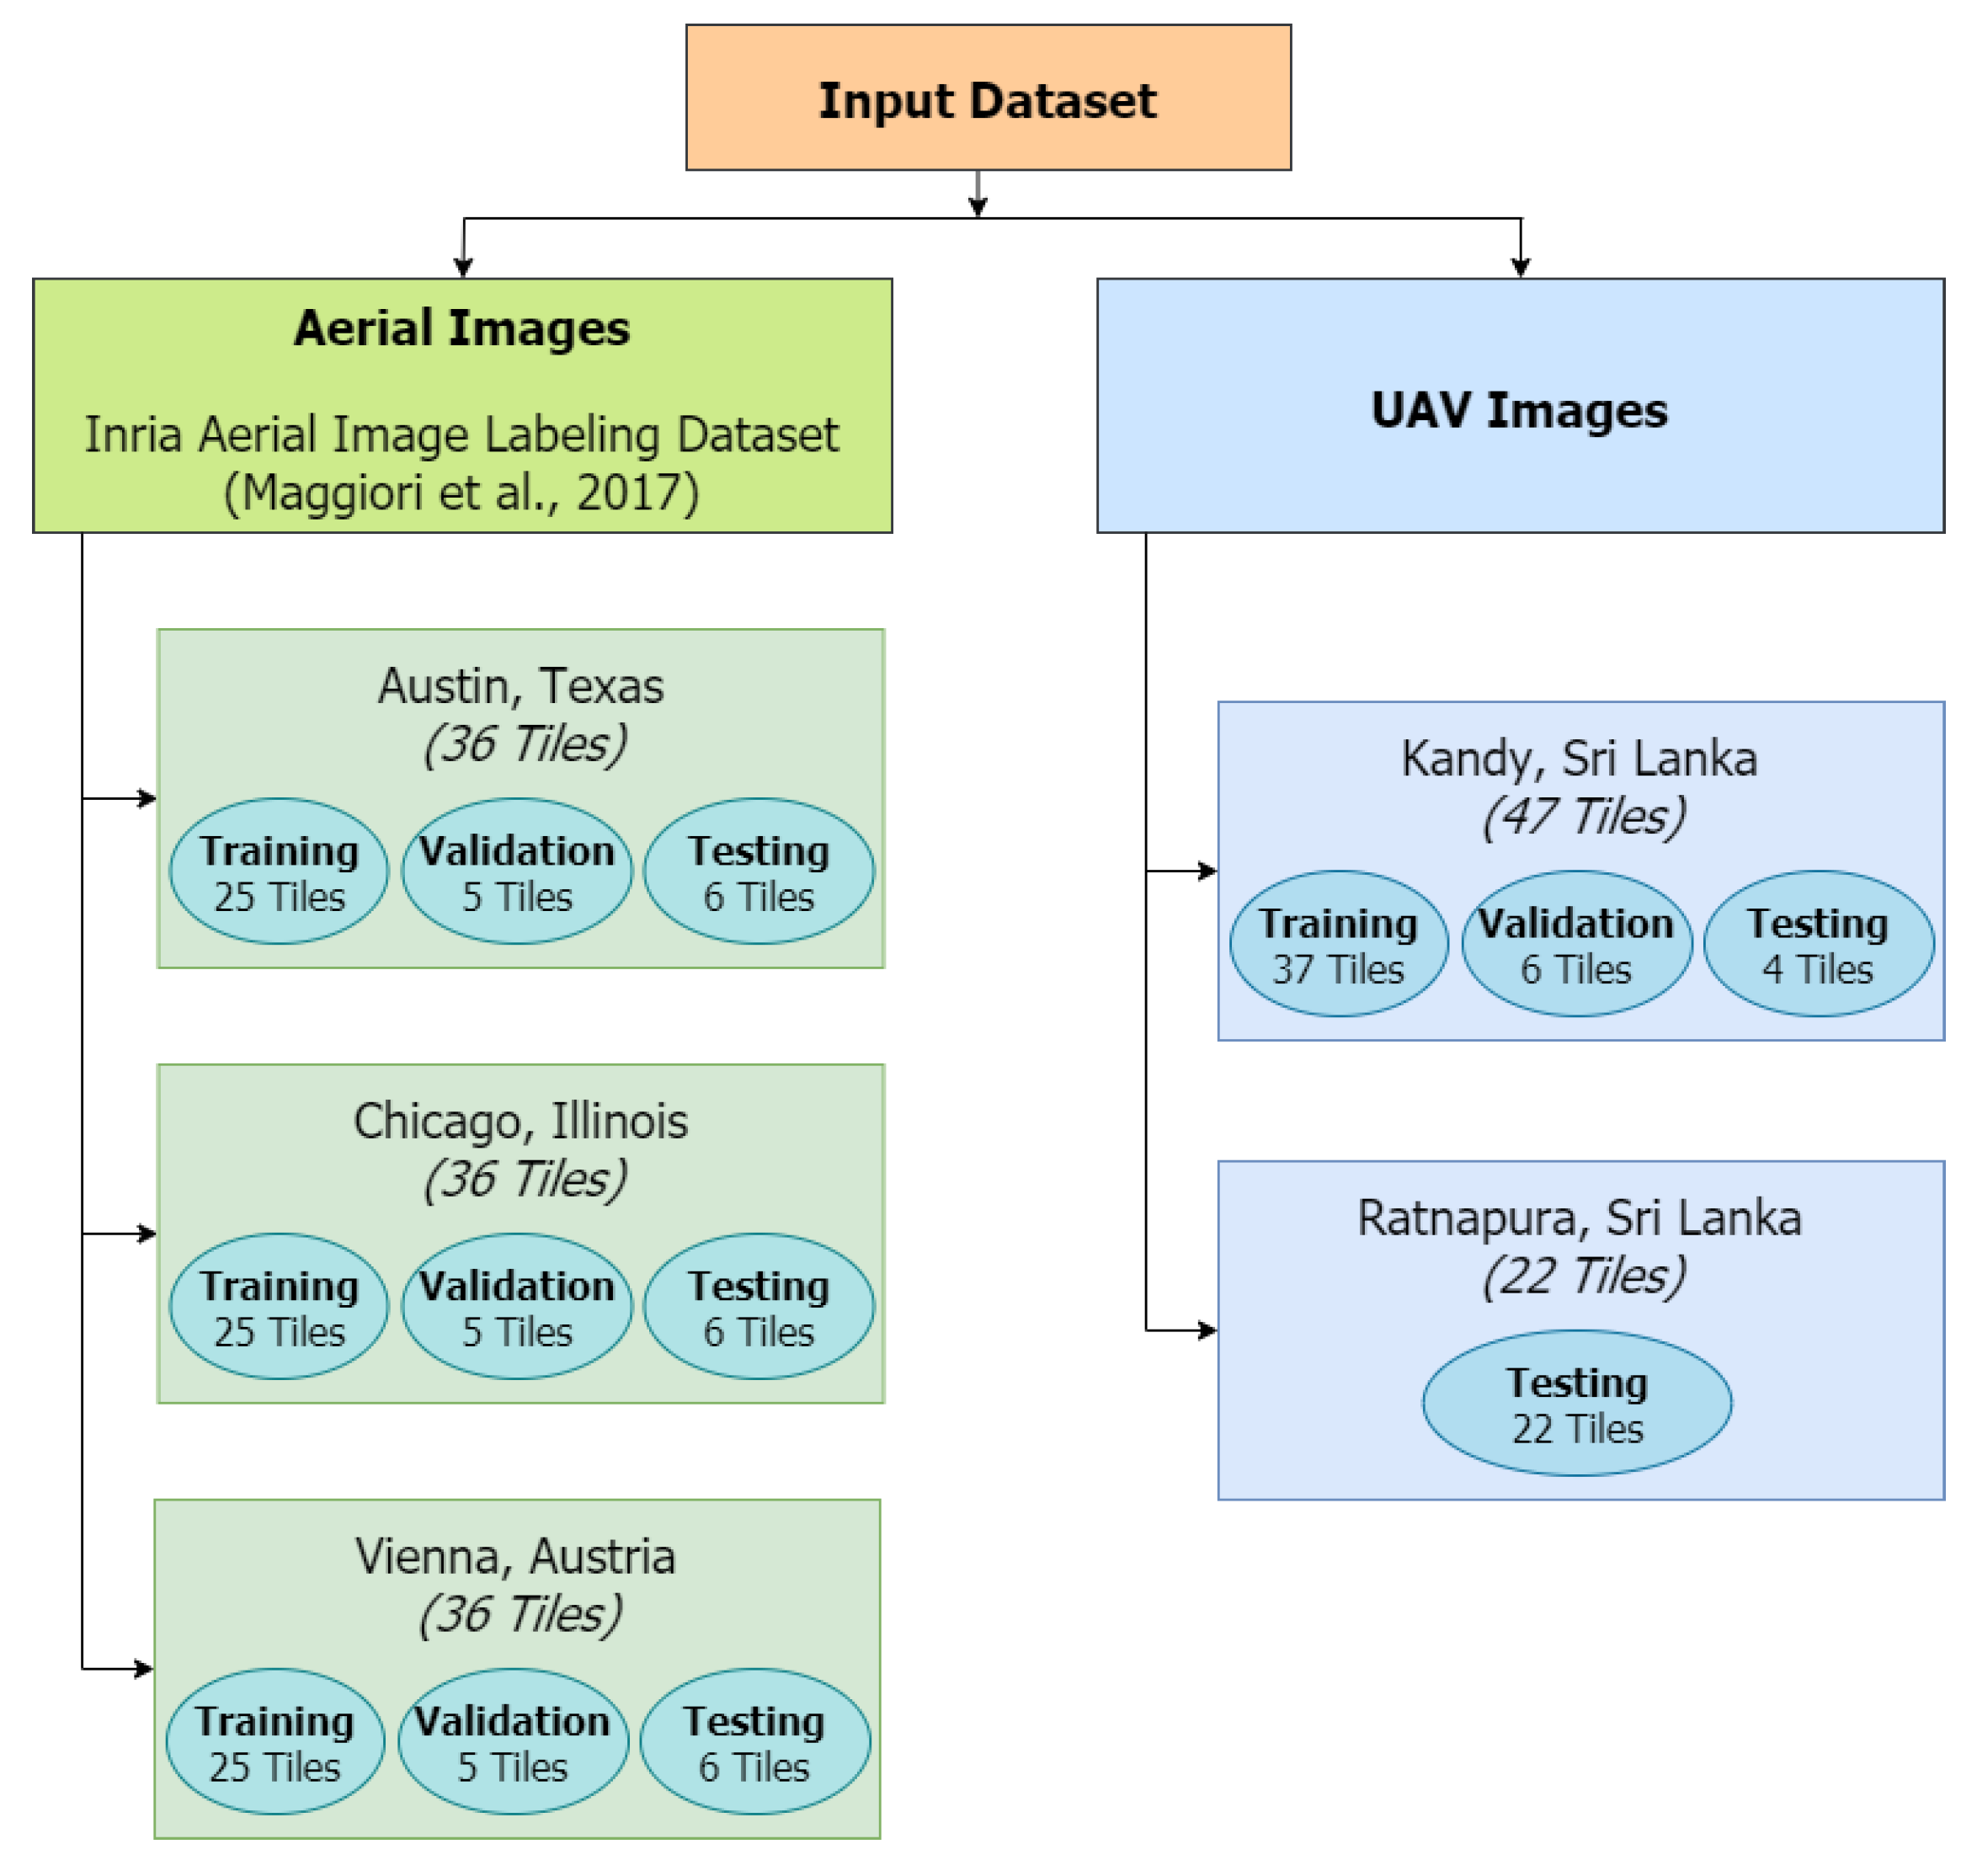
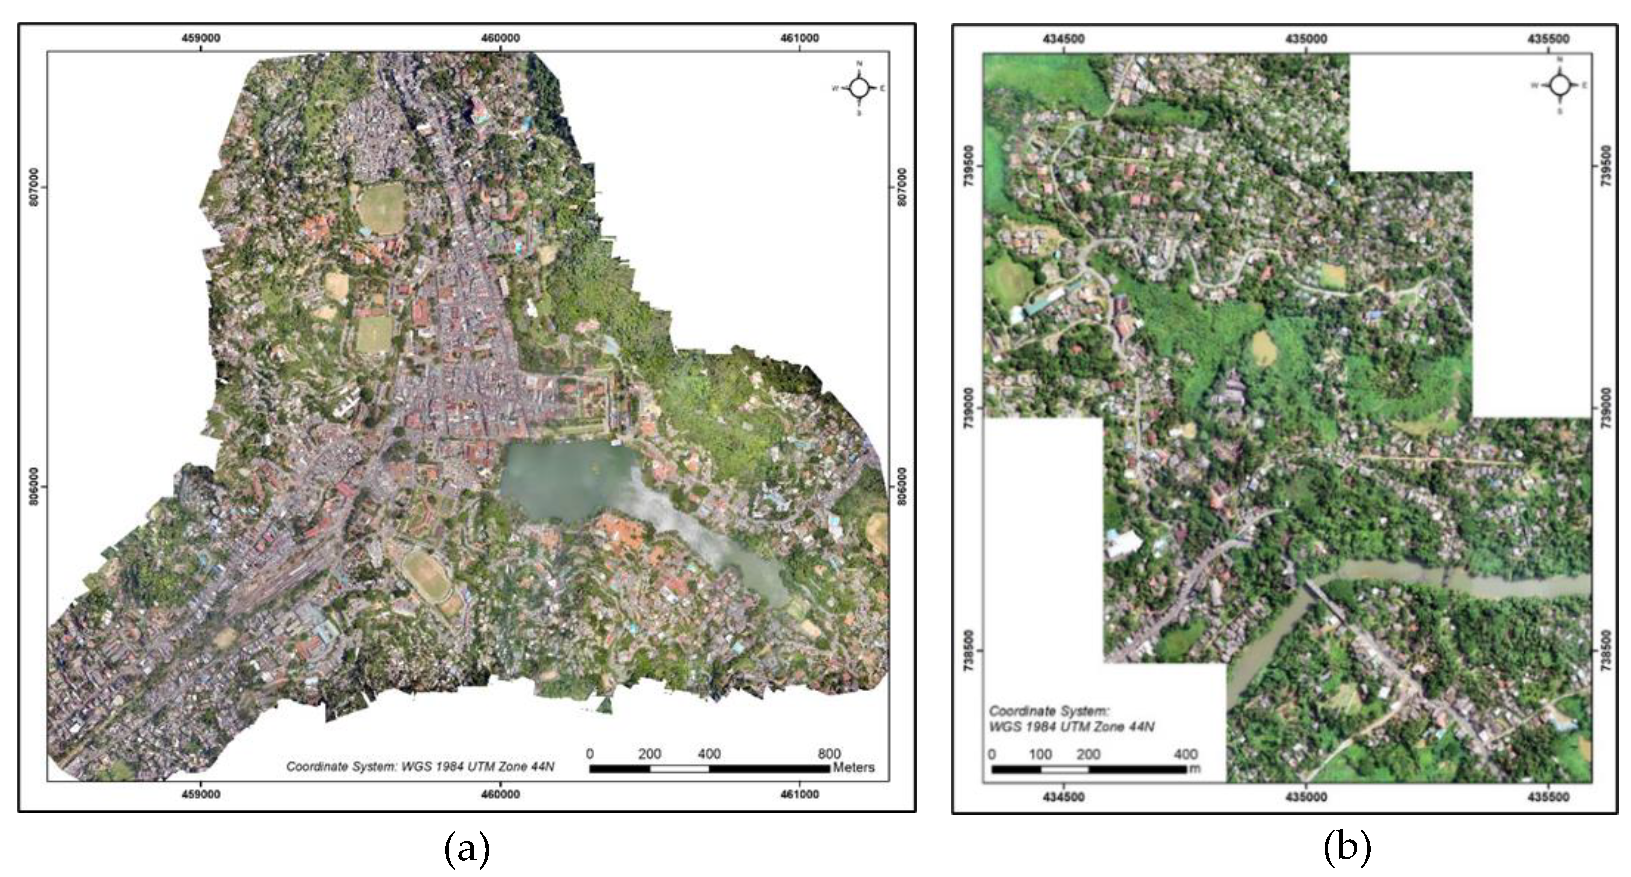
2.1. Dataset Selection and Study Area

Here, both high-resolution aerial images and UAV images were used as input data to train the model. Figure 2 shows the different datasets used for training validation and testing of the model, and they were related to the input dataset section in Figure 1. We used both aerial images and UAV images for model training to obtain a more generalized model and to provide the ability to detect building footprints from images with different spatial resolutions.
The Inria Aerial Imagery dataset [27] was used for high-resolution aerial images. The Inria datasets contained aerial orthorectified color imagery with a spatial resolution of 30 cm. The ground truth data consisted of two semantic classes: building and non-building. The images in the dataset covered dissimilar urban settlements in the US and Austrian areas. For this study, the different urban settlement types, Austin, Chicago, and Vienna, were selected from this dataset to train the model.
UAV data is considered a convenient method for collecting timely data at a low cost and obtaining high-resolution images and highly accurate orthoimages. A UAV orthomosaic of Kandy, Sri Lanka, was selected to train the proposed model using UAV data. This dataset was taken in 2018 for an urban development project, and it had an area of 3.7 km2 (Figure 3a). The manually digitized buildings from the UAV image were also available and contained 3,960 building polygons. The spatial resolution of the images was 5 cm. Compared with the Inria dataset, the UAV images had a higher spatial resolution, and the clarity of the buildings was higher.
Another UAV orthomosaic was used only as test data belonging to Ratnapura, Sri Lanka, to test the proposed model’s inference with entirely new data to the model. This dataset was taken in 2019 for a highway construction project, and it had an area of 1.42 km2 with a 6 cm spatial resolution (Figure 3b). There were 1189 manually digitized building polygons for this area. Compared to other cities used here, the Ratnapura orthomosaic was considered a more rural area with lower building density.

2.2. Data Pre-processing

Following pre-processing, steps were conducted to improve the quality of the dataset and generate a ML readable dataset.
  • Tiling the two UAV Orthomosaics of Kandy and Rathnapura into 5000 × 5000 pixel tile sizes;
  • Removing partially captured images from the two UAV datasets;
  • Converting the building polygon shapefiles of the above two areas into raster data corresponding to image tiles;
  • Resizing all the tiles of both aerial images and UAV images into a 1024 × 1024 pixel size; and
  • Creating four training datasets by applying four different image-enhancing algorithms: gamma correction [32], histogram equalization [33], contrast limited adaptive histogram equalization (CLAHE) [33], and logarithmic correction [34]. These techniques were selected because they are widely used for remote sensing images to enhance brightness, contrast, and color adjustments.

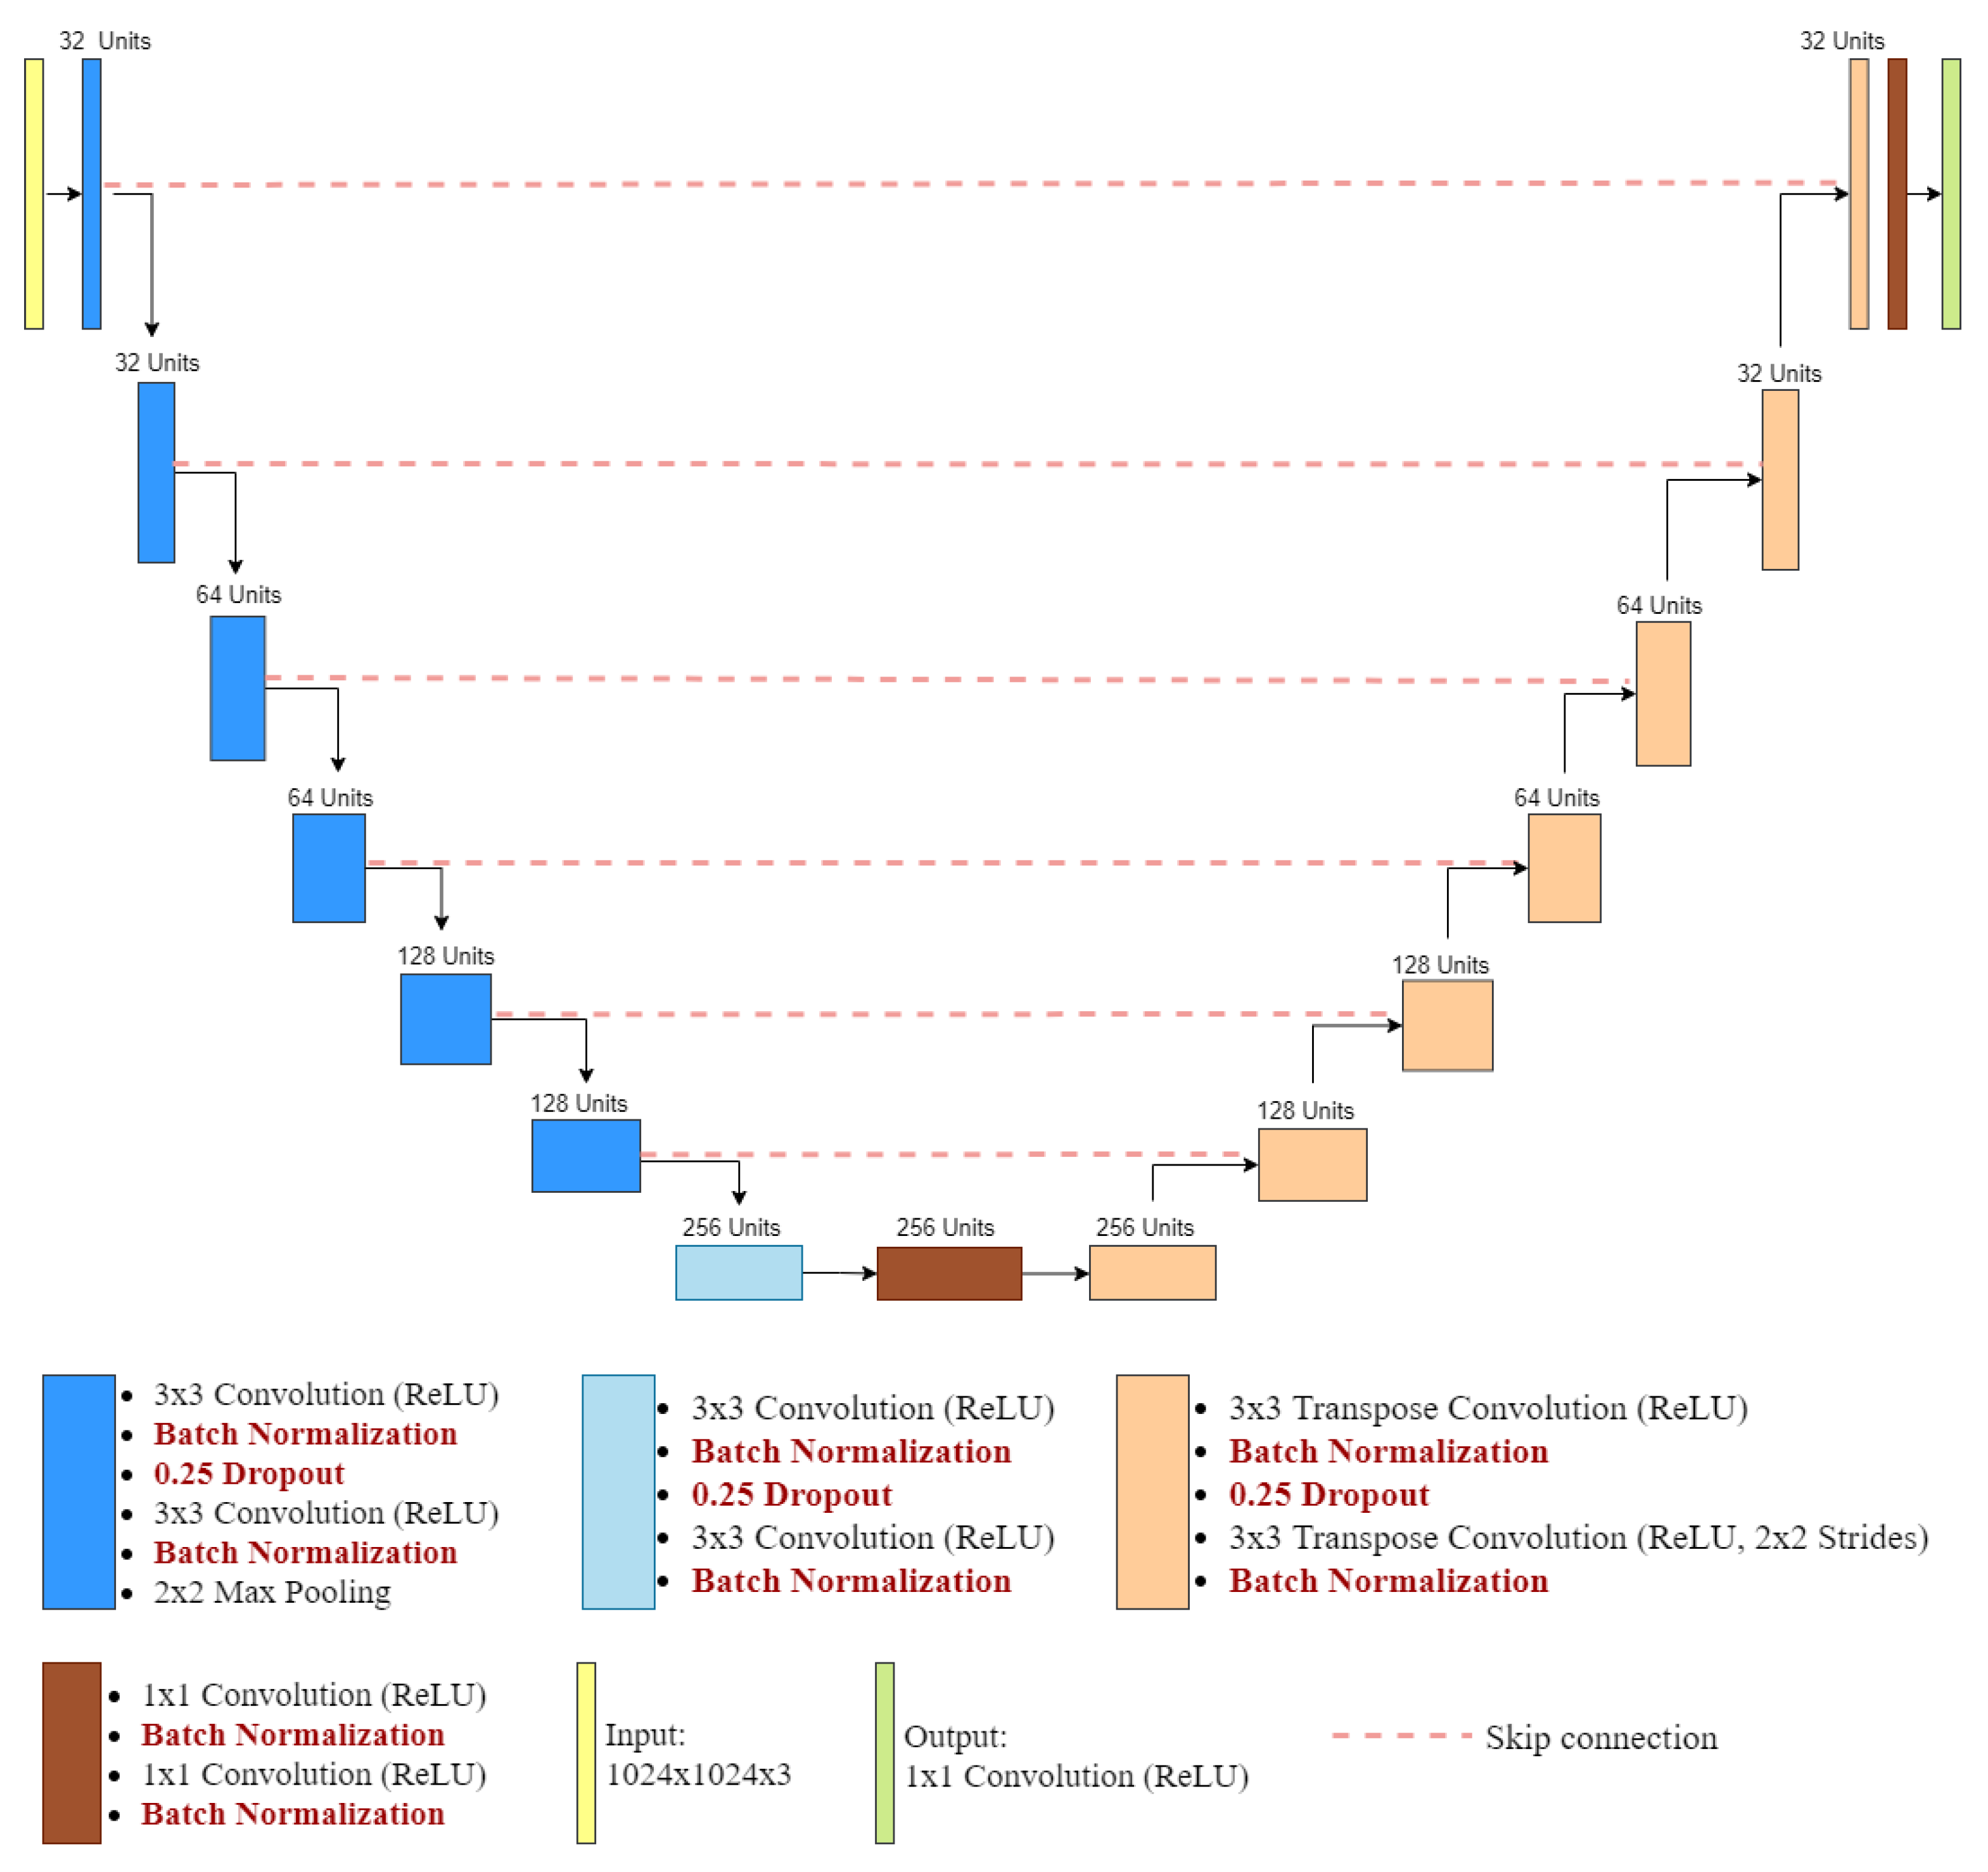
2.3. Proposed Neural Network Architecture: A Modified U-Net Model

Here, the U-Net architecture introduced by Ronneberger et al. [24] was modified to aim at the semantic segmentation of building footprints in both aerial images and UAV images of different cities in the world. Figure 4 shows a diagram of the proposed U-Net architecture. The proposed network comprised convolutional and deconvolutional layers. As Figure 4 shows, in the encoder part, convolutional layers consisted of 3 × 3 filters and generated down-sampled outputs by convolved using ReLU followed by max pooling. In the decoder part, transposing convolutional operations with and without stride up-samples were used. The output of the encoder produced another image with the exact size of the input image as the final output. Each corresponding down-sampling and up-sampling output with the exact sizes were connected (skip connections) by a concatenation operation. This allowed the gradient (information) to pass through different levels of the network efficiently. Dropouts and batch normalizations were added to increase the model performance and improve the model stability (see the dark red section in Figure 4). Compared to the original U-Net architecture [24], the depth of the model and the number of skip connections were increased to accurately segment the variety of buildings from different data sources. The size of the model was decreased by reducing the number of trainable weights to reduce the training time and the required graphics processing unit (GPU).

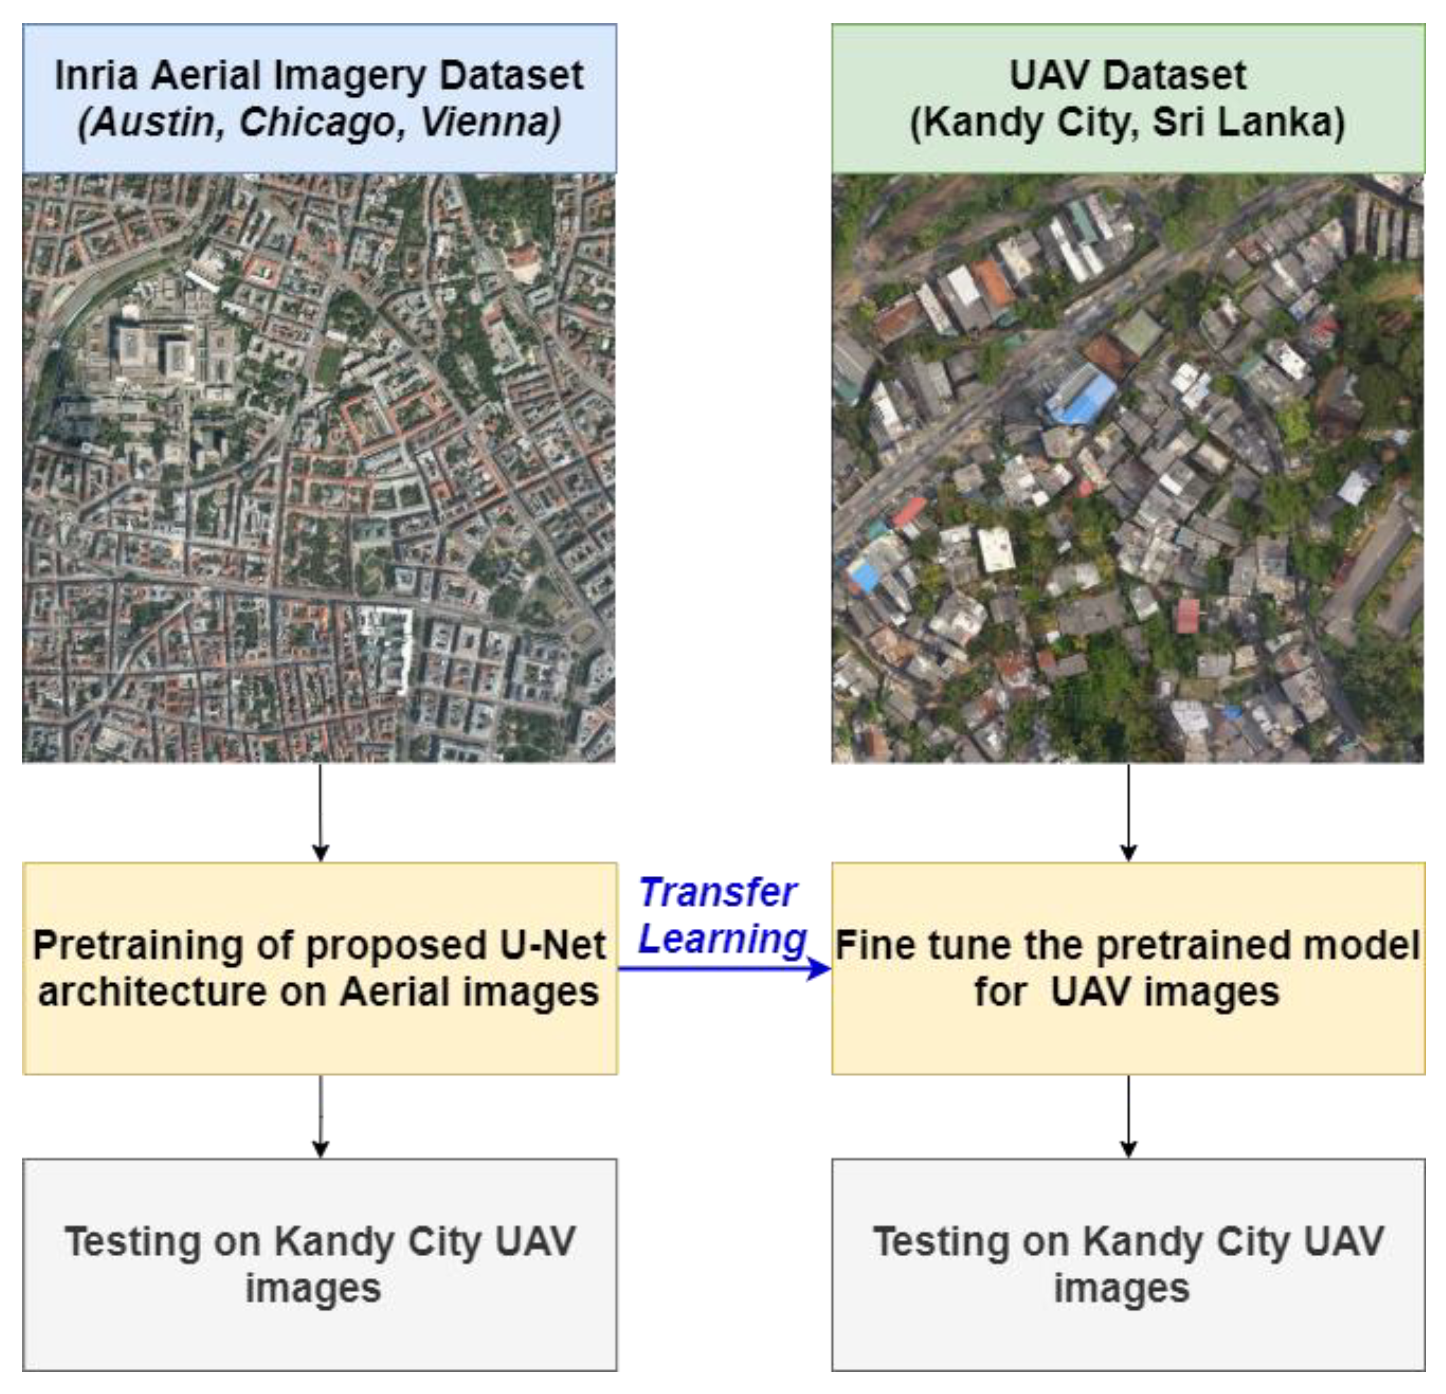
2.4. Transfer Learning Approach for Building Footprint Extraction from Different Data Sources

This study demonstrates a transfer learning approach to investigate its effect on building extraction using different data sources (see Figure 5). Training a DL model from scratch requires a significant amount of training data and considerable training time. If only a few images are used for training the model, overfitting will occur. The transfer learning method solves this challenge because the weights of a pre-trained model from a large dataset is used as the initial value of a new model. In other words, a pre-trained model can be used as a new model for feature extraction in a new context.
Figure 5 represents the methodology for the transfer learning approach section in Figure 1. The proposed U-Net architecture was pre-trained using the aerial images of Inria dataset and the weights were transferred into a new model for fine-tuning the building extraction process from UAV images.

2.5. Post-Processing with Polygonization and Polygon Smoothing

Up to this point, building footprints from the test datasets were generated in raster format. Converting them to polygons would be more beneficial because polygon layers could be directly used in any GIS platform and could be applied spontaneously in industrial applications. The following post-processing steps were conducted to polygonize the predicted building footprint mask into a vector shapefile format and smoothing the polygon shapes.
  • Georeferencing building prediction raster tiles using coordinate information of the corresponding input tiles;
  • Merging the georeferenced building prediction tiles city-wise to create a complete building mask raster layer for each city;
  • Converting merged raster layers into a building polygon shapefile format; and
  • Testing with three polygon smoothing algorithms with different smoothing ratios to determine which smoothing algorithm yields the best results:
    • Douglas–Peucker algorithm [35];
    • Visvalingam’s effective area algorithm [36];
    • Visvalingam’s weighted area algorithm [37].

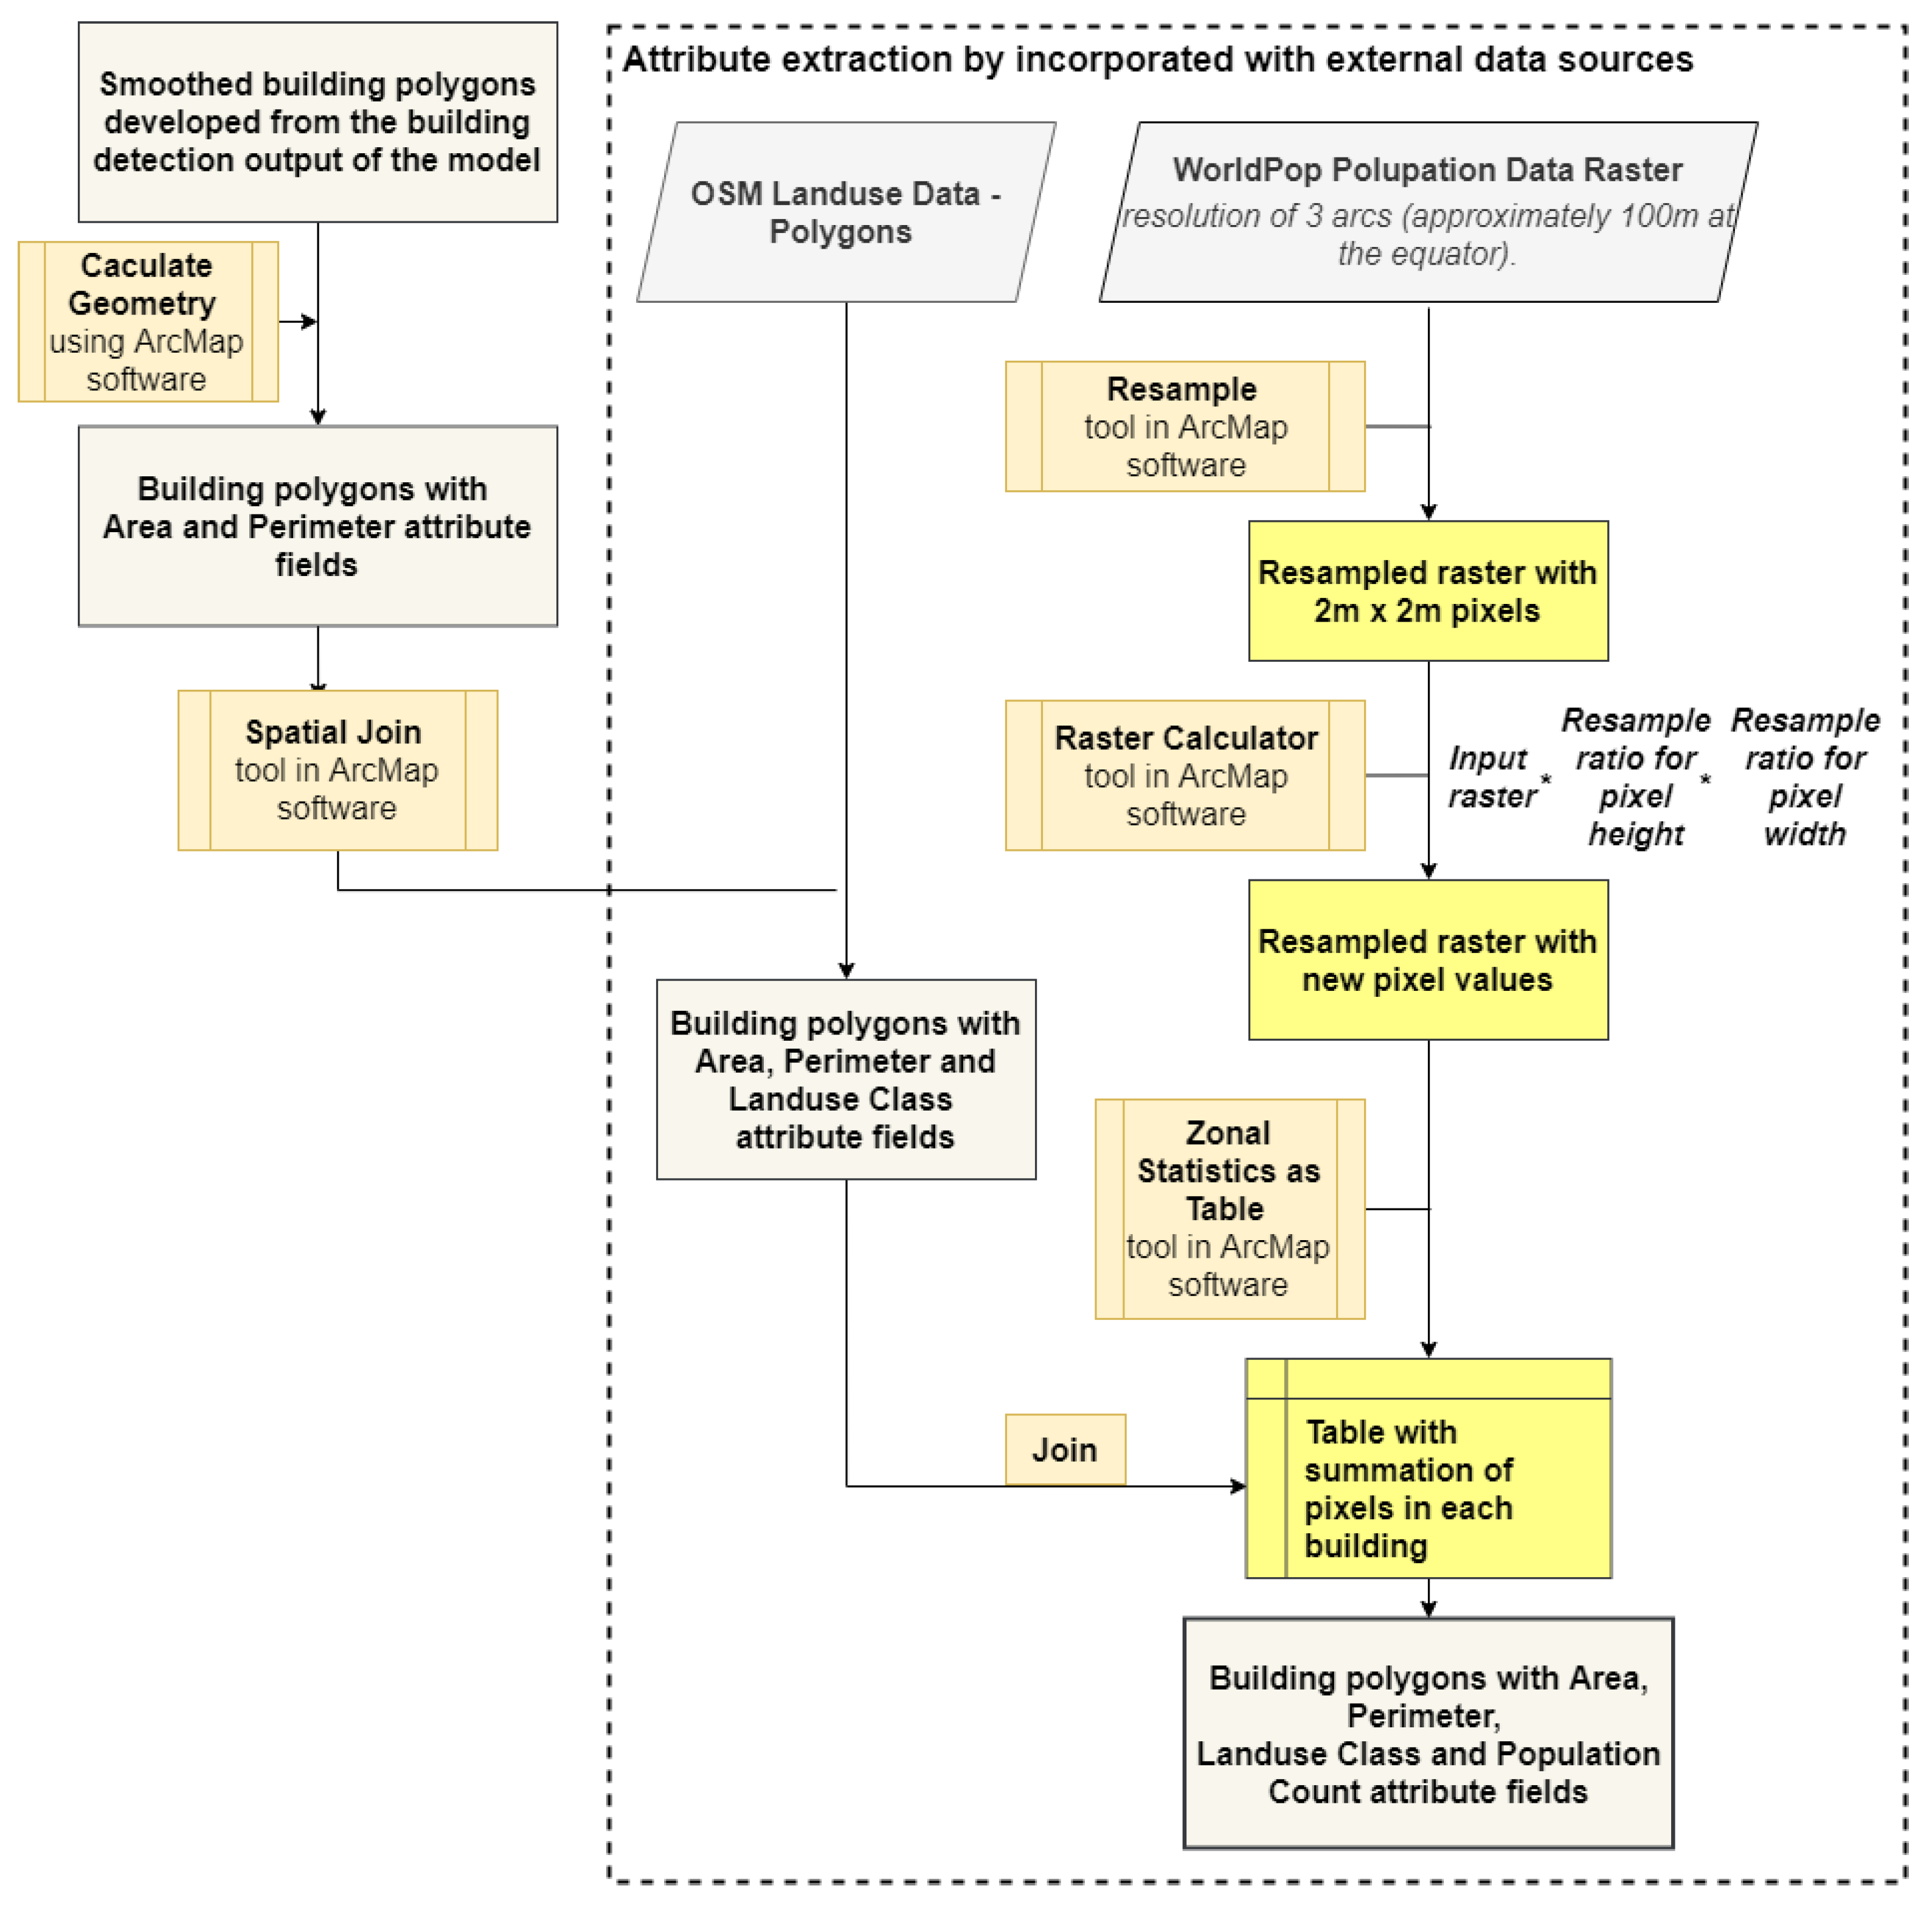
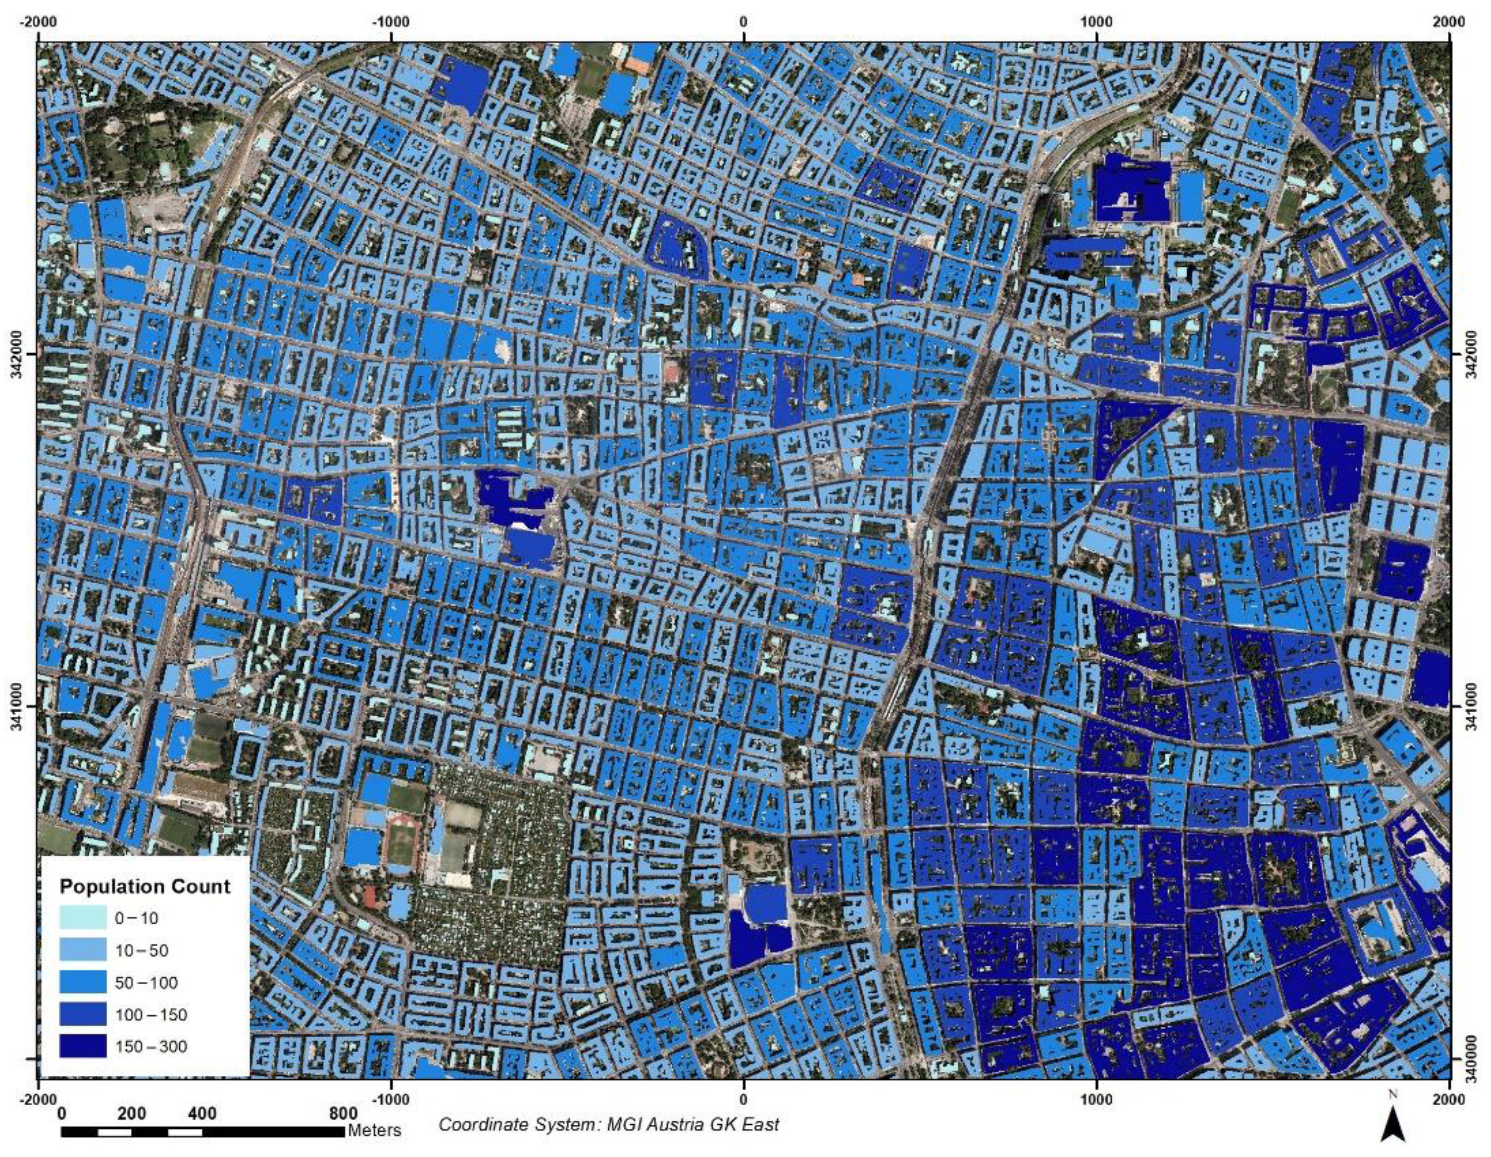
2.6. Attribute Extraction

Building footprints resulting from DL segmentation models do not contain any useful information as attributes of the predicted layer. Thus, including different attribute information to the building layer would be beneficial when using these building polygons in real-world applications such as urban planning and urban development monitoring. Therefore, in the final stage of the proposed methodology, different attribute categories were extracted into the building footprint vector polygon layer based on building geometry and by incorporating it with other data sources. Figure 6 shows the proposed methodology for the attribute extraction process, representing a more detailed methodology for the attribute extraction section in Figure 1.
As the geometry data, each building’s area and perimeter were calculated and added to the polygon shapefile as attribute fields. Next, to incorporate land use classes into the building polygons, Open Street Map (OSM) land use data was selected because it is an open dataset and is available in most countries worldwide. Therefore, it was considered more generalized to any country or city regarding land use classes [38]. The Spatial Join tool in ArcMap software was used to add land use data to the smoothed building polygons. This process involved matching attributes from the OSM land use layer to the building polygon layer based on their relative spatial locations.
As population data, we selected WorldPop population count data because this dataset is also an open dataset available for most countries worldwide [39]. The WorldPop dataset consists of raster images in GeoTIFF format, and the resolution is three arcs that are nearly equal to 100 m at the equator. The units represent the number of people per pixel. A dasymetric method was used to add population count data to each building (Figure 6). Because the WorldPop raster data had a low resolution, it was resampled into 2 m × 2 m pixel size by considering that all the buildings in the study cities were larger than the building area of 4 m2. Next, the population counted for the new pixel sizes were calculated, and the total value of all pixels inside each building was calculated.

3. Results

This sections’ subsections illustrate the different results obtained from this research: model training details, building detection results from the model, results of the transfer learning approach, model detection accuracy with image pre-processing, results of polygonizing and polygon smoothing, and results of attribute extraction (Figure 7).
The proposed U-Net network was trained on a GPU on Google Colab. The Keras DL framework with the TensorFlow backend was employed for model implementation. The training details of the model were:
  • Total training time: 124 min;
  • Number of epochs: 200;
  • Batch size: 2;
  • Loss function: weighted root mean square error;
  • Optimizer: Adam;
  • Total parameters of the model: 4,241,089;
  • Input image size: 1024 × 1024 RGB images;
  • Output image size: 1024 × 1024 building mask images;
  • Total images: 155.

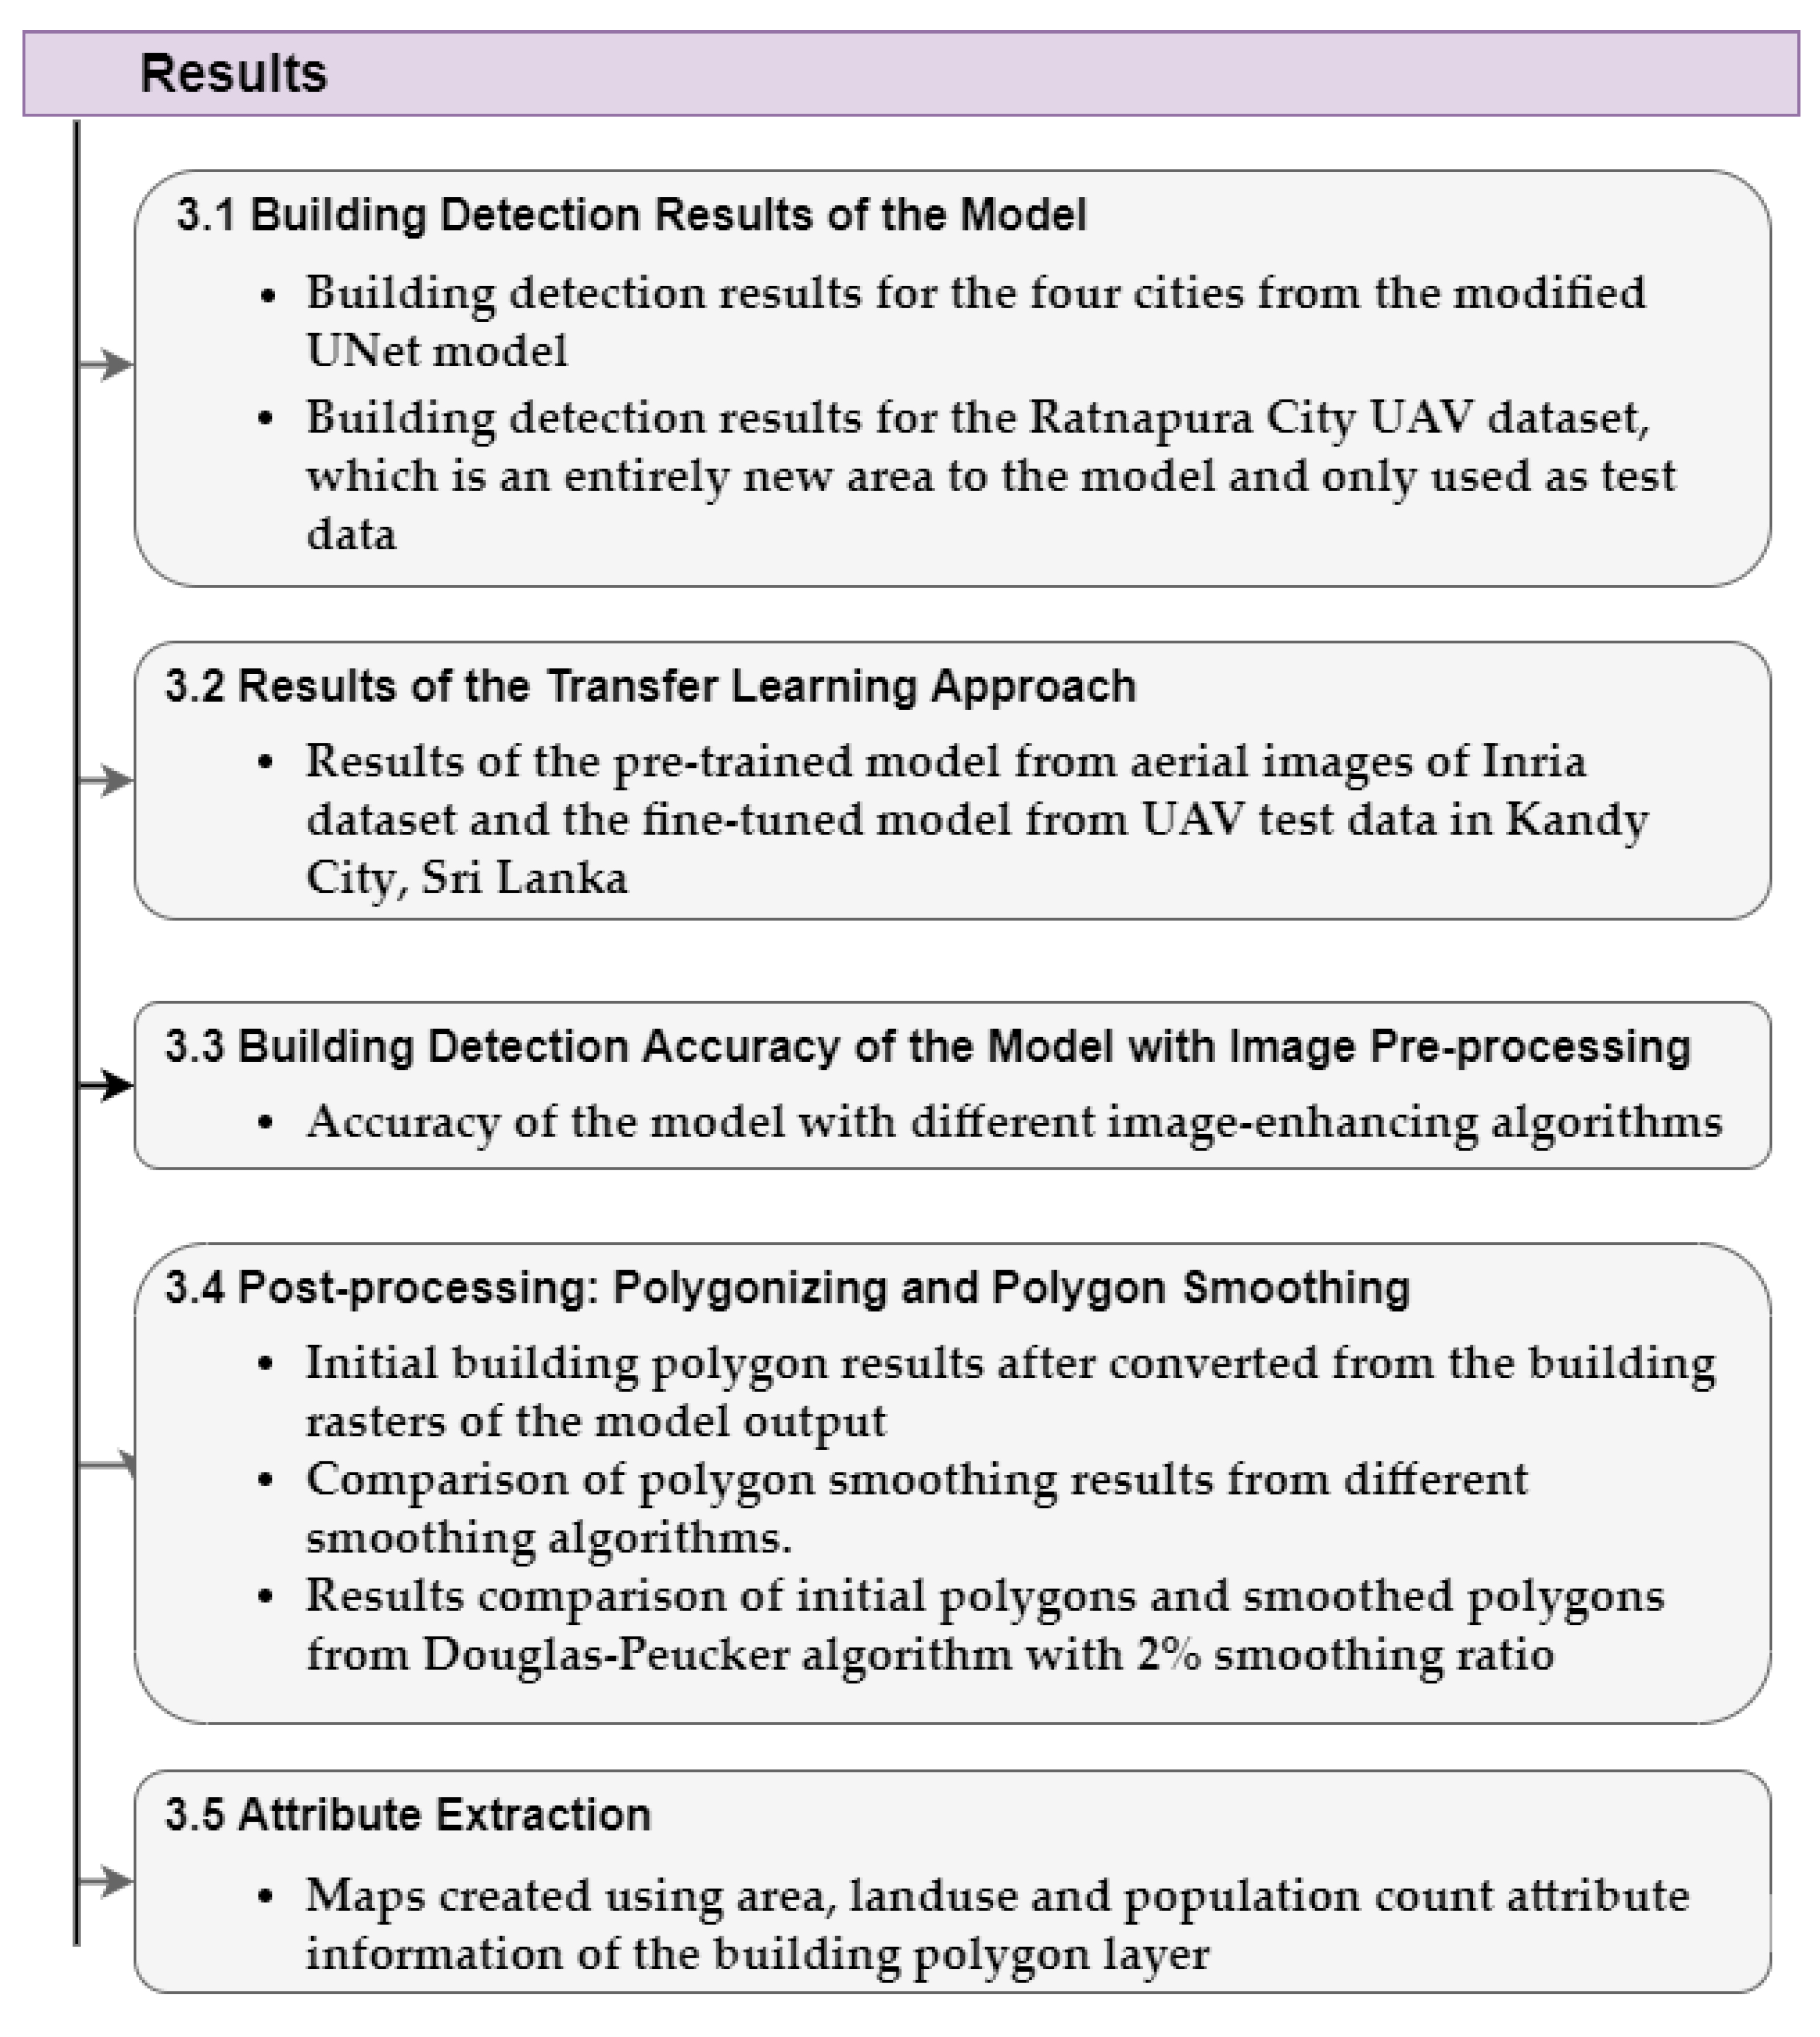
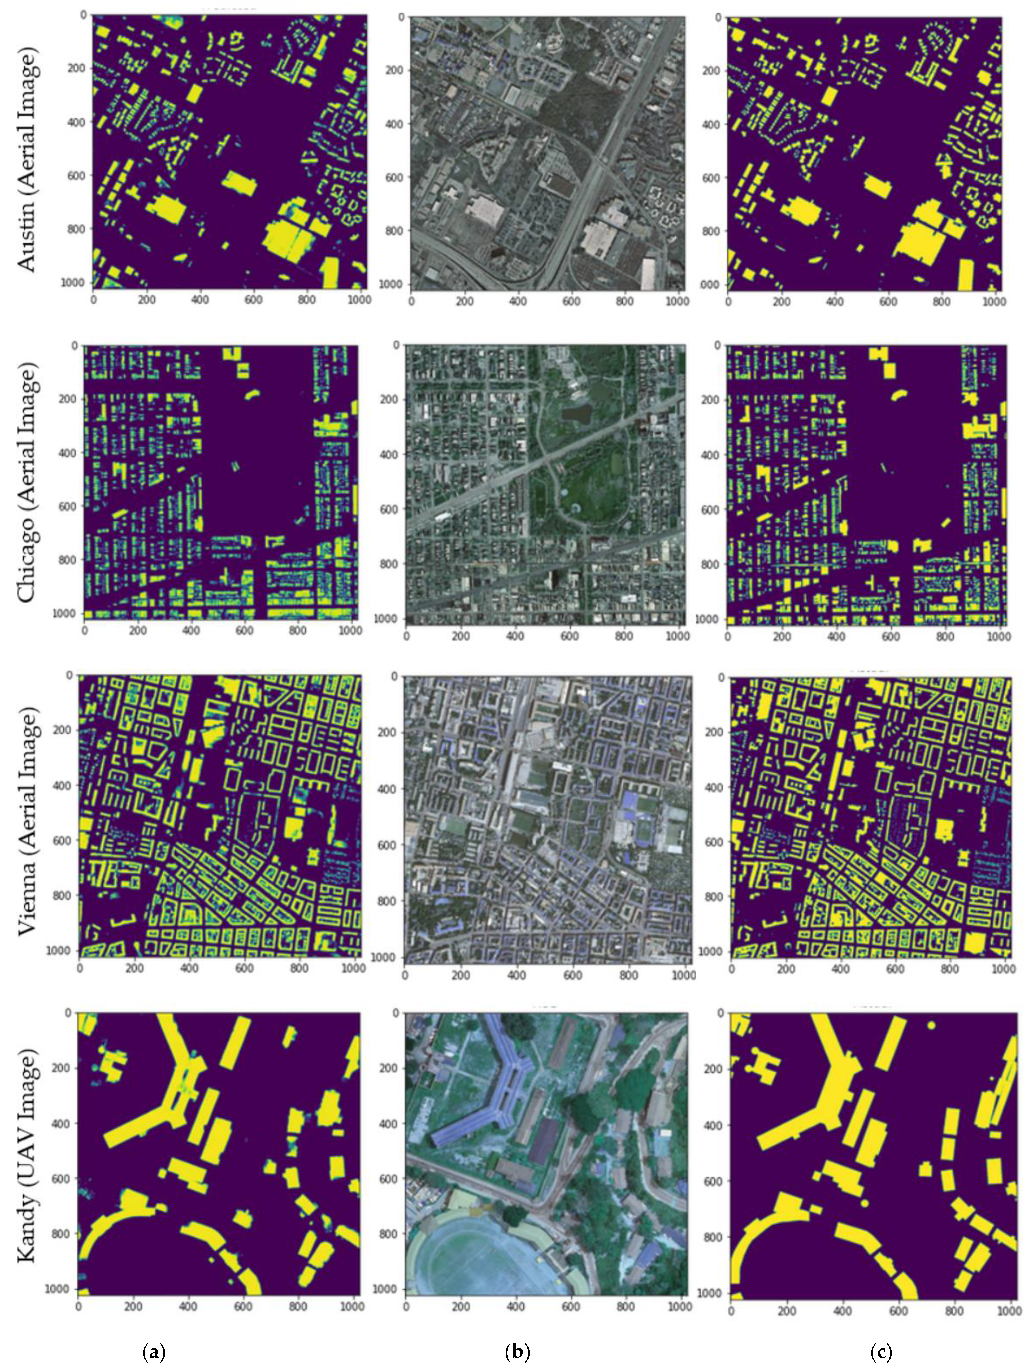
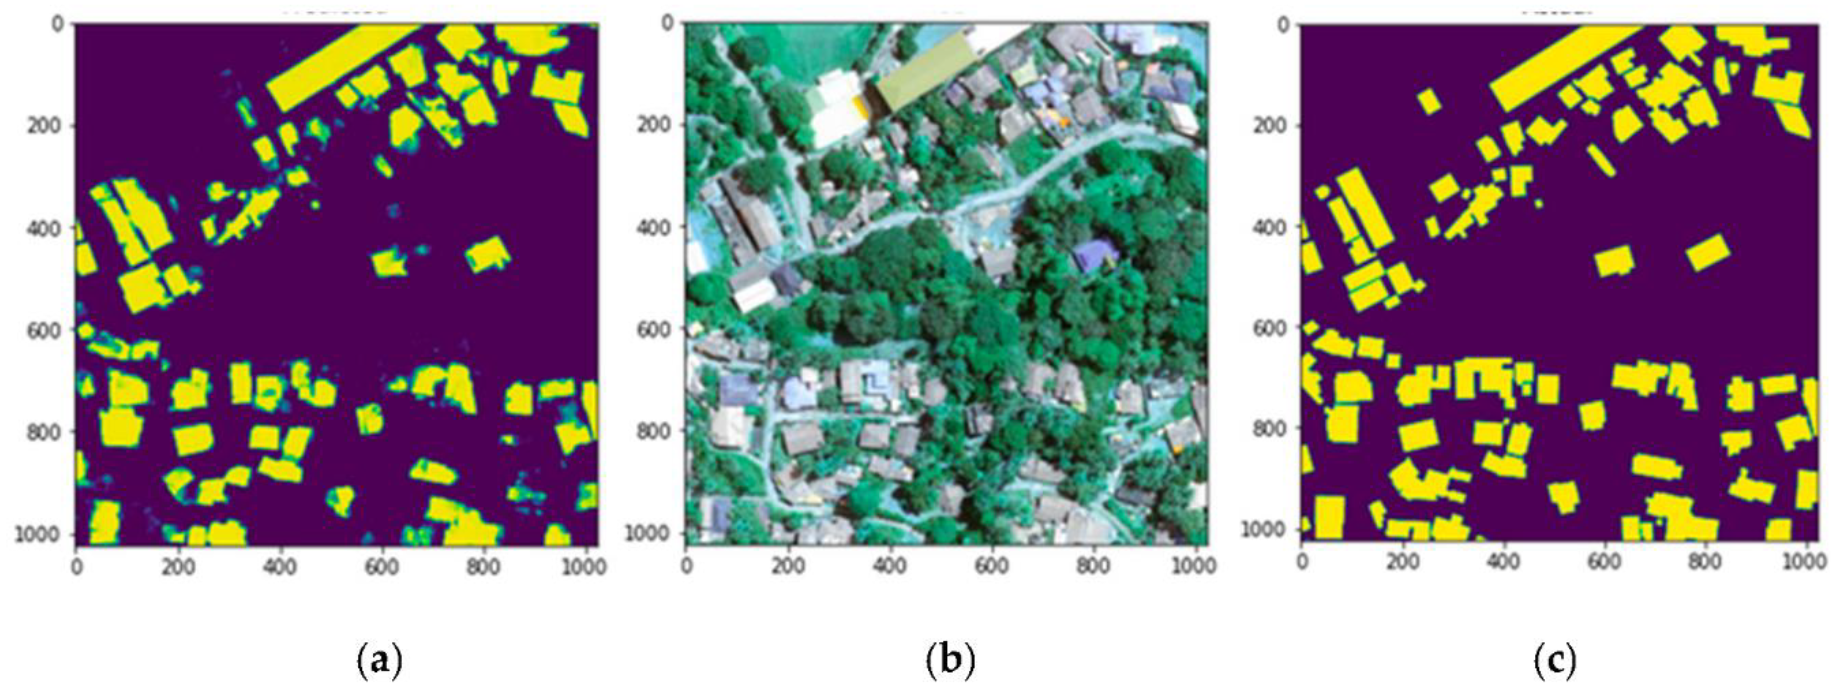
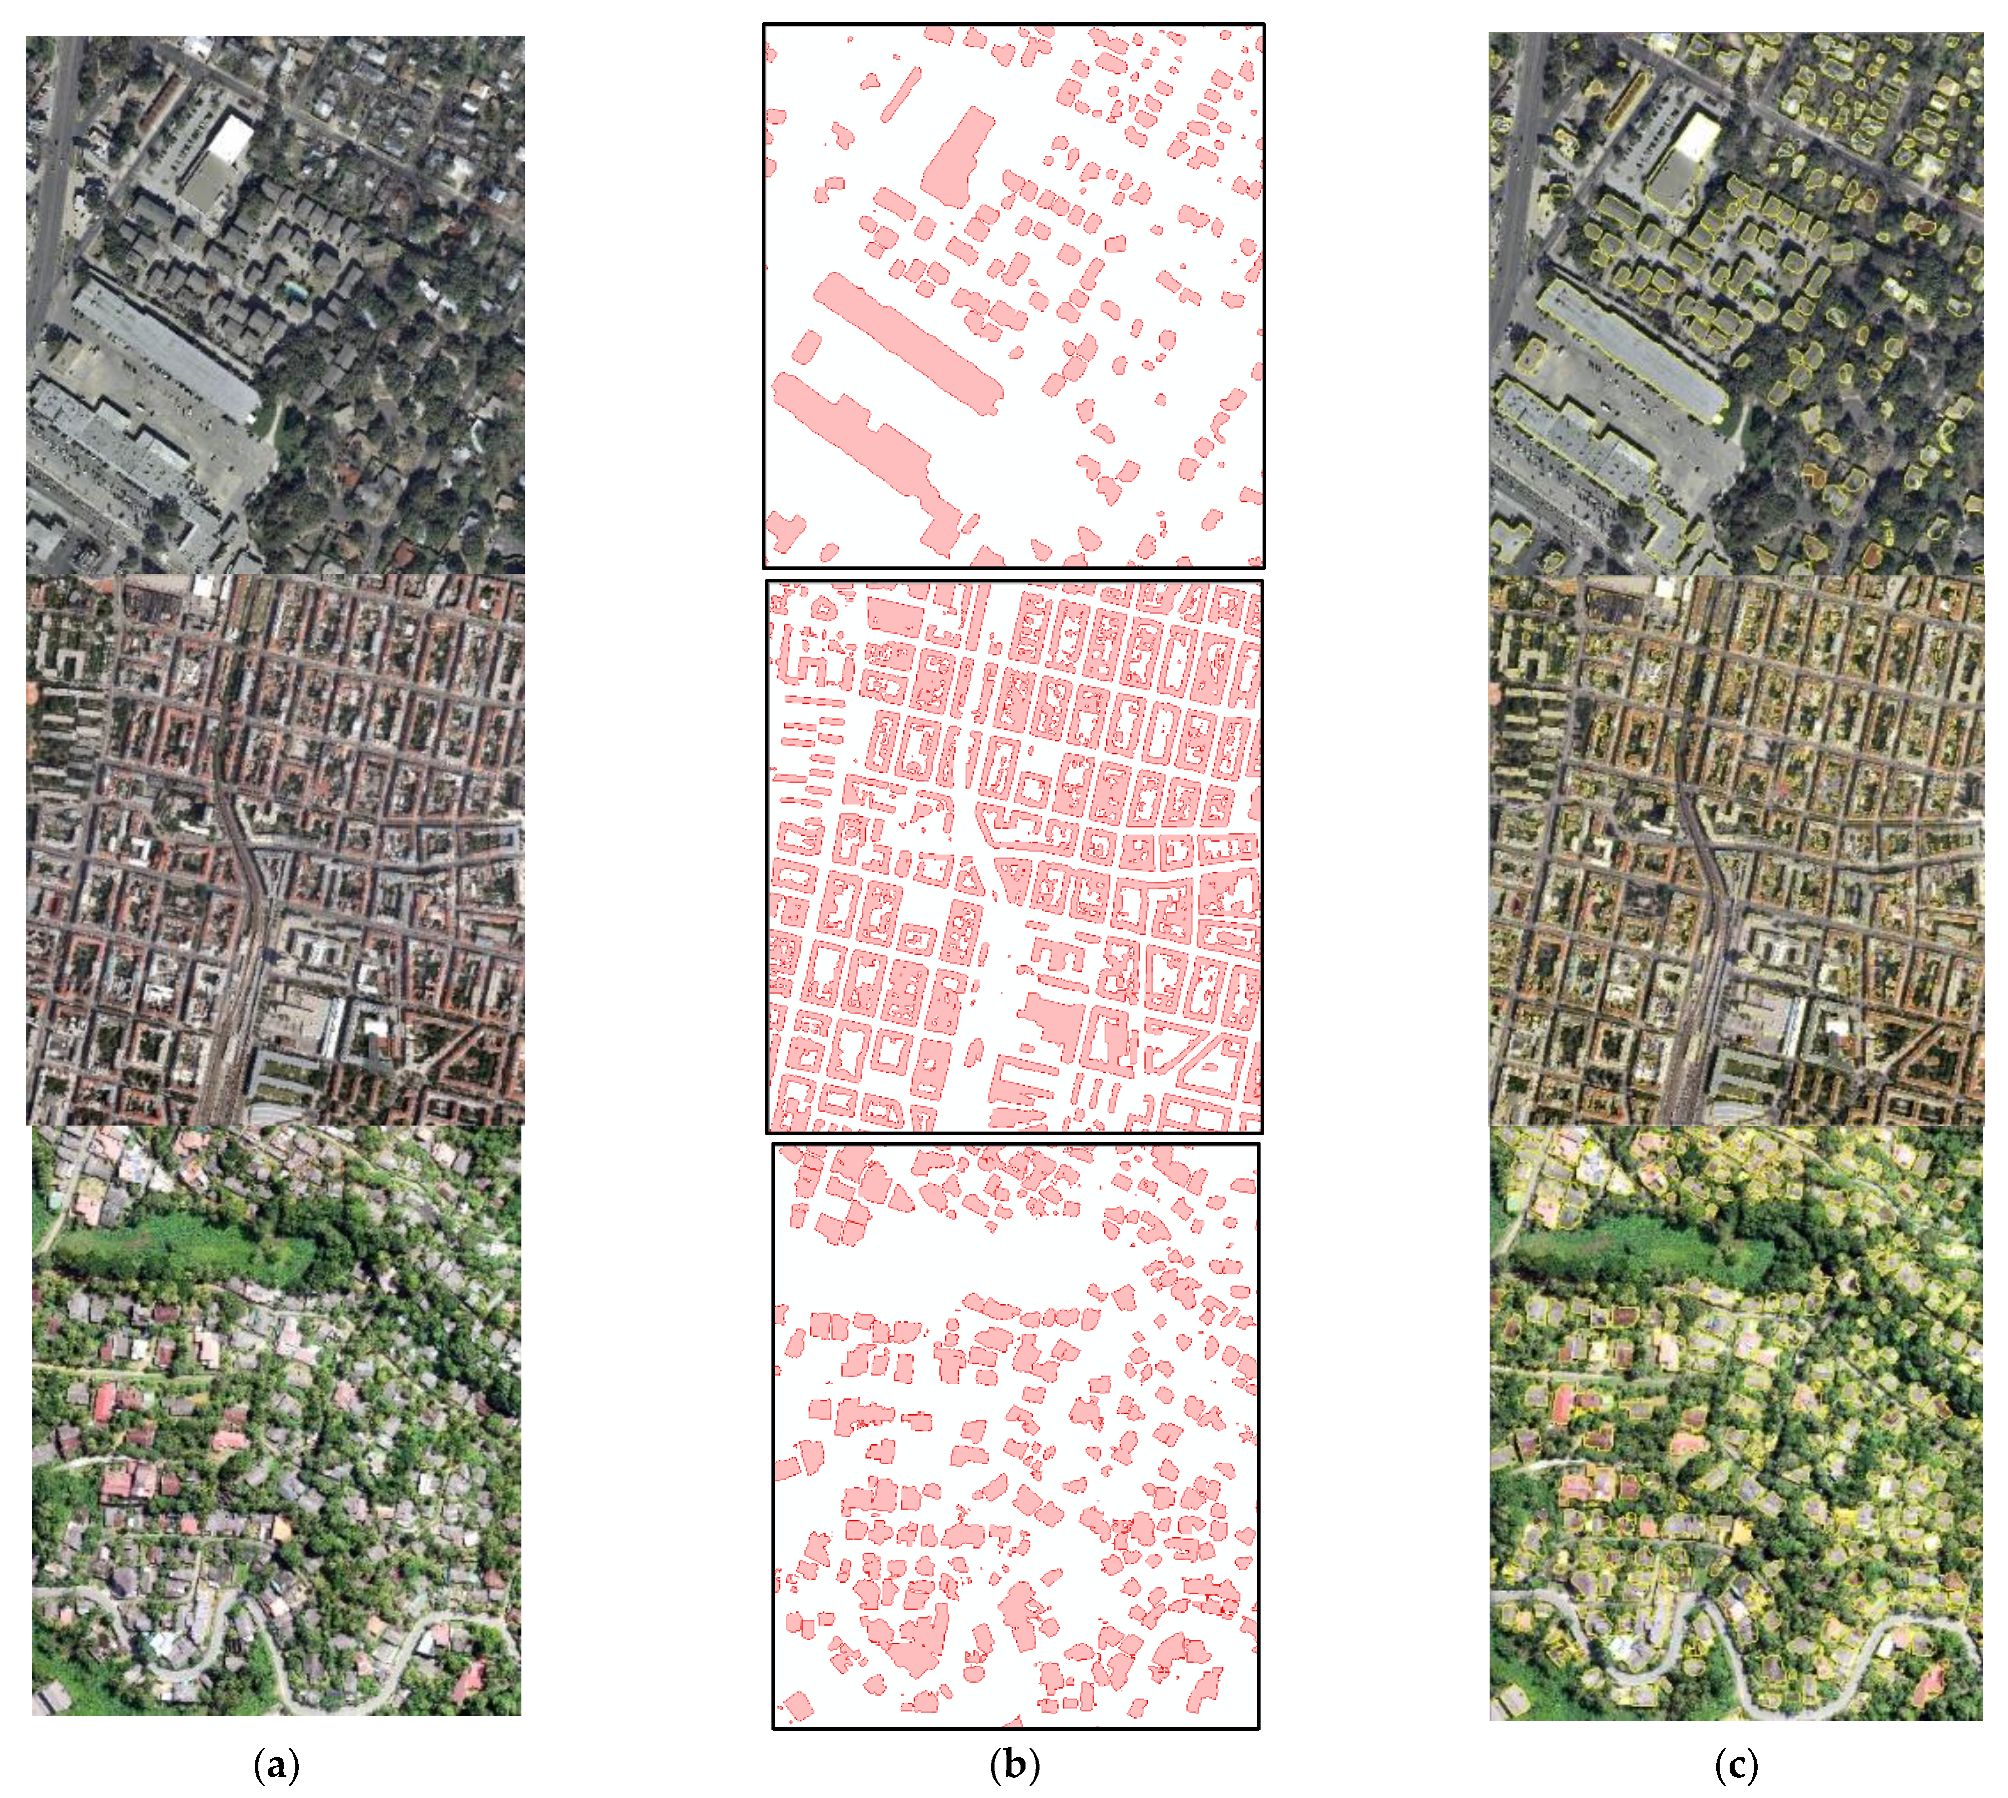
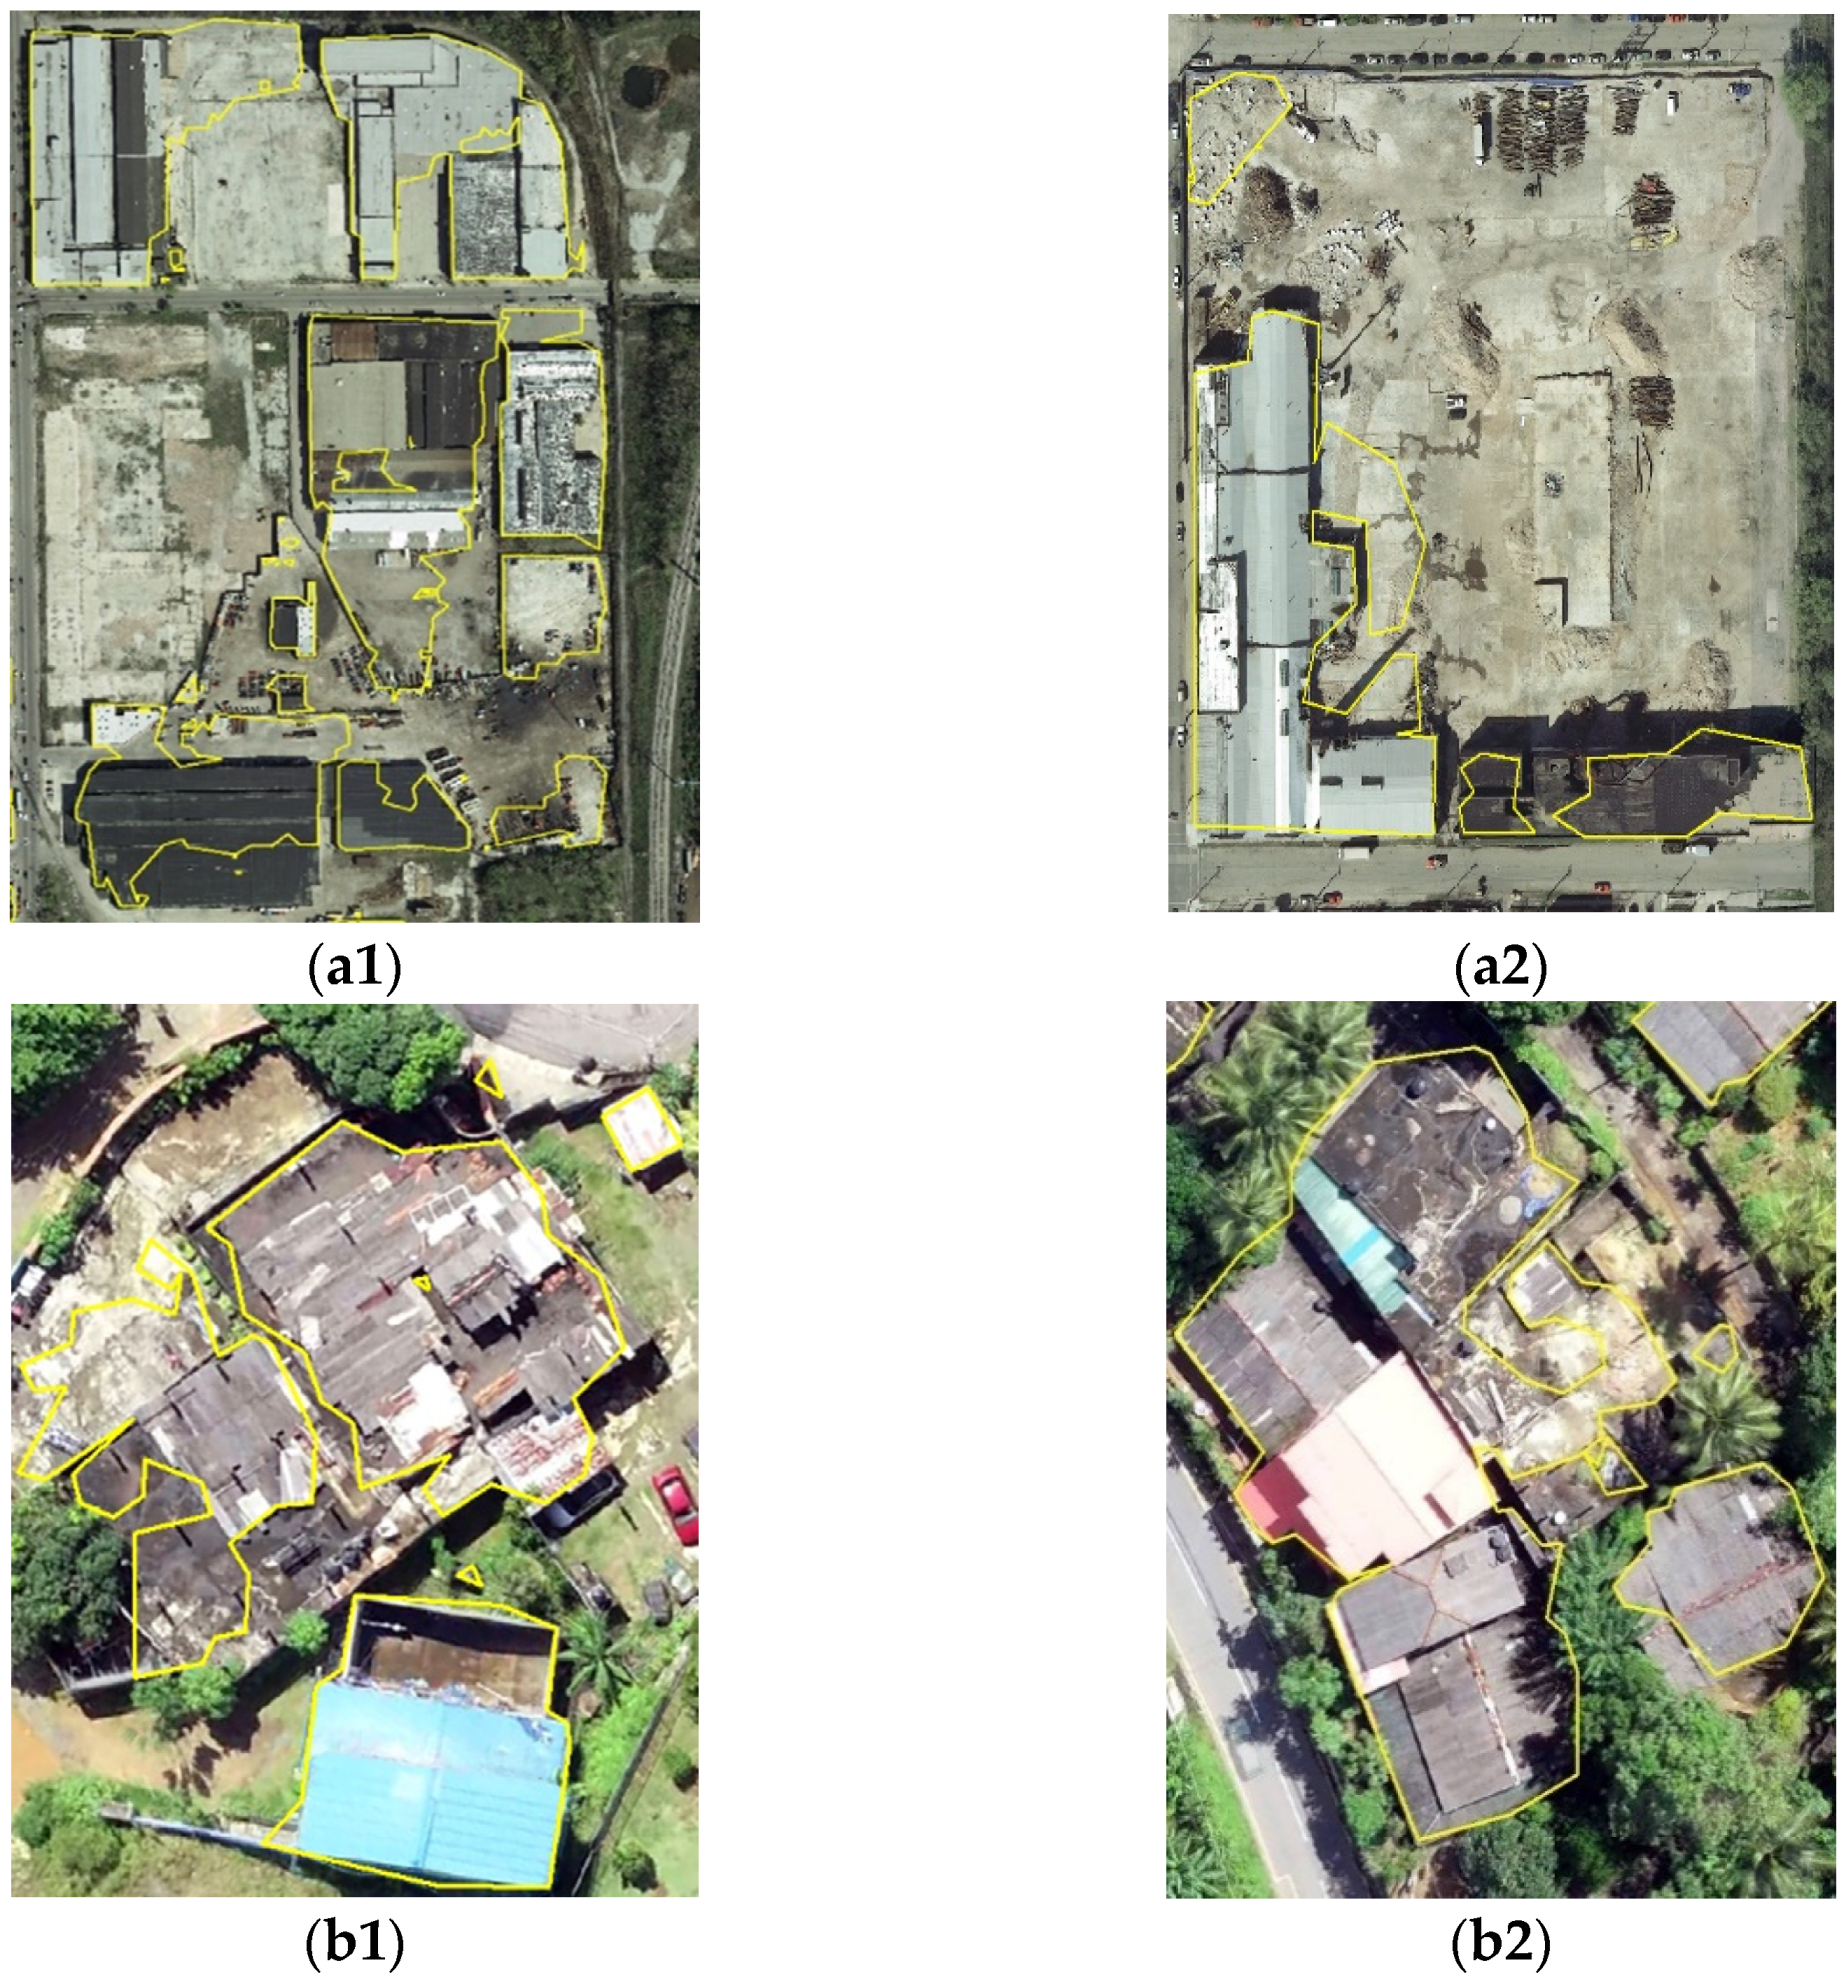
3.1. Building Detection Results of the Model

Figure 8 shows the results of the building detection from the modified U-Net model of some sample images from the test data in the four cities. Figure 8’s first column shows the model’s results, the second column shows the RGB images, and the third column shows the ground truth data. Table 1 shows the building detection accuracies of the proposed model for the four cities. According to the results in Table 1, the network performed better for UAV data in Kandy. This was because when compared with the Inria dataset, UAV images had a higher spatial resolution (30 cm on Inria images and 5 cm on UAV images), and the clarity of the buildings was higher. Therefore, the model performed well on the UAV data for building detection. Table 2 shows the average building accuracies of the validation data and test data for the four cities.
Next, to test the model performance with a new area, the proposed U-Net model was tested with a new UAV dataset belonging to Ratnapura, Sri Lanka, which was not used for training. In this dataset, 22 tiles with a size of 1024 × 1024 pixels were included. Figure 9 shows the building prediction results for the new dataset. Table 3 lists the model interference accuracy for the new dataset.

3.2. Results of the Transfer Learning Approach

The proposed U-Net architecture was pre-trained using the aerial images of the Inria dataset and transferred into a new model for fine-tuning the building extraction process from UAV images. Table 4 shows the results of the pre-trained model and the fine-tuned model from the UAV test data in Kandy, Sri Lanka.
The results in Table 4 reveal that the transfer learning approach improved the performance when fitting the model to data with a new context. Moreover, this strategy demonstrated that the number of epochs required and the training time was less to fine-tune the model for building extraction from different data contexts. Furthermore, compared to the accuracy results obtained by training the model from scratch using UAV and aerial images together, this transfer learning approach achieved almost similar accuracy with less training time. Finally, to extract building footprints from a new dataset with different properties, a transfer learning approach could preserve the low-level features from one dataset to another and can be reused without training from scratch.

3.3. Building Detection Accuracy of the Model with Image Pre-Processing

We evaluated the accuracy of the proposed model with each enhancing image algorithm, which was applied to the input images (see Table 5). According to the comparison of the results, it was evident that the Gamma correction method was not practical for both UAV and aerial images, which was used here because the accuracy was decreased. The building prediction accuracy for the aerial images was improved after applying the logarithmic correction method to the input images. The CLAHE method improved the building prediction accuracy for UAV images. The histogram equalization algorithm slightly improved the building prediction accuracy for both the UAV and aerial images.
We compared the accuracy of the proposed U-Net model with that of the original U-Net architecture [24], created for biomedical image segmentation (Table 6). Without adding batch normalization, the original model did not predict the buildings for the selected dataset. Table 6 shows the experimental results of the different DL architectures for building extraction. Compared with the original U-Net architecture, the performance of the proposed model was higher with an IoU of 33.4% with the same dataset.
According to the accuracy comparison in Table 6, the accuracy metrics of the model developed here were lower than those of state-of-the-art DL networks [26,30]. The main advantage of our DL network is that it is cost-effective because we developed it in Google Colab, generated outputs with less training time (124 min), and detected building footprints in both UAV and aerial images. Moreover, the main contribution of our research is to evaluate the effect of post-processing and generate polygon data with regularized boundaries, including beneficial attribute information. Our methodology can be applied to any state-of-the-art building detection network for semantic segmentation to generate building footprint polygons with attribute information.

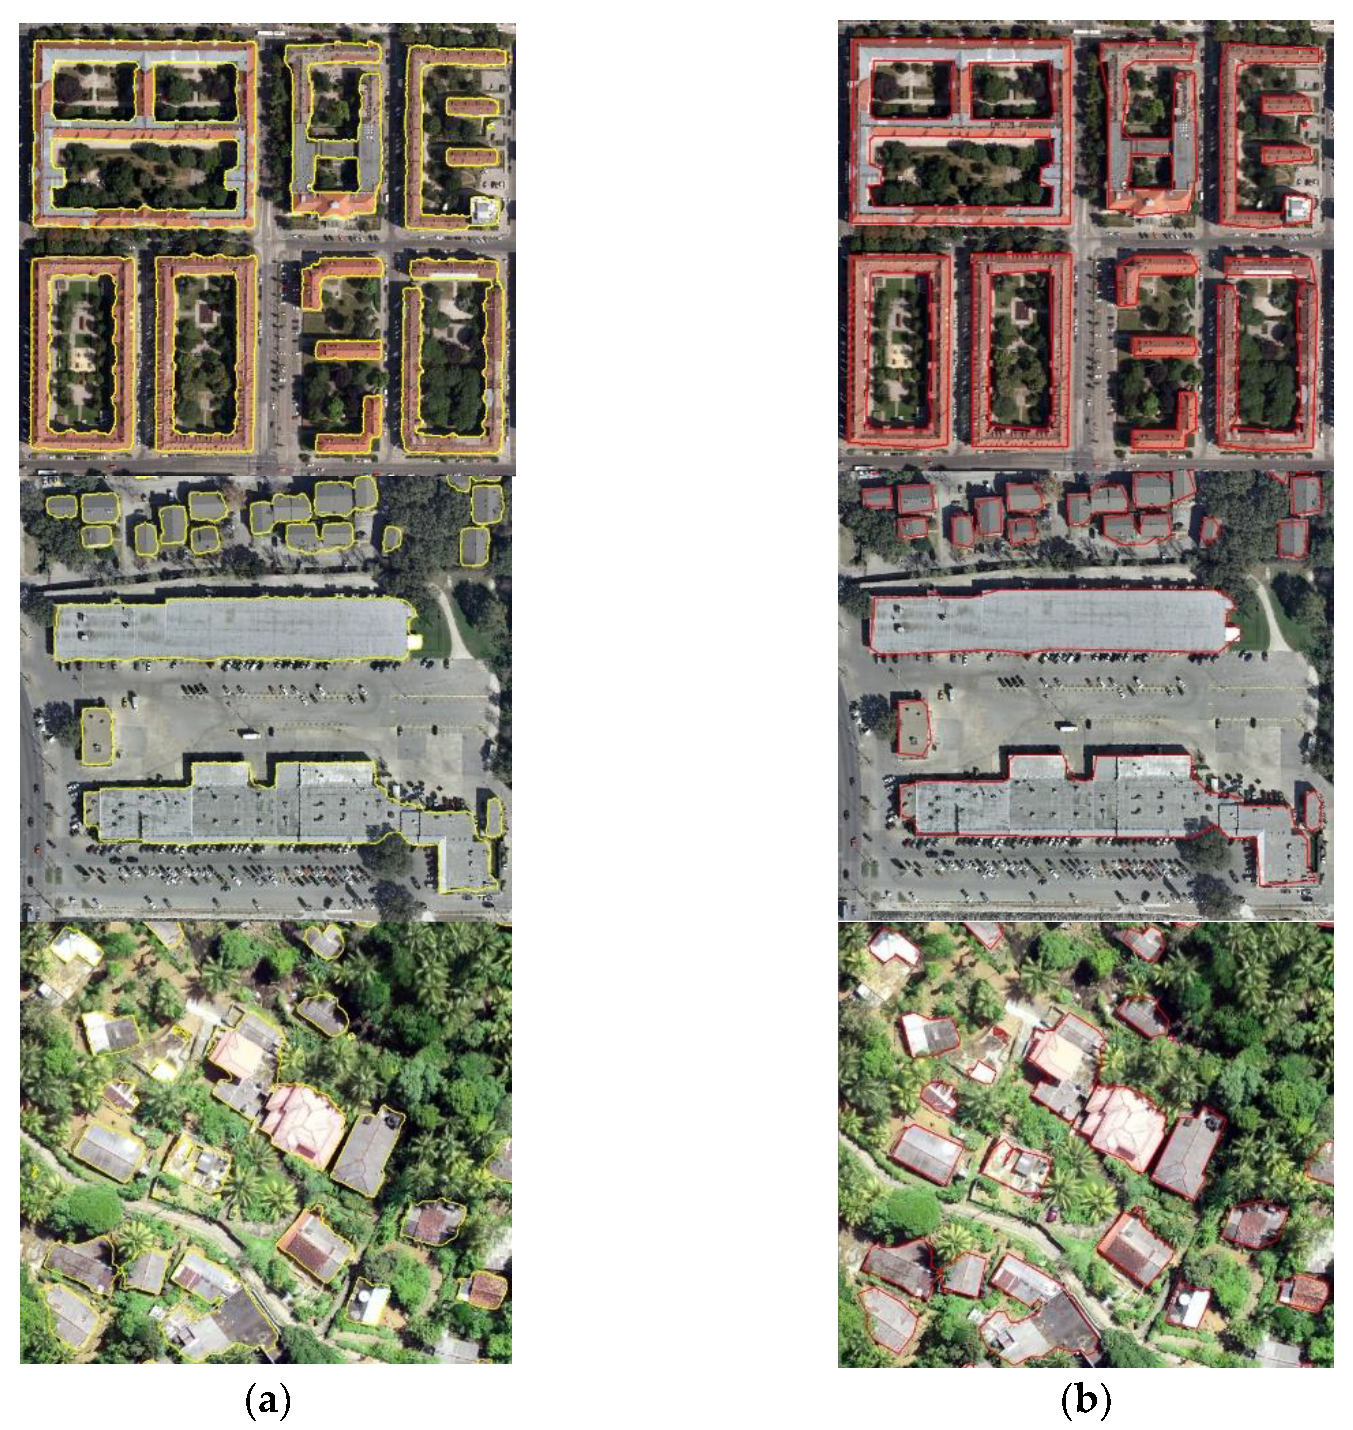
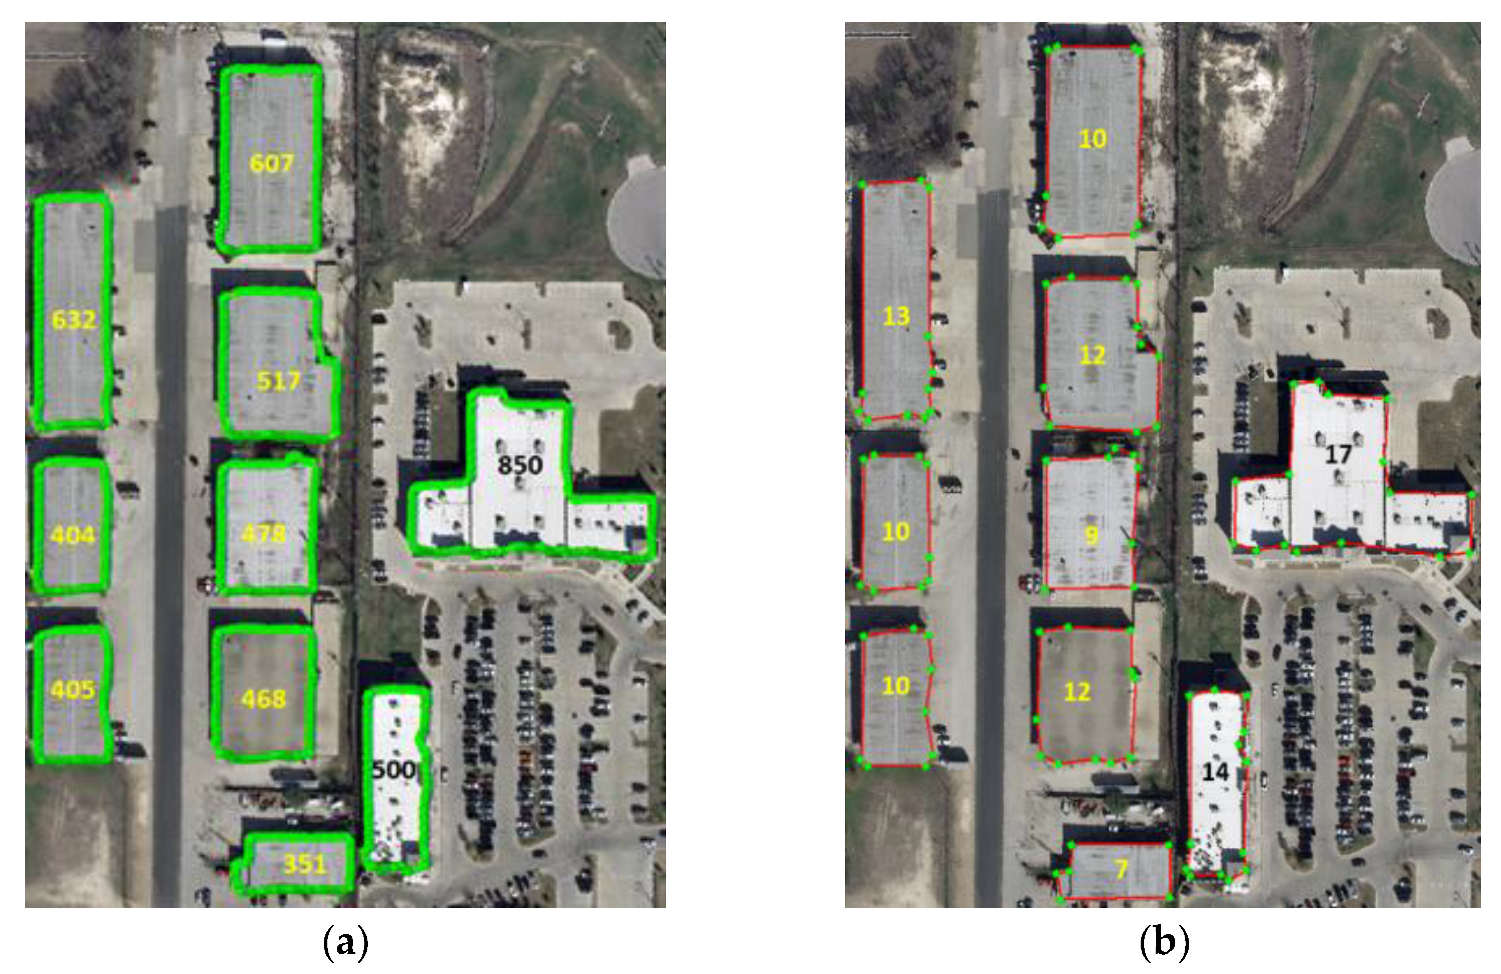
3.4. Post-Processing: Polygonizing and Polygon Smoothing

The predicted building raster masks were converted into polygon shapefiles, and Figure 10 shows some sample results. Next, the generated building polygons were tested with three polygon smoothing algorithms using the Mapshaper application, and Figure 11 shows the results. For simple building architectures with rectangular shapes, all three simplification algorithms yielded similar results. However, when the architecture of the buildings became more complicated (see the white dashed lines in the example images of Figure 11), polygons smoothed with the Douglas–Peucker algorithm showed more refined boundaries and were more similar to the actual building shape. Figure 12 compares the results of the initial polygons and smoothed polygons from the Douglas–Peucker algorithm (DPA) with a smoothing ratio of 2%. The smoothing process reduced the complexity of the building boundaries, resulting in a building polygon with more refined boundaries. Furthermore, it reduced the file size, which would be more convenient to use the building extraction results in another application area.

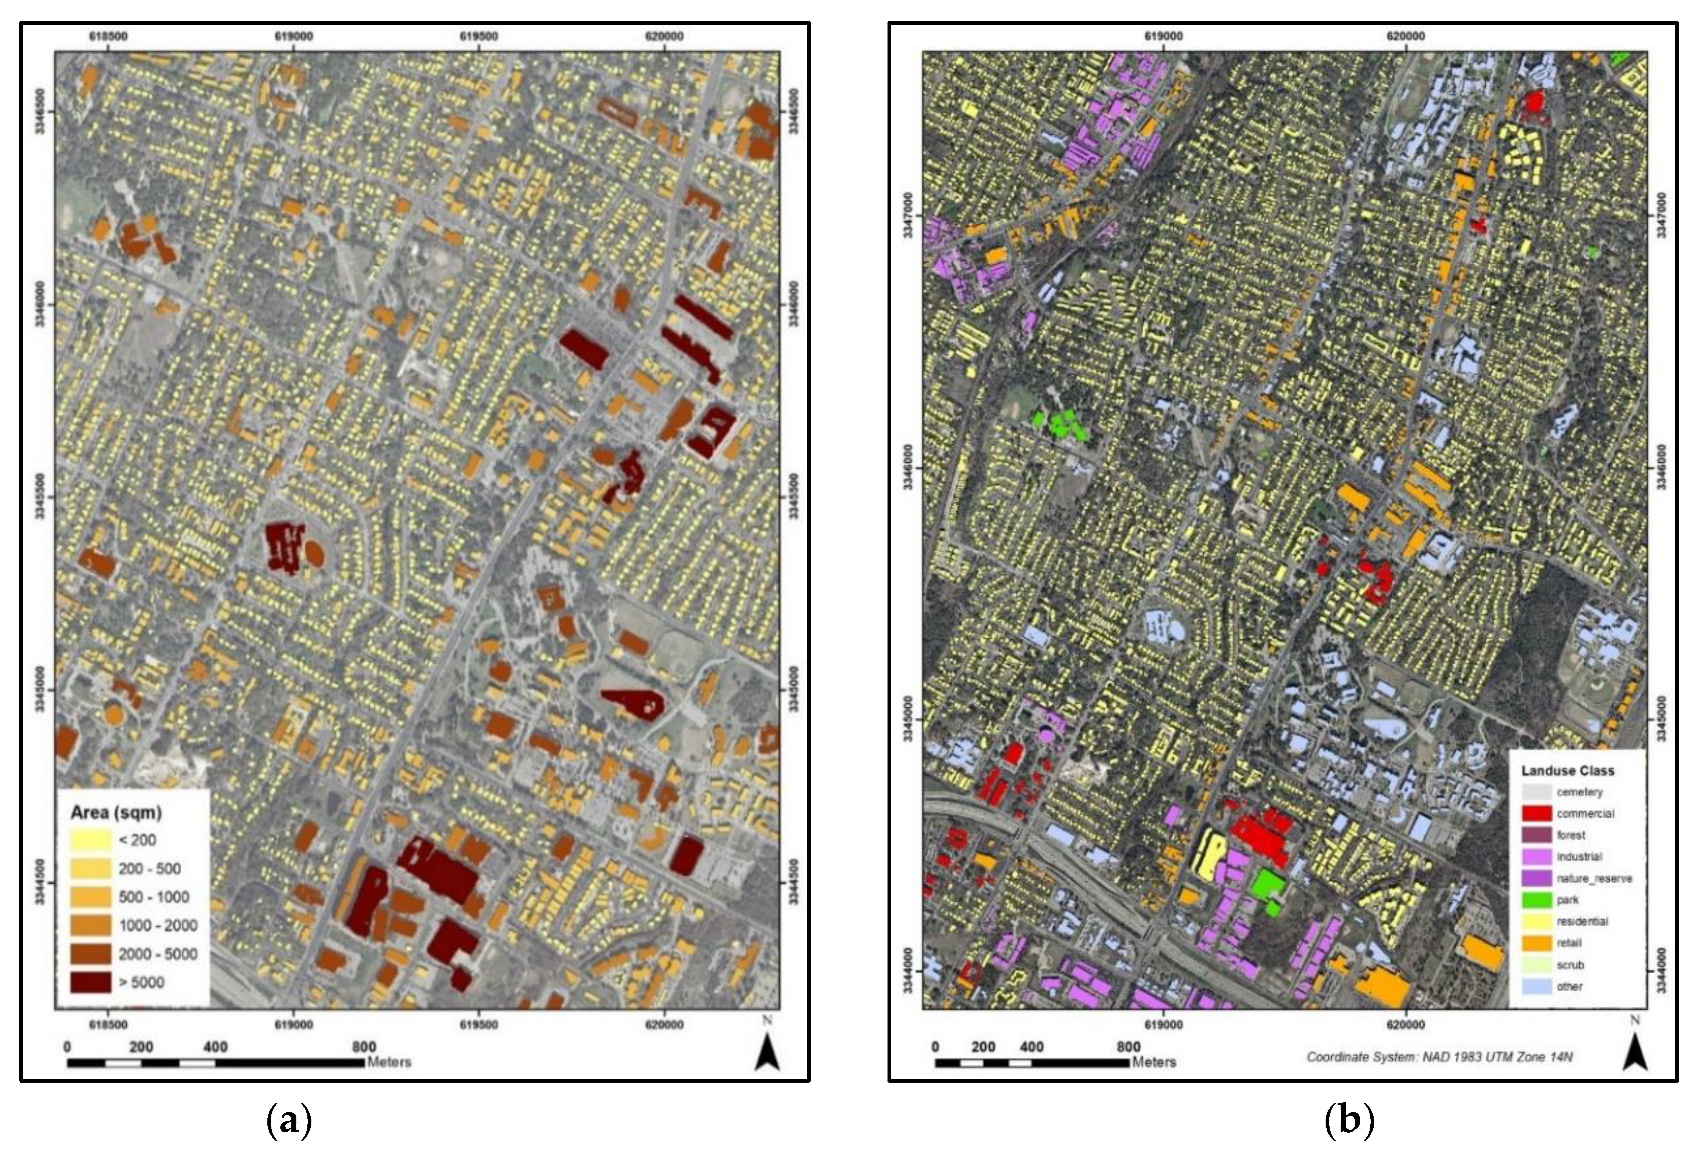
3.5. Attribute Extraction

The geometric data, building area, and perimeter of each building were calculated and added to the polygon shapefile as attribute fields using ArcMap software (Version 10.8.1). Figure 13a shows an Austin building area map. In addition, open street map land use data are incorporated into the building polygon files as land use attributes. Figure 13b shows the added land use classes for each building in Austin. The population count is also added to the building polygon layer from the WorldPop population count data. Figure 14 shows a map of the calculated population for each building in Vienna.
Figure 15 shows an evaluation of the results of the attribute extraction process. Here, we compared the same part of Vienna with land use data and population data. Buildings belonging to different land use categories and buildings showing a higher population count were selected, and the selected buildings were identified in Google Street View. The selected land use categories belong to commercial, industrial, residential, retail, and others. When these buildings were identified, it was proved that these land use classes were correctly added to the building layer. Moreover, when examining the buildings with a higher population count, these buildings were either high-rise buildings, industrial buildings, or hospitals (see Figure 15).

4. Discussion

This section discusses the limitations of the proposed DL network and investigates the effect of polygon smoothing.

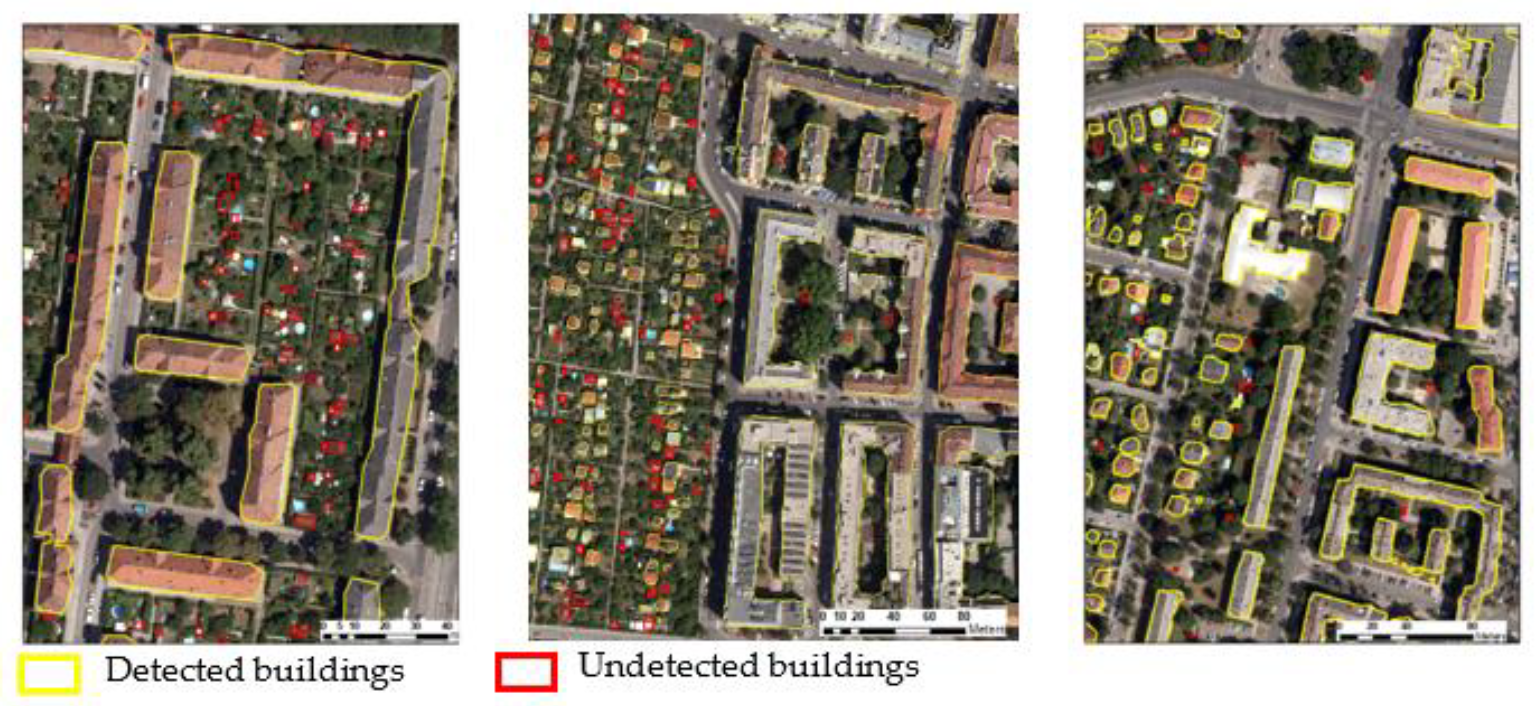
4.1. Model Limitations

Note that the loss of building prediction accuracy of the proposed approach here was due to the undetected buildings presented in the ground truth data (false negatives) and the detection of buildings in non-building locations (false positives). When observing the building prediction results of the proposed model, the following limitations were identified:
  • When the size of the buildings became minor compared to the other buildings in the area, the minor buildings tended to go undetected;
  • When buildings were partially covered with trees, such buildings were undetected;
  • The shapes of some detected buildings were odd because, in those areas, it was difficult to distinguish the building’s edge from the surrounding area.
Figure 16 shows the building detection results for undetected buildings in a high-density urban area from aerial images. The detected buildings are yellow, and the undetected buildings are red. When examining these figures, it was obvious that most of the undetected buildings were smaller in size than the surrounding buildings in the area. We calculated that the building area of these undetected buildings was less than 25 m2.
Figure 17 shows the detected and undetected buildings from a less urban area that mostly contained residential buildings. In this area, most of the undetected buildings were partially or entirely covered with trees. In addition, due to many trees being located around the buildings, the edges of the buildings were not clear. Thus, the shapes of some detected buildings were not accurate.
In some detected buildings, the shapes were odd because it was challenging to distinguish the building edges from the surrounding areas. In the aerial images, buildings in the areas with shadows, overexposed areas, and areas with complicated backgrounds mostly showed these imperfect shapes (Figure 18(a1,a2)). UAV images have fine-grained targets with higher amounts of complicated details because of their high spatial resolution. Sometimes, these finer details acted as noise when identifying the building edges from the surroundings. Thus, these buildings also had imperfect shapes (Figure 18(b1,b2)).

4.2. Effect of Polygon Smoothing

To investigate the effect of building smoothing, the number of vertices was counted in the initial and smoothed polygons. Figure 19 shows the smoothing results for buildings in urban areas that have simple building shapes and relatively large building sizes. As Figure 19 shows, when the boundaries of buildings were clearly visible in the image and buildings had simple shapes, smoothing with a 2% ratio resulted in more refined polygon shapes and removed more than 95% of unnecessary vertices in the initial polygons. However, when buildings’ sizes were relatively small and buildings were partially covered with trees, the shapes of the polygons were less accurate, and the shapes became more complex (see Figure 20). In this case, when applying lesser smoothing ratios, such as 2%, the polygon boundary tended to be more distorted.

5. Conclusions

This study proved that data pre-processing with image-enhancing algorithms could improve DL models’ performance. However, not all image-enhancing algorithms could improve model performance. Furthermore, different image-enhancing algorithms were performed differently on aerial images (Inria Dataset) and UAV images. The logarithmic correction algorithm showed the most significant improvement in the building prediction accuracy for aerial images, and overall, IoU increased by 3%. The CLAHE algorithm showed the highest building prediction improvement for UAV images, and overall, IoU increased by 4%. The histogram equalization algorithm slightly improved the building prediction accuracy for both data types.
We modified the standard U-Net architecture proposed by Ronneberger et al. [24] to extract building footprints by semantic segmentation of both aerial and UAV images. In the proposed model, dropouts and batch normalization increased the model performance and improved the model stability. In addition, the number of skip connections and the depth of the model increased to accurately segment the variety of building types. In the decoder part, strided transpose convolutional operations were used to increase the efficiency of the proposed model. Compared with the original U-Net architecture, the number of trainable weights was decreased to reduce the size of the model. Hence, the training time and required GPU were lowered in our approach.
To make the model more generalized, it was trained with images belonging to four cities in three countries with different building architectures. Compared with the original U-Net architecture [24], the proposed model performed higher by 33.4% for the same dataset. Next, the model was tested with a new UAV dataset that was not included in the training, and it also provided reasonably good results.
This study demonstrated a transfer-learning approach to investigate its effect on building extraction using different data sources. The proposed U-Net architecture was pre-trained using aerial images of the Inria aerial imagery dataset and transferred into a new model for fine-tuning the building extraction process from UAV images. The experiment showed that transfer learning with fine-tuning achieved almost similar accuracy with less training time than training the model from scratch. Furthermore, this approach proved that, to extract building footprints from a new dataset with different properties, a transfer learning approach could preserve the low-level features from one dataset to another and be reused without training from scratch.
We developed a methodology to polygonize the building prediction rasters and smooth the polygons to obtain more refined boundaries. The building footprints resulting from the DL segmentation models did not contain any useful attributes of the predicted layer. Thus, including different attribute information to the building layer will be a benefit when using these building polygons in real-world applications such as urban planning, urban development monitoring, disaster preparedness, environmental surveying, and population estimation. Here, we developed a procedure to add the area, perimeter, land use class, and population count of each building to the prediction results of different cities. We selected OSM land use data and WorldPop population data for this procedure because these two datasets are accessible to the public and are available for most countries in the world.
Although this model is trained with data belonging to different areas with different building architectures, most of these areas have an urban nature with high building density. Hence, to develop this model to predict buildings in larger areas, such as the entire region, the transfer learning approach stated here can fine-tune the model with sub-urban and rural data rather than training from scratch.
Here, validation of the ground truth data was not performed. Therefore, the accuracy of the building extraction also depends on the quality of the ground truth data. For the Inria Aerial Imagery Dataset, ground truth data were obtained from local or statewide GIS websites. However, for UAV images, buildings were manually digitized, and human errors could have occurred during this process. Therefore, obtaining building data from civil engineering surveys and GNSS surveys is recommended.
This research can be further developed by adapting a more advanced DL network, providing higher accuracy for the building detection process. Furthermore, if the building height can also be incorporated into the attribute extraction process, it will be easy to validate the results, and the accuracy will also be higher.

Author Contributions

Conceptualization, Apichon Witayangkurn and Samitha Daranagama; methodology, Apichon Witayangkurn and Samitha Daranagama; software, Samitha Daranagama; investigation, Apichon Witayangkurn; writing—original draft preparation, Samitha Daranagama; writing—review and editing, Apichon Witayangkurn; supervision, Apichon Witayangkurn; funding acquisition, Apichon Witayangkurn. All authors have read and agreed to the published version of the manuscript.

Funding

This research was partially funded by Science and Technology Research Partnership for Sustainable Development (SATREPS), Japan Science and Technology Agency (JST)/Japan International Cooperation Agency (JICA) “Smart Transport Strategy for Thailand 4.0” (Chair: Yoshitsugu Hayashi, Chubu University, Japan).

Institutional Review Board Statement

Not applicable.

Informed Consent Statement

Not applicable.

Conflicts of Interest

The authors declare no conflict of interest.

References

  1. Hui, J.; Du, M.; Ye, X.; Qin, Q.; Sui, J. Effective Building Extraction From High-Resolution Remote Sensing Images With Multitask Driven Deep Neural Network. IEEE Geosci. Remote Sens. Lett. 2018, 16, 786–790. [Google Scholar] [CrossRef]
  2. Huang, Z.; Cheng, G.; Wang, H.; Li, H.; Shi, L.; Pan, C. Building extraction from multi-source remote sensing images via deep deconvolution neural networks. Proc. IEEE Int. Geosci. Remote Sens. Symp. 2016, 1835–1838. [Google Scholar] [CrossRef]
  3. Guo, Z.; Shao, X.; Xu, Y.; Miyazaki, H.; Ohira, W.; Shibasaki, R. Identification of Village Building via Google Earth Images and Supervised Machine Learning Methods. Remote Sens. 2016, 8, 271. [Google Scholar] [CrossRef] [Green Version]
  4. Lateef, F.; Ruichek, Y. Survey on semantic segmentation using deep learning techniques. Neurocomputing 2019, 338, 321–348. [Google Scholar] [CrossRef]
  5. Ghanea, M.; Moallem, P.; Momeni, M. Building extraction from high-resolution satellite images in urban areas: Recent methods and strategies against significant challenges. Int. J. Remote Sens. 2016, 37, 5234–5248. [Google Scholar] [CrossRef]
  6. Vakalopoulou, M.; Karantzalos, K.; Komodakis, N.; Paragios, N. Building detection in very high resolution multispectral data with deep learning features. In Proceedings of the Geoscience and Remote Sensing Symposium, Milan, Italy, 26–31 July 2015; pp. 1873–1876. [Google Scholar]
  7. Wu, X.; Sahoo, D.; Hoi, S.C. Recent advances in deep learning for object detection. Neurocomputing 2020, 396, 39–64. [Google Scholar] [CrossRef] [Green Version]
  8. Sun, Y.; Zhang, X.; Zhao, X.; Xin, Q. Extracting Building Boundaries from High Resolution Optical Images and LiDAR Data by Integrating the Convolutional Neural Network and the Active Contour Model. Remote Sens. 2018, 10, 1459. [Google Scholar] [CrossRef] [Green Version]
  9. Yuan, X.; Shi, J.; Gu, L. A review of deep learning methods for semantic segmentation of remote sensing imagery. Expert Syst. Appl. 2020, 169, 114417. [Google Scholar] [CrossRef]
  10. Chen, X. Image Enhancement Effect on the Performance of Convolutional Neural Networks. Master’s Thesis, Blekinge Institute of Technology, Karlshamn, Sweden, 2019. [Google Scholar]
  11. Deshapriya, L. Deep Instance Segmentation and Polygonization. Master’s Thesis, Asian Institute of Technology, Pathum Thani, Thailand, May 2020. [Google Scholar]
  12. Prathap, G.; Afanasyev, I. Deep learning approach for building detection in satellite multispectral imagery. In Proceedings of the 2018 International Conference on Intelligent Systems (IS), Funchal, Portugal, 25–27 September 2018; pp. 461–465. [Google Scholar]
  13. Stiller, D.; Stark, T.; Wurm, M.; Dech, S.; Taubenböck, H. Large-scale building extraction in very high-resolution aerial imagery using Mask R-CNN. In Proceedings of the Joint Urban Remote Sensing Event (JURSE), Vannes, France, 22–24 May 2019; pp. 1–4. [Google Scholar]
  14. Alshehhi, R.; Marpu, P.R.; Wei, L.W.; Mura, M.D. Simultaneous extraction of roads and buildings in remote sensing imagery with convolutional neural networks. ISPRS J. Photogramm. Remote Sens. 2017, 130, 139–149. [Google Scholar] [CrossRef]
  15. Yang, H.L.; Yuan, J.; Lunga, D.; Laverdiere, M.; Rose, A.; Bhaduri, B. Building extraction at scale using convolutional neural network: Mapping of the United States. IEEE J. Sel. Top. Appl. Earth Obs. Remote Sens. 2018, 11, 2600–2614. [Google Scholar] [CrossRef] [Green Version]
  16. Saito, S.; Yamashita, T.; Aoki, Y. Multiple object extraction from aerial imagery with convolutional neural networks. Electron. Imaging 2016, 60. [Google Scholar] [CrossRef]
  17. Bittner, K.; Cui, S.; Reinartz, P. Building extraction from remote sensing data using fully convolutional networks. In Proceedings of the International Archives of the Photogrammetry, Remote Sensing and Spatial Information Sciences, ISPRS Hannover Workshop, Hannover, Germany, 6–9 June 2017; pp. 481–486. [Google Scholar]
  18. Szegedy, C.; Liu, W.; Jia, Y.; Sermanet, P.; Reed, S.; Anguelov, D.; Erhan, D.; Vanhoucke, V.; Rabinovich, A. Going deeper with convolutions. In Proceedings of the 2015 IEEE Conference on Computer Vision and Pattern Recognition, Boston, MA, USA, 7–12 June 2015; pp. 1–9. [Google Scholar]
  19. Simonyan, K.; Zisserman, A. Very deep convolutional networks for large-scale image recognition. arXiv 2014, arXiv:1409.1556. [Google Scholar]
  20. Kemker, R.; Salvaggio, C.; Kanan, C. Algorithms for semantic segmentation of multispectral remote sensing imagery using deep learning. ISPRS J. Photogramm. Remote Sens. 2018, 145, 60–77. [Google Scholar] [CrossRef] [Green Version]
  21. Xu, Y.; Wu, L.; Xie, Z.; Chen, Z. Building extraction in very high resolution remote sensing imagery using deep learning and guided filters. Remote Sens. 2018, 10, 144. [Google Scholar] [CrossRef] [Green Version]
  22. Minaee, S.; Boykov, Y.Y.; Porikli, F.; Plaza, A.J.; Kehtarnavaz, N.; Terzopoulos, D. Image segmentation using deep learning: A survey. IEEE Trans. Pattern Anal. Mach. Intell. 2021. [Google Scholar] [CrossRef]
  23. Hoeser, T.; Bachofer, F.; Kuenzer, C. Object Detection and Image Segmentation with Deep Learning on Earth Observation Data: A Review—Part II: Applications. Remote Sens. 2020, 12, 3053. [Google Scholar] [CrossRef]
  24. Ronneberger, O.; Fischer, P.; Brox, T. U-Net: Convolutional networks for biomedical image segmentation. In Proceedings of the International Conference on Medical Image Computing and Computer-Assisted Intervention, Munich, Germany, 5–9 October 2015; pp. 234–241. [Google Scholar]
  25. Guo, M.; Liu, H.; Xu, Y.; Huang, Y. Building extraction based on U-Net with an attention block and multiple losses. Remote Sens. 2020, 12, 1400. [Google Scholar] [CrossRef]
  26. Pan, X.; Yang, F.; Gao, L.; Chen, Z.; Zhang, B.; Fan, H.; Ren, J. Building extraction from high-resolution aerial imagery using a generative adversarial network with spatial and channel attention mechanisms. Remote Sens. 2019, 11, 917. [Google Scholar] [CrossRef] [Green Version]
  27. Maggiori, E.; Tarabalka, Y.; Charpiat, G.; Alliez, P. Can semantic labeling methods generalize to any city? The Inria aerial image labeling benchmark. In Proceedings of the IEEE International Geoscience and Remote Sensing Symposium (IGARSS), Fort Worth, TX, USA, 23–28 July 2017; pp. 3226–3229. [Google Scholar]
  28. Bischke, B.; Helber, P.; Folz, J.; Borth, D.; Dengel, A. Multi-task learning for segmentation of building footprints with deep neural networks. arXiv 2017, arXiv:1709.05932. Available online: https://arxiv.org/abs/1709.05932 (accessed on 10 January 2021).
  29. He, K.; Gkioxari, G.; Dollar, P.; Girshick, R. Mask R-CNN. In Proceedings of the IEEE International Conference on Computer Vision (ICCV), Venice, Italy, 22–29 October 2017; pp. 2980–3288. [Google Scholar]
  30. Khalel, A.; El-Saban, M. Automatic pixelwise object labeling for aerial imagery using stacked u-nets. arXiv 2018, arXiv:1803.04953. Available online: https://arxiv.org/abs/1803.04953 (accessed on 10 January 2021).
  31. Marcu, A.; Costea, D.; Slusanschi, E.; Leordeanu, M. A Multi-stage Multi-task neural network for aerial scene interpretation and geolocalization. arXiv 2018, arXiv:1804.01322v1. Available online: https://arxiv.org/abs/1804.01322 (accessed on 11 January 2021).
  32. OpenCV. Available online: https://docs.opencv.org/3.4/d3/dc1/tutorial_basic_linear_transform.html (accessed on 20 December 2020).
  33. OpenCV. Available online: https://docs.opencv.org/master/d5/daf/tutorial_py_histogram_equalization.html (accessed on 20 December 2020).
  34. Scikit-Image. Available online: https://scikit-image.org/docs/dev/api/skimage.exposure.html#skimage.exposure.adjust_log (accessed on 20 December 2020).
  35. Douglas, D.H.; Peucker, T.K. Algorithms for the reduction of the number of points required to represent a digitized line or its caricature. Cartogr. Int. J. Geogr. Inf. Geovis. 1973, 10, 112–122. [Google Scholar] [CrossRef] [Green Version]
  36. Visvalingam, M.; Whyatt, J.D. Line Generalisation by Repeated Elimination of the Smallest Area; Discussion Paper, CISRG; The University of Hull: Hull, UK, 1992; Available online: https://hydra.hull.ac.uk/assets/hull:8338/content (accessed on 28 January 2021).
  37. Visvalingam, M.; Whelan, J.C. Implications of Weighting Metrics for Line Generalization with Visvalingam’s Algorithm. Cartogr. J. 2016, 53, 253–267. [Google Scholar] [CrossRef]
  38. OSM Landuse Landcover. Available online: https://osmlanduse.org/#9.707203470991995/9.12579/49.34246/0/ (accessed on 10 February 2021).
  39. WorldPop. Available online: https://www.worldpop.org/ (accessed on 12 February 2021).
Figure 1. Diagram for the proposed methodology.
Ijgi 10 00606 g001
Figure 2. Datasets used.
Ijgi 10 00606 g002
Figure 3. UAV orthomosaic of Kandy, Sri Lanka (a) and UAV orthomosaic of Ratnapura, Sri Lanka (b).
Ijgi 10 00606 g003
Figure 4. Proposed U-Net model (dropouts and batch normalizations added units are shown in dark red).
Ijgi 10 00606 g004
Figure 5. Proposed transfer learning approach for building extraction from UAV data.
Ijgi 10 00606 g005
Figure 6. Proposed methodology for attribute extraction process.
Ijgi 10 00606 g006
Figure 7. Results’ chapter overview.
Ijgi 10 00606 g007
Figure 8. Building detection results from the developed DL network for the four cities ((a): results from the model, (b): RGB images, (c): ground truth data).
Ijgi 10 00606 g008
Figure 9. Building detection results for the Ratnapura UAV dataset, which is an entirely new area to the model and only used as test data ((a): model results, (b): RGB images, (c): ground truth).
Ijgi 10 00606 g009
Figure 10. Initial building polygon results after being converted from the building raster masks of the model output: (a) RGB images; (b) Initial building polygons; (c) Building polygons overlayed on images.
Ijgi 10 00606 g010
Figure 11. Comparison of polygon smoothing results from three smoothing algorithms for different building types.
Ijgi 10 00606 g011
Figure 12. Results comparison of initial and smoothed polygons from DPA with 2% smoothing ratio: (a) Initial building polygons; (b) Smoothed polygons from DPA with 2% ratio.
Ijgi 10 00606 g012
Figure 13. Maps created using the area and land use attributes of buildings in Austin: (a) Map showing calculated building area results in Austin; (b) Map showing added land use classes from OSM data to buildings in Austin.
Ijgi 10 00606 g013
Figure 14. Map showing the calculated population count of each building in Vienna.
Ijgi 10 00606 g014
Figure 15. Evaluation of the results in the attribute extraction process with the help of Google Street View. (Average population values shown in the buildings of the left map are the values from the attribute extraction process).
Ijgi 10 00606 g015
Figure 16. Undetected buildings from the proposed model due to the building size becoming minor.
Ijgi 10 00606 g016
Figure 17. Undetected buildings due to being covered by trees.
Ijgi 10 00606 g017
Figure 18. Detected buildings with imperfect boundaries in aerial and UAV images: (a1,a2) show imperfect building boundaries in aerial images; (b1,b2) show imperfect building boundaries in UAV images.
Ijgi 10 00606 g018
Figure 19. Smoothing results for the buildings in urban areas with relatively larger in size (count of vertices is showing inside the polygon): (a) initial polygons; (b) smoothed polygons.
Ijgi 10 00606 g019
Figure 20. Smoothing results for the buildings in less urban areas with relatively smaller in size (count of vertices is showing beside the polygon): (a) initial polygons; (b) smoothed polygons.
Ijgi 10 00606 g020
Table 1. Building detection accuracy for the four cities from the modified U-Net model.
CityCountryData SourceIoU %Pixel AccuracyPrecisionRecall
ViennaAustriaInria Aerial Images67.730.890.880.87
ChicagoUSAInria Aerial Images54.320.910.810.78
AustinUSAInria Aerial Images52.290.930.840.78
KandySri LankaUAV Images70.850.890.890.79
Table 2. Average building detection accuracy of the four cities from the modified U-Net model.
Evaluation MetricValidation DataTest Data
IoU (%)61.8961.90
Overall Pixel Accuracy0.920.91
Precision0.860.86
Recall0.830.82
Table 3. Model interference accuracy with UAV dataset in Ratnapura, which is new to the model and used only as test data.
IOU %Pixel AccuracyPrecision
60.560.920.83
Table 4. Results of the pre-trained model from aerial images of Inria dataset and the fined-tuned model from UAV test data in Kandy, Sri Lanka.
MetricsInitial Model by Training Only with Aerial ImagesFine-Tuned Model by Retraining with UAV Images
IoU (%)11.3169.86
Accuracy0.660.90
Epochs15080
Training Time60.9 min37.8 min
Table 5. Accuracy of the model with different image-enhancing algorithms (highest IoU value for each city is bolded).
Original ImagesGamma CorrectedHistogram EqualizedCLAHE AppliedLogarithmic Corrected
CityIoU %Pixel
Accu.
IoU %Pixel
Accu
IoU %Pixel
Accu.
IoU %Pixel
Accu.
IoU %Pixel
Accu.
Vienna
(Aerial)
67.730.8964.860.8868.680.8967.420.8971.390.88
Austin
(Aerial)
52.290.9346.980.9351.210.9450.660.9355.210.94
Chicago
(Aerial)
54.320.9152.420.9154.380.9152.910.9156.880.91
Kandy
(UAV)
70.850.8963.230.8570.920.8971.070.8969.720.89
Ratnapura
(UAV)
60.560.9252.130.8865.640.9368.00.9457.040.92
Table 6. Accuracy comparison of the proposed U-Net model with the different state-of-the-art DL architectures.
ModelIoU (%)Overall Pixel Accuracy
Original U-Net [24] with same dataset28.480.89
Proposed U-Net 61.900.91
Proposed U-Net with pre-processed images by Logarithmic corrected 63.300.91
FCN [27] *53.8292.79
Mask R-CNN [29] *59.5392.49
2-Levels-U-Nets [30] *74.5596.05
GAN-SCA [26] *77.7596.61
* Models are trained on the Inria aerial image dataset, and the results are referenced from the study of Pan et al. [26].
Publisher’s Note: MDPI stays neutral with regard to jurisdictional claims in published maps and institutional affiliations.

