1. Introduction
Indoor positioning has been vigorously developed for around 20 years. Wireless fidelity (WiFi) [
1], inertial measurement unit [
2], Bluetooth [
3], geomagnetic field [
4], ultra-wide band [
5], etc., have been widely utilized for indoor positioning and navigation. With the requirements of cost and precision, WiFi has the opportunity to become a feasible and cost-effective technique for indoor localization among them. WiFi indoor positioning includes two kinds of methods, one is fingerprinting, and the other one is multilateration. A series of wireless signals will be detected at a certain location. These wireless signals form together a signal pattern, similar to a fingerprint on a human finger, known as a fingerprint. Of course, fingerprints are not limited to wireless signals, but can also be a free combination of WiFi, Bluetooth, communication, geomagnetic and other signals. The localization method with the help of signal fingerprint is called as fingerprinting localization. The two most representative approaches for indoor fingerprinting localization are based on received signal strength (RSS) [
1,
6,
7] and channel state information (CSI) [
8,
9]. Time of arrival (TOA) [
10], angle of arrival (AOA) [
10,
11], time difference of arrival (TDOA) [
12,
13] and CSI [
14] are usually used for multilateration. However, the acquisition of TOA, AOA, TDOA and CSI need dedicated equipment, which limits their large-scale application. Besides, WiFi fine timing measurement (FTM) [
15,
16] was used for indoor positioning. Nevertheless, WiFi FTM needs to build connection between the receiver and transmitter, and it cannot support simultaneous use of many users. Moreover, WiFi FTM also needs dedicated hardware. Compared to TOA, AOA, TDOA, CSI and FTM, RSS measurements can be easily obtained by WiFi integrated mobile devices in current public wireless local area networks.
RSS-based ranging indoor positioning approaches rely on measured distances by using the path loss model, while the fingerprinting approaches utilize signal correlation for matching. Due to the variable and unpredictable radio channel attenuation, signal shadowing, multipath interference and even the dynamic indoor environment [
1,
6,
17,
18], range-based indoor positioning approaches usually have poor accuracy, while a fingerprinting approach exhibits better performance. Therefore, the fingerprinting approach is one of the most feasible solutions for WiFi indoor localization, without knowing the locations of access points (APs) in advance. The fingerprinting localization contains the offline stage and the online stage. Its basic idea is similarity comparison between the online RSS readings and offline prebuilt fingerprint database. The fingerprint database includes a large number of reference points (RPs). In the online stage, machine learning methods can be employed for estimating a target’s position between RSS readings and fingerprint database, such as Gaussian process regression [
19,
20], neural network [
21,
22], support vector machine (SVM) [
23,
24] and k-nearest neighbor (KNN) [
1]. In reference [
20], Gaussian process regression models are utilized for predicting RSS distribution in uncalibrated domain to reduce the workload of fingerprint database construction, and similarity KNN is used for determining position. In reference [
22], one dimensional convolutional neural network with stacked auto-encoder is adopted for achieving high-precision positioning results. In reference [
23], SVM with three kinds of kernel functions are investigated and compared in a real indoor environment. Indoor positioning methods by using neural network and SVM could obtain results with high accuracy, as well as high complexity. Because of low complexity and easy implementation, KNN is the most common method for existing fingerprinting localization, meeting the accuracy requirements of most situations.
When the system covers a large area, a fingerprint database will include many APs and a large amount of RSS measurements, causing huge computational cost and large positioning errors. Therefore, clustering algorithms are introduced into fingerprinting localization for dividing fingerprint database in the offline stage, such as DBSCAN [
6,
7], K-means [
25], fuzzy c-means [
26] and affinity propagation clustering (APC) [
27]. Among them, DBSCAN and APC could automatically generate clusters without specifying the number of clusters at first. Additionally, two hyper-parameters greatly affect the clustering effect of DBSCAN. In the online stage, the online RSS readings are used for selecting a cluster to which it belongs, and then, an important task is to calculate the similarity between online RSS readings and RPs only in the matched cluster rather than the whole fingerprint database, which aims to increase the positioning accuracy and reduce the computation burden. Due to the fluctuation of RSS [
6], these fingerprint clustering localization methods based on signal-domain distance usually do not conform to indoor spatial layout. A hybrid distance [
28], the fusion of signal-domain and position-domain distances, was introduced into clustering algorithms, causing better clustering results than single distance. Moreover, because of the dynamic and complex wireless environment, there are no absolutely separated cluster margins for fingerprints, and the transition region should exist between adjacent clusters. Those cluster algorithms ignoring the transition region will cause identification errors. Therefore, algorithms dedicated to maximum margin are not suitable for fingerprint clustering localization. Meanwhile, weighted KNN (WKNN) algorithm with fixed K value usually achieves large positioning errors [
1]. An enhanced weighted KNN (EWKNN) [
29] technique was proposed to choose several RPs for calculating weighted coordinates based on the signal filter. Due to the neglect of RPs’ real spatial distribution, larger localization errors and instability emerged. Then, an adaptive WKNN (AWKNN) [
30] method was put forward to acquire a location-concentrated sub-cluster for high accuracy and stability based on APC, signal-domain and position-domain distances. However, the suitable sub-cluster was selected by some heuristic conditions based on position-domain distance rather than some rules, achieving non-global optimization performance under some situations. Generally speaking, RSS located far from AP is very weak or even non-existent. The lost RSS is usually replaced with a fixed value [
1,
29], such as −95 or −100 dBm, which will introduce errors into the fingerprint matching operation.
Therefore, an improved indoor fingerprinting localization method using a clustering algorithm and RSS dynamic compensation was proposed. In the offline stage, a fingerprint database was firstly built as a set of many maps between media access control (MAC) and RSS and locations at RPs. Then, APC was conducted to adaptively divide fingerprint database into several clusters based on offline hybrid distance. Meanwhile, clusters were adjusted considering the transition region and given radius. In the online stage, dynamic compensation for fingerprint at RP was carried out. After cluster identification and selecting K RPs with minimum online signal-domain distances, APC was reused to generate several sub-clusters by position-domain distances. The objective is to select the optimal sub-cluster that minimizes the sum of squared online hybrid distances. Finally, online signal-position distance was used for weighted location estimation. The proposed method can obtain results with better positioning accuracy and stability. Besides, it is able to maintain positioning accuracy so that it is basically changeless, effectively avoiding the influence of fixed K values.
The remainder of this paper is organized as follows.
Section 2 shows the overview of the improved fingerprinting localization method using clustering algorithm and RSS dynamic compensation.
Section 3 describes the proposed method in detail.
Section 4 introduces experimental testbed and evaluates and analyzes the performance of the proposed method.
Section 5 conducts a discussion. Finally, conclusions are made in
Section 6.
2. The Overview of Improved Localization Method
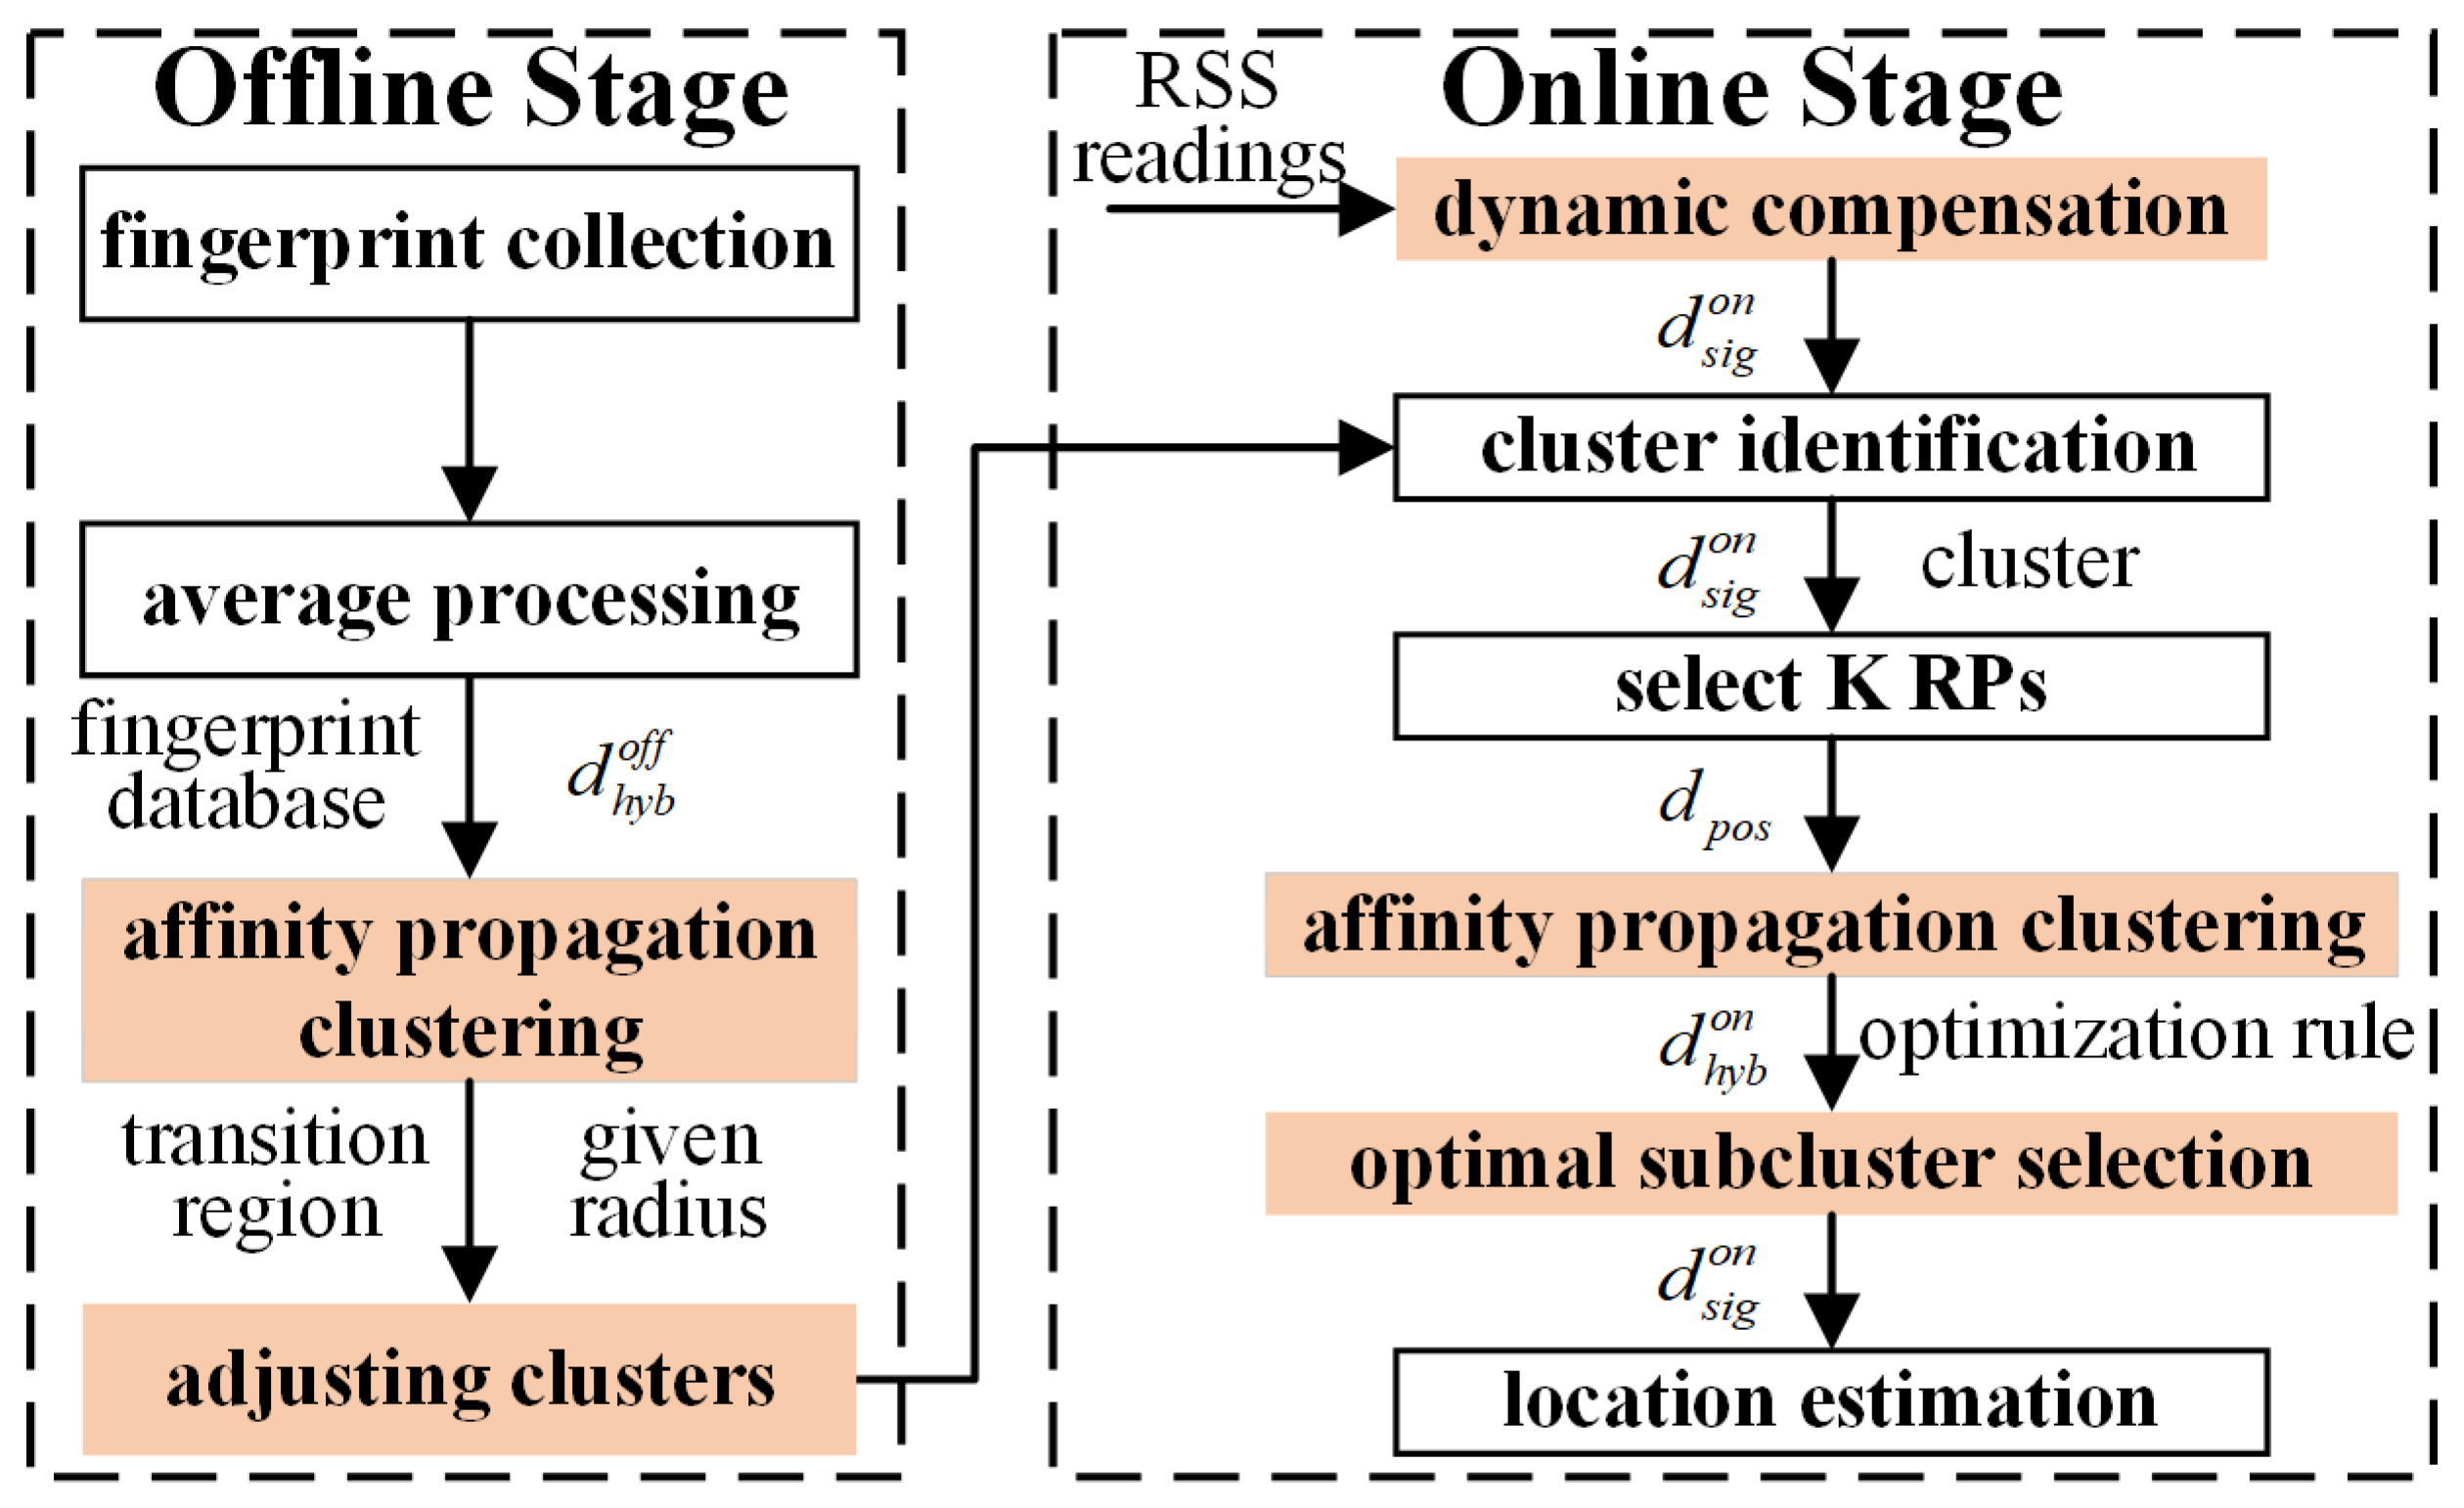
The overview of the improved localization method is shown as
Figure 1. As other fingerprinting localization methods, it consists of two stages, offline and online stages. The core and improved components, filled in orange, are APC and adjusting clusters in the offline stage, as well as dynamic compensation, APC and sub-cluster selection in the online stage.
After collecting RSS measurements at some point in a period, many pairs of key values with MAC and RSS through average processing are named as the fingerprint, expressed as
, where
denotes MAC of the first detected AP,
is the corresponding RSS mean value, and
is the number of detected MACs. The fingerprint database can be constructed by combining all mappings between fingerprints and coordinates at different locations. Locations of the
th and
th RP are denoted as
and
, respectively, a vector of
and
.
and
are a fingerprint of
th and
th RP, respectively. The detailed form of table of fingerprint database can be found in literature [
30]. Position-domain distance can be expressed as
, and signal-domain distance in the offline stage is
, where
and
are different locations, many different MACs appear in only one of
and
,
is the number of MACs appeared in both fingerprints,
and
are corresponding RSS values of
th MAC. Then, the hybrid distance in the offline stage can be obtained by Equation (1), where
is the normalized function.
In the offline stage, APC is conducted by using the above hybrid distance as a similarity description. It automatically forms clusters and selects cluster centroids by means of similarities among RPs. These clusters are distinct. In order to improve the accuracy of cluster identification in the online stage and make full use of fingerprint data, a transition region between two adjacent clusters is created by absorbing RPs within a given radius. The union of the cluster and transition region is the adjusted cluster. Meanwhile, the centroid of adjusted cluster should be updated with equal weight for each RP.
In buildings where APs are heavily deployed, real-time-acquired RSS readings usually include many MACs in the online stage. The online signal-domain distance can be calculated based on real-time RSS readings. Because of the limited radio propagation, fingerprint at RP inevitably lacks some MACs. These lost RSS values of a fingerprint could be dynamically compensated by the minimum of fingerprint at RP. Then, online signal-domain distance between real-time RSS readings and RPs or centroids can be expressed as , where denotes the real-time RSS readings, , denotes RSS value of th MAC, is the number of detected RSS during testing measurement. The online hybrid distance () can be calculated by and based on Equation (1). By calculating and sorting all online signal-domain distances between and cluster centroids, the cluster with minimum is objective in cluster identification. Online signal-domain distances between and RPs in the objective cluster are calculated. If K is a pre-specified value, K RPs with minimum are selected. Position-domain distances between the K selected RPs are further utilized by APC to adaptively divide into several sub-clusters. Based on optimization rule and online hybrid distance, the optimal sub-cluster can be selected to realize location estimation.
3. Improved Indoor Fingerprinting Localization Method
This section is set to introduce the core components of the improved fingerprinting localization method in detail, such as APC, clusters adjustment, dynamic compensation and optimal sub-cluster selection.
3.1. Affinity Propagation Clustering Algorithm
Affinity propagation algorithm connects all sample points into a network. Each sample point is potential cluster centroid. Two kinds of messages, responsibility and availability , are exchanged between sample points. During the message-passing procedure, differences between cluster centroid and affiliated points are continuously enlarged, so as to determine clusters and their centroids. The clustering process can be completed automatically without specifying the number of clusters. Because of the complex indoor wireless environment, it is difficult to accurately reflect signal distribution by determining the number of clusters based on experience or indoor layout. It seems that APC could meet the demand of fingerprint database clustering.
Similarity describes how well the th point is suitable to be the cluster centroid for the th point, where is not equal to and is set to be a negative value. is called preference. In the APC algorithm, the number of clusters depends on preference and the messages-passing procedure between sample points. The larger the preference is, the more likely the sample point is selected as the cluster centroid. At the beginning of APC, preference can be set as the median or minimum of . If preference is median, the appropriate number of clusters will be obtained. When it is minimum, the number of clusters is small.
Responsibility
is the message sent to the
th point from the
th point. It reflects the accumulated evidence for how well-suited the
th point is to serve as the alternative cluster centroid for the
th point in case of considering the other potential cluster centroid,
th point. The
th point will contend the
th point with the
th point.
can be calculated by Equation (2), where
is the similarity between the
th point and the
th point.
Availability
is the message sent to the
th point from the
th point. It reflects the accumulated evidence for how appropriate it will be for the
th point to choose the
th point as the cluster centroid. Then,
in Equation (2) is availability about the
th point and
th point. Normally, availability is initialized to zero,
. For
, self-responsibility
is set to preference
minus the maximum of similarities between the
th point and all other alternative cluster centroids, as shown in Equation (3).
The above update of responsibility allows all alternative cluster centroids to compete for the
th point. The following update of availability shows whether each alternative cluster centroid is qualified. As shown in Equation (4),
is set to
plus the sum of positive responsibilities
for alternative cluster centroids received from other sample points. The self-availability
is updated by Equation (5).
If similarities are known, the above equations can be used to exchange messages between sample points. Responsibilities and availabilities are combined to identify cluster centroid. For the th point, the th point that maximizes either identifies the th point as a cluster centroid if , or identifies the th point that is the cluster centroid for the th point. The message-passing procedure may be terminated after a fixed number of iterations, after changes in the messages fall below a threshold, or after cluster centroids stay constant for some number of iterations.
3.2. Adjusting Clusters Considering Transition Region and Given Radius
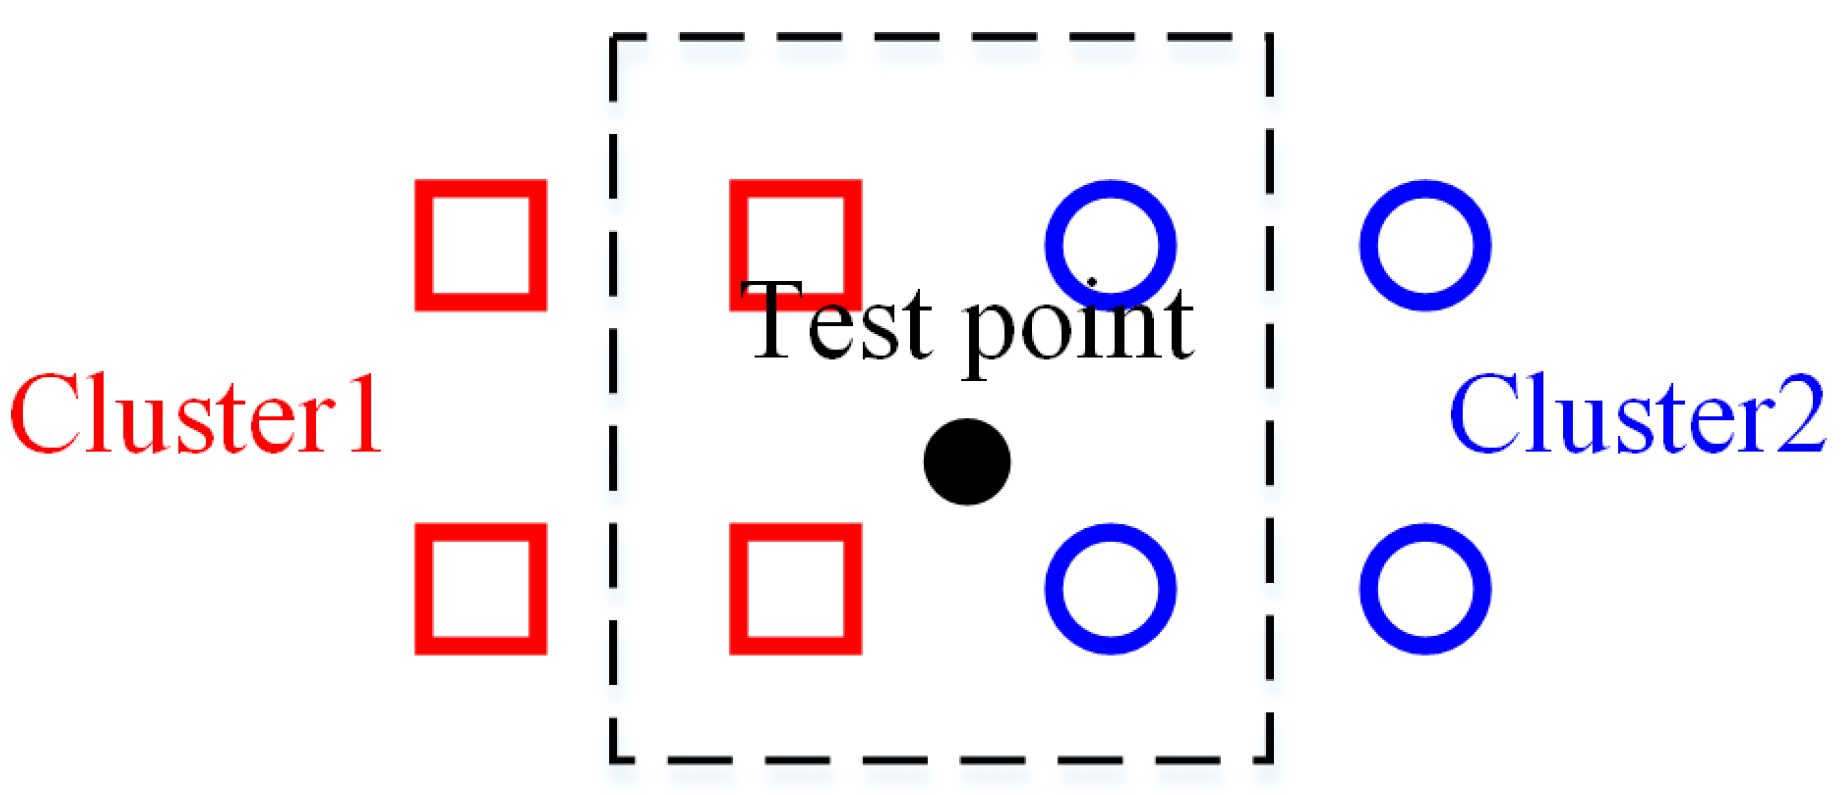
Due to the continuous radio propagation, it is very hard to divide an indoor environment into distinct clusters. Traditional clustering algorithms in fingerprinting localization are devoted to maximum margin between clusters, leading to cluster identification errors. As is shown in
Figure 2, there are two adjacent clusters named as Cluster1 and Cluster2, respectively. Squares and circles indicate RPs, and the distance between two RPs represents sampling interval. Considering the workload of fingerprint collection in the offline stage, the sampling interval should not be too small. If the test point is located in the middle of two adjacent clusters, no matter which cluster the test point is assigned to, there are few RPs that are truly adjacent to it. In addition, more far away RPs will be involved in location estimation due to the fixed K value. As a result, a large positioning error will occur. If there is a transition region between two adjacent clusters, marked in
Figure 2 by a dashed box, RPs in this area belong to not only Cluster1 but also Cluster2. RPs around the test point in each cluster are increased. Even if there is a misidentification of adjacent clusters, the positioning error will be lower than that without a transition region.
Therefore, adjusting clusters considering transition region and given radius is proposed, and the detail is as follows.
is the number of clusters generated by APC, and the given radius is . Traverse all clusters and select the th and th cluster, .
Select the last two RPs ( and ) in the th cluster. Additionally, select the first two RPs ( and ) in the th cluster.
Select all RPs within of either or in the th cluster. The set is combined after the removal of repetition.
Select all RPs within of either or in the th cluster. The set is combined after the removal of repetition.
Add RPs in to the th cluster, and add RPs in to the th cluster.
Repeat the above steps from (b) to (e) until the traversal is complete.
Traverse the cluster. Update all cluster centroids after calculating the mean coordinate and fingerprint of all RPs in each cluster.
The given radius can be specified as any value. However, the suggestion to the given radius is the accuracy of the fingerprinting localization, such as 2 m. As we all know, some fingerprinting localization methods can achieve high accuracy, but they are often covering very small areas. The convincing accuracy of fingerprinting localization is from 2 to 3 m in a large area. It is necessary to ensure the differences between adjacent clusters, while increasing the number of RPs in transition region. If the radius is set too large, two adjacent clusters will become the same one, which is the contrary to the original intention of the previous clustering operation. Therefore, we suggested that the radius is set as 2 m.
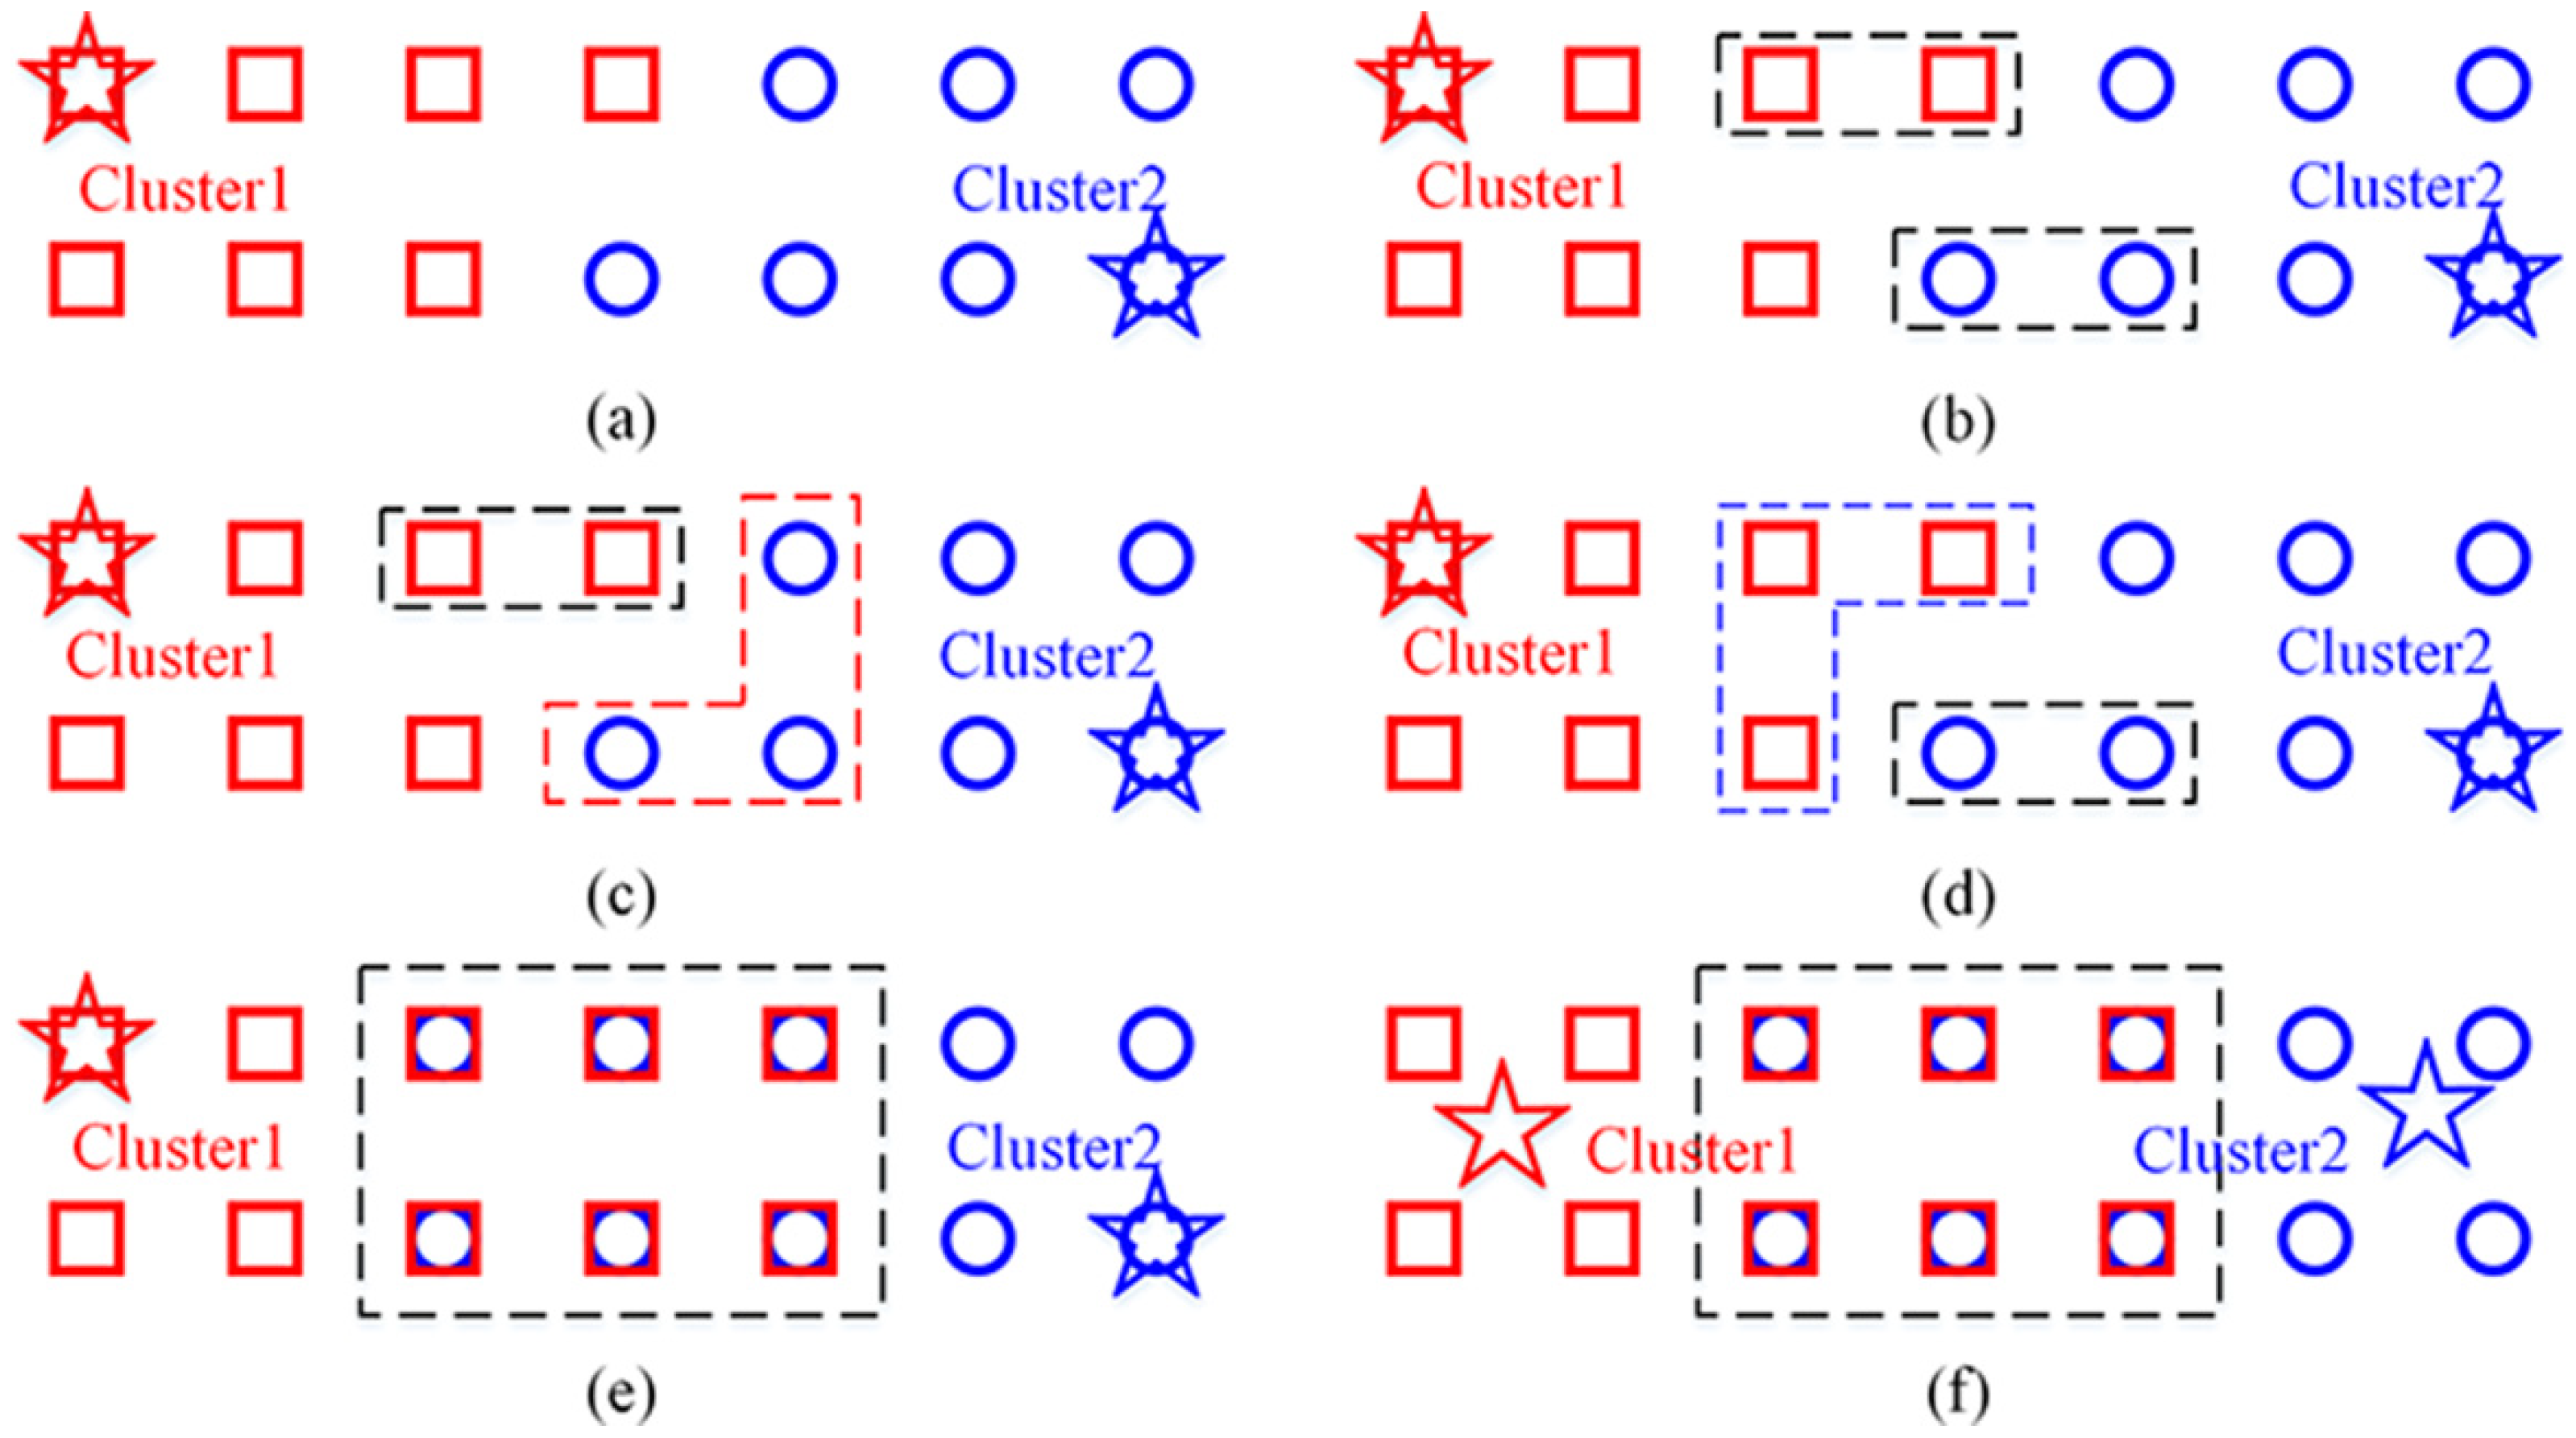
The above process can be clearly illustrated by
Figure 3. From the viewpoint of APC, cluster centroid is one of the sample points. Thus, the pentagram denotes cluster centroid, overlapping one RP. In
Figure 3, (a) shows two adjacent clusters, (b) represents selecting two RPs that meet the requirement of above step 2 from each cluster, (c) represents selecting RPs within
from Cluster2, (d) represents selecting RPs within
from Cluster1, (e) represents the combination of origin clusters and transition region, and (f) represents the update of the cluster centroid.
3.3. Online Dynamic Compensation of Reference Fingerprint for RSS Lost by Using Minimum Value
Due to complex structure and layout, as well as dynamic environment, it is very difficult to detect the same APs anywhere in a building. Meanwhile, a wireless signal is easily influenced by unpredictable channel attenuation, signal shadowing and multipath interference. Some APs are not detected, without obtaining the corresponding RSS values. For convenience, this phenomenon is called RSS lost.
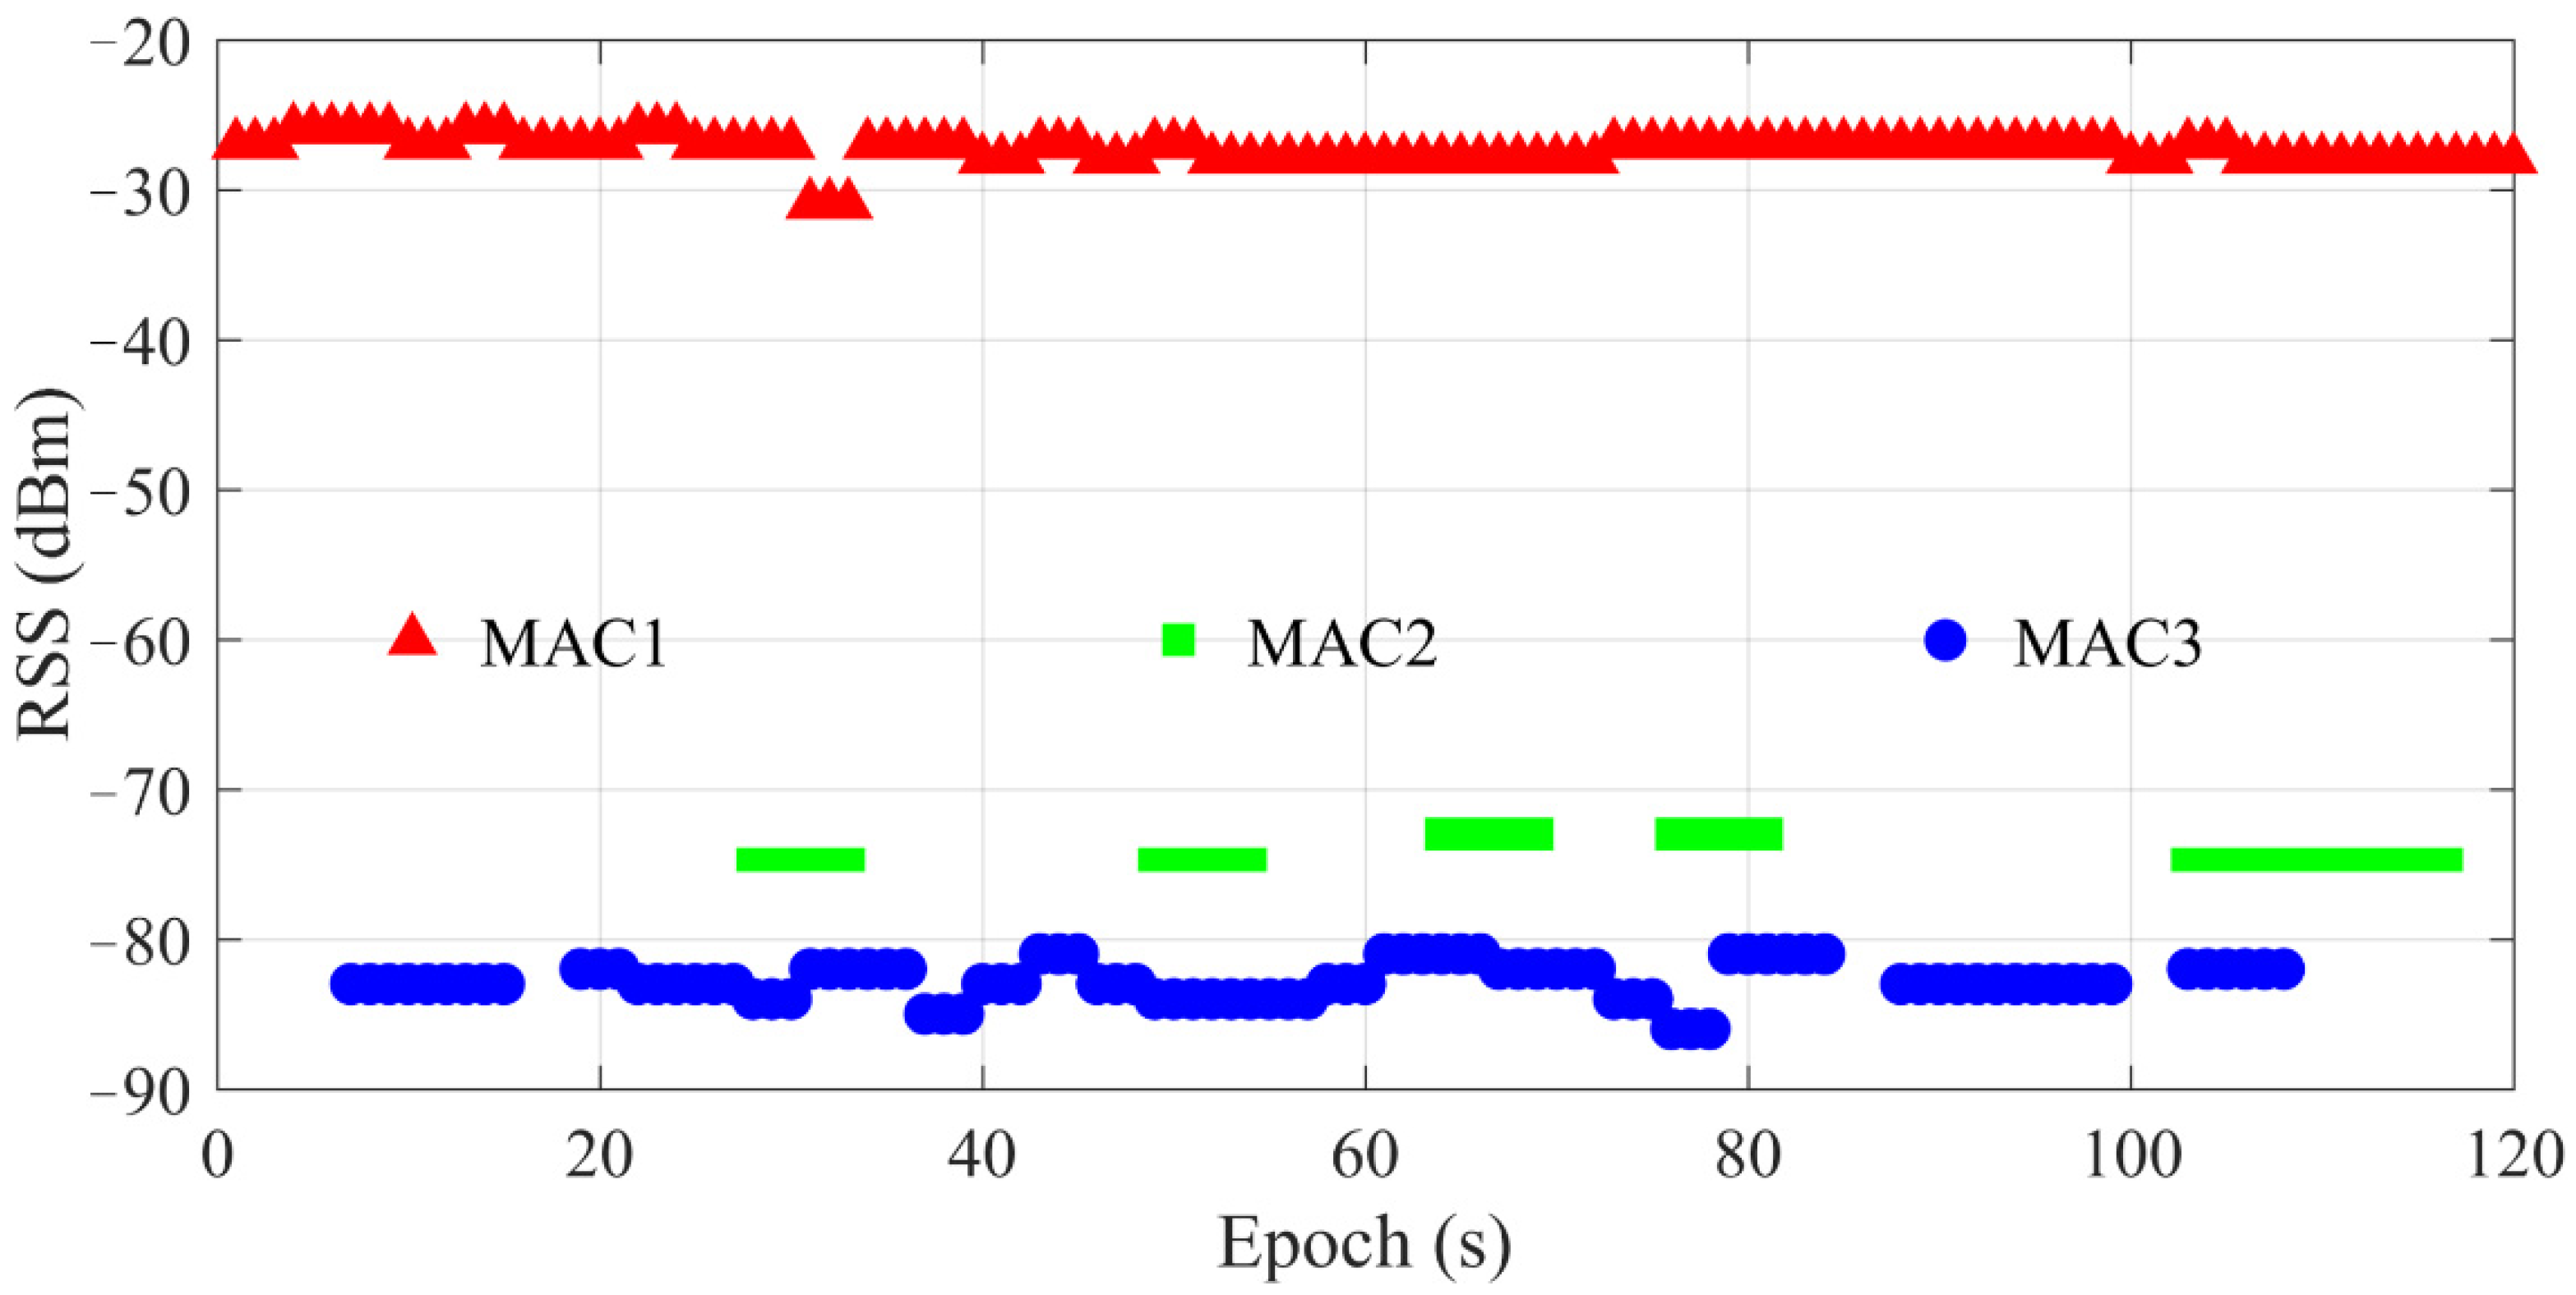
Figure 4 shows collection of RSS values at a frequency of 1 Hz in two minutes. If there is no RSS lost, all detected RSS numbers of MAC1, MAC2 and MAC3 should be 120. In fact, the detected RSS numbers of MAC1, MAC2 and MAC3 are 120, 39 and 93, respectively. Additionally, the corresponding mean RSS values are −26, −74 and −83 dBm, respectively. The blank space in
Figure 4 means RSS lost. The more blank space there is, the more serious RSS is lost. Although MAC2 has a larger RSS value than MAC3, MAC2 has a more serious RSS lost. If these three RSS values are used for real-time location estimation, it may not be wise to discard missing RSS values when RSS lost appears. At the first second, RSS of MAC1 is detected, while the others are lost, the estimated location only based on the RSS of MAC1 will contain a large error. If RSS compensated for the lost MAC2 and MAC3, a more precise location could be estimated. If a fixed value is used for compensation, as in the previous methods, e.g., −95 or −100 dBm, positioning errors and even identification errors will be attendant.
RSS loss occurs throughout both offline and online stages. Fingerprints are obtained by averaging process for collections over a long period of time in the offline stage, so RSS compensation value for fingerprints can be set as −100 dBm or other fixed values. When RSS readings are collected at a target location in a big building, some detected MACs in RSS readings may not appear in the list of reference fingerprint. Meanwhile, real-time RSS readings are easily influenced by dynamic environment in the online stage. The reasons for RSS lost may be multipath effect, sheltering, far away from access point or beyond the sensitivity of the receiver. Experimental tests find that RSS loss usually occurs in the case of relatively small RSS values. Once RSS values from different APs are collected, the minimum one of RSS values can be selected. There will be a new minimum RSS value in the next RSS collection. In other words, the minimum RSS value is dynamically changing all the time. The absolute difference between compensated RSS and the corresponding offline RSS is smaller than others, which can help find adjacent RPs more accurately. It is very unreasonable to replace RSS loss with fixed values. Therefore, the minimum RSS of reference fingerprint is utilized for dynamic compensation when online signal-domain distance is calculated by comparing differences between RSS readings and reference fingerprint. Additionally, it is worth noting that signal-domain distance is calculated after dynamic compensation during the whole online stage.
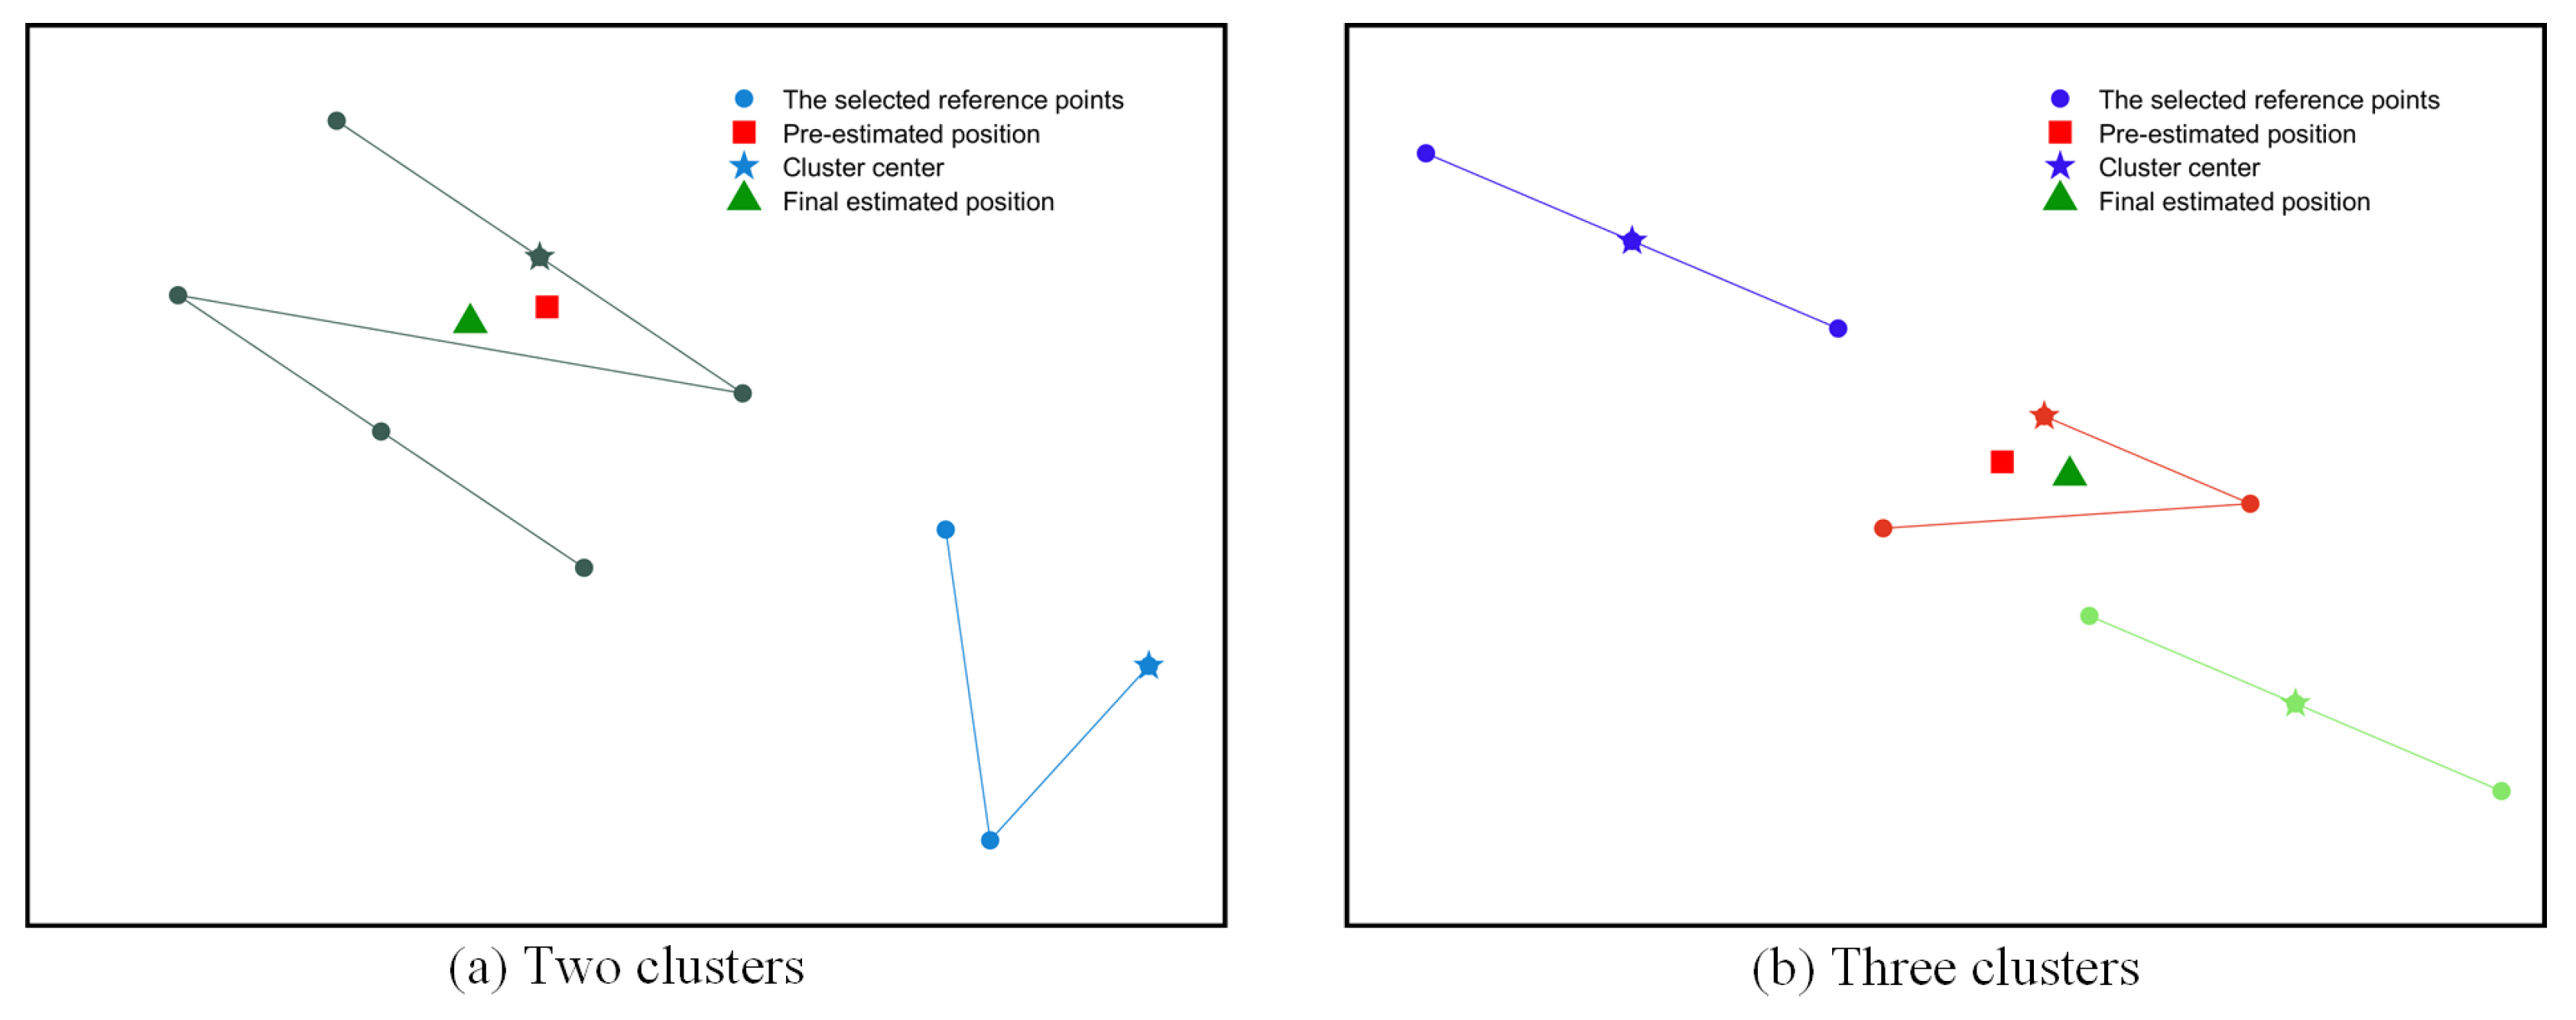
3.4. The Selection of Optimal Sub-Cluster by APC for Location Estimation
After compensating reference fingerprint by minimum value, online signal-domain distances between RSS readings and each cluster centroid can be calculated. The selected cluster corresponds to the minimum online signal-domain distance. RPs in the selected cluster will be further analyzed for choosing an optimal sub-cluster to improve positioning accuracy and stability.
Similarity between two fingerprints is represented by distance. The smaller the distance is, the more similar two fingerprints are. To describe how sub-cluster close to pre-estimated position, the online hybrid distance is adopted. After calculating hybrid distances between K RPs in sub-cluster and pre-estimated position, the sum of squared hybrid distances can be calculated by Equation (6). Where
is the sum of the squared online hybrid distances in a sub-cluster,
denotes the sum function,
is the number of RPs in a sub-cluster,
denotes the online hybrid distance. The sub-cluster with the minimum sum of squared hybrid distances can be selected as the optimal one. The criteria for selecting optimal sub-cluster is the least squares by minimizing the sum of the squared online hybrid distances, which can be expressed as Equation (7). Where the optimal sub-cluster is expressed by
,
is the function to return the corresponding index of the minimum value. In other words, the sub-cluster with minimum squared online hybrid distances is the optimal one.
The inverse distance weight method is used for location estimation, which can be expressed as Equation (8), where
is the estimated location,
and
are coordinate of the
th RP, the
th weight
is the inverse of online signal-domain distance,
is the sum of all weights.
The detailed description of selecting optimal sub-cluster by using APC for location estimation is as follows.
- (a)
K is set as a big value, but smaller than the number of RPs () in the selected cluster. Calculate all online signal-domain distances between RSS readings and RPs.
- (b)
Calculate the pre-estimated position () by using Equation (8). Meanwhile, calculate the equal weighted average fingerprint () based on fingerprints of RPs, forming the mapping of and .
- (c)
Calculate position-domain distances between K RPs. They are introduced into APC as similarities. K RPs are automatically divided into S sub-clusters ().
- (d)
If S equals to 1, the pre-estimated position () will be treated as the final estimated position (). Otherwise, go to the next step.
- (e)
Obtain online hybrid distances between K RPs and by using Equation (1).
- (f)
Calculate the sum of squared online hybrid distances in S sub-cluster s, respectively. Additionally, select the sub-cluster with minimum sum of squared online hybrid distances as the optimal sub-cluster by Equation (7).
- (g)
can be calculated by Equation (8).
Figure 5 shows the illustration of selecting optimal sub-cluster by using APC for location estimation. There are nine RPs participating for further selection and four kinds of points marked with different shapes. Solid dot, rectangle, pentacle and triangle represent the selected RP, pre-estimated position, cluster centroid and final estimated position, respectively. The connecting polyline denotes a sub-cluster.
4. Experiments and Analysis
This section shows experimental setup and the results of clustering and identification and evaluates positioning performance of the proposed method. To evaluate the positioning performance fairly, WKNN, EWKNN, AWKNN and SVM methods are introduced. For WKNN, K is chosen with best positioning accuracy, while K is adaptively determined in EWKNN and AWKNN. Hyperparameters of SVM are optimized by Bayesian optimization algorithm. Mean error (ME), root mean square error (RMSE) and maximum error (MaxE) are introduced as quantitative indexes to represent positioning performance. ME is an arithmetic average of the absolute errors, which can be the Euclidean distance between real coordinates and estimated ones. While RMSE represents the square root of the quadratic mean of differences between real coordinates and estimated ones. Accuracy and stability can be reflected by ME and RMSE, respectively. In this section, experimental setup, clustering results and analysis, cluster identification and comparisons of positioning accuracy and efficiency are conducted one by one.
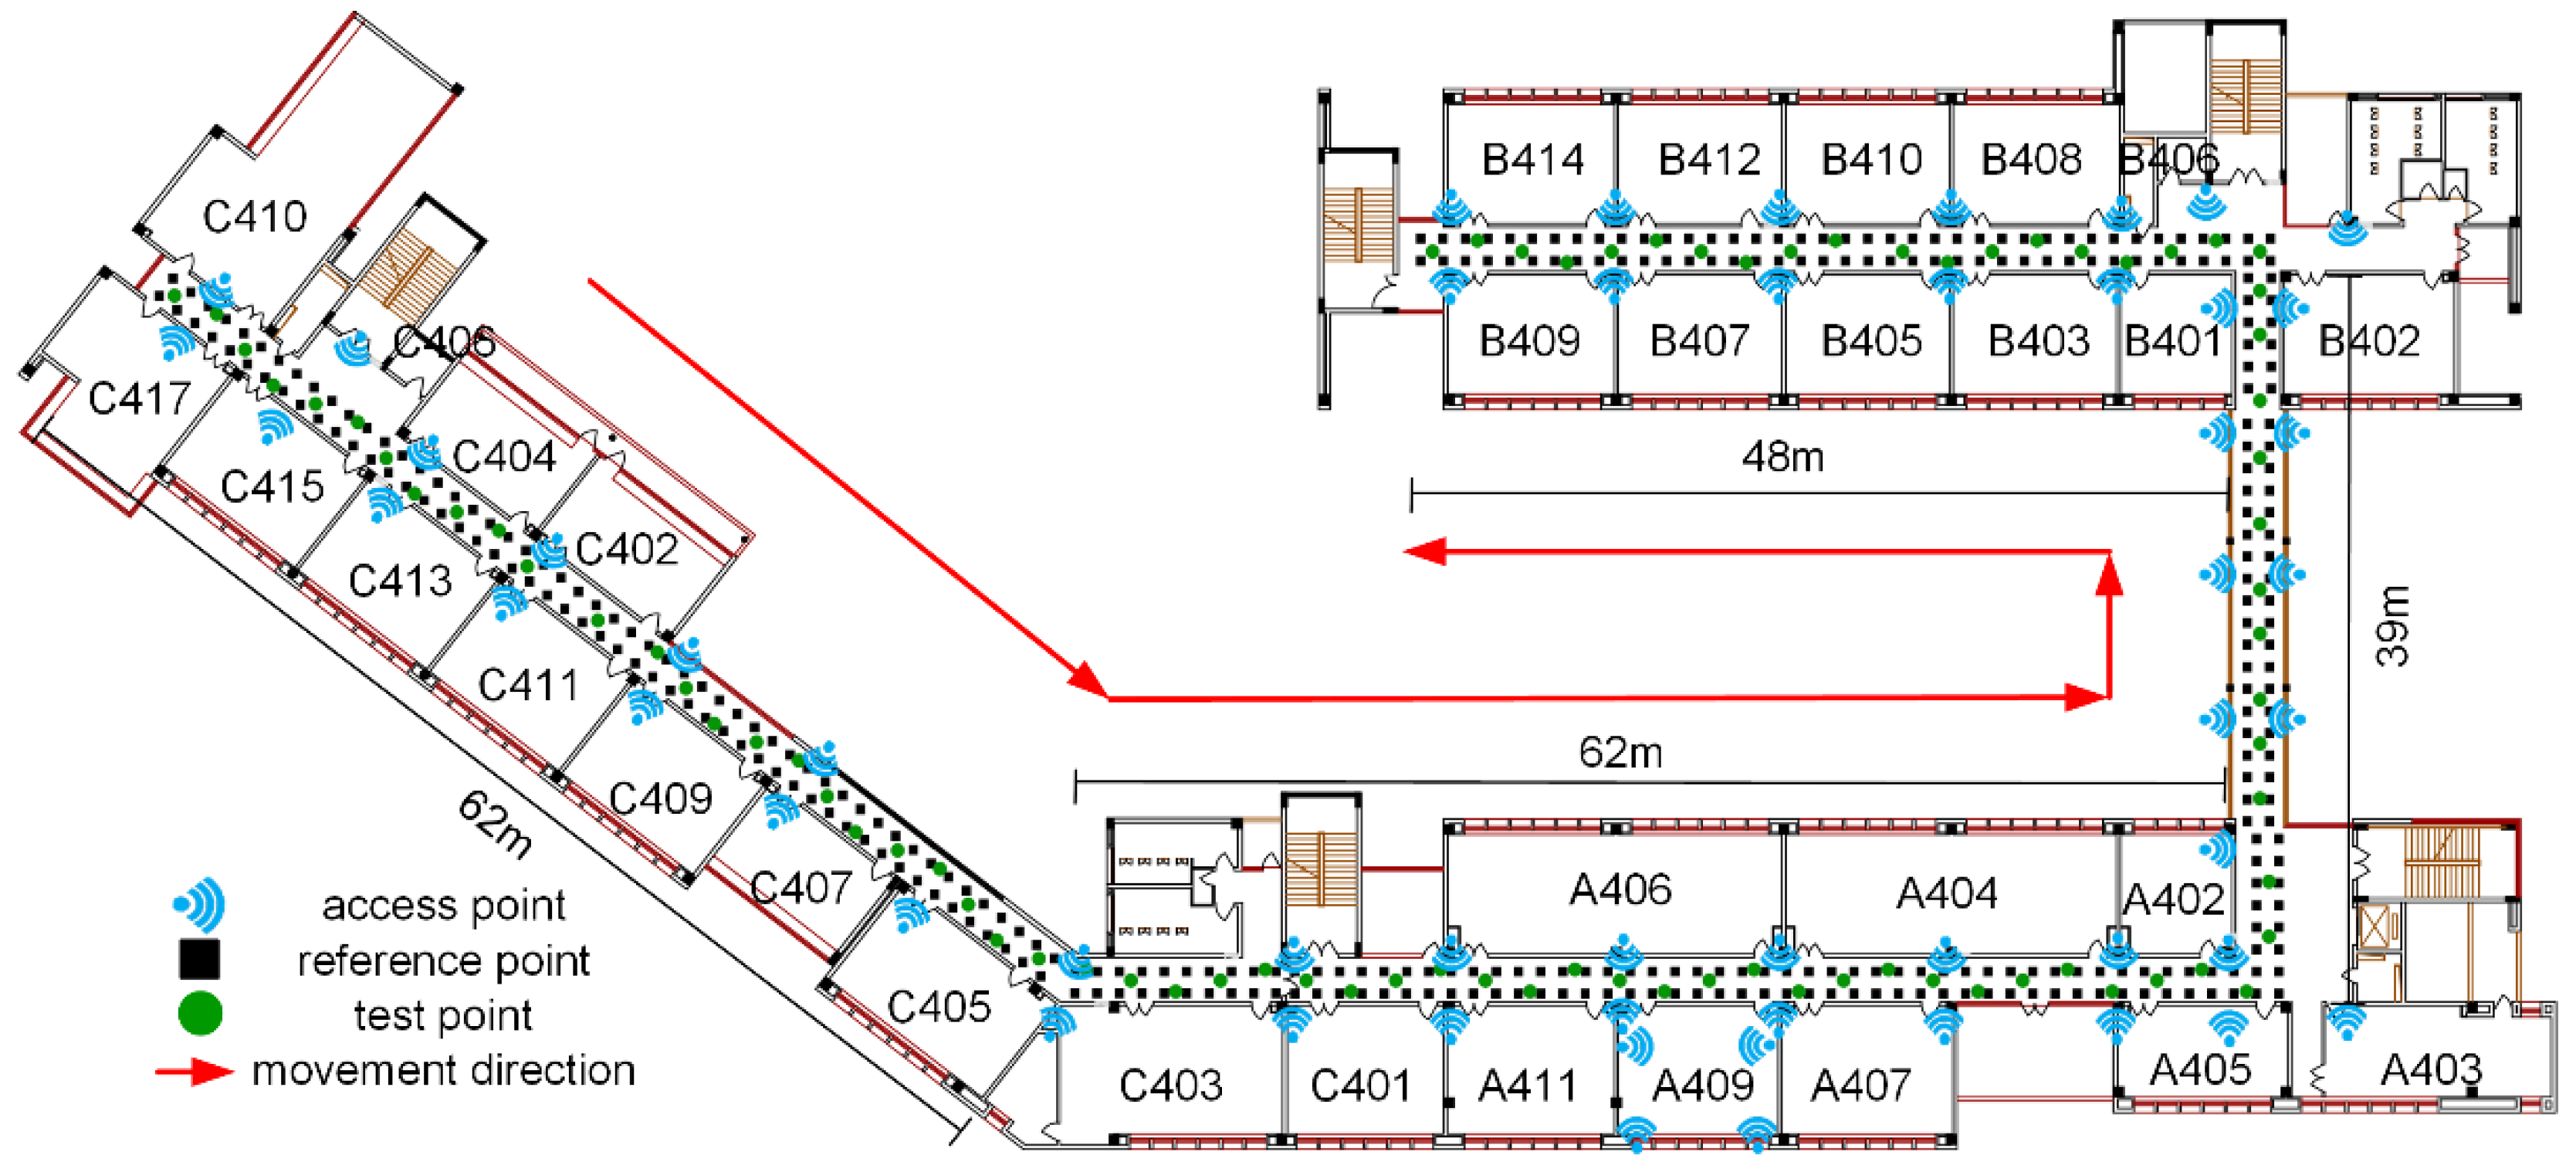
4.1. Experimental Setup
As is shown in
Figure 6, the experimental testbed mainly contains a corridor and rooms with the area of almost 3200 square meters. Fifty-two APs are installed in the corridor, and 4 are in room A409. During fingerprint collections, pedestrians are moving with normal activities. Three hundred and fifty-two RPs are uniformly deployed with the interval of 1.2 m in the testbed, marked by solid rectangle. At each RP, 60 samples are collected at a frequency of 1 Hz along some movement direction, as shown in
Figure 6. Eighty-two test points are evenly distributed in the testbed to evaluate the performance of different positioning methods. At each test point, 10 samples are collected with the same frequency and direction as offline collection, resulting in 820 samples. Each sample will cause a positioning result, similar to real-time localization.
4.2. Results and Analysis of Offline Fingerprint Clustering
K-means and FCM are two well-known clustering algorithms. They need to specify the number of clusters at first. Additionally, it is difficult to reasonably divide into partitions by experience for indoor environment with large coverage area. APC could adaptively generate clusters by means of the message-passing procedure between RPs, which is no need to appointing the number of clusters. Therefore, only APC is used to carry out into the clustering experiment without comparisons of the above two algorithms.
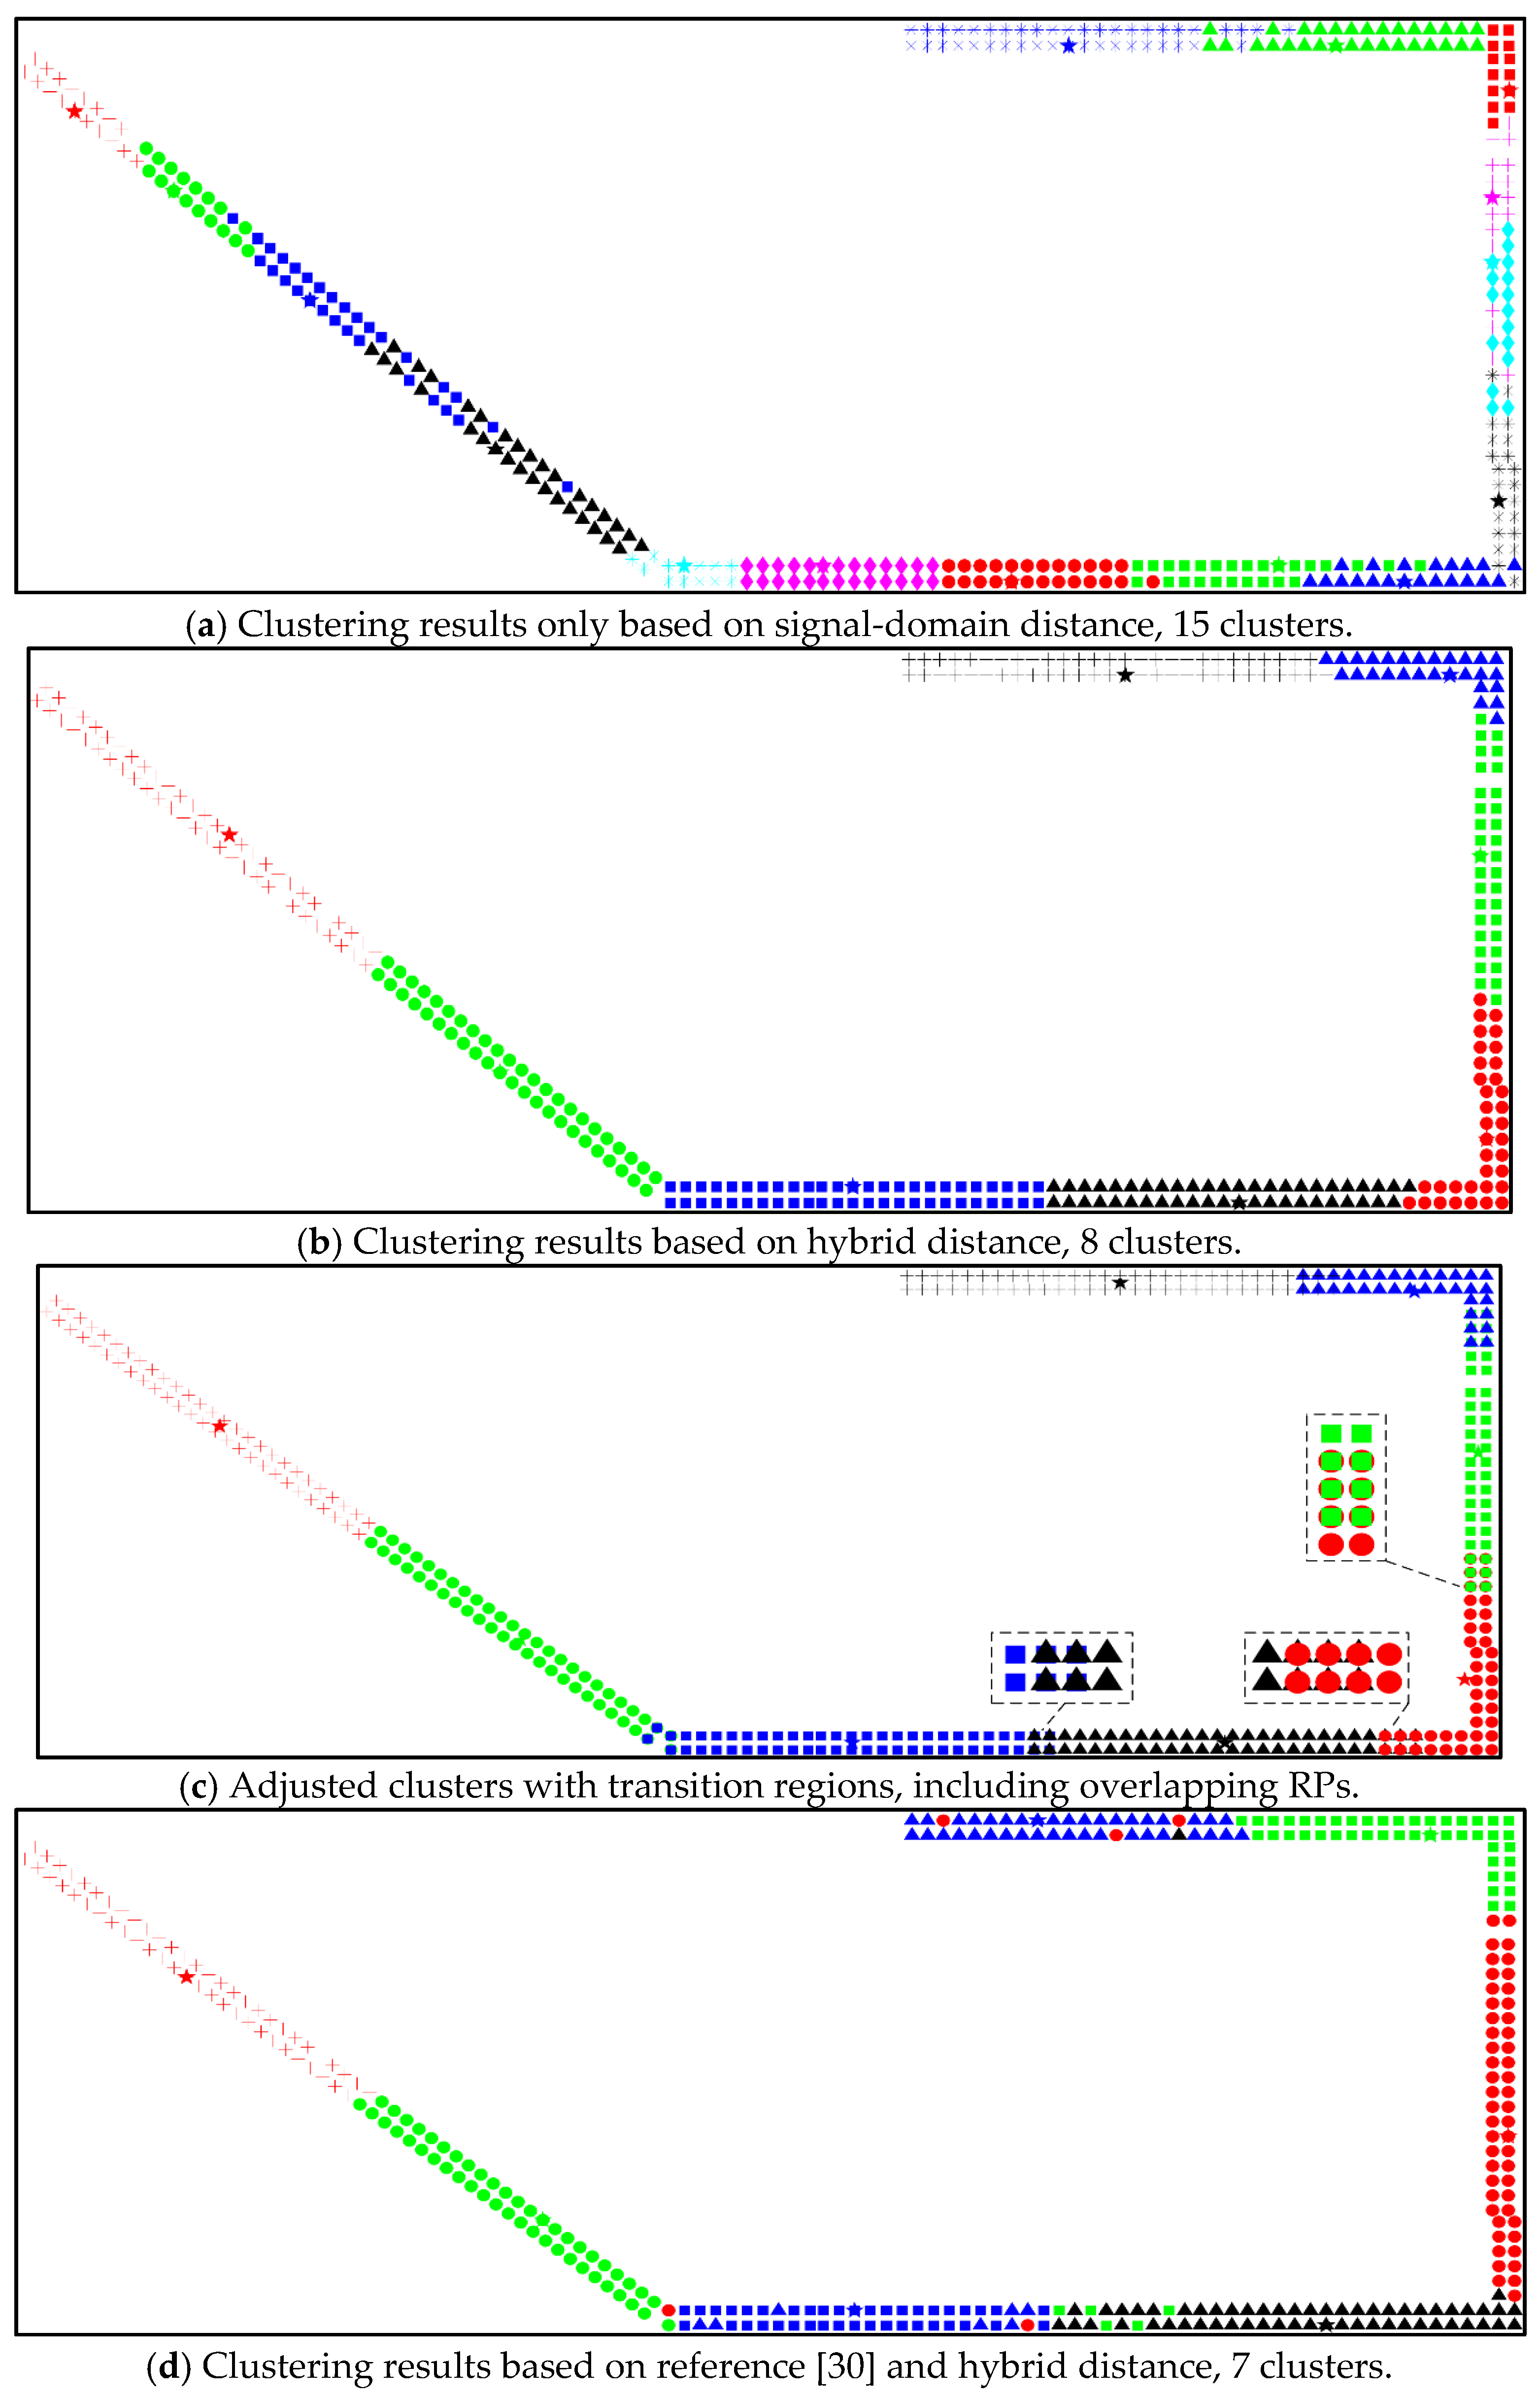
The offline hybrid distance is assigned as similarity. At the beginning of APC, preference is chosen as the minimum of similarities, leading to a small number of clusters. Considering a better accuracy of fingerprinting localization, the given radius is set as two meters. Clustering results based on offline signal-domain distance and hybrid distance, as well as adjusted clusters with transition region, are shown in
Figure 7. Each shape denotes one cluster, the pentacle denotes the cluster centroid.
In
Figure 7a, 15 clusters are formed based on signal-domain distance. There are messy intersections between clusters. Some clusters also have outliers. The effect of clustering is poor, with a significant difference between clustering results and actual layout, reflecting a dynamic and complex radio environment at the same time. The number of RPs in clusters are at most 43 and at least 13. In
Figure 7b, 8 clusters are generated based on hybrid distance. Outliers and messy intersections are disappeared. Additionally, clustering results reflect actual distribution. The number of RPs in clusters are at most 56 and at least 28. In
Figure 7c, the number of clusters is unchanged. However, the coverage area of clusters are enlarged based on transition region and given radius. The bigger given radius is, the larger enlarged coverage area is. Selection in a dashed box is adjusted to the transition region. Overlapping RPs belong to both adjacent clusters. The number of RPs in clusters are at most 58 and at least 34. There are more RPs in each cluster with the possibility of reducing cluster identification errors and improving positioning accuracy. Besides, cluster centroids have been updated in terms of position and signal. In
Figure 7d, 7 clusters are generated by using hybrid distance in reference [
30]. Although reference [
30] also employed hybrid distance, signal-domain distance in the offline stage is calculated without replacing the lost RSS values in reference [
30]. Additionally, the fingerprint database employed in this experiment is different from the reference [
30] in direction, the former is in 1 direction, while the latter is in 4 directions. Several clusters have outliers, leading to the failure of the adjustment between clusters.
Figure 7d behaves a big difference from results in reference [
30].
By comparing with other clustering results, signal-domain distance in the offline stage with replacing the lost RSS values and adjusting clusters with transition regions could reflect the actual distribution of RPs and increase the possibility of reducing localization error. Due to several outliers and the failure of adjustment between clusters in
Figure 7d, the following positioning evaluation is performed by using the clustering results of
Figure 7c.
4.3. The Effect on Cluster Identification of Adjusted Clusters and RSS Dynamic Compensation
Clusters based on offline hybrid distance behave better than that on offline signal-domain distance. In order to evaluate the performance of adjusted clusters and RSS dynamic compensation, comparisons of cluster identification based on results of
Figure 7b,c with different online signal-domain distances are, respectively, carried out. For convenient expression, clusters of
Figure 7b,c are, respectively, denoted as Cluster b and Cluster c. Online signal-domain distances calculated by using RSS compensation with a fixed value and minimum value are, respectively, denoted as
and
. Accuracy of cluster identification (ACI), rate of adjacent cluster (RAC) and error of cluster identification (ECI) are treated as statistical indicators. They can be calculated by Equation (9), where
is the number of TPs that are accurately identified,
is the total number of TPs, i.e., 820,
is the number of TPs that are identified as belonging to adjacent cluster,
is the number of misidentified TPs. It is easy to understand the definitions of ACI and ECI, which are rates of accurate identification and misidentification. If a test point actually belongs to a cluster, the identified result still belongs to this same cluster, then it is called as accurate identification; otherwise, it is a misidentification. ACI can be calculated by the number of accurate identification dividing total number of test points. Similarly, ECI can be calculated by the number of misidentification dividing total number of test points. In fact, however, there are situations where test points are located in two adjacent clusters, as shown in
Figure 2. Test point belongs to neither Cluster1 nor Cluster 2. In our opinion, it belongs to the adjacent cluster. Then, RAC can be calculated by the number of identified adjacent clusters dividing the total number of test points.
Table 1 shows statistics of identification based on different clusters and signal-domain distances. The accuracy of identification based on the original cluster (Cluster b) is lower than that on the adjusted cluster (Cluster c). The former mean ACI is 84.3%, while the latter is 93.55%. It fully demonstrates that the adjusted cluster is helpful to improve the accuracy of cluster identification. For adapting the same cluster (Cluster c), the ACI based on
and
are 92.9% and 94.2%, respectively. It means that only 1.3% accuracy improvement is obtained by using RSS compensation. However, accuracy reduction and ECI based on the original cluster (Cluster b) and
are emerged. The main reason is that the centroid of Cluster b is RP itself, its fingerprint is not able to represent the entire radio environment of cluster. In addition, adjacent cluster identified as the real one is reality. RAC based on Cluster b is up to 13.7%, while the mean RAC based on Cluster c is about 7.1%. Since adjusted clusters contain some RPs of adjacent ones, a positioning error is not good for adjusted clusters, even if misidentification as an adjacent cluster occurs. The ACI based on Cluster b and
is 86.3%, while the one on Cluster c and
is 94.2%. Accuracy is improved with 7.9% by using adjusted clusters and signal-domain distances with RSS dynamic compensation. Therefore, adjusted clusters and RSS dynamic compensation have a better effect on cluster identification.
4.4. Positioning Results and Analysis
4.4.1. The Improvement of Positioning Accuracy by Adjusted Clusters
For fair comparisons of positioning accuracy, the only one, WKNN is introduced to calculate localization results, using the common same distance. Meanwhile, to avoid the effect of cluster identification on positioning accuracy, the actual results by artificial identification are utilized. Minimum positioning errors with different K values of WKNN are based on a fingerprint database without clustering. Cluster b and Cluster c are summarized in
Table 2. In other words, when K is, respectively, set as 4, 3 and 3, these WKNN methods are based on different clusters to achieve the best positioning performance. Among them, ME, RMSE and MaxE of WKNN based on Cluster c are all the minimum, 3.155, 3.116 and 16.141 m. Compared with WKNN based on the fingerprint database without clustering, ME, RMSE and MaxE of WKNN based on Cluster c are decreased by 17%, 7.7% and 8%, respectively. Because the adopted identification results are really accurate, it is not enough to demonstrate the superiority of adjusted clustering. Compared with WKNN based on Cluster b, ME, RMSE and MaxE of WKNN based on Cluster c are decreased 5.1%, 5.7% and 8.8%, respectively. The only difference between the two methods is whether the clusters are adjusted. It is evident that adjusted clusters can improve the positioning accuracy and stability, limiting the maximum error.
4.4.2. The Improvement of Positioning Accuracy by the Proposed Method
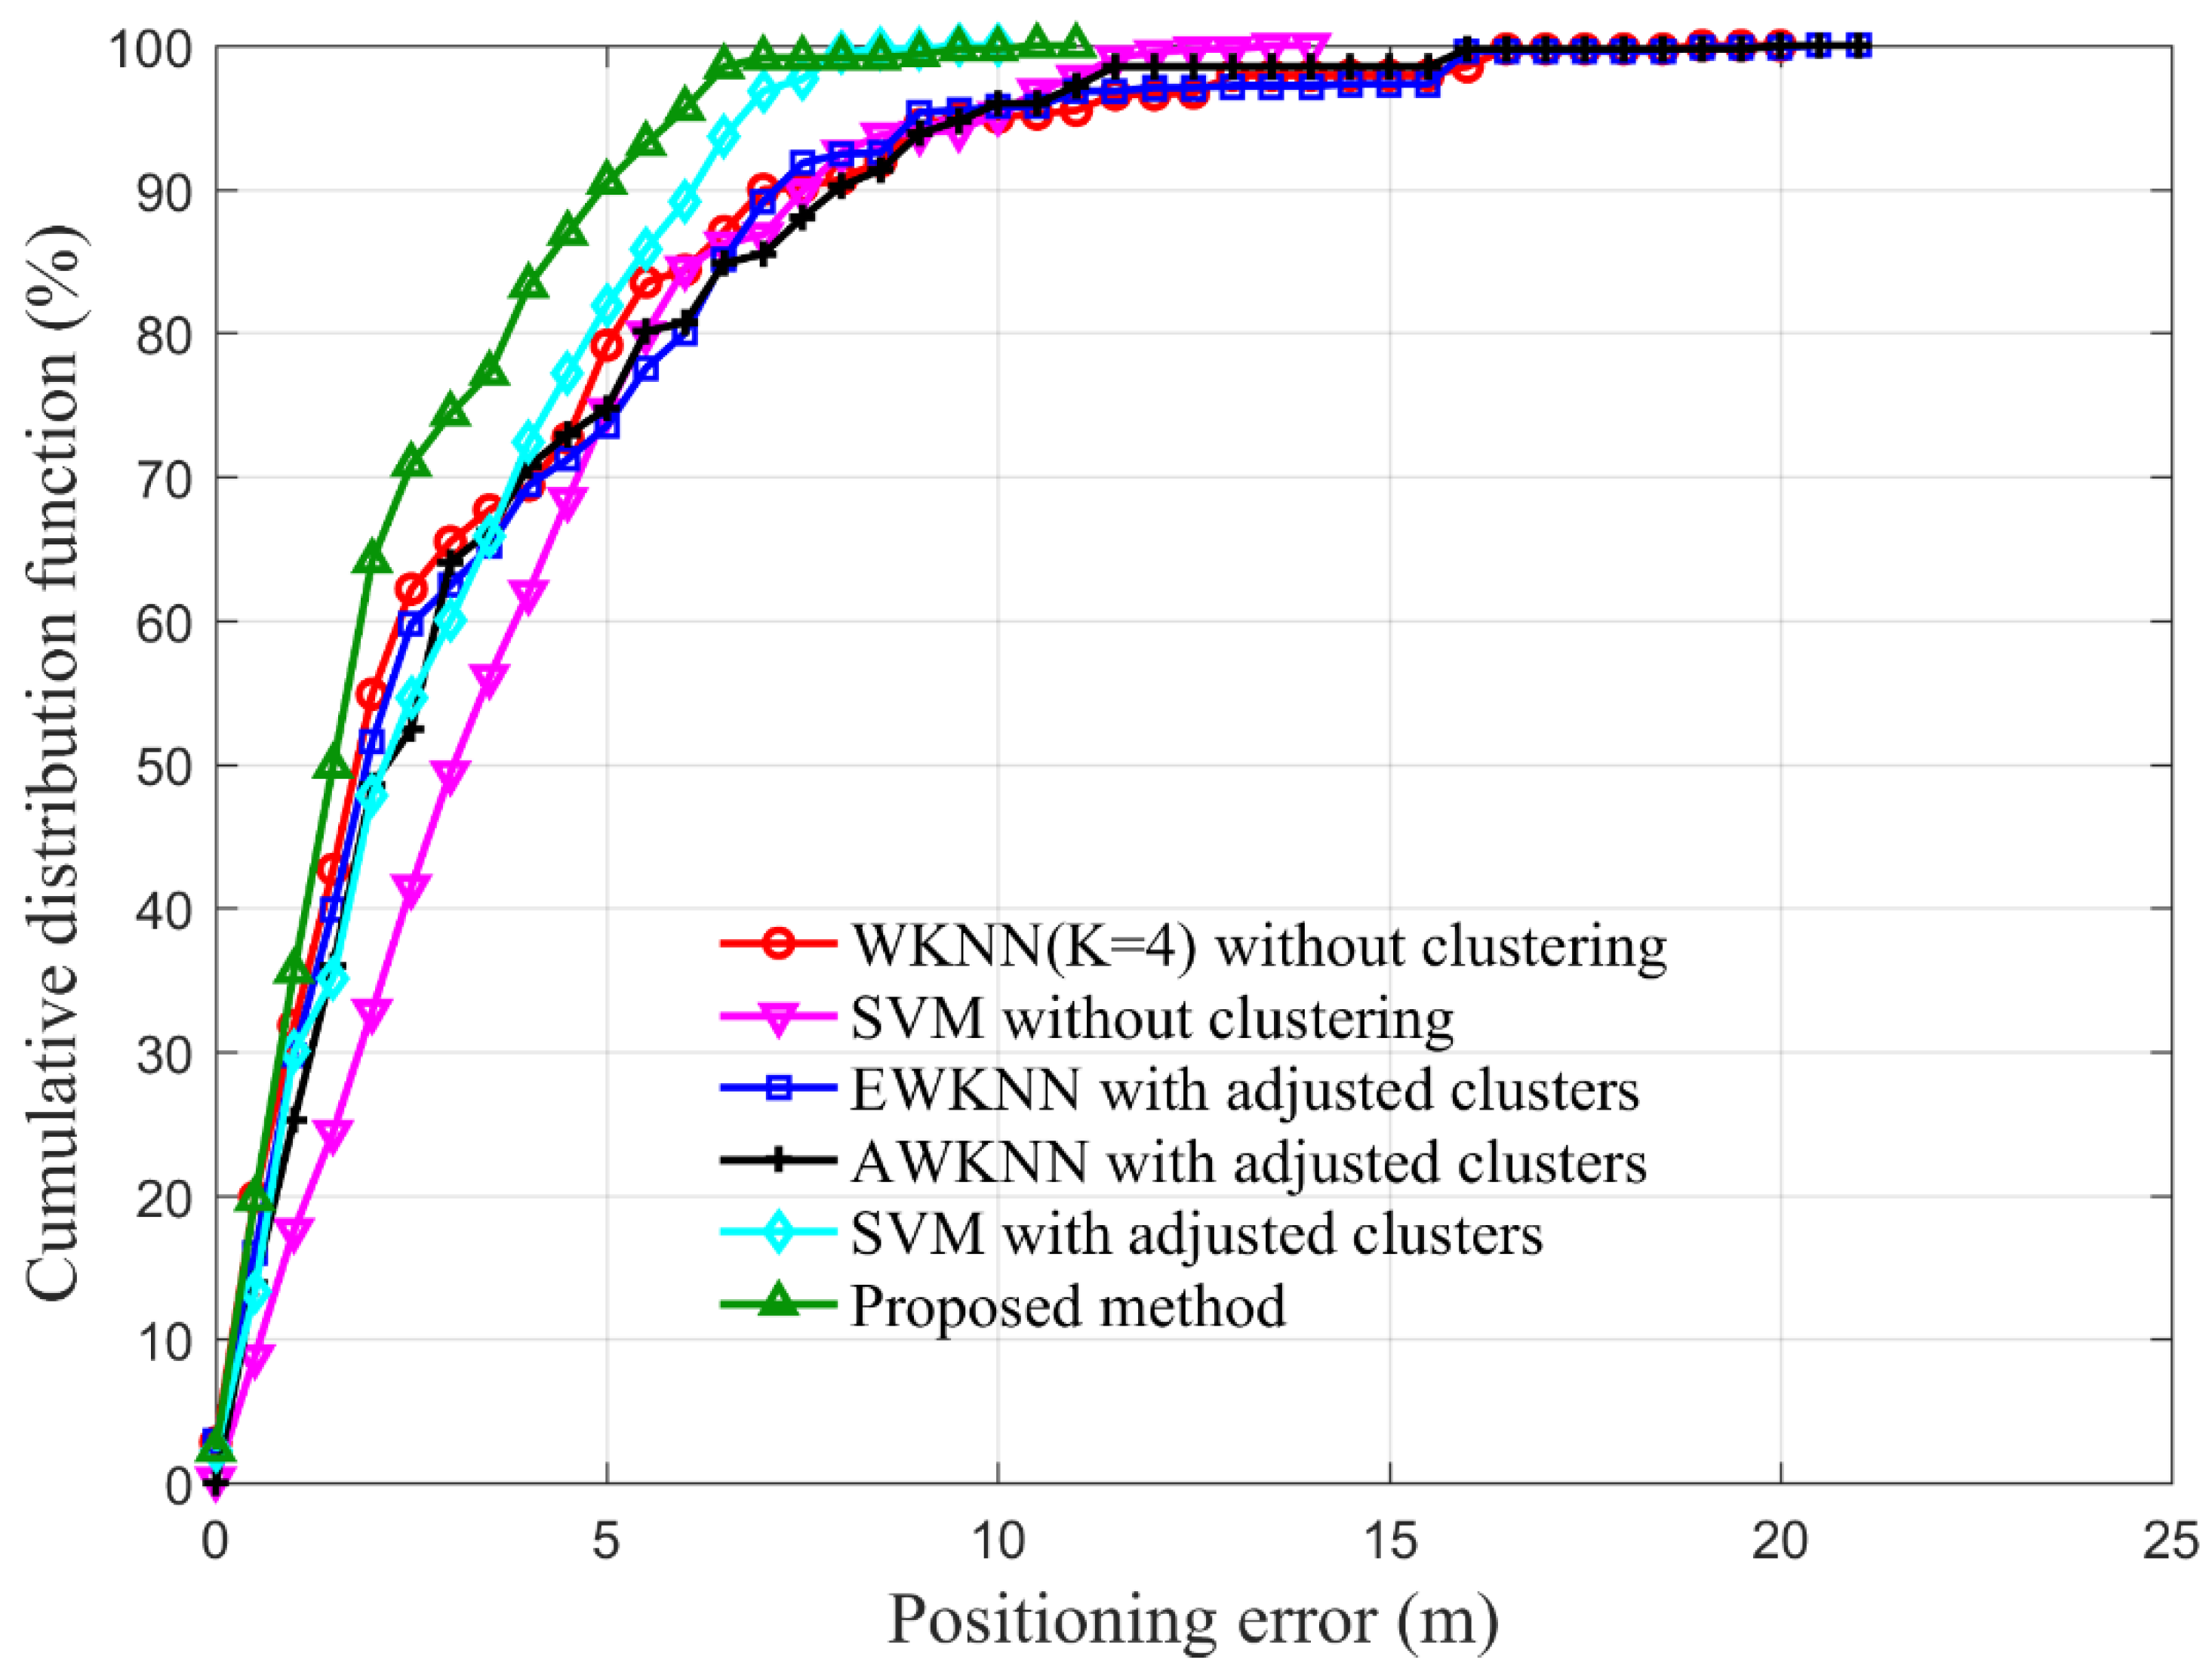
To evaluate the positioning accuracy of the proposed method, WKNN without a clustering fingerprint database, SVM without a clustering fingerprint database, EWKNN with adjusted clusters, AWKNN with adjusted clusters, and SVM with adjusted clusters are introduced to conduct comparisons. WKNN and SVM without a clustering fingerprint database denote that positioning methods determine a position throughout the whole fingerprint database. EWKNN, AWKNN and SVM with adjusted clusters denote that the positioning methods determine a position based on cluster identification results and adjusted clusters. The initial K of EWKNN, AWKNN and the proposed method is set as 9.
Figure 8 shows cumulative distribution functions (CDFs) of positioning errors corresponding to the above six methods, which are orderly denoted as a red line marked by circles, a magenta line marked by inverted triangles, a blue line marked by squares, a black line marked by crosses, a cyan line marked by diamonds and a green line marked by regular triangles. The cyan line is shorter than the others. The blue line is the longest. It seems that the cyan one has a smaller range of errors than the others. SVM with adjusted clusters has a minimum MaxE. Above all, MaxEs of the blue one and the black one are larger than 20 m, while the cyan and green ones are close to 10 m. At the same time, the green one is higher than the cyan, blue, red, magenta and black ones all the time. The proposed method illustrates results with higher accuracy than the others.
Table 3 shows statistics of positioning errors of WKNN without clustering, SVM without clustering, EWKNN, AWKNN, SVM with adjusted clusters and the proposed method. MEs of the above six methods are 3.756, 3.865, 3.481, 3.553, 2.981 and 2.328 m, respectively. The RMSEs of those are 3.378, 2.734, 3.443, 3.229, 2.130 and 1.865 m, respectively. MaxEs of those are 17.552, 13.348, 20.417, 20.155, 9.369 and 10.772 m, respectively. Compared with WKNN, EWKNN, AWKNN and SVM positioning accuracy of the proposed method is improved by 38.0%, 33.1%, 34.5% and 21.9%, and stability is improved by 44.8%, 45.8%, 42.2% and 12.6%. Meanwhile, MaxE is decreased by 38.9%, 47.5% and 46.8%, compared with WKNN, EWKNN and AWKNN. Among these six methods, SVM with adjusted clusters behaves better in terms of MaxE. Compared with the proposed method, MaxE is reduced by about 1.353 m. In general, the proposed method achieves better positioning performance among these six methods. The reason for effective improvement of positioning accuracy is the adoption of adjusting clusters, dynamic RSS compensation and further selection of nearest RPs. Additionally, the main reason for effective improvement of stability and the limitation of larger error is selecting position-concentrated RPs for estimating a position.
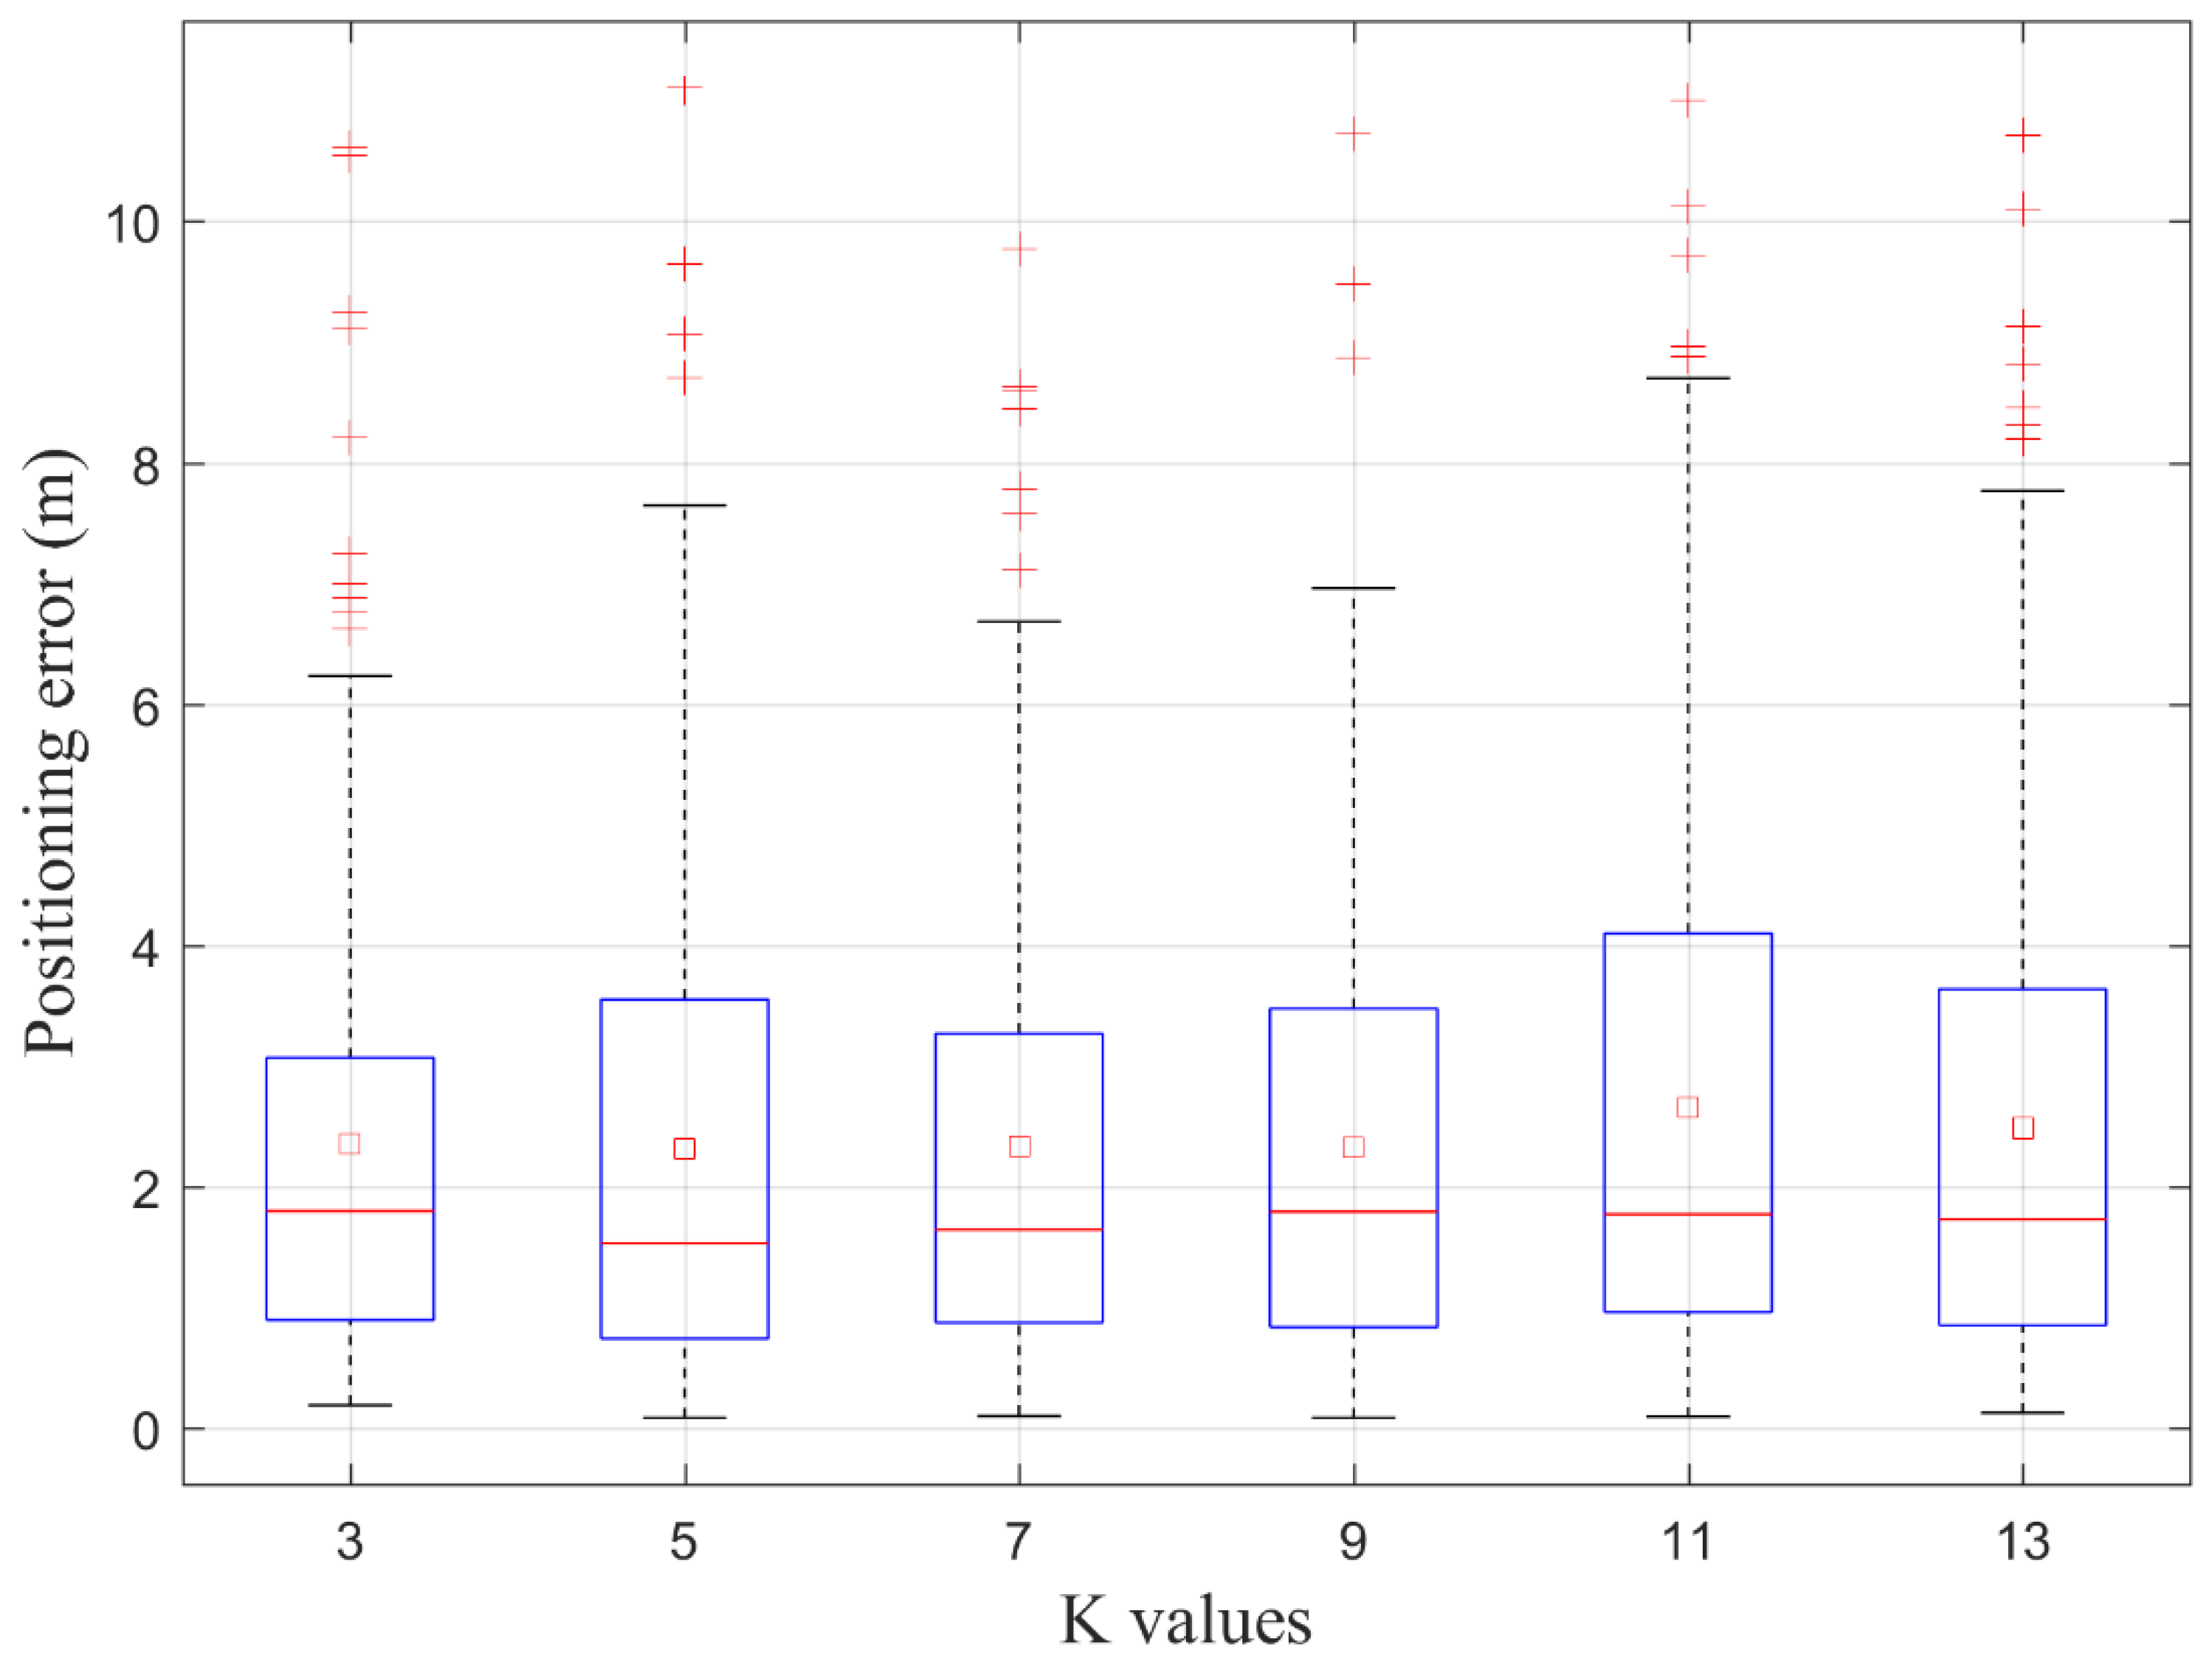
Positioning errors of the proposed method with different K values are illustrated by
Figure 9. The red line in the blue box denotes median error, the red square in the blue box represents ME, and the red plus outside of the blue box presents outliers with large errors. Although there are different performances on median errors and outliers with larger errors, the MEs of proposed method with different K values are rather close to each other, when K is less than 10. Statistics of positioning errors of the proposed method with different K values are shown in
Table 4. ME is about 2.3 m when K is less than 10. It can be found from both
Figure 9 and
Table 4, when K are set as 11 and 13, MEs become larger, as well as RMSEs. It means that the increase in K value does not bring an improvement in positioning accuracy and stability. On the contrary, the larger K values, the larger computation and errors. Therefore, large K values are not recommended. When K value is less than 10, the proposed method can keep positioning accuracy constant and avoid the influence of K value on it. However, when K is 9, RMSE is minimum. The number of red pluses outside of the blue box in
Figure 9 could represent the distribution of large errors to some extent. The redder the plus, the larger the errors. Although the MaxE is minimum when K is 7, the number of red pluses is obviously smaller than others when K is 9. As a consequence, when K is 9, the proposed method achieves better localization performance with the ME of 2.328 m and the RMSE of 1.865 m. This is also the reason for the recommendation to set K to 9.
4.4.3. The Effect on Cluster Identification and Positioning Accuracy of Radius
In the previous section, 2 m is recommended to set as the given radius for adjusting clusters. However, what is the effect of radius size on cluster identification and positioning accuracy? The radius is set to increase the number of RPs in a cluster, which are located in the margin of adjacent clusters. In this case, when the real location of the test point is located in the margin of adjacent clusters, more nearby RPs can participate into the location estimation, and the positioning result will not be too bad. However, it does not mean that the more RPs in the margin of clusters, the better the positioning performance. A comprehensive consideration of the accuracy of cluster identification and localization is required to determine the radius size.
The interval between two adjacent RPs is often determined by experimenters according to actual situation and demands. It could be 0.5 m, 1 m, 2 m or even 10 m. If the radius is set as several-fold intervals, the radius is changing, as well as the effect on cluster identification and positioning accuracy, and optimal results cannot always be obtained. A fixed radius based on fingerprinting localization accuracy can avoid this phenomenon. The convincing accuracy of fingerprinting localization is from 2 to 5 m in a large area. Under the consideration of clusters’ range and difference, as well as computation load, larger distances are not recommended. Therefore, 2 m, 3 m, 4 m and 5 m are taken as the radius to test effects on the accuracy of cluster identification and localization.
When the radius is set as different values, locations and fingerprints of cluster centroids are also updated accordingly, resulting in a different performance of cluster identification and localization.
Table 5 shows the statistics of cluster identification and localization with a different radius from 2 to 5 m, where the positioning method is the proposed one and K is 9. When the radius is set from 2 to 5 m, the rate of cluster misidentification is all 0. This is strong evidence that adjusting clusters could improve the accuracy of identification. When the radius is set as 2 m, ACI is the maximum, 94.2%. As the radius increases, the accuracy of cluster identification decreases gradually, and RAC is also increasing. The main reason is that differences between the fingerprints of cluster centroids are decreasing with the increase in radius, when they are less than 5 m. It is worth noting that when the radius is set from 2 to 5 m, MEs are about 2.3 m, RMSEs are about 1.8 m, while MaxEs are the same. That is, accuracy and stability of localization are basically constant when the radius is less than 5 m. However, there are differences in computation load. Obviously, the larger the radius, the heavier the computation load. The strongest suggestion is to set the radius as 2 m.
4.5. The Efficiency of the Proposed Localization Method
In addition to positioning accuracy and stability, efficiency is also a common indicator of positioning methods. Average handling time is used to reflect efficiency. The shorter the average handling time, the higher the efficiency. WKNN without a clustering fingerprint database, EWKNN with adjusted clusters, and AWKNN with adjusted clusters are also introduced to evaluate the efficiency of the proposed localization method. The whole evaluation includes cluster identification and location estimation, without involving processes during the offline stage. SVM-based positioning methods usually occupy a huge amount of computing resources and spend a long time on model training during the offline stage. Therefore, the average handling time of an SVM-based positioning method is not used for statistics and comparison.
Table 6 shows the statistics of the average handling time of four methods, where K is 4 in WKNN without clustering, K is 9 in EWKNN, AWKNN and the proposed method based on adjusted clusters. The average handling time is obtained by ten operation times on the simulation platform, MATLAB 2016a. Each operation can generate positioning results of 820 samples. The processor model is Intel i7-9700k with the main frequency of 3.6 GHz. Among them, AWKNN with adjusted clusters has the longest average handling time, 10.637 s; WKNN without clustering has a long average handling time, 9.457 s; EWKNN with adjusted clusters has the shortest one, 1.750 s; the proposed method has the middle one, 5.078 s. The reason for WKNN algorithm with a long average handling time is that traversing all RPs in the whole area is very time-consuming. While the reason for using the AWKNN algorithm with the longest average handling time is multiple conditional judgments to find the empirically optimal sub-cluster. The average handling time can be greatly shortened with the help of clustering. EWKNN with adjusted clusters is the most efficient, while WKNN is in low efficiency. To our knowledge, WKNN is a common and effective method. While the efficiency of the proposed method is 1.862 times that of WKNN; therefore, the proposed method is also an effective one.
5. Discussion
Google has adjusted the Android operation system from level 26 and made a limitation on WiFi scanning, resulting in four RSS scanning in 2 min. However, most smartphones still use the original operating system without restrictions. Moreover, APs that support FTM measurements are very expensive. Due to the need to establish the connection between the AP and smartphone in advance, it is still not easy to obtain FTM measurements. So far, applications on a large scale are very difficult. The real-time RSS-based fingerprinting method is still an effective approach of indoor positioning.
Continuous propagation of wireless signals makes the clustering boundary difficult to determine. Hard divisions are avoided by absorbing the number of RPs in adjacent clusters within a given radius to construct transition regions. Positioning errors of test points on the clustering boundary can be decreased by more RPs in adjusted clusters, even if there are adjacent cluster identification errors. Generally speaking, the more RPs adjusted clusters have, the higher the positioning accuracy is. However, clusters with many RPs is unrealistic. In view of the optimal accuracy of fingerprint positioning, it is recommended to set the given radius as 2 m.
RSS is very sensitive to the indoor environment and layout. It is advisable to obtain the mean RSS by data collection during a long period of time. There is no doubt that to replace the loss RSS with a fixed value in the offline stage is correct. The coverage area of an AP is limited. The number of detected APs at the target location is usually different from RPs. In other words, some detected APs at the target location do not appear in the list of scanned APs at RPs. Due to the dynamic environment, it is a mistake to adopt a fixed value to replace. Experiments of cluster identification and localization have demonstrated that it is an effective approach to utilize the minimum RSS value to dynamically compensate the reference fingerprint.
For WKNN and EWKNN, K has an important effect on positioning accuracy. The proposed method chooses the optimal sub-cluster that is with the minimum sum of squared distance by APC from K first-selected RPs. No matter what the value of K is, the proposed method can obtain the optimal sub-cluster with position-concentrated RPs for estimating the location, so that MEs are insensitive to the K value, as is shown in
Table 4. However, if K is greater than 10, MEs will become greater than that of less than 10. Furthermore, if K is set as an even value, APC will report error messages. Therefore, K values keeping MEs basically constant are confined to odd values from 3 to 9.
Differences between AWKNN in reference [
30] and the proposed method are RSS compensation producing different signal-domain distances in offline and online stages and the way to select the optimal sub-cluster. Offline signal-domain distance leads to different clustering results from that in reference [
30]. Online signal-domain distance, the way to select the optimal sub-cluster and a fingerprint database in one direction jointly make AWKNN have worse positioning performance than the proposed method. Compared with AWKNN, the proposed method achieves reductions in mean positioning error, RMSE and MaxE with 34.5%, 42.2% and 46.8%. Additionally, the average handling time of the proposed method is reduced by 52.3%.
Compared with WKNN, EWKNN, AWKNN and SVM, the proposed method is a significant improvement, achieving good performance of accuracy, stability and efficiency. An idea of deeply mining information between reference points is provided. Additionally, this is a good attempt to estimate location using fingerprints in a large-scale area. Therefore, the proposed method will provide reference for researchers and production personnel. Because the proposed method belongs to wireless fingerprinting localization one, it should be of interest to readers, researchers and production personnel in the areas of indoor positioning based on WiFi, BLE and other wireless sensor networks in a large-scale area. Additionally, we believe that better positioning performance can be achieved with the suggested parameters, such as minimum RSS value for compensation, a radius of 2 m and a K value of 9.
However, the above result is a simulation rather than an exact real-time online positioning test. Compared with the simulation, the real-time online positioning test usually behaves a little bit worse in accuracy, stability and efficiency. WiFi fingerprint positioning methods still face multiple challenges in real-time online application, such as workload of collecting signal fingerprint and the effect on RSS of changing environment and pedestrian and the user’s movement. As a result, large errors are obtained in some locations, exceeding 10 m in maximum, resulting in poor experience of location-based service. This raises the need for the fusion of some high-precision and continuous positioning techniques. Inertial sensors or PDR [
16] computer vision [
31] could be introduced to obtain good positioning results in indoor positioning and indoor navigation.
6. Conclusions
This study proposes an improved fingerprinting localization method by using clustering algorithm and dynamic compensation, with an ME of 2.328 m, RMSE of 1.865 m and MaxE of 10.722 m in a testbed of 3200 squared meters. By comparing with WKNN, EWKNN and AWKNN methods, ME, RMSE and MaxE are reduced by at least 33.1%, 42.2% and 38.9%, respectively. Compared to the SVM method with adjusted clusters, ME and RMSE are reduced by about 21.9% and 12.6%. Although the MaxE of the proposed method is larger than that of SVM with adjusted clusters, it is obvious that the proposed method outperforms other methods in positioning accuracy and stability, as well as the limitation of maximum error. Moreover, the proposed method keeps positioning accuracy basically constant within odd values from 3 to 9, which avoids the fluctuation of positioning accuracy caused by K value. Reasons for the above outcomes are hybrid distance by using dynamic compensation to more accurately characterize the similarity between two fingerprints, the adjustment of clusters considering transition region to avoid larger error causing by cluster misidentification and the criteria of the least squared online hybrid distances for further clustering to obtain an optimal sub-cluster, selecting position-concentrated RPs to achieve higher accuracy and stability. The proposed method could be applied in the areas of indoor positioning and indoor navigation based on WiFi, Bluetooth and other wireless sensor networks in a big building, for example, shopping mall, museum, airport, train/subway station and other GNSS-denied space.


 ,
, 


