1. Introduction
Knowledge of physical and social environments is a prerequisite for the planning and implementation of community-based projects. The demarcation of land boundaries is one of the crucial phases of the land use planning process [
1], which currently uses various methods and techniques, including spatial technologies [
2]. To date, there has been no fixed method for identifying land demarcations with the use of participatory GIS (PGIS) data. Various studies have been conducted in community-based land-use planning [
3], where participatory GIS techniques have the potential for village-scale land-use planning [
4], which requires the participation of multiple stakeholders in the community. The commonly used approach, participatory resource mapping (PRM), which is an effective tool, enables communities to articulate their knowledge of their surrounding physical environment [
1].
In this context, the objective of this study was to illustrate the potential usefulness of the PGIS approach, along with other spatial techniques, to demarcate the land boundaries of villages in the eastern boundary of Wilpattu National Park (WNP), Sri Lanka. The PGIS approach has not been used so far in Sri Lanka for forming land boundaries. However, several studies have been carried out in other countries using the PGIS approach for boundary demarcation [
5] (pp. 697–703).
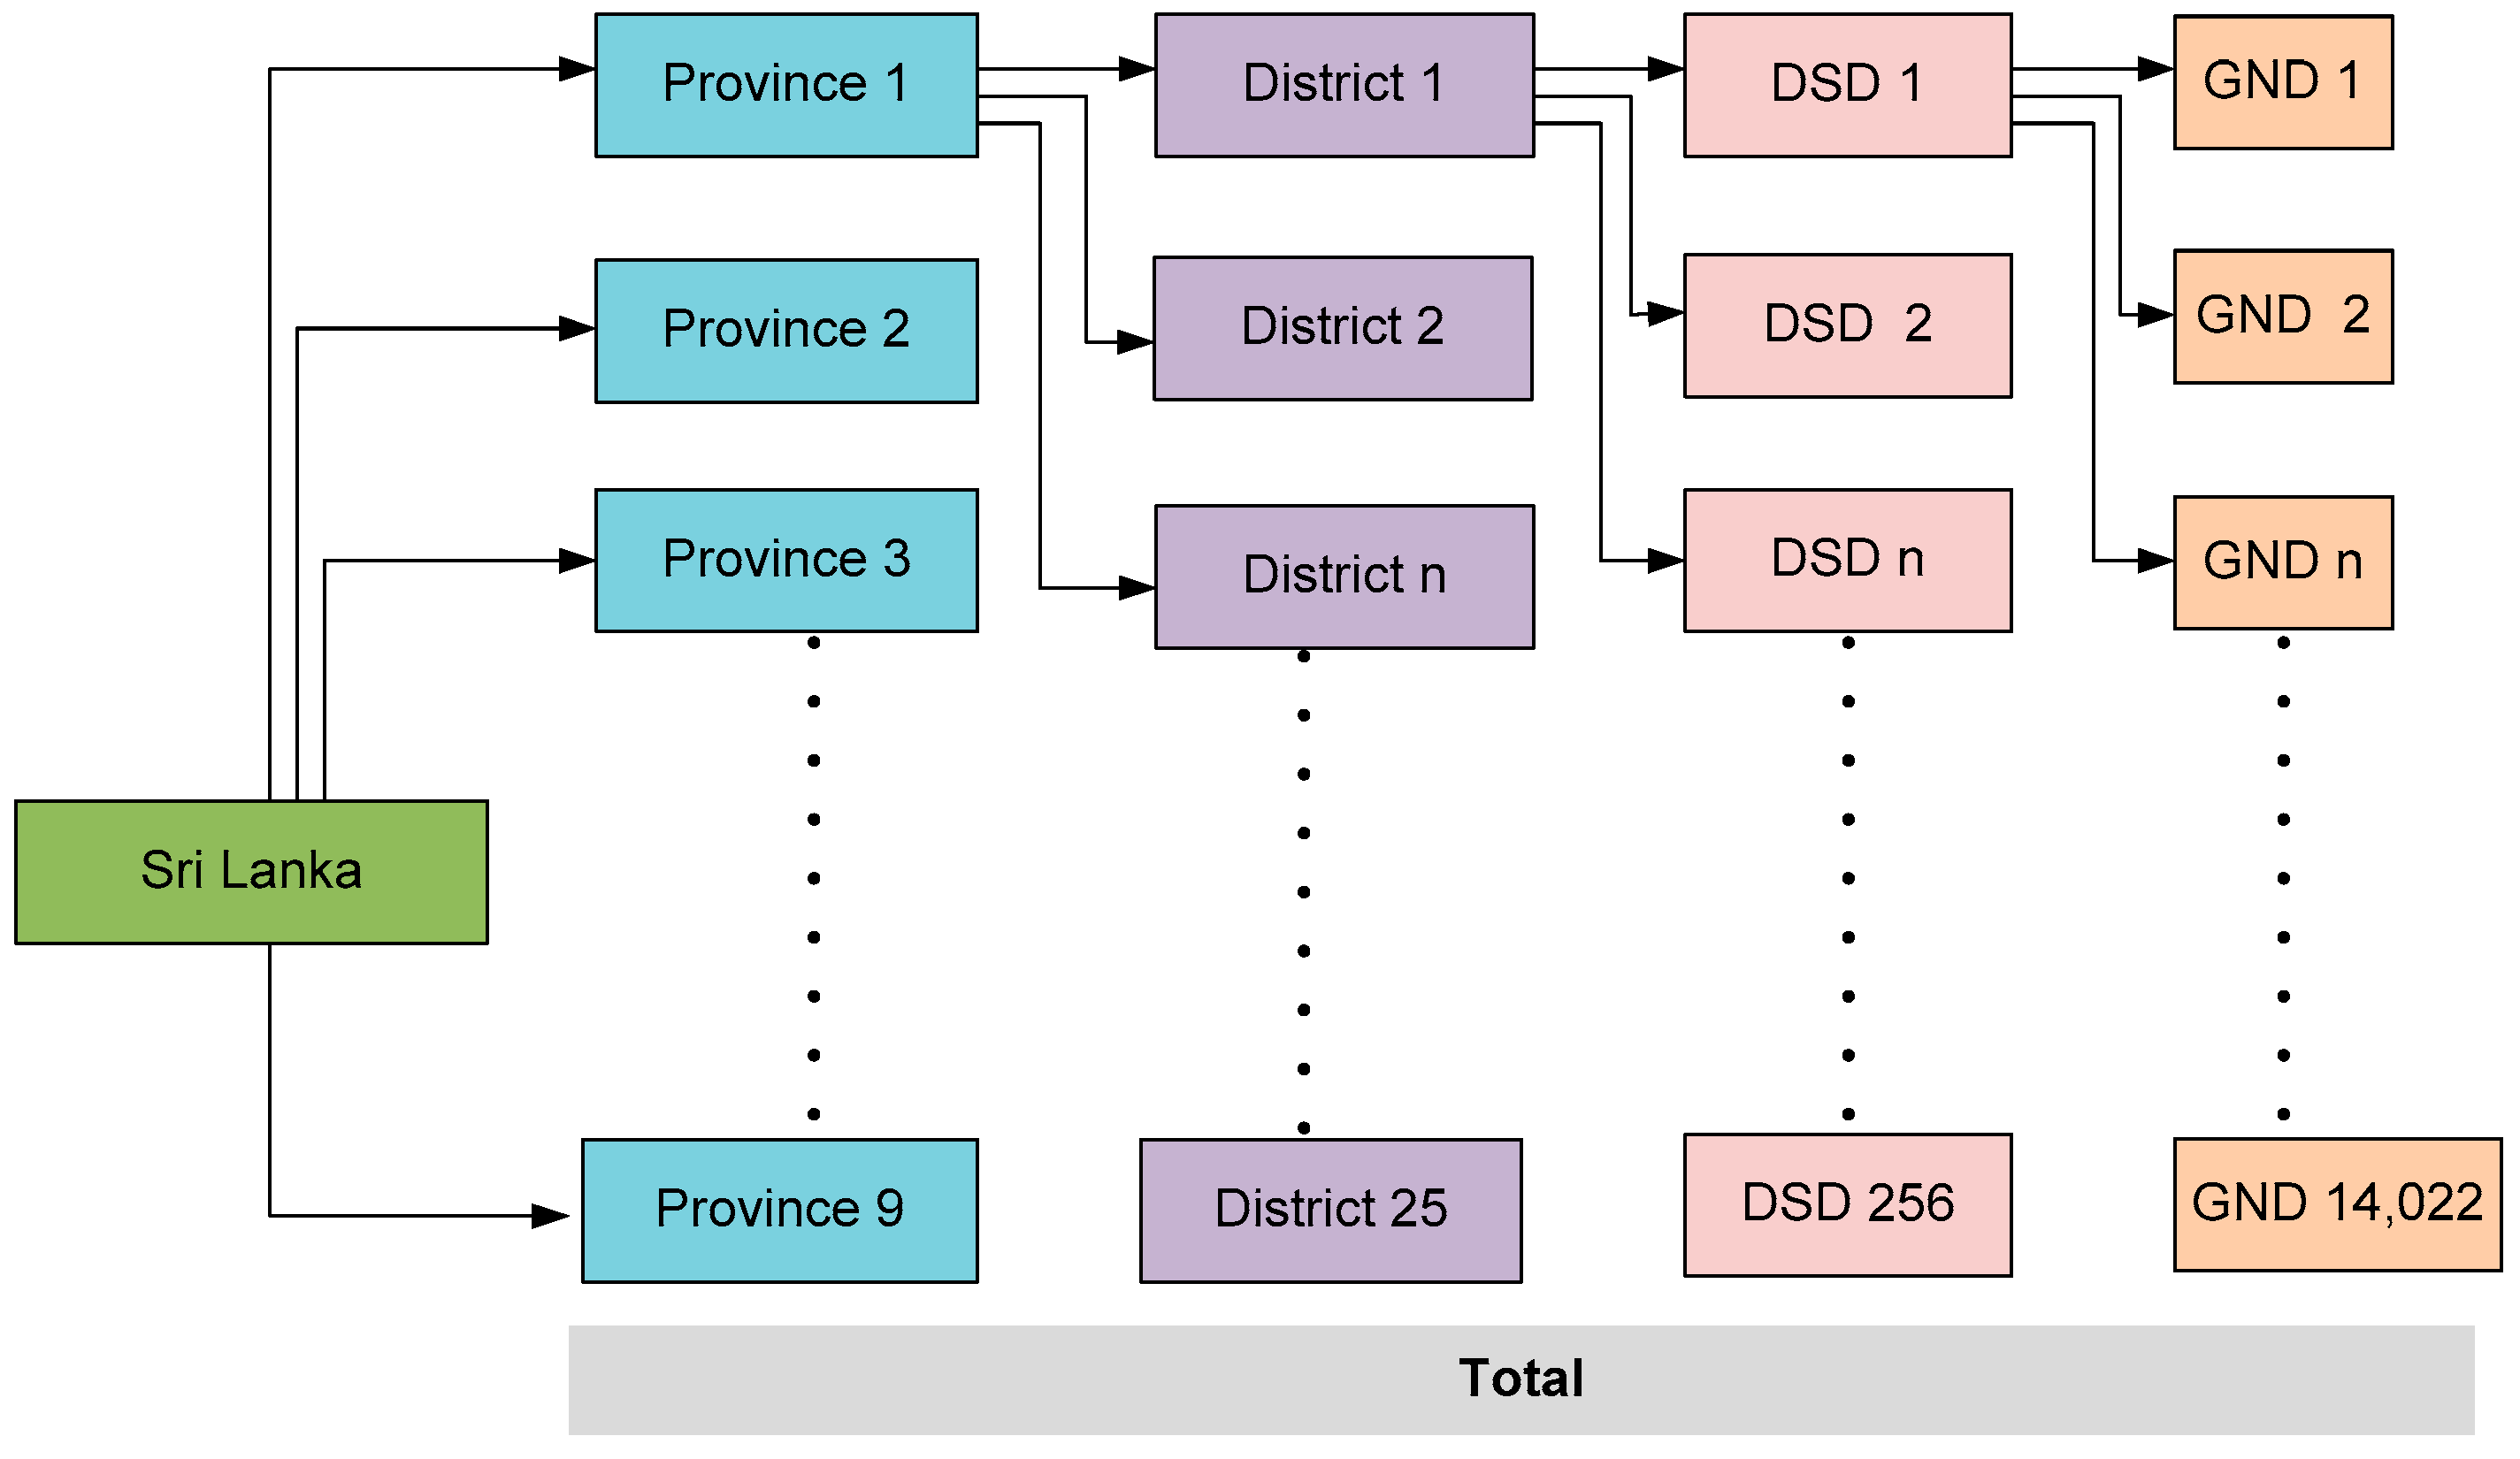
Sri Lanka is a tropical country located in South-East Asia, surrounded by the Indian Ocean. It has an area of 65,000 square kilometers and four major administrative boundaries, namely, provinces, districts, divisional secretariat divisions (DSDs), and Grama Niladhari divisions (GNDs). Sri Lanka presently has nine provinces, 25 districts, 331 divisional secretariat divisions (DSDs), and 14,022 Grama Niladhari (GN) divisions, demarcated as administrative boundaries.
Figure 1 illustrates the hierarchical arrangement of administrative boundaries in Sri Lanka.
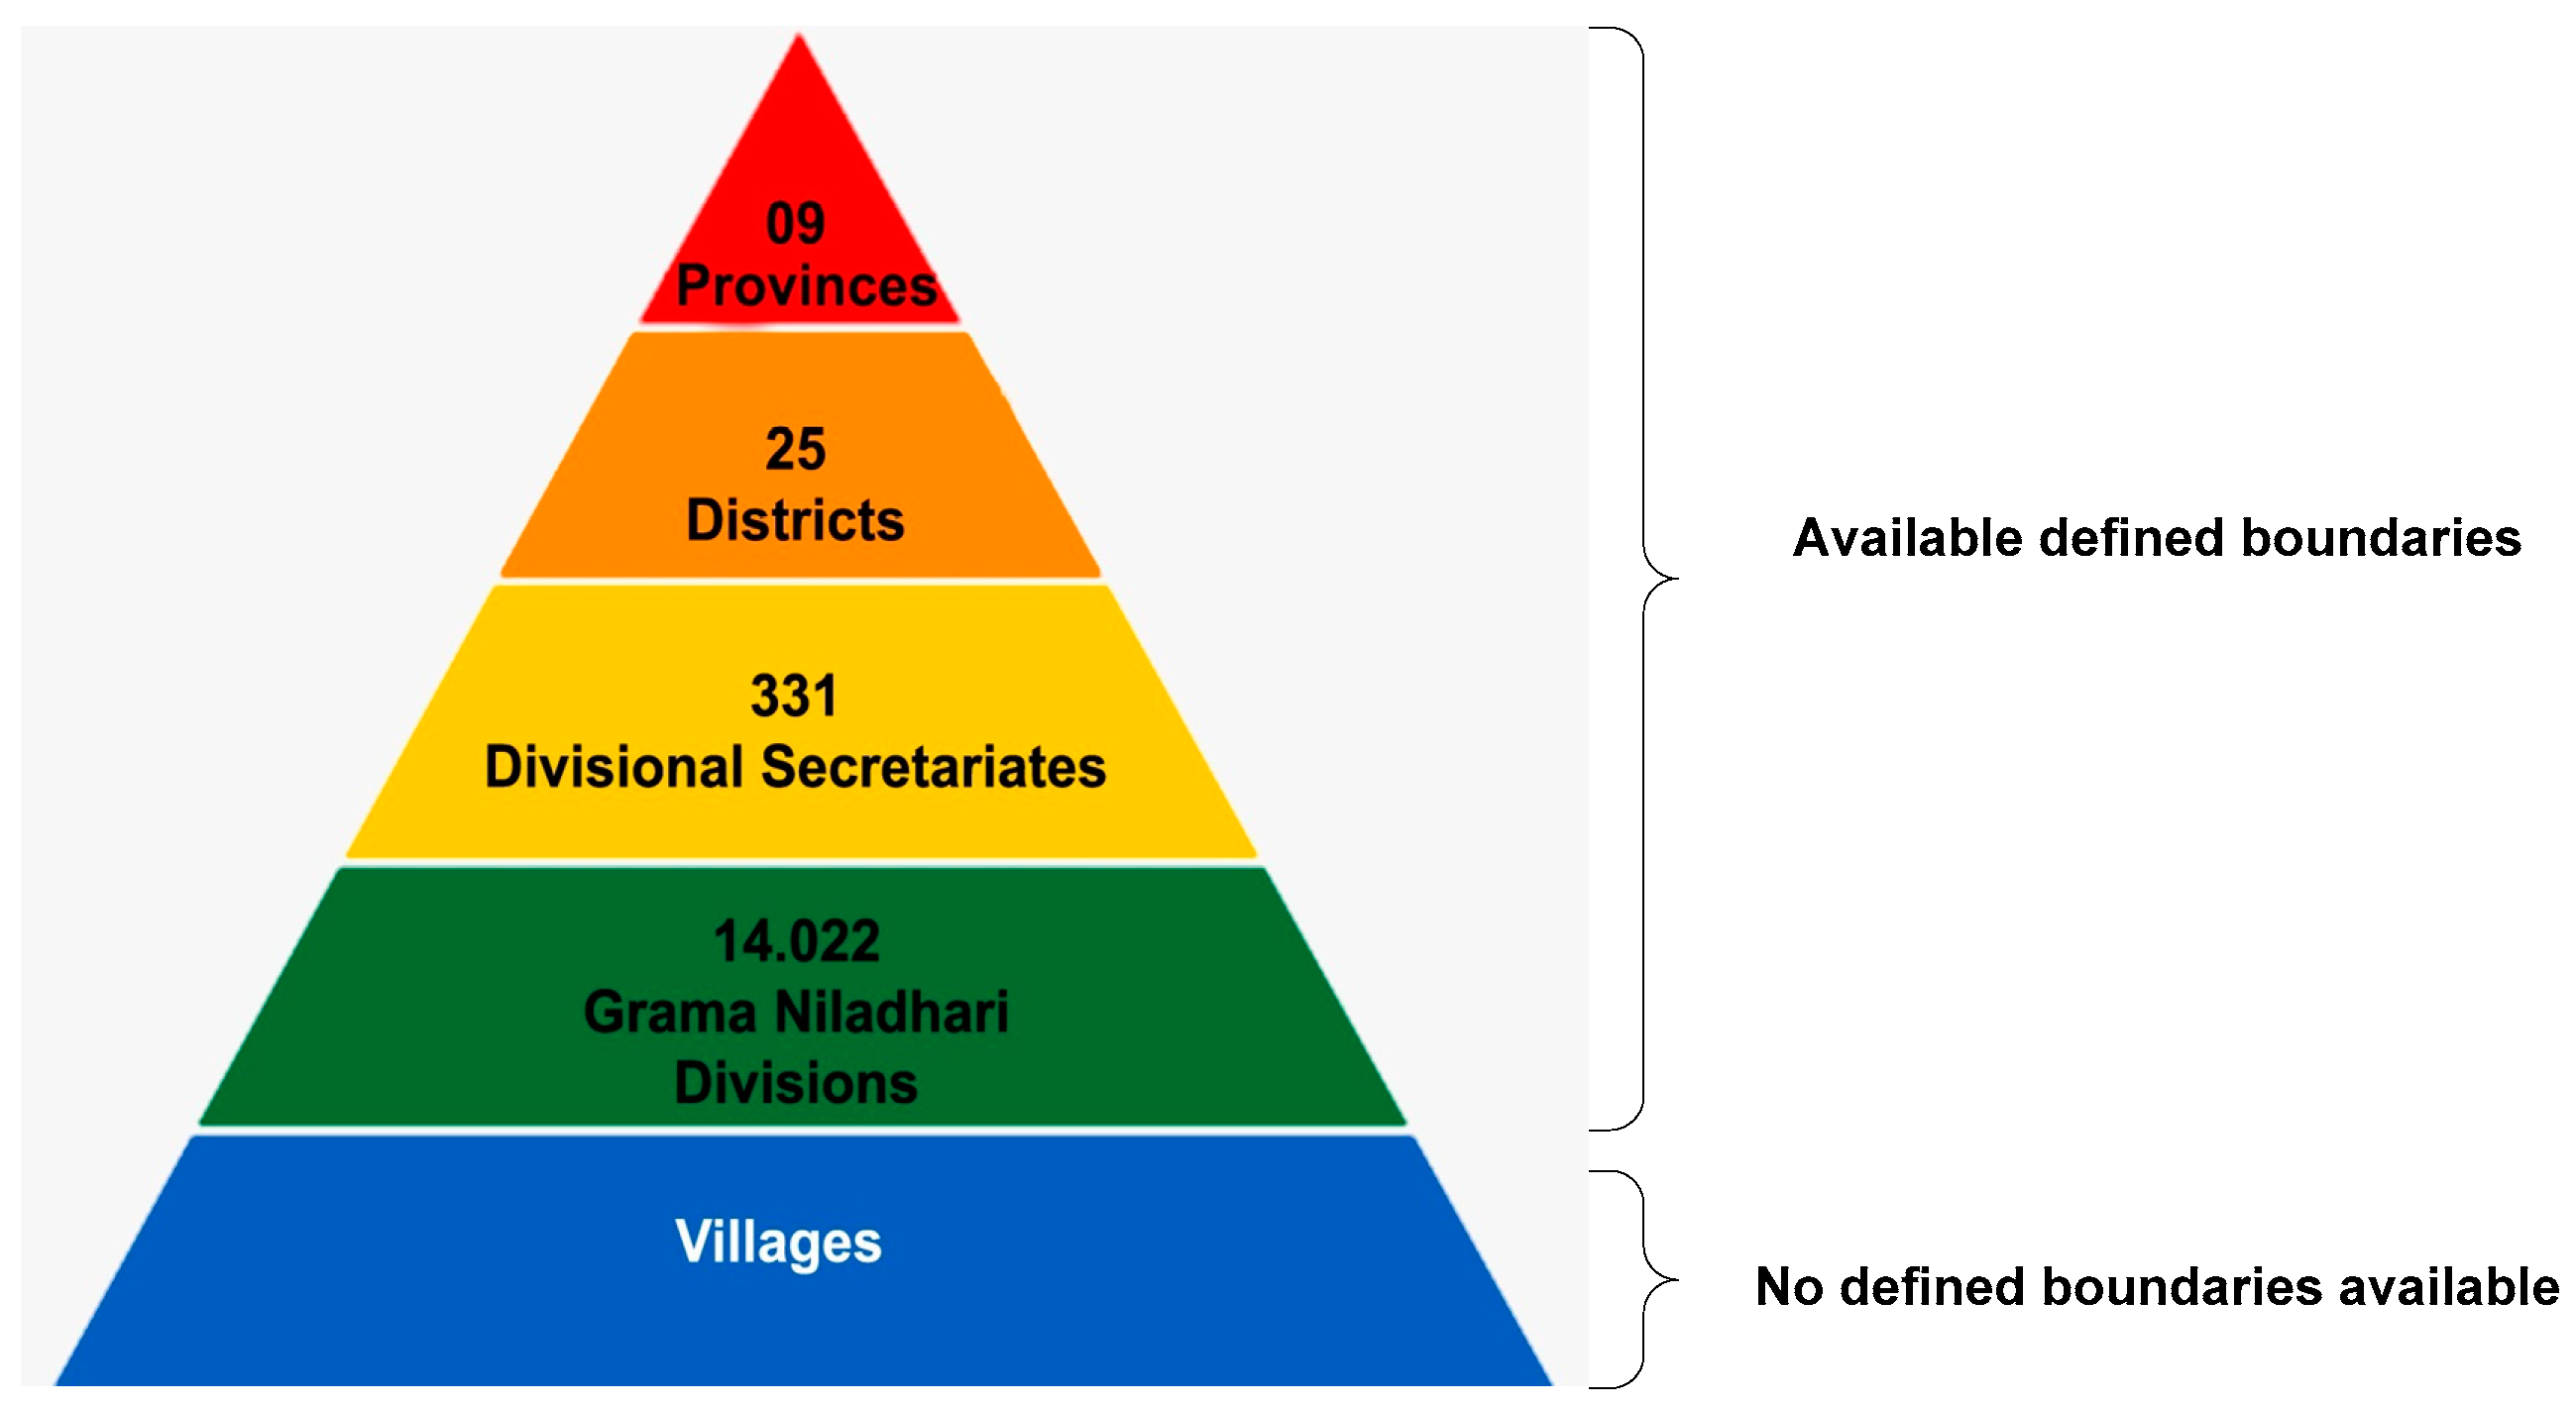
The GN division is the smallest administrative boundary with defined perimeters in Sri Lanka [
6,
7]. Each GN division consists of one or many villages, identified as crucial community segments that share a common set of features.
A GN division can consist of areas, farmlands, and natural environments claimed by people living in the village. However, there is no defined demarcation of the geographical boundaries of villages in Sri Lanka.
Figure 2 depicts the position of villages in Sri Lanka’s boundary system, where provinces, districts, DSDs, and GNDs have defined perimeters; whereas, villages have no defined demarcations at present.
The Wilpattu National Park (WNP) is located on the northwest coast in a lowland dry zone, between the northern central and western provinces of Sri Lanka. It is the country’s largest and oldest national park. WNP contains a range of diverse terrestrial habitats. The ecosystem has recently faced critical threats of fragmentation and degradation, due to human interventions. This has affected its richness of biodiversity, creating a series of environmental issues [
8] (pp. 1–2).
It has been observed that, within this context, there is a great impact on the WNP due to human interventions originating from adjoining villages. The eastern boundary of the WNP, covered by the Anuradhapura district, is one of the rural districts in Sri Lanka with a considerably high level of poverty [
9]. The livelihood activities of the region are mainly based on agriculture, cattle farming, bee farming, etc. Due to water scarcity and low soil fertility, the life of the people has become harsh. Accordingly, the impact on the WNP from the bordering villages is considerably high. Conflict levels are observed to be highly correlated with the poverty of the people, leading them to engage in encroachment, poaching, logging, sand mining, and other illegal activities.
To address this issue, governmental and non-governmental organizations have implemented many livelihood development programs, covering villages around the WNP. Most projects have been implemented in the area in order to improve the region’s poverty level [
10,
11,
12]. However, there is a lack of long-term sustainable solutions that can considerably reduce poverty. Therefore, the community around the WNP is still suffering from common poverty-related issues. The main reasons behind this status can be attributed to the selection of incorrect target communities and the unavailability of autonomous project plans.
Therefore, it is important to select the appropriate target community groups inside the project area [
13]. Having a clear demarcation of community segments, which share a common set of features, the so-called villages, will assist in identifying the correct community to be addressed in each project implementation activity. On the other hand, the sustainability of the adjoining villages of the WNP positively impacts the conservation of the park. Hence, sustainable community development can be achieved through the availability of clear boundaries of the villages adjoining the WNP.
At present, various methodologies are involved in land demarcation, such as geodesy/land surveying, cartography/mapping, and cadastre/land administration [
14]. Among these, spatial information technologies have become a more powerful tool. GIS (geographical information systems) have been widely used in spatial decision-making in many areas. However, it has been noted that GIS hardware, software, and data are expensive, requiring a high level of technical know-how. Therefore, GIS is usually regarded as an ‘expert’ system [
13,
15,
16]. As a complementary approach for spatial planning, the PGIS (participatory GIS) concept was introduced, which effectively utilizes local people’s knowledge to produce outputs that can assist in the planning, implementation, and decision-making of local and government projects [
16]. Recently, PGIS techniques have proven to be an important tool [
17] for the recovery and integration of traditional knowledge and its various dimensions with scientific knowledge [
13,
18,
19,
20,
21], which involves the participation of community members and working with them in planning and conducting projects and studies.
Furthermore, participatory GIS (PGIS) practices can effectively influence community empowerment, innovation [
22,
23], and social changes. Additionally, the PGIS approach can protect traditional knowledge, by using culturally sensitive spatial information in rural communities [
24,
25]. Hence, the PGIS approach has become an essential method for conducting many community-based applications where public participation and empowerment play critical roles [
26].
Many studies using the PGIS approach have been carried out for land-use planning in different regions [
5,
15,
16,
18,
19,
27]. However, the land boundary demarcation studies using PGIS data are limited, as they require community involvement. Land boundary demarcation is essential for implementing community-based projects and programs. Additionally, a lack of community land boundary information can lead to land-use conflicts in different sectors, such as agriculture, mining, and forestry [
28,
29], as well as in infrastructure allocation [
30]. The availability of granular-level land boundary demarcation is essential when considering cultural, historical, and social factors, especially for implementing micro-scaled projects, which require identifying the exact target group in the community.
2. Materials and Methods
2.1. Study Area: The Eastern Boundary of Wilpattu National Park, Sri Lanka
The WNP is located between 8°29′47.07″ N, 80°4′43.25″ E, and 8°10′25.35″ N, 80°15′12.71″ E longitudes. Its eastern border faces Anuradhapura district, which is one of the most rural districts in Sri Lanka. The WNP covers more than 1300 km
2, with elevation ranging from 0 to 152 m above mean sea level.
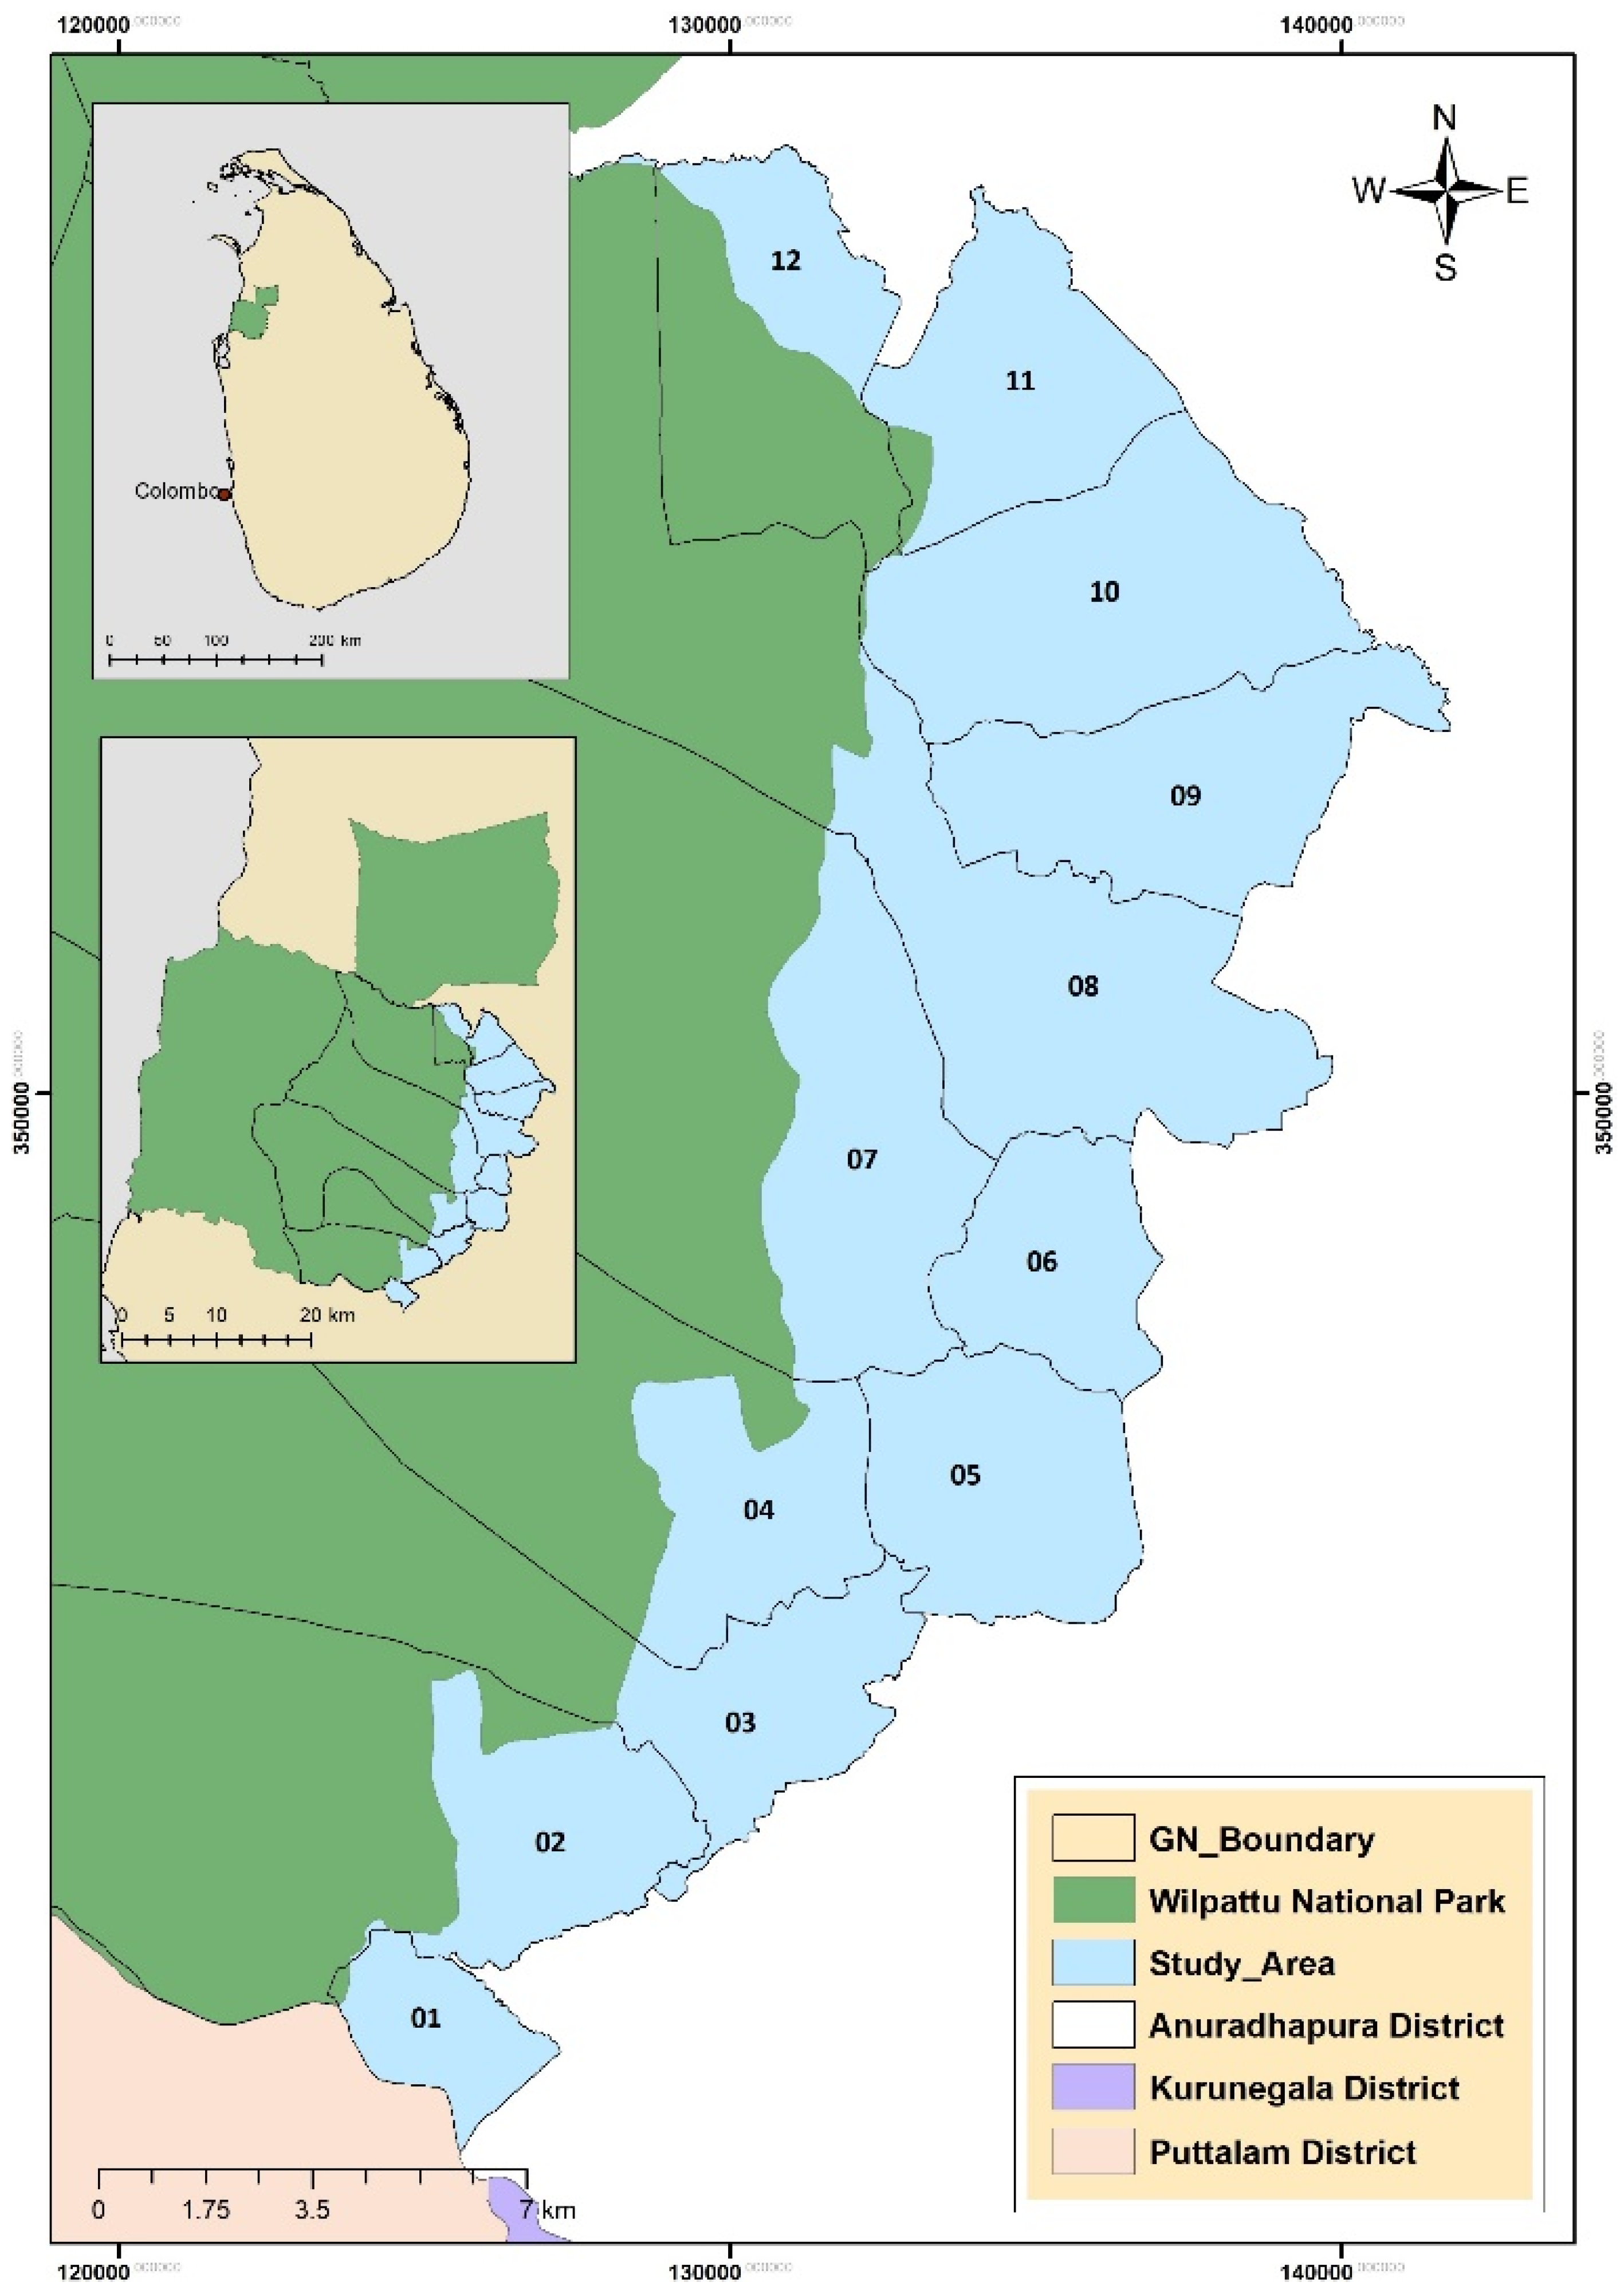
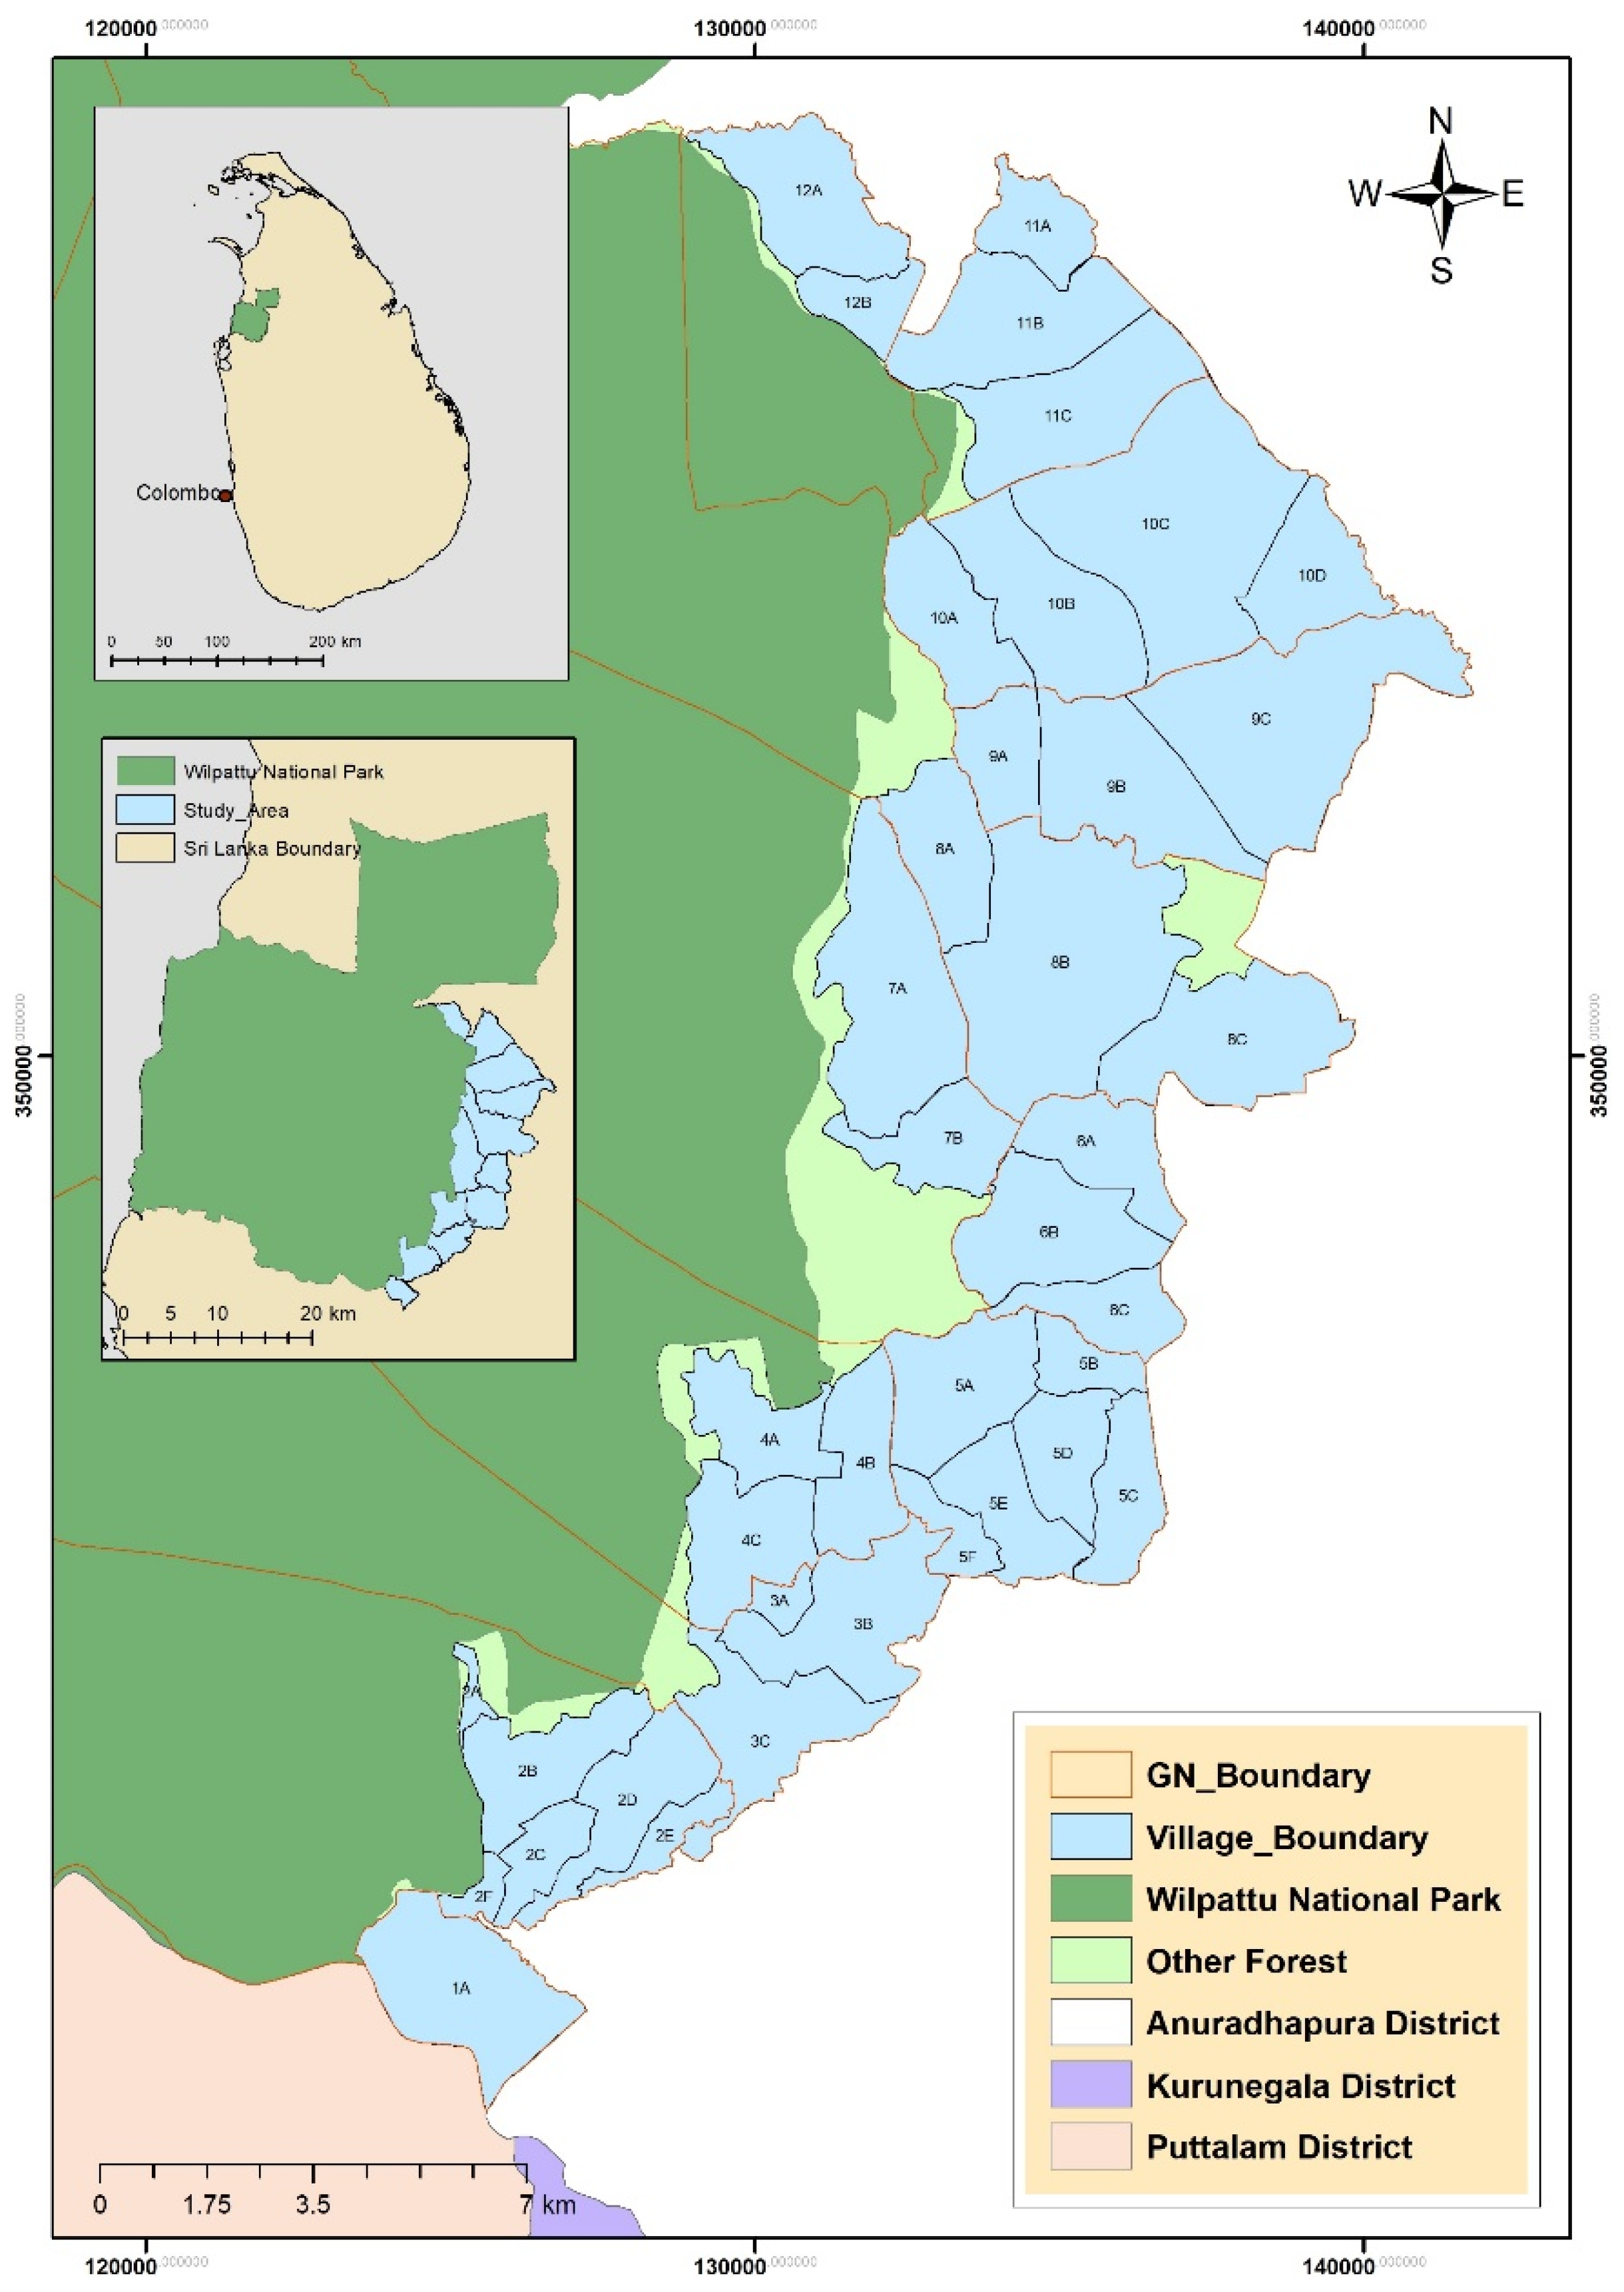
Figure 3 depicts a map of the study area, which covers 12 GN divisions on the eastern boundary of the WNP.
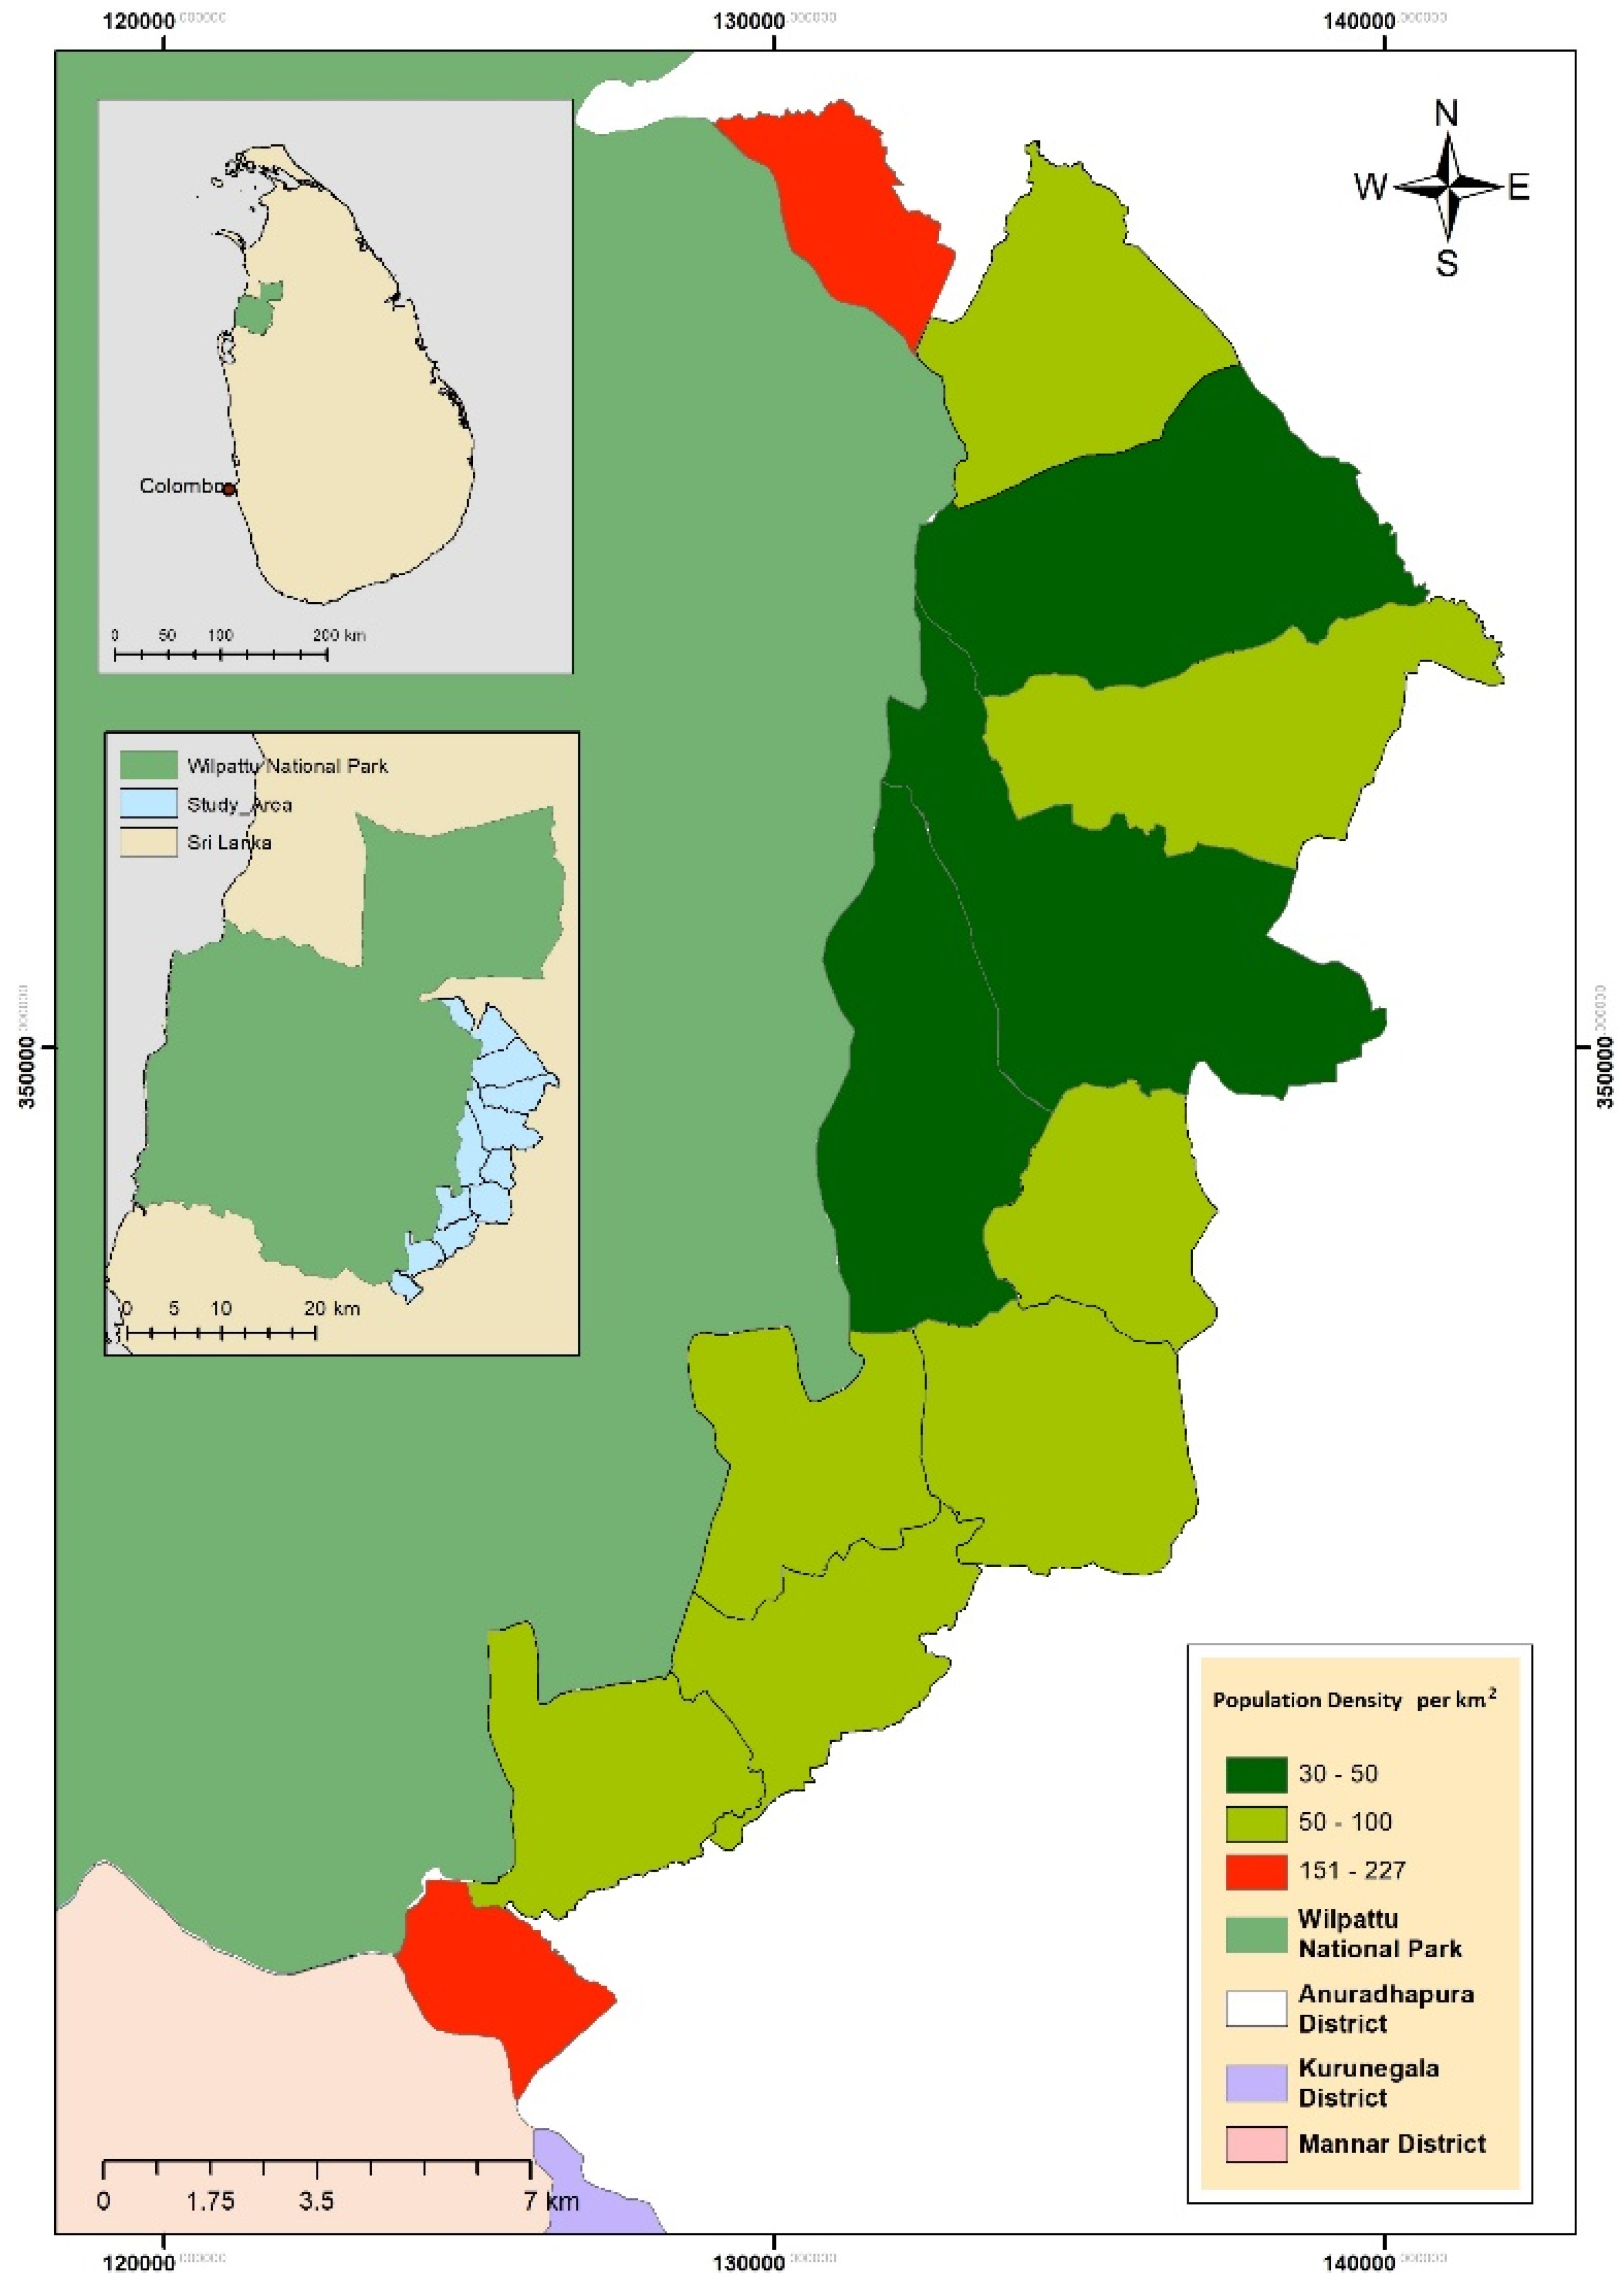
The study area was spread over 12 GNDs, belonging to three DSDs: Nochchiyagama, Mahawilachchiya, and Rajanganaya. The population footprint in the surrounding protected areas has proven to greatly impact the conservation of the protected area [
31]. Hence, it is necessary to assess the same areas surrounding the WNP. The population density distribution of the study area is depicted in
Figure 4, showing that two GNDs have a high density, whereas seven GNDs have a medium density and three GNDs have a low density.
Furthermore, the livelihood activities in the area consist of paddy-based agriculture, mainly fed by irrigated water. Additionally, chena cultivation, cattle farming, and fishing are prevalent. It can be observed that all three DSDs have a dependency ratio of more than 50%, depicting the level of poverty in the region (
Table 1). This denotes that a greater proportion of younger and more elderly populations in the community contribute to the labor force compared with adults. As shown in
Table 1, there is a younger, rather the elderly, population in the community. Furthermore, poor income from livelihood activities has led to the exploitation of resources from the WNP [
32].
Most of the land in the area is owned the government, which has been granted or leased to low-income earners and landless citizens. Hence, ownership problems are not an issue within the community.
2.2. Data Descriptions and Methodology
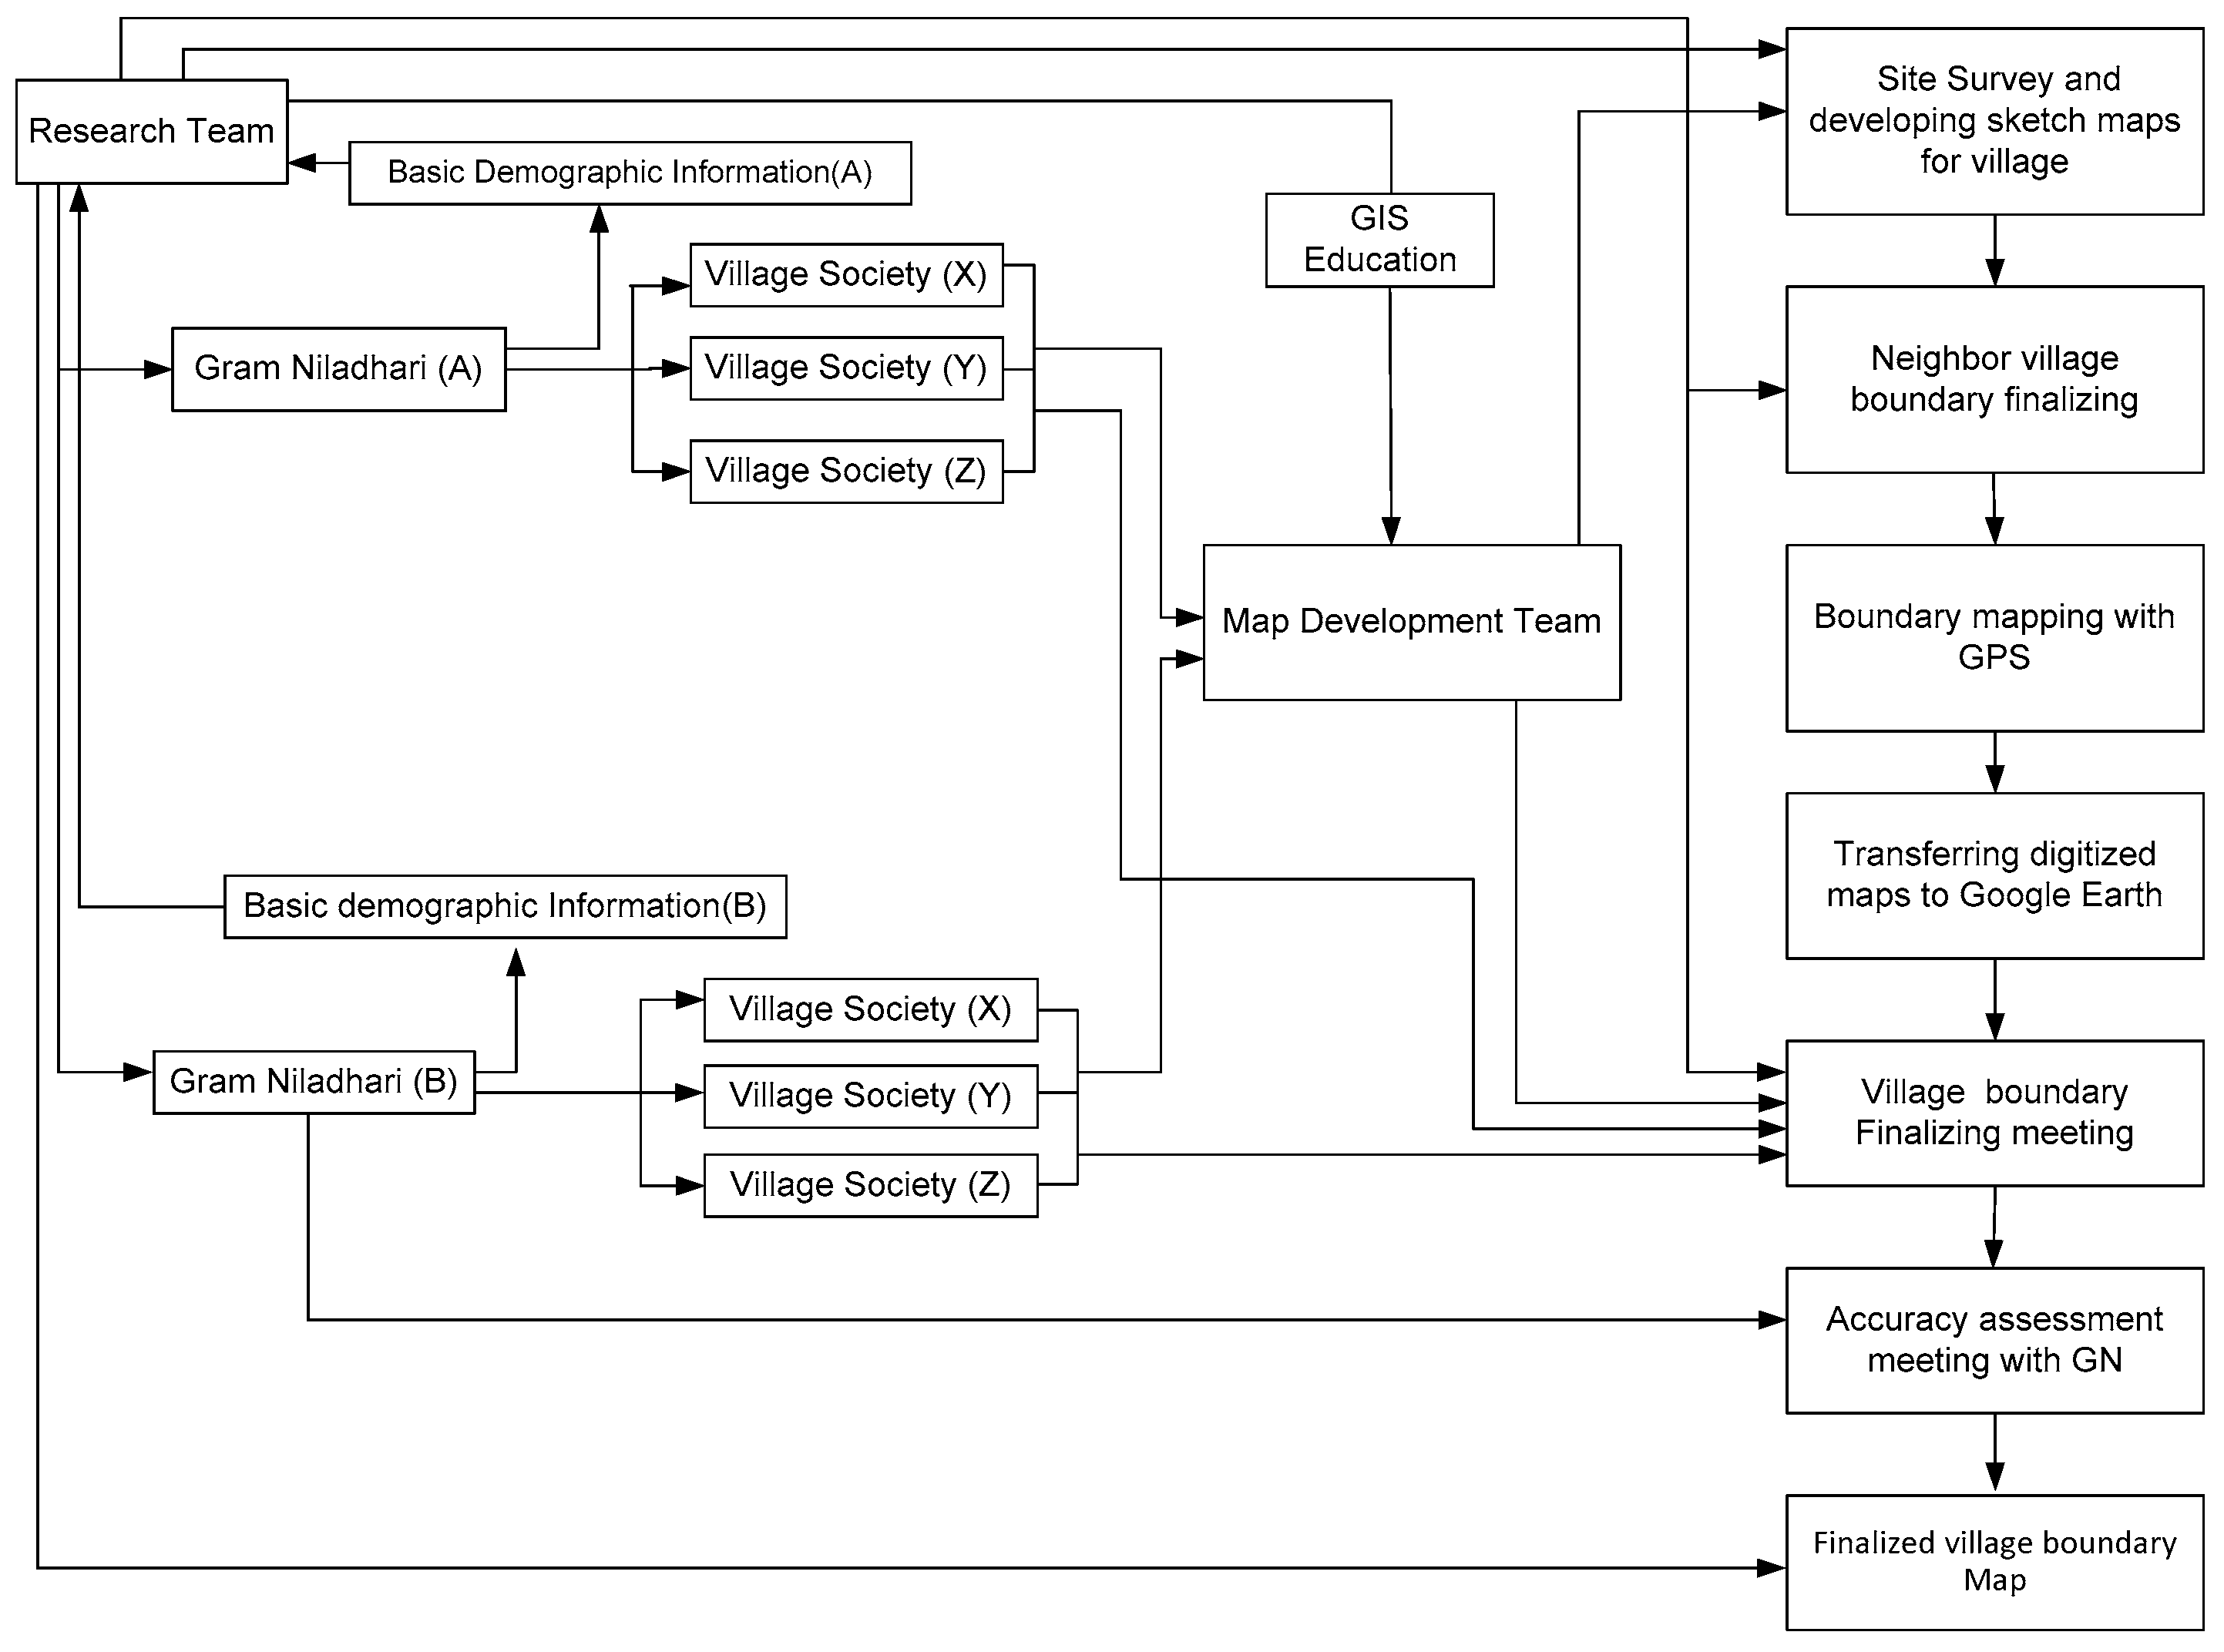
Figure 5 depicts the process flow of the study, along with entities and procedures.
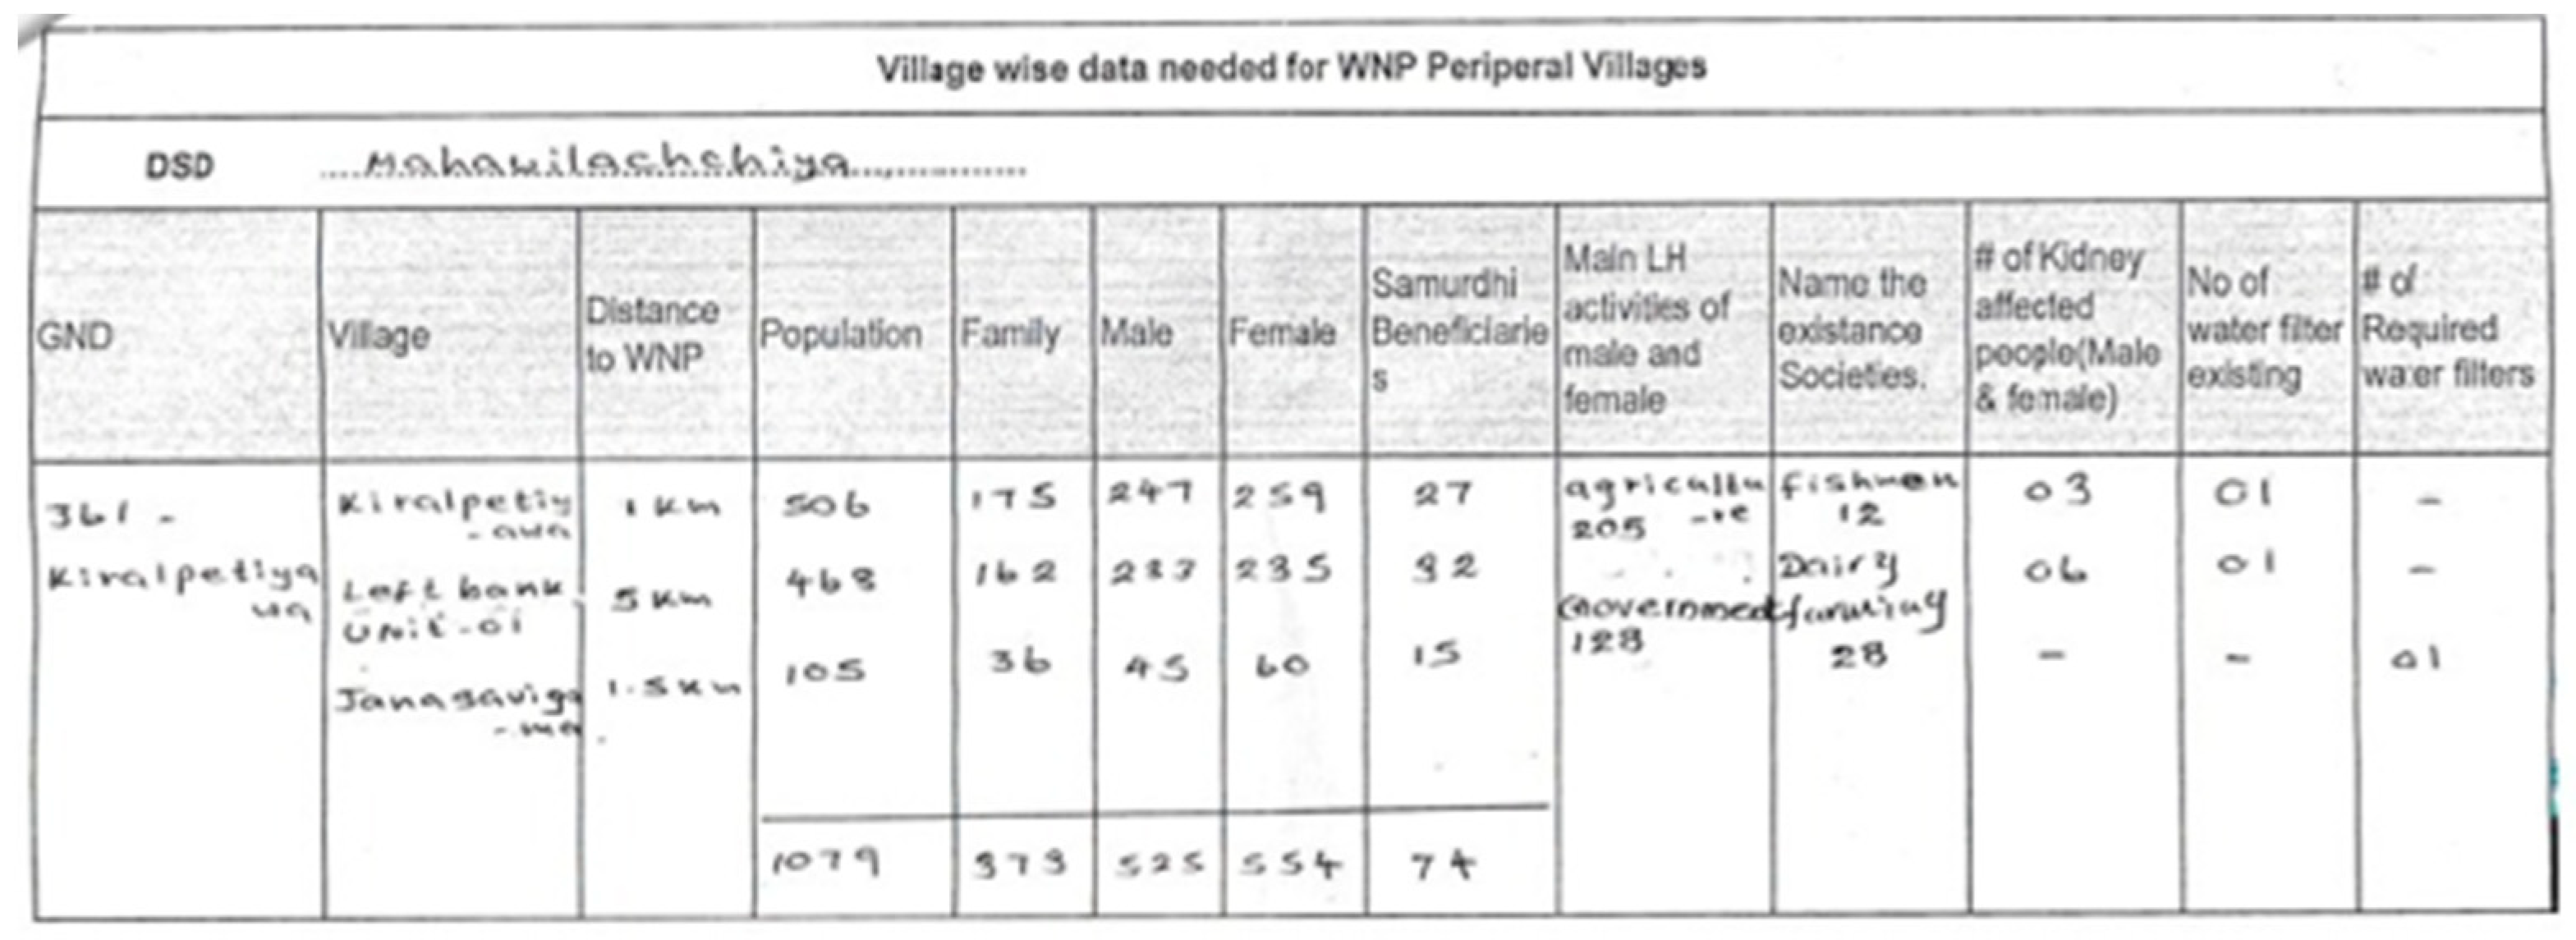
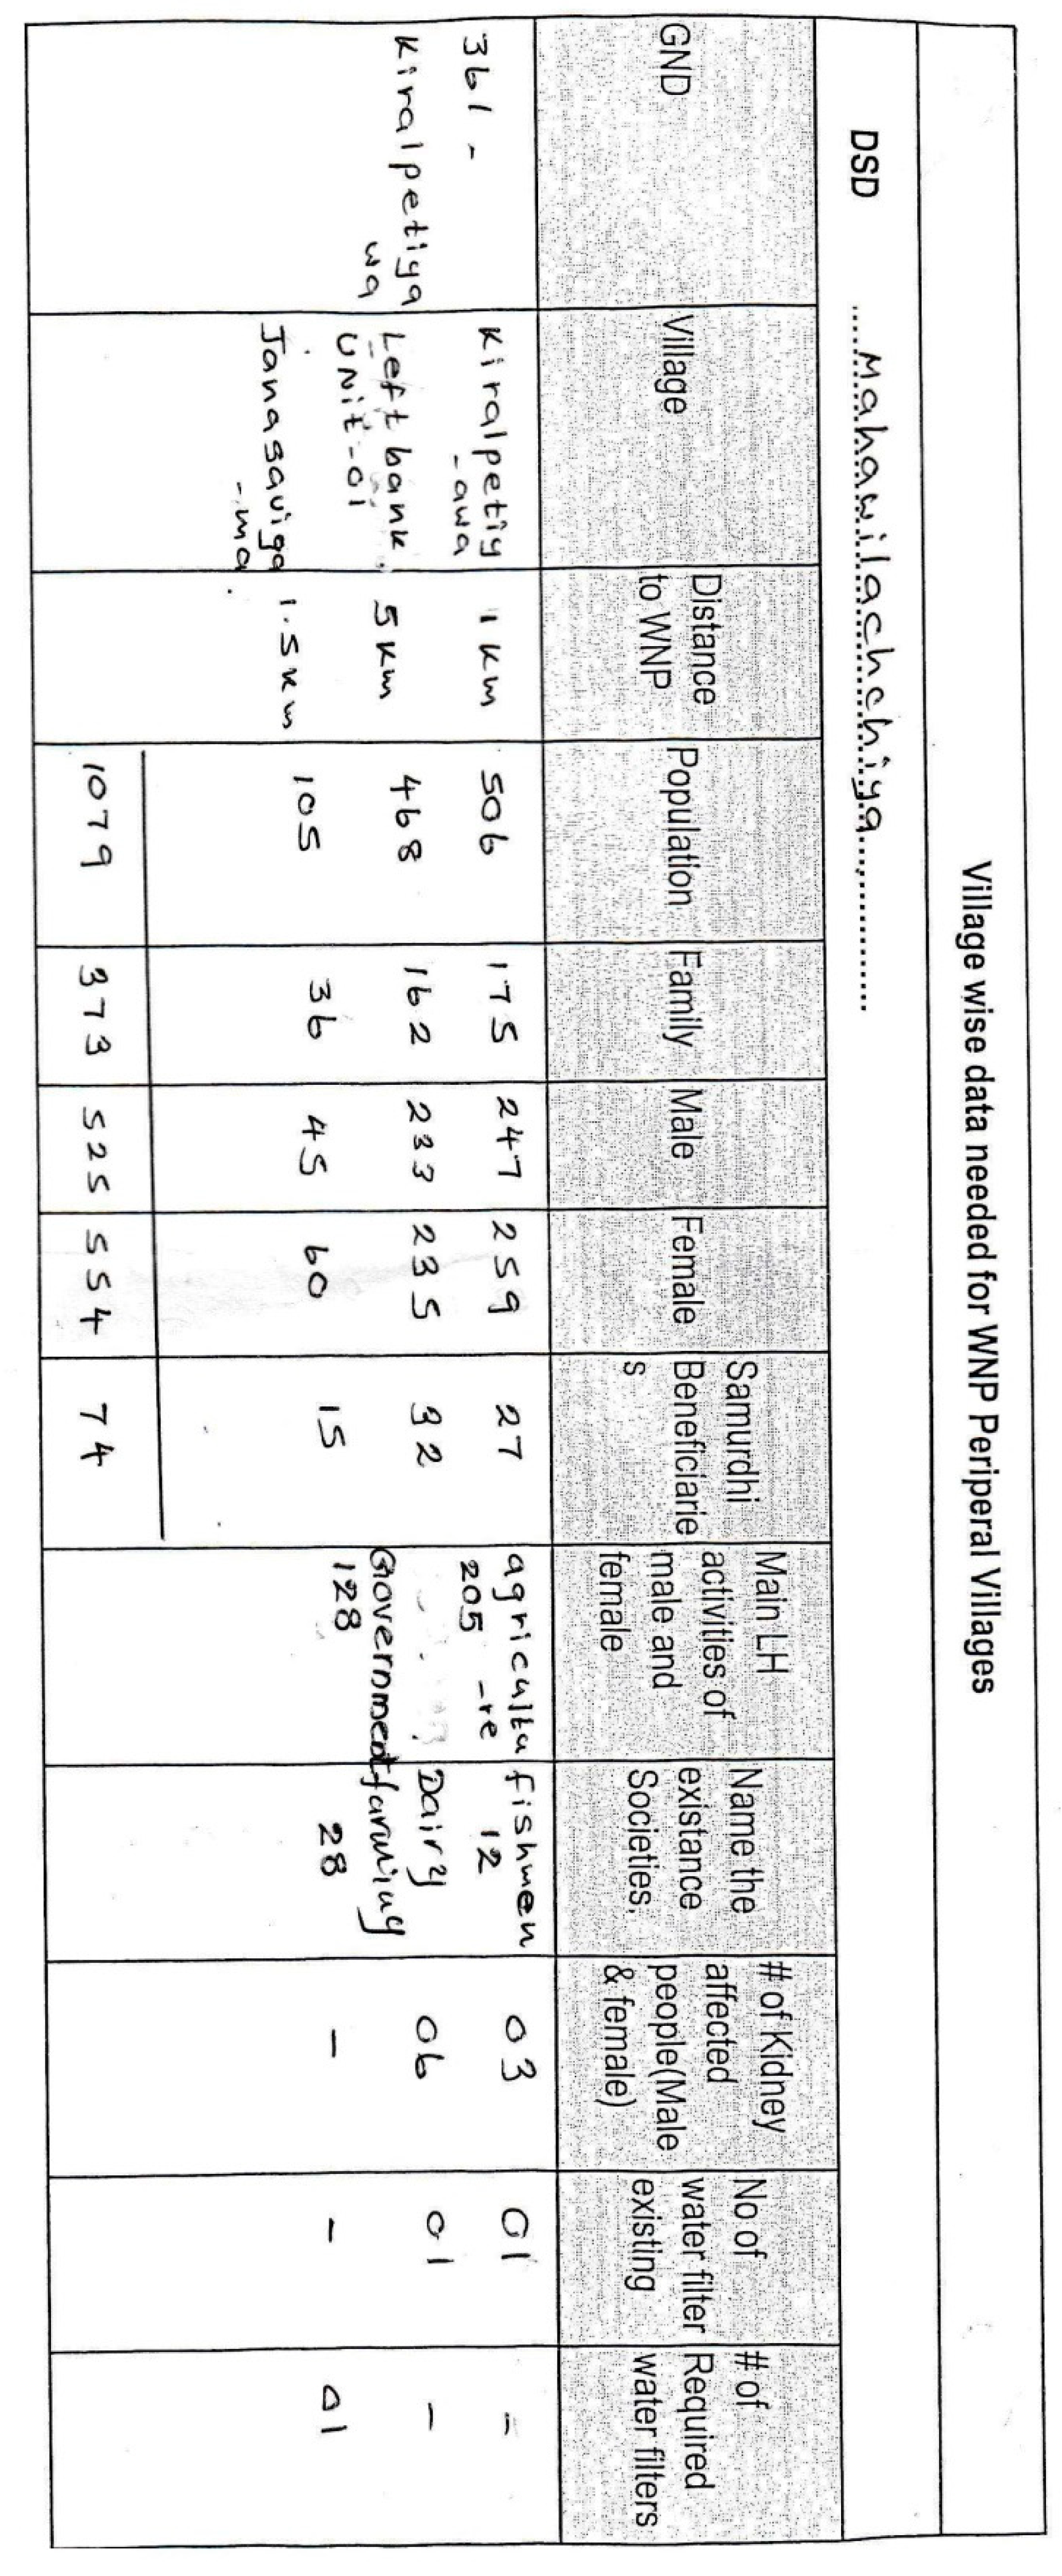
A key aspect of this research was the collaboration with different local community segments to achieve desired outcomes. The initial action plan was established to set appointments with the relevant Grama-Niladhari (government officer) of each GN division and make them aware of the proposed study. As part of this awareness session, basic demographic information, such as the population, number of families, and male and female population, was gathered. Furthermore, existing boundaries on the available GN map of the study area were verified with the help of the Grama-Niladhari. Basic information, such as district secretariat division (DSD), village name, distance to the WNP, population, number of family members, number of males and females in the family, number of Samurdhi beneficiaries (government allowance), main livelihood activities of males and females, names of existing societies, number of people with kidney issues, number of existing water filters, and number of required water filters were collected from each Grama-Niladhari.
Demographic information enabled segmenting the communities in the GND. The above-collected data were used to arrange local society meetings in each GND with the support of the Grama Niladhari, which were identified as ideal means of addressing the community. Other information collected, such as the number of people with kidney issues, the number of existing water filters, and the number of required water filters, was saved for future use. This kind of health information will be crucial for implementing community health programs in the area.
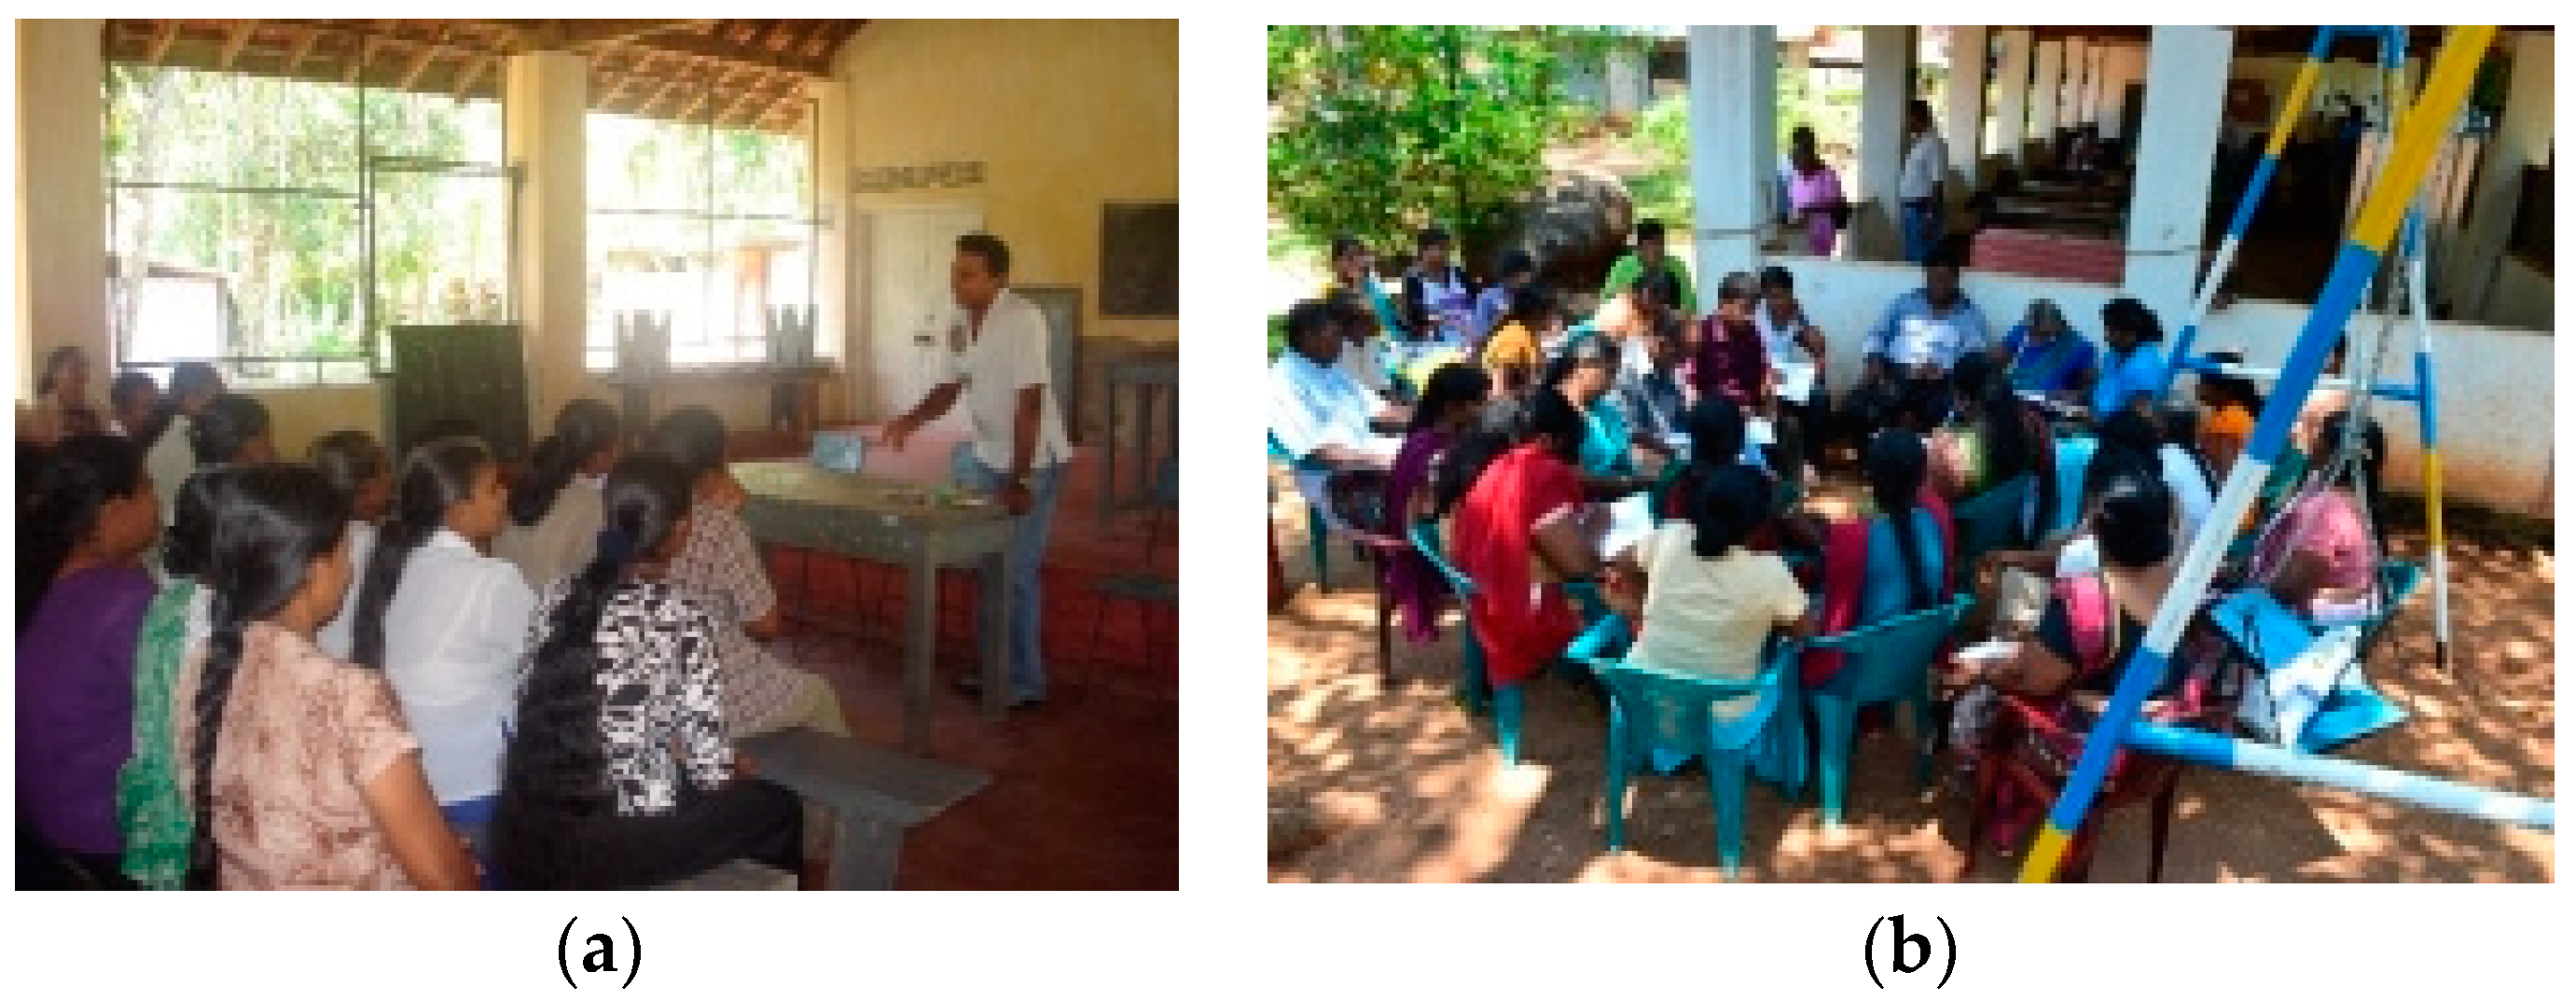
The next step was initiated by collecting village names and their existing local society details within the GN division. Then, with the help of the Grama Niladhari, community society meetings were conducted for each village (
Figure 6a). During the meetings, members with spatial knowledge of the area were identified to conduct PGIS activities. Each local society nominated the most knowledgeable members, with respect to their territory, for the participatory mapping project. Thus, community members in the participatory mapping project were recommended by both the local community and the Grama Niladari of each GND. Furthermore, each community society was educated about PGIS techniques to develop more accurate demarcations of village boundaries. Approximately 45 community society meetings were conducted, covering all GN divisions (GNDs).
2.3. Participatory GIS Approach
The demarcation of village boundaries was conducted with a minimum of four members from each village who were aware of the village boundaries and the demography of the village. During this step, community participants were divided into groups according to their village. Furthermore, each group was instructed to clarify their village boundary with the adjoining village team members (
Figure 6b), thereby avoiding boundary conflicts. They were provided with the existing GN division boundary map, which assisted them in visually identifying key locations on the map, such as main roads, rivers, tanks, and other topographic information available within each GND. This information provided a general idea of the topography of the region facilitating the identification of more accurate village-level boundaries.
Then, each team was directed to develop a sketch of relevant villages by denoting basic topographic information and important landmarks on the provided GN map. These sketches were developed, with the inclusion of the available spatial knowledge of the local community. During this activity, community members of each group were guided concerning the tools to be used, while GPS devices and working material were provided to ensure a full participant involvement in the sessions. They were trained to digitize the developed sketch map using the GIS software. Training took one day for around 25 persons per team. The sketch map and training helped participants to visualize the land-use distribution of the village, before they started actual boundary mapping.
As a next step, GPS devices were used to track the boundary lines between villages. During this process, important landmarks between villages, identified during the sketch development of each village, were highlighted. Furthermore, minor details, such as footpaths, streams, forest boundaries, and other features, excluded from official maps could be introduced. Then, the collected GPS information was transferred to Google Earth.
2.4. Transferring Community Spatial Knowledge into Digital Maps
Locally developed sketches of maps with boundary information and topographic information were converted into a digital map format using the GIS software. However, to verify the created boundaries and topographic features, the developed maps were overlaid onto high-resolution Google Earth images. Then, for further validation, the resultant boundary maps were presented to the map development team members and local society members of the villages. Subsequently, relevant modifications were made to the resultant boundary maps according to the feedback provided. Once the boundary map was finalized with the village members, it was presented to the relevant Grama Niladari of the area for further verification. Thus, the trustworthiness of the results produced by the team members was ensured.
3. Results
Sample demographic information of the area gathered during the initial meeting with the Grama Niladhari is represented in
Figure 7.
Figure A3 in
Appendix A provide high-resolution image of the form use to collect basic demographic information of the area.
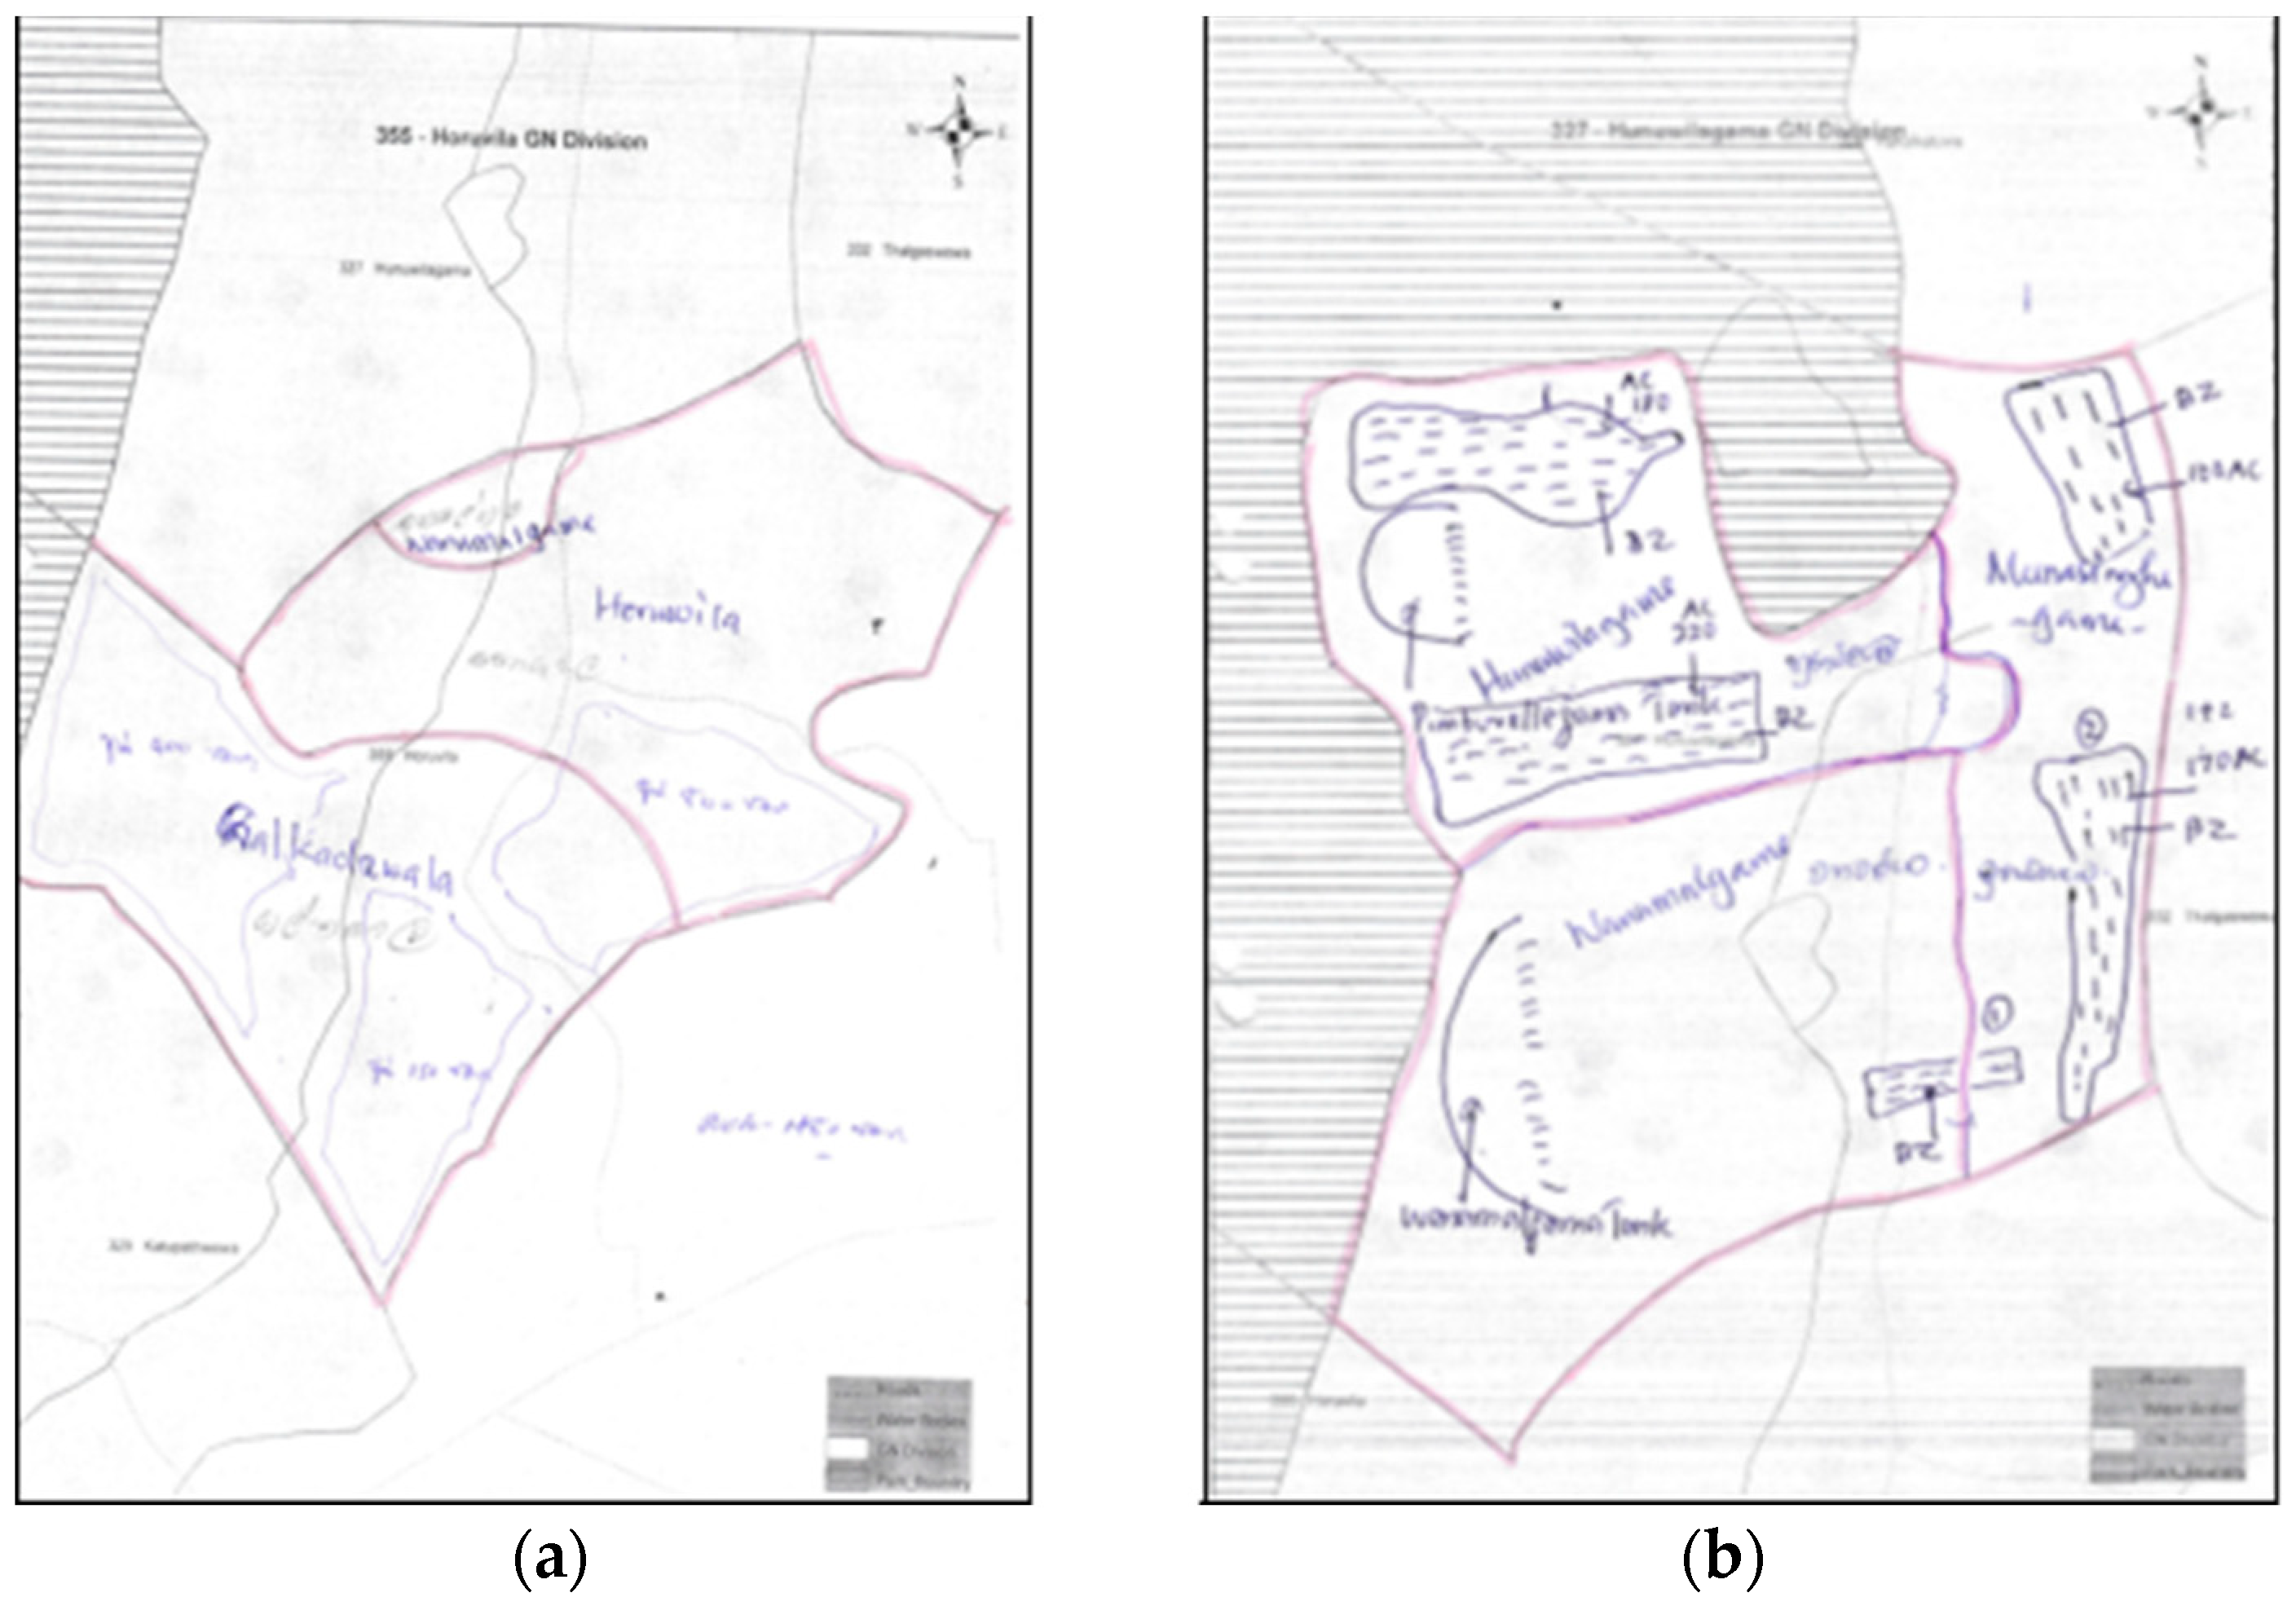
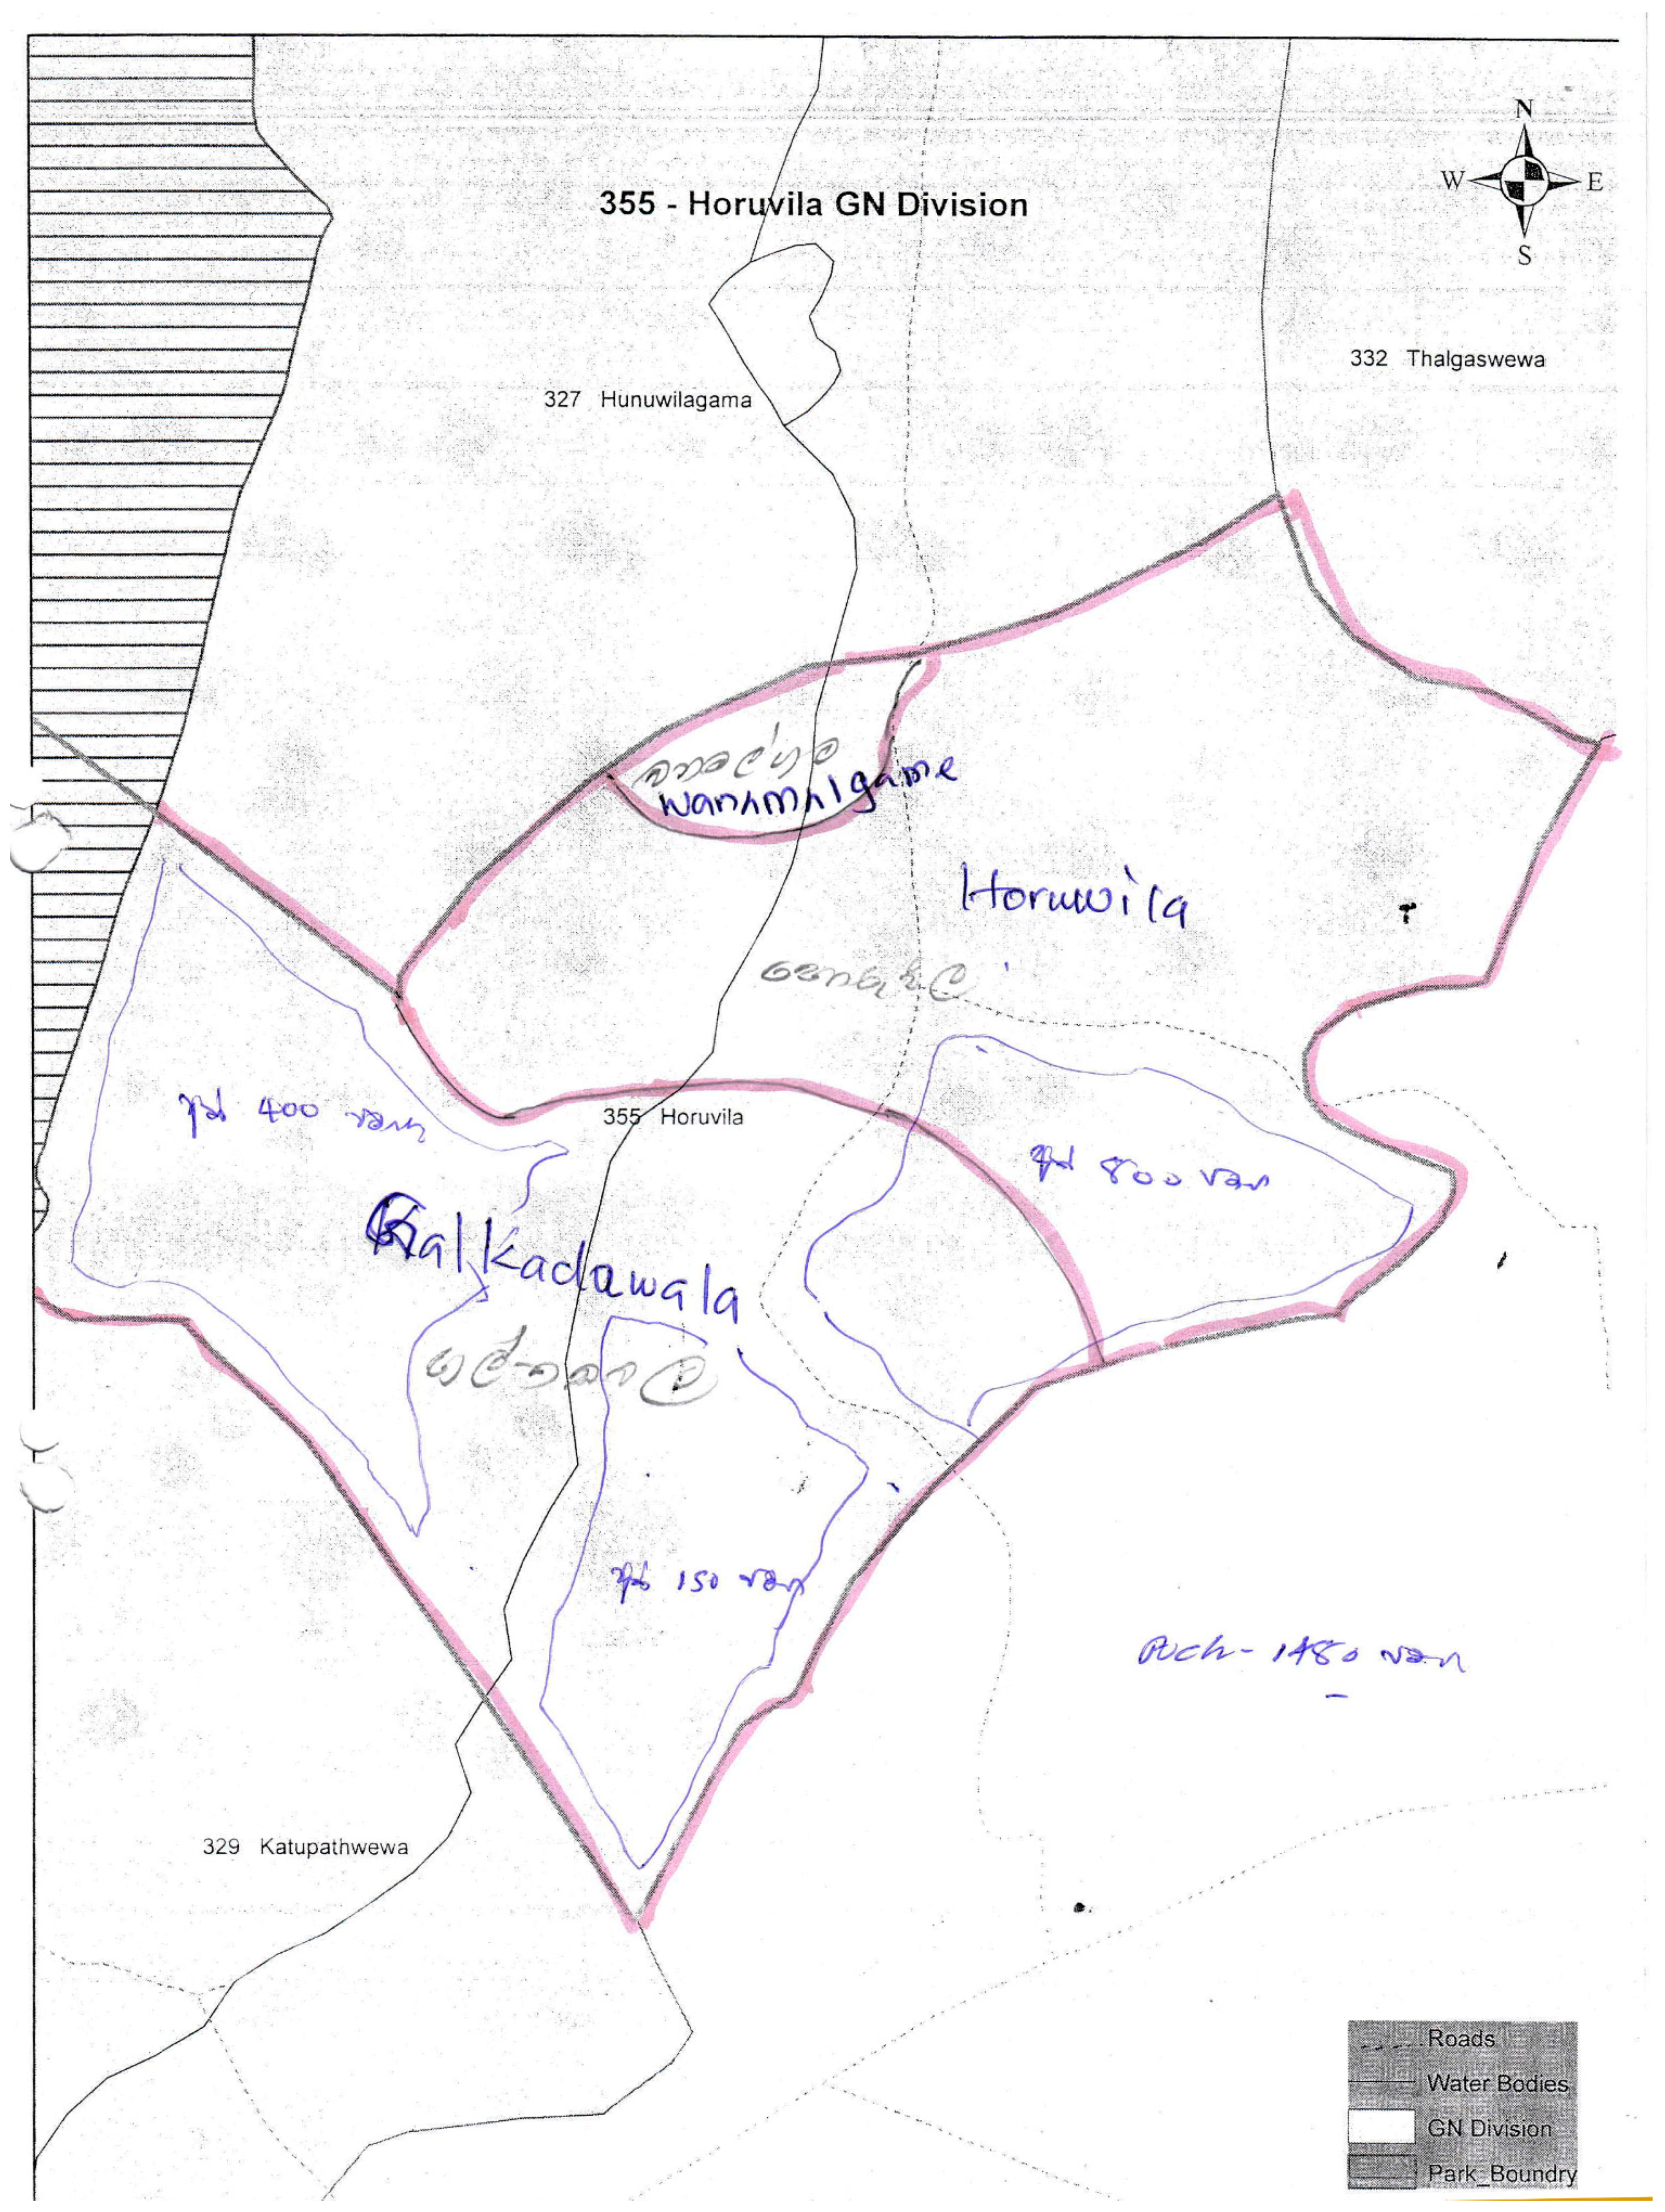
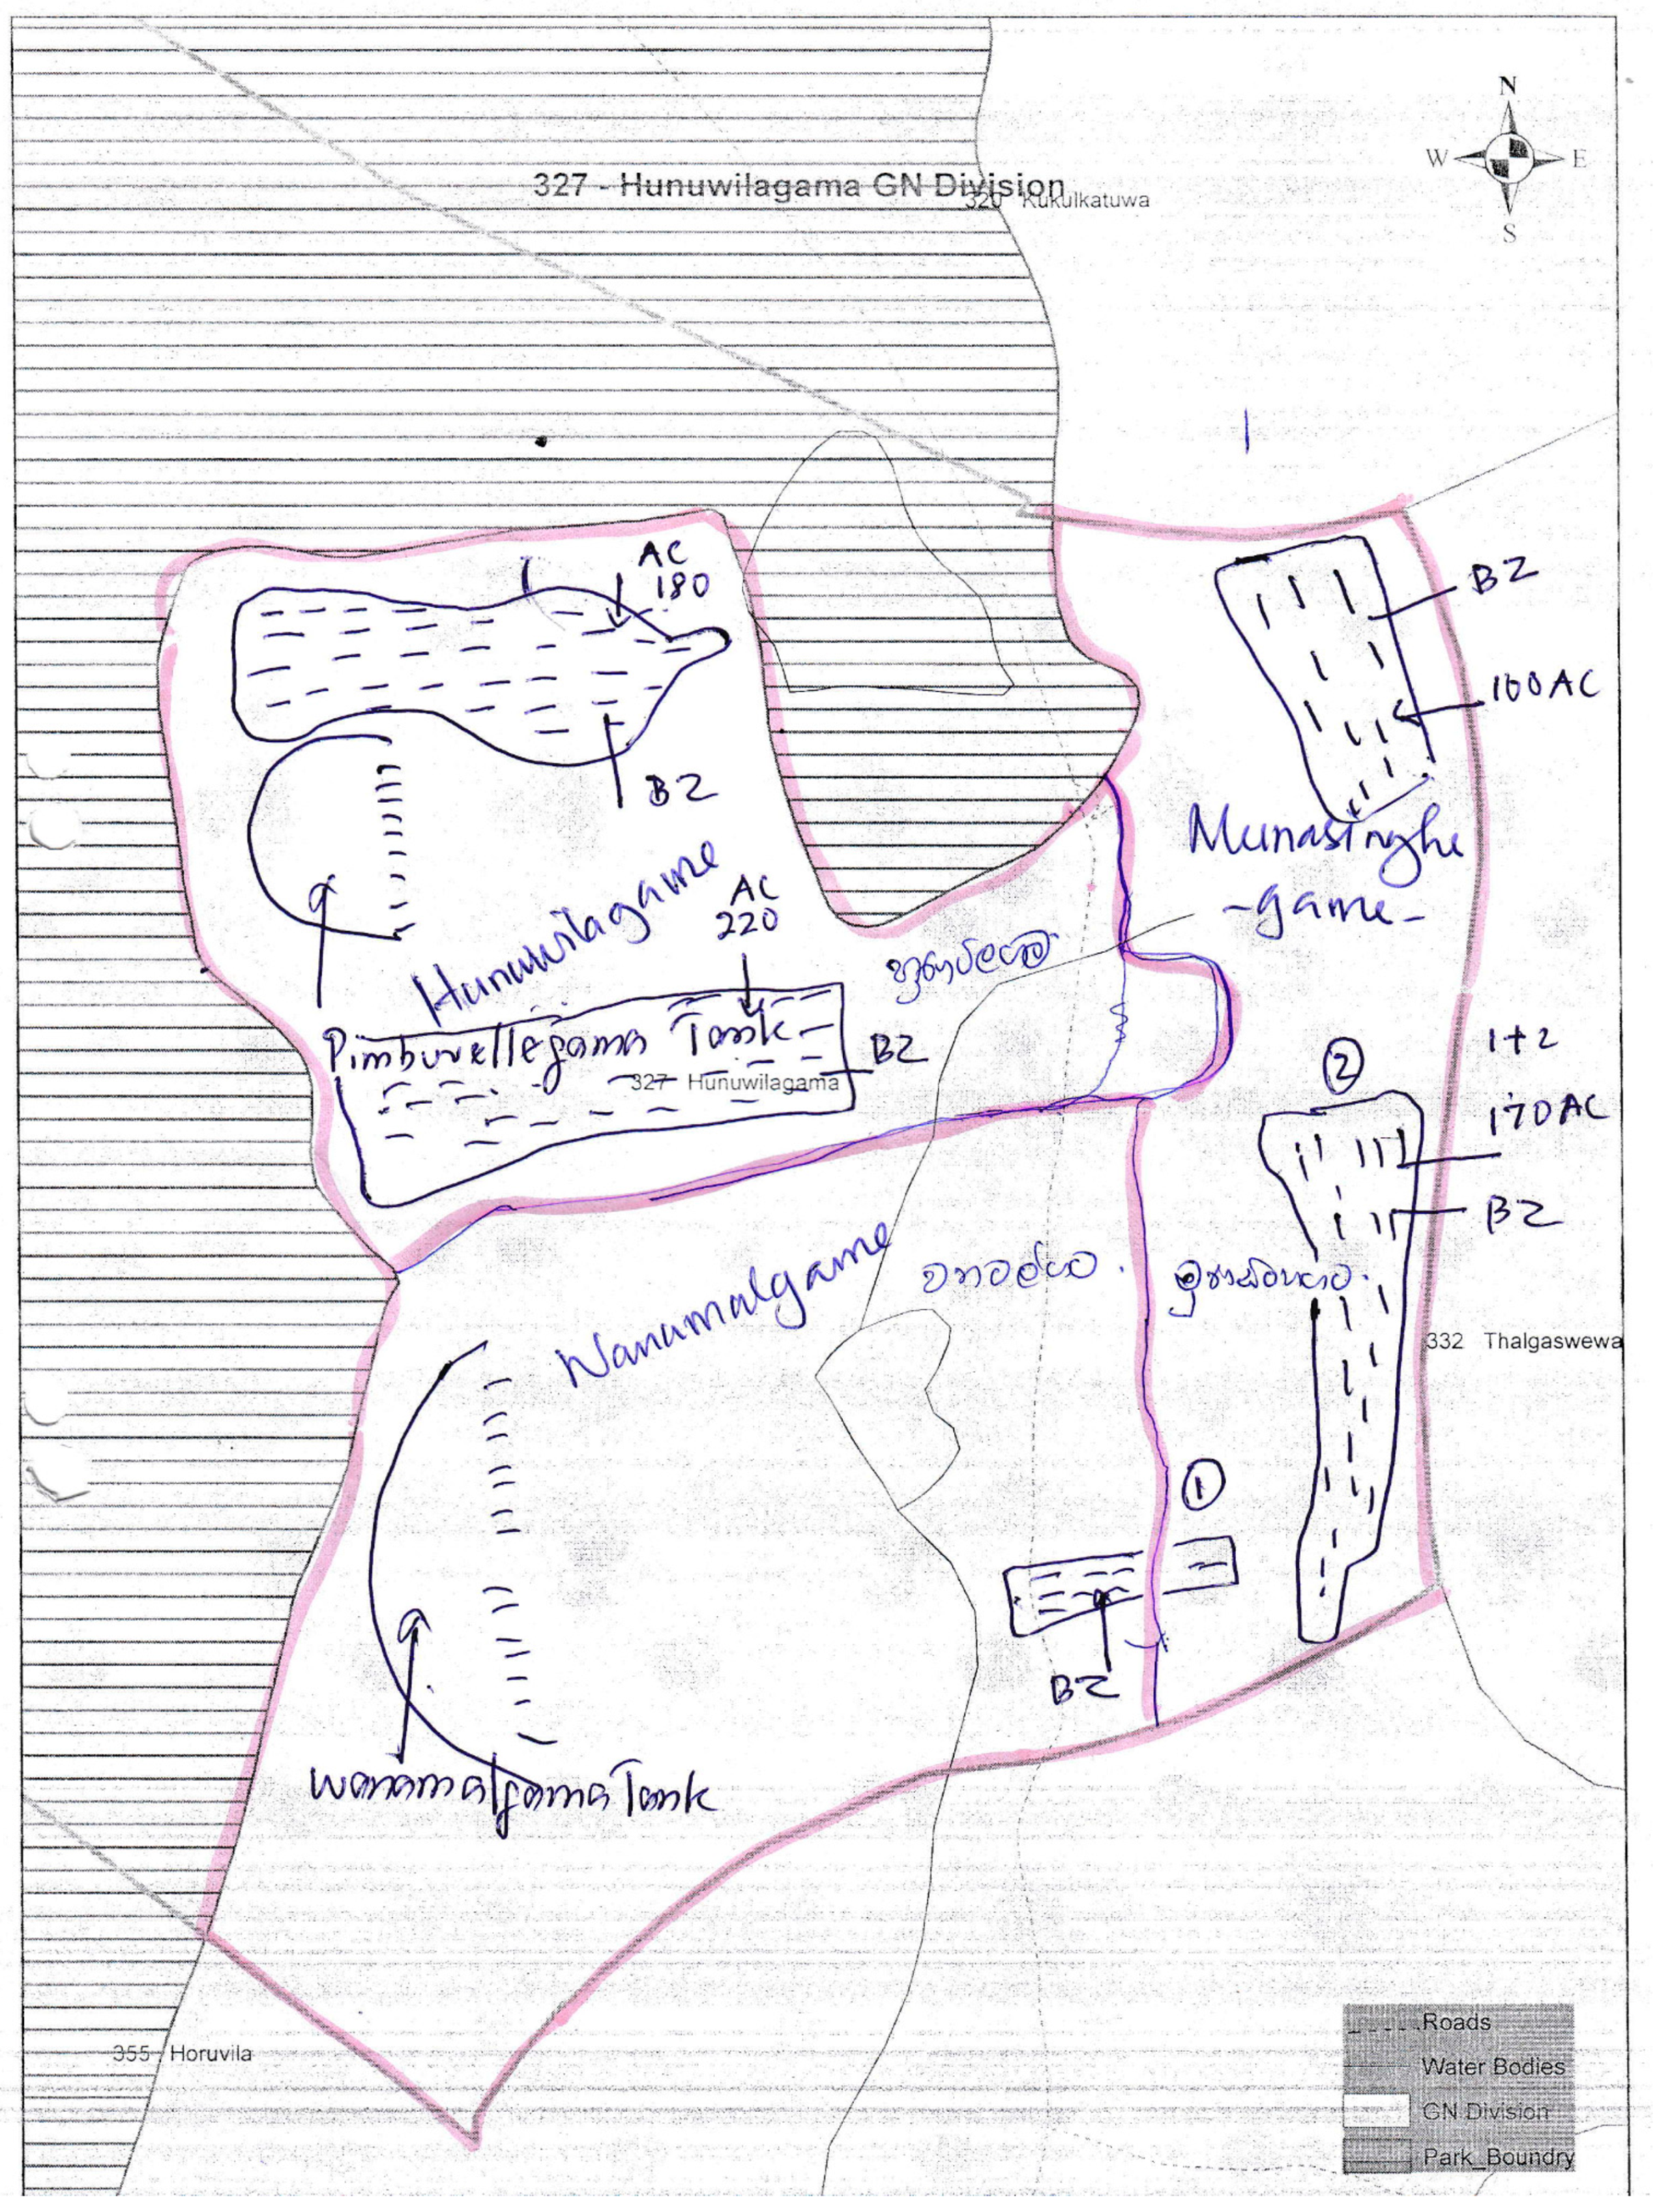
Figure 8 shows the drafted sketch maps produced by the village community members, representing boundaries and topographic features inside the GN division.
Figure A1 and
Figure A2 in
Appendix A provide high-resolution images of the sketch maps.
The village boundaries tracked using GPS devices were transferred to Google Earth. Then, to further validate the resultant boundary maps, they were presented to the map development team members and local society members of the villages using Google Earth high-resolution images. Subsequently, relevant modifications were made to the resultant boundary maps, according to the feedback provided. Once the boundary map was finalized with village members, it was presented to the relevant Grama Niladari of the area for further verification.
The identification of the village boundaries and the final maps were developed using GIS software. Identified boundaries of villages inside each GND were integrated into a single map, as shown in
Figure 9.
The resultant map shows the village perimeters inside each GND, developed using basic sketch maps and GPS tracks produced by local society members of the map development teams. Numbers 1–12 denote the GN divisions to which each village belonged, and the different villages are denoted by letters A, B, C…. For example, village no 3A, 3B, and 3C belong to the GN division sketch map in
Figure 8a, whereas village 4A, 4B, and 4C belong to the GN division sketch map in
Figure 8b.
Table 2 illustrates the village names, where boundaries were developed and finalized.
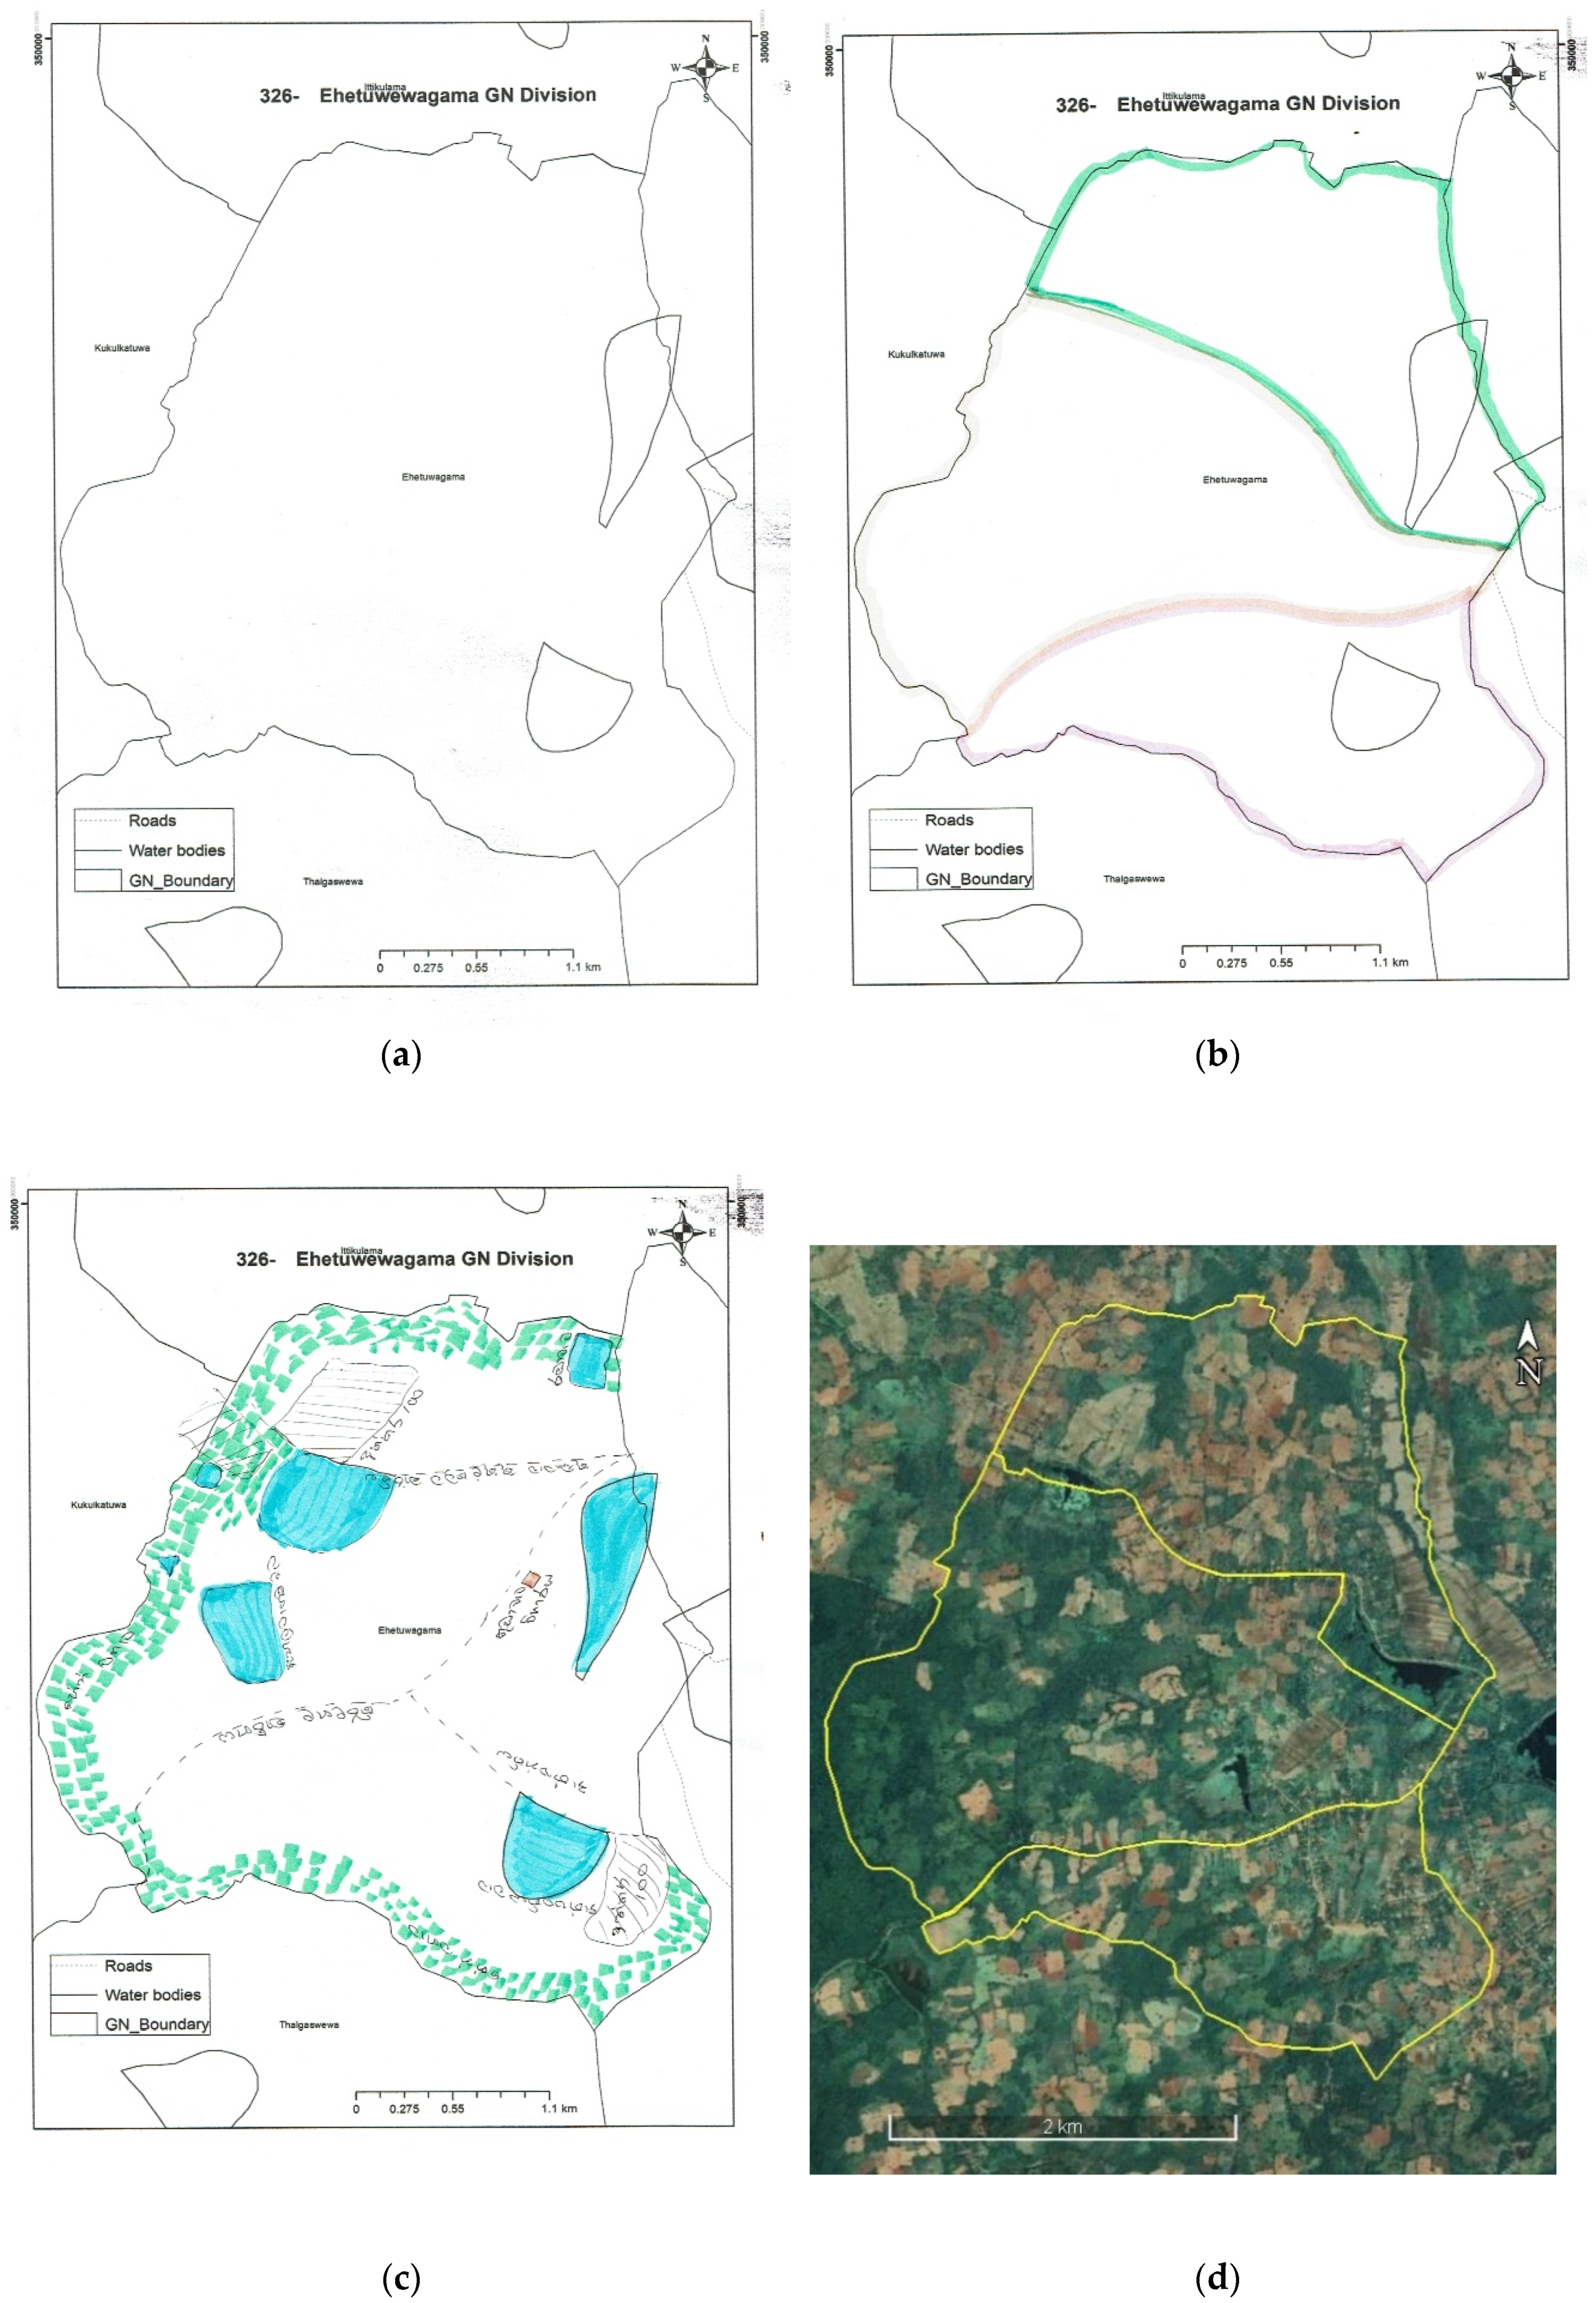
The overall map development process is illustrated in
Figure 10, taking the GN division of Ehetuwewagama as an example.
Figure 10a is the initial GN map provided to the map development team selected from the village.
Figure 10b shows the boundary initially sketched by the map development teams from each GND, whereas
Figure 10c shows the topographic features and other key landmarks of the developed sketches.
Furthermore,
Figure 10d illustrates the sketched boundary map of villages inside the Ehetuwewagama GN division, overlaid on the Google Earth image.
One of the main benefits of the PGIS approach for the local community is that they could enhance their spatial knowledge, while sharing their knowledge. Moreover, younger community members were able to gain additional knowledge from older community members, who could not participate in field data collection. Furthermore, elderly community members who remained in the local community could transfer verbal knowledge to digital map formats. The ultimate results were accessible in the public domain, allowing them to be shared and widely used through digital media.
4. Discussion
This study segregated 38 villages in 12 GN divisions, while initially conducting 45 community society meetings. Accordingly, approximately 100 participants, covering all 12 GNDs, were able to enhance their knowledge of spatial information technologies, which ultimately assisted in combining the boundary demarcation process with local indigenous knowledge. In addition, the community empowerment delivered through this study will be useful in future PGIS-based community projects carried out in the area.
Conflicting situations could have arisen among the development teams, with reference to the boundaries between villages. However, this was avoided through group discussions involving each team. Furthermore, during the validation stage of boundaries, all stakeholder representatives in the community participated. Thus, conflicting situations were avoided, for the most part preventing any ambiguity in the outcomes.
We observed that the younger generation of the area had a lack of knowledge with respect to the geographical distribution and historical background of their surroundings; hence, they were less competent in providing feedback on village perimeters and topography. This was one of the key challenges identified during the study.
Furthermore, in most cases, demarcation boundaries existed in human-made boundaries such as roads, forests, and farmlands, and natural boundaries, such as rivers and mountains. The existence of such stable boundaries was an advantage for their easy demarcation.
During this study, some villagers could not participate in the community meetings due to their regular daily activities. However, since the map development team consisted of several participants nominated to represent each village, their absence did not affect the study’s outcome.
In comparison with other methodologies, such as spatial analysis through demographic and topographic information classification, the PGIS approach includes the most valuable spatial information, i.e., the knowledge residing in the local community, which cannot be otherwise captured. Incorporating local knowledge is a key advantage for planners and decision-makers, in order to conduct more substantial analysis; thereby, producing more precise outcomes.
The boundary demarcation of the smallest community segments called ‘villages’ has a great impact on different scenarios in project implementation. In particular, when implementing projects relevant to different fields/disciplines, authorities can select the target community segment for the ideal performance. For example, project implementers can easily select the most impacted community segments, according to different cultural and religious practices. Furthermore, the target community segment can be chosen on the basis of the project budget, as the community size can be easily retrieved through such a demarcation.
5. Conclusions
This study illustrated the possibility of using PGIS for land boundary demarcation. It also proved that the spatial knowledge residing in the community could effectively be used for planning and decision-making with selected applications. Furthermore, the generated maps can be published on a web-based GIS system; thus, making data accessible to the public. This can assist government and non-government authorities in easily demarcating community segments for different purposes, such as urban/rural planning.
This PGIS approach for village boundary demarcation can be conducted for similar regional areas, primarily targeted when implementing community-based projects.
In summary, the participatory PGIS approach can enrich community development and planning, while facilitating community education on spatial planning and geospatial technologies, which will be a positive enabler for community empowerment and development. Community education and empowerment can also be extended through the assistance of relevant government institutions, such as the Survey Department of Sri Lanka. As revealed throughout the study, the participatory GIS approach adds high value to land demarcation applications. Additionally, such an approach can be used for future planning and implementation. PGIS-training sessions can deliver new technical knowledge to the local community, which can be integrated into future applications. Therefore, the objectives of this research were accomplished, while providing potential for future studies.


