
Historical Vltava River Valley–Various Historical Sources within Web Mapping Environment


Faculty of Civil Engineering, Czech Technical University in Prague, 166 29 Prague, Czech Republic
*
Author to whom correspondence should be addressed.
ISPRS Int. J. Geo-Inf. 2022, 11(1), 35; https://0-doi-org.brum.beds.ac.uk/10.3390/ijgi11010035
Submission received: 31 October 2021
/
Revised: 10 December 2021
/
Accepted: 26 December 2021
/
Published: 4 January 2022
(This article belongs to the Special Issue Geographic Information Science (GIScience) and Geospatial Approaches for the Analysis of Historical Visual Sources and Cartographic Material)
Abstract
:The article deals with a comprehensive information system of the historic Vltava River valley. This system contains a number of resources, which are described. For old maps, which are the basis of the whole system, their georeferencing and potential problems in creating seamless mosaics are described. Other sources of data include old photographs, which are localized and stored in the system, along with the definition point of the place from which they were probably taken. The vectorization of data is described, not only for area features used for the analysis of land-use changes, but also for the vectorization of contours. These were vectorized from old maps and are substantial for the creation of historic DEM. Vectorized footprints of buildings and vectors of other functional areas subsequently serve as a basis for the procedural modeling of the virtual 3D landscape. The creation of such a complex and broad information system cannot be described in one article. The aim of this text is to draw attention to a possible approach to the presentation and visualization of the historic landscape, along with links to important documents.
1. Introduction
Information about the historical landscape is a very important source for the analysis of land use and understanding of the issue of changes and development of territories over time. Traditionally, this information is obtained from old maps [1]. In addition, there are numerous of other materials on historical landscapes that can be used. These include old photographs, building plans, inventories of objects, thematic information (water management, social issues, transportation), or books (chronicles, documentary monographs) and historic film footage. All these materials form a memory of the landscape, which, as a whole, provides us with information about the area [2]. In the article, we deal with the creation of a comprehensive information system on the example of the Vltava River, which includes a number of sources. The aim is to connect all the materials with spatial information and to create a historical geographic information system (HGIS) [3]. The system of the former landscape around the river will be in the length of more than 350 km. In this context, the study of landscape or urban change is usually based on the HGIS method [4]. Maps always represent the basis of such an information system. In our case, these are old analogue maps of the river [5]. The oldest topographic maps depicting the river landscape date from the eighteenth century. Thus, our theme is limited to the period from the latter half of the eighteenth century; the greatest emphasis is aimed at the nineteenth and twentieth centuries, and for this time there already exist accurate maps based on geodetic bases.
2. Materials and Methods
2.1. Theoretical Background
Information systems focused on historical sites have become quite common. These are usually systems supporting tourism and the presentation of cultural heritage. As an example, we can cite the City of Jeddah for the promotion of its history through a web-based information system based on maps [6]. Very often we also encounter databases of historical objects that serve as inventories of cultural heritage [7]. In our project, we also focus on the inventory of interesting historical buildings around the river. These may comprise homesteads, inns, churches or chapels, but also bridges, ferries, weirs and dams. Hydrotechnic objects are thus a very interesting part of the project and represent an industrial heritage that should be included in the system. The database of hydrotechnic objects is also dealt with [8]. Among the infrequent sources focused on the study of historical rivers can be included [9,10]. Some other authors are interested in the river landscape as a specific type of terrain [11,12]. Important and famous objects of a particular period may be highlighted in a contemporary old map along with a popup information window, as in the Map of the City of Madrid from time of Cervantes [13]. A similar approach to ours is taken by the colleagues documenting the City of Granada [14]. They combine old maps with point layers of objects of interest and their photographs.
Old photographs are an integral part of our project. Due to the fact that the Vltava is the most famous Czech river, but also very important from the economic, touristic, transport, communication and geographic standpoint, there are a number of historical photographs documenting its development. For each photo, we create its reference point from where the shot was probably taken. The geolocation of photography can be found in some similar projects [15]. In addition to old photographs, it is advantageous to take current photographs, or rather use photographs of identical places from different time periods [16]. These comparative pairs are then preferably used within the information system.
A specific feature of old riverine maps of watercourses is mainly their linear character. This is also related to the more complex process of georeferencing, as the selected ground control points (GCPs) usually lie in the river line and global transformation equations fail. Then, it is necessary to use local transformation methods based on interpolation mechanisms, such as the Thin Plate Spline [17]. For photographs as well as for maps, it is advisable to georeference representatives from different time periods and allow their comparison within the application. In this case, it is appropriate to vectorize the course of the river so that the data can be easily overlapped [18]. It is advantageous to create vector layers where we deal with Land-Use Changes (LUC). In our project, we decided to create a complete vector data model, which will be used for analysis and visualization. Based on analytical calculations, it is possible to infer the stability of the landscape [19]. From the landscape-hydrology perspective, it is also possible to monitor the development of the pond network interconnected to the river, which has undergone a number of changes in history. In this case, there are not any specific hydrological maps, but usually historical military topographic mappings [20]. Driving forces for land-use and forest changes in the 19th century were studied as well [21,22]. It is also important to obtain information about the altitudinal component of the historic landscape, either from contour lines on the maps or in combination with current models acquired using LiDAR [23]. The DEM derived from them can be a suitable basis for visualizing the landscape in 3D. A way of reconstructing the historical 3D valley of the Vltava River was chosen, mainly because a large part of it was flooded after the construction of a cascade of a total of nine dams during the twentieth century. It is necessary to think about landscape concept and how the visual materials provide information for landscape reconstruction as well [24,25].
Creating virtual landscapes in 3D is currently a very popular visualization tool [26,27,28]. Extinct places, landscapes and cities can be revived in a virtual environment, as The Ancient City of Rome [29]. In addition to historic DEM, 3D objects (buildings, trees) could be added. The standard for modeling such objects is Trimble SketchUp [30]. By connecting DEM and 3D objects, a virtual landscape is created and can be rendered using a photorealistic visualization (for example the Lumion 3D software). Certainly, it is also possible to use historical aerial photographs and orthophotos. These can be used especially for endangered monuments that have been partly damaged in the last hundred years (for example, the Citadel in the City of Erbil) [31]. We also use the historical orthophoto, because the Vltava underwent a significant transformation, especially in the twentieth century. Some already extinct monuments can be modeled in great detail using a variety of spatial data. The Roman Circus in Milan was reconstructed as an example of this approach [32]. If monuments are modeled in detail, including the DEM in the vicinity, it is possible to use visualization tools to present objects in different seasons and in different weather conditions, using photorealistic landscape rendering [33]. For a larger area, it is usually not possible to use the methods of classical 3D modeling for all objects in the scene (it may represent thousands of buildings). Then, procedural modeling might be used, which offers significant improvements over a uniform visualization of all elements. Using a set of rules, objects are modeled and textured, involving even an element of randomness. The result is a virtual landscape that can be detailed for only a few key monuments; the other objects are modeled procedurally [34]. Conversely, if we want to model some objects at the level of building elements, it is possible to use the BIM approach [35]. In recent years, a visualization technique using virtual reality (VR) has become a trend. It is used mainly in computer games that use one of the game engines (Unity, Unreal Engine). A typical application area of VR is archaeology. Here, VR can be used as a virtual museum of archaeological artefacts [36]. In the case of landscape modeling in VR [28], the situation is more exacting mainly due to the complicated data transfer between GIS and VR. In our project, the use of VR is planned, but we are only at the beginning of its utilization. However, there are examples of suitable applications, such as, for a landscape that has undergone an extensive transformation due to the mining industry [37].
2.2. Data and Methods
The Vltava River is an important river crossing most of the territory of Bohemia from south to north. It flows through the Capital City of Prague and is an important national symbol and motif in the works of painters, poets and musicians. The river, which originates in the Šumava forests, flowed through a morphologically diverse landscape, from the gradual Šumava plains, through narrow valleys in the Bohemian Forest and the flat landscape around the South Bohemian metropolis of České Budějovice to markedly cut valleys closer to the center of Bohemia.
It was also an important transport route, especially for the transport of salt and wood. Equally important was the use of water-power energy and there were many mills, sawmills and other objects on the river, later, for example, hydroelectric power plants. The river was dammed by weirs, including culverts allowing uninterrupted navigation. The traffic significance of the river was the reason for causeway works and caused the creation of a number of organizationally and technically demanding works (for example the canal lock/sluice in Županovice). A towpath led along the river bank, allowing transport boats to move upstream. Although the river itself was an important transport route and economic element, the river’s surroundings, especially in hard-to-reach areas, were often very poor. Since the end of the nineteenth century, the charm of the river landscape has enchanted more and more people. Especially near Prague, the river has become a popular destination for tourists and paddlers, which triggered the development of tourism infrastructure.
The importance and ways of the economic use of the river have changed over time. Small weirs have been replaced by larger ones; mills were converted into power plants, and; from the end of the nineteenth century, there were projects for the comprehensive use of water-power and the construction of a dam system. This system of dams was built up during the second half of the twentieth century and it has significantly changed the Vltava riverine landscape and life in it, and interrupted the navigability of the river between České Budějovice and Prague. The goals of the construction and function of water works also developed over time, including the improvement of navigability, use of water energy, flood protection and providing water for the Temelín nuclear power plant. Works to make the river navigable are again, and currently, in progress.
The studied area represents a historical, cultural, organically developed landscape, the formation of which was significantly influenced by the predominant method of economic use. Due to the dominant form of use, we refer to it as the landscape of dam reservoirs [38]. It is characterized by the flooding of the original settlements connected to the riverbed and the construction of new settlements, usually with a dominant recreational function. The banks of the Vltava have suffered due to the construction of the system of reservoirs—Vltava Cascade. The swelling of the water surface in the monitored part of the river represents more than its two thirds, and it meets the above-described characteristics [39]. The level of the filled reservoirs avoided important historic towns, but rural settlements disappeared underwater. Both in the flat landscape where peat mining, flax growing, logging and floating wood were people’s livelihood, and in the valleys and gorges lined with mills, raftsmen’ inns, quarries, etc. Facilities for individual and mass recreation have sprung up on the banks. The transport of material on ships and rafts has been replaced by recreational transport [40,41].
Due to its importance, the Vltava River was the subject of interest of many engineers and cartographers. The first maps of all or a significant part of the river were created from the middle of the eighteenth century and mostly depict the most economically important part of the river from České Budějovice to Prague, or to the confluence with the Elbe River [42]. A number of these valuable and interesting maps was founded across various archival institutions. Most of them were forgotten and almost unknown. These maps vary in the scale, date and method of creation, but all of them represent important images of the Vltava river in the specific period. The overview of so-far researched maps is in Table 1. These manuscript river maps contain information important for navigation (sands, shoals, rocks, islands, weirs, rapids, and streams), crossing the river (fords, ferries, and bridges), the route of the tow-path and the economic background (mills, inns). Some maps also show measured transverse profiles or the velocity of the stream. The topographic content is limited to the river itself and narrow strips around the river, the elevation is shown by hatching (Figure 1). Due to the complexity and inaccessibility of the riverbed, older maps are not very accurate; however, since the first half of the nineteenth century, they have been based on accurate cadastral maps. Therefore, if we are writing about landscape reconstruction, we are usually focused on the first half of the nineteenth century.
For the description of the whole researched area, there are suitable map works, which cover the whole area uniformly. Due to the fact that the Vltava River and its surroundings belonged to the Habsburg Monarchy in the eighteenth and nineteenth century, it is possible to use the historical mappings of this empire [43,44]. For medium scales, it is possible to use military topographic surveys. An overview is presented in Table 2, including the time of origin of the used map sheets and suitable georeferencing methods.
Since 1918, it has been possible to work with topographic mappings of independent Czechoslovakia. Unfortunately, until 1957, no mapping was carried out to cover the entire territory of the state. For maps containing the surroundings of the Vltava River, military topographic mappings from 1953–1957 at a scale of 1:25,000 and from 1957–1971 at a scale of 1:10,000 are available. These mappings contain, in certain areas, already created dams and reservoirs built most often in the 1950s. For comparison with the current state of the landscape, it is possible to use contemporary map works, especially the Basic Map of the Czech Republic created from the ZABAGED digital model [45].
If we are interested in a larger scale, it is possible to use cadastral maps. From this perspective, the most interesting is the Stable Cadastre, the mapping of which took place on the territory of Bohemia in the years 1826–1843. The scale of cadastral maps is 1:2880, the estimated accuracy is around 2–3 m. These maps were made on the basis of the Imperial Patent of 1817, which established the Stable Cadastre. Cassini-Soldner’s projection was used as the map projection; for Bohemia, the Gusterberg datum of cadastre co-ordinates were used. Maps were created by using a method of the plane table in the fathom scale of 1:2880 directly in the field. Imperial Obligatory Imprints (original maps copies) were not used for plotting additional changes in the field, and thus depict the landscape in its original state from the mapping period (Bohemia 1826–1843). Maps were manually colored. Georeferencing these maps is relatively difficult due to mapping one cadastral unit by another on separate map sheets. Of course, it is also possible to use newer cadastral maps of the re-ambulated Stable Cadastre or the Czechoslovak cadaster of real estate (herein, already at a scale of 1:1000).
In terms of elevation, military topographic surveys of the Habsburg Monarchy are inappropriate. First and Second Military Surveys contain only hachures; Third Military Survey contains contour lines, but with a relatively large interval. For the needs of modeling, the historic Vltava valley, only first edition of State Maps derived at a scale of 1:5000 are available. The planimetric map component in the first edition was derived from cadastral maps, while the altimetry component was derived from topographic maps in the S-1952 system, or, in some cases, also from topographic profiles of the 3rd military mapping. The altimetry, which was the subject of the successive processing, was marked in brown comprising contour lines, spot elevations and, potentially, technical or topographic hachures and descriptions. The elevations are in the Baltic Vertical Datum after Adjustment. The map sheets have dimensions of 2.5 × 2 km and are in the 90-degree angle sheet line system projected in the S-JTSK coordinate system. Their first edition is dated 1950–1953, which is a period just before the construction of most dams. Contour lines in these maps have a different quality and interval of contour lines. Therefore, it is not an ideal and homogeneous map work; however, no other source covers the whole area with contour lines.
An important work covering the entire area of interest is also an orthophoto from historical images of military aerial photography from the 1950s (mostly from 1952–1956) (Military Geographical and Hydrometeorological Office, Dobruška, Czech Republic). Aerial photography took place before the construction or filling of the Vltava Cascade (with the exception of Vrané and Štěchovice Dams built in the 1930s). Therefore, it shows the original landscape and objects around the river. In the case of Slapy and Orlík Dams, it shows the landscape during the dam construction (dam construction, clearing of forests), but before filling the reservoirs.
In addition to these documents, a number of other maps and plans were created, mostly dealing with the regulation and possible use of the Vltava water-power. Most of these water structures were not built due to their complexity or were replaced by a newer project. Many regulatory works and small water structures disappeared or were hidden below the surface of large reservoirs created in the second half of the twentieth century. However, these are interesting constructions and technical solutions that are important to include within the information system. The origin and the owners of these plans and maps are different. They could be state regional archives, the archive of the Povodí Vltavy, the National Technical Museum, regional museums and private collections. Some of these documents are already digitized but, in most cases, the digitization is undertaken within the project.
For use within the river information system, it is important to properly georeference the maps. For newer maps of Czechoslovakia and the Czech Republic, the maps are created in the national JTSK system, and it is possible to transform them only with the use of the map sheets index and projective transformation using corner points. For older maps, it is usually necessary to derive a global transformation key for the transformation into one of the current reference coordinate systems. This was achieved for the Second and Third Military Surveys and the Stable Cadastre. Here, after the transformation of the map sheet index, it is possible to use a projective transformation and four corner points again. The situation is more complicated in the case of the Stable Cadastre, where it is necessary to resolve the contact of individual cadastral areas, as they were mapped separately on separate sheets.
The georeferencing of the First Military Survey maps or manuscript river maps is problematic. Here, it is necessary to use GCPs and a suitable type of transformation, which will ensure the best possible fitting for GCPs and, at the same time, the continuity of adjacent map sheets [46]. For river maps that contain only objects near the river, it is very difficult to find a suitable method. If the sections are drawn with larger errors, large image distortions occur. Many transformations also collapse due to the collinearity of GCPs. The identity of GCPs must be checked carefully. For some maps, it is necessary to accept the non-continuity of map sheets after the resulting transformation.
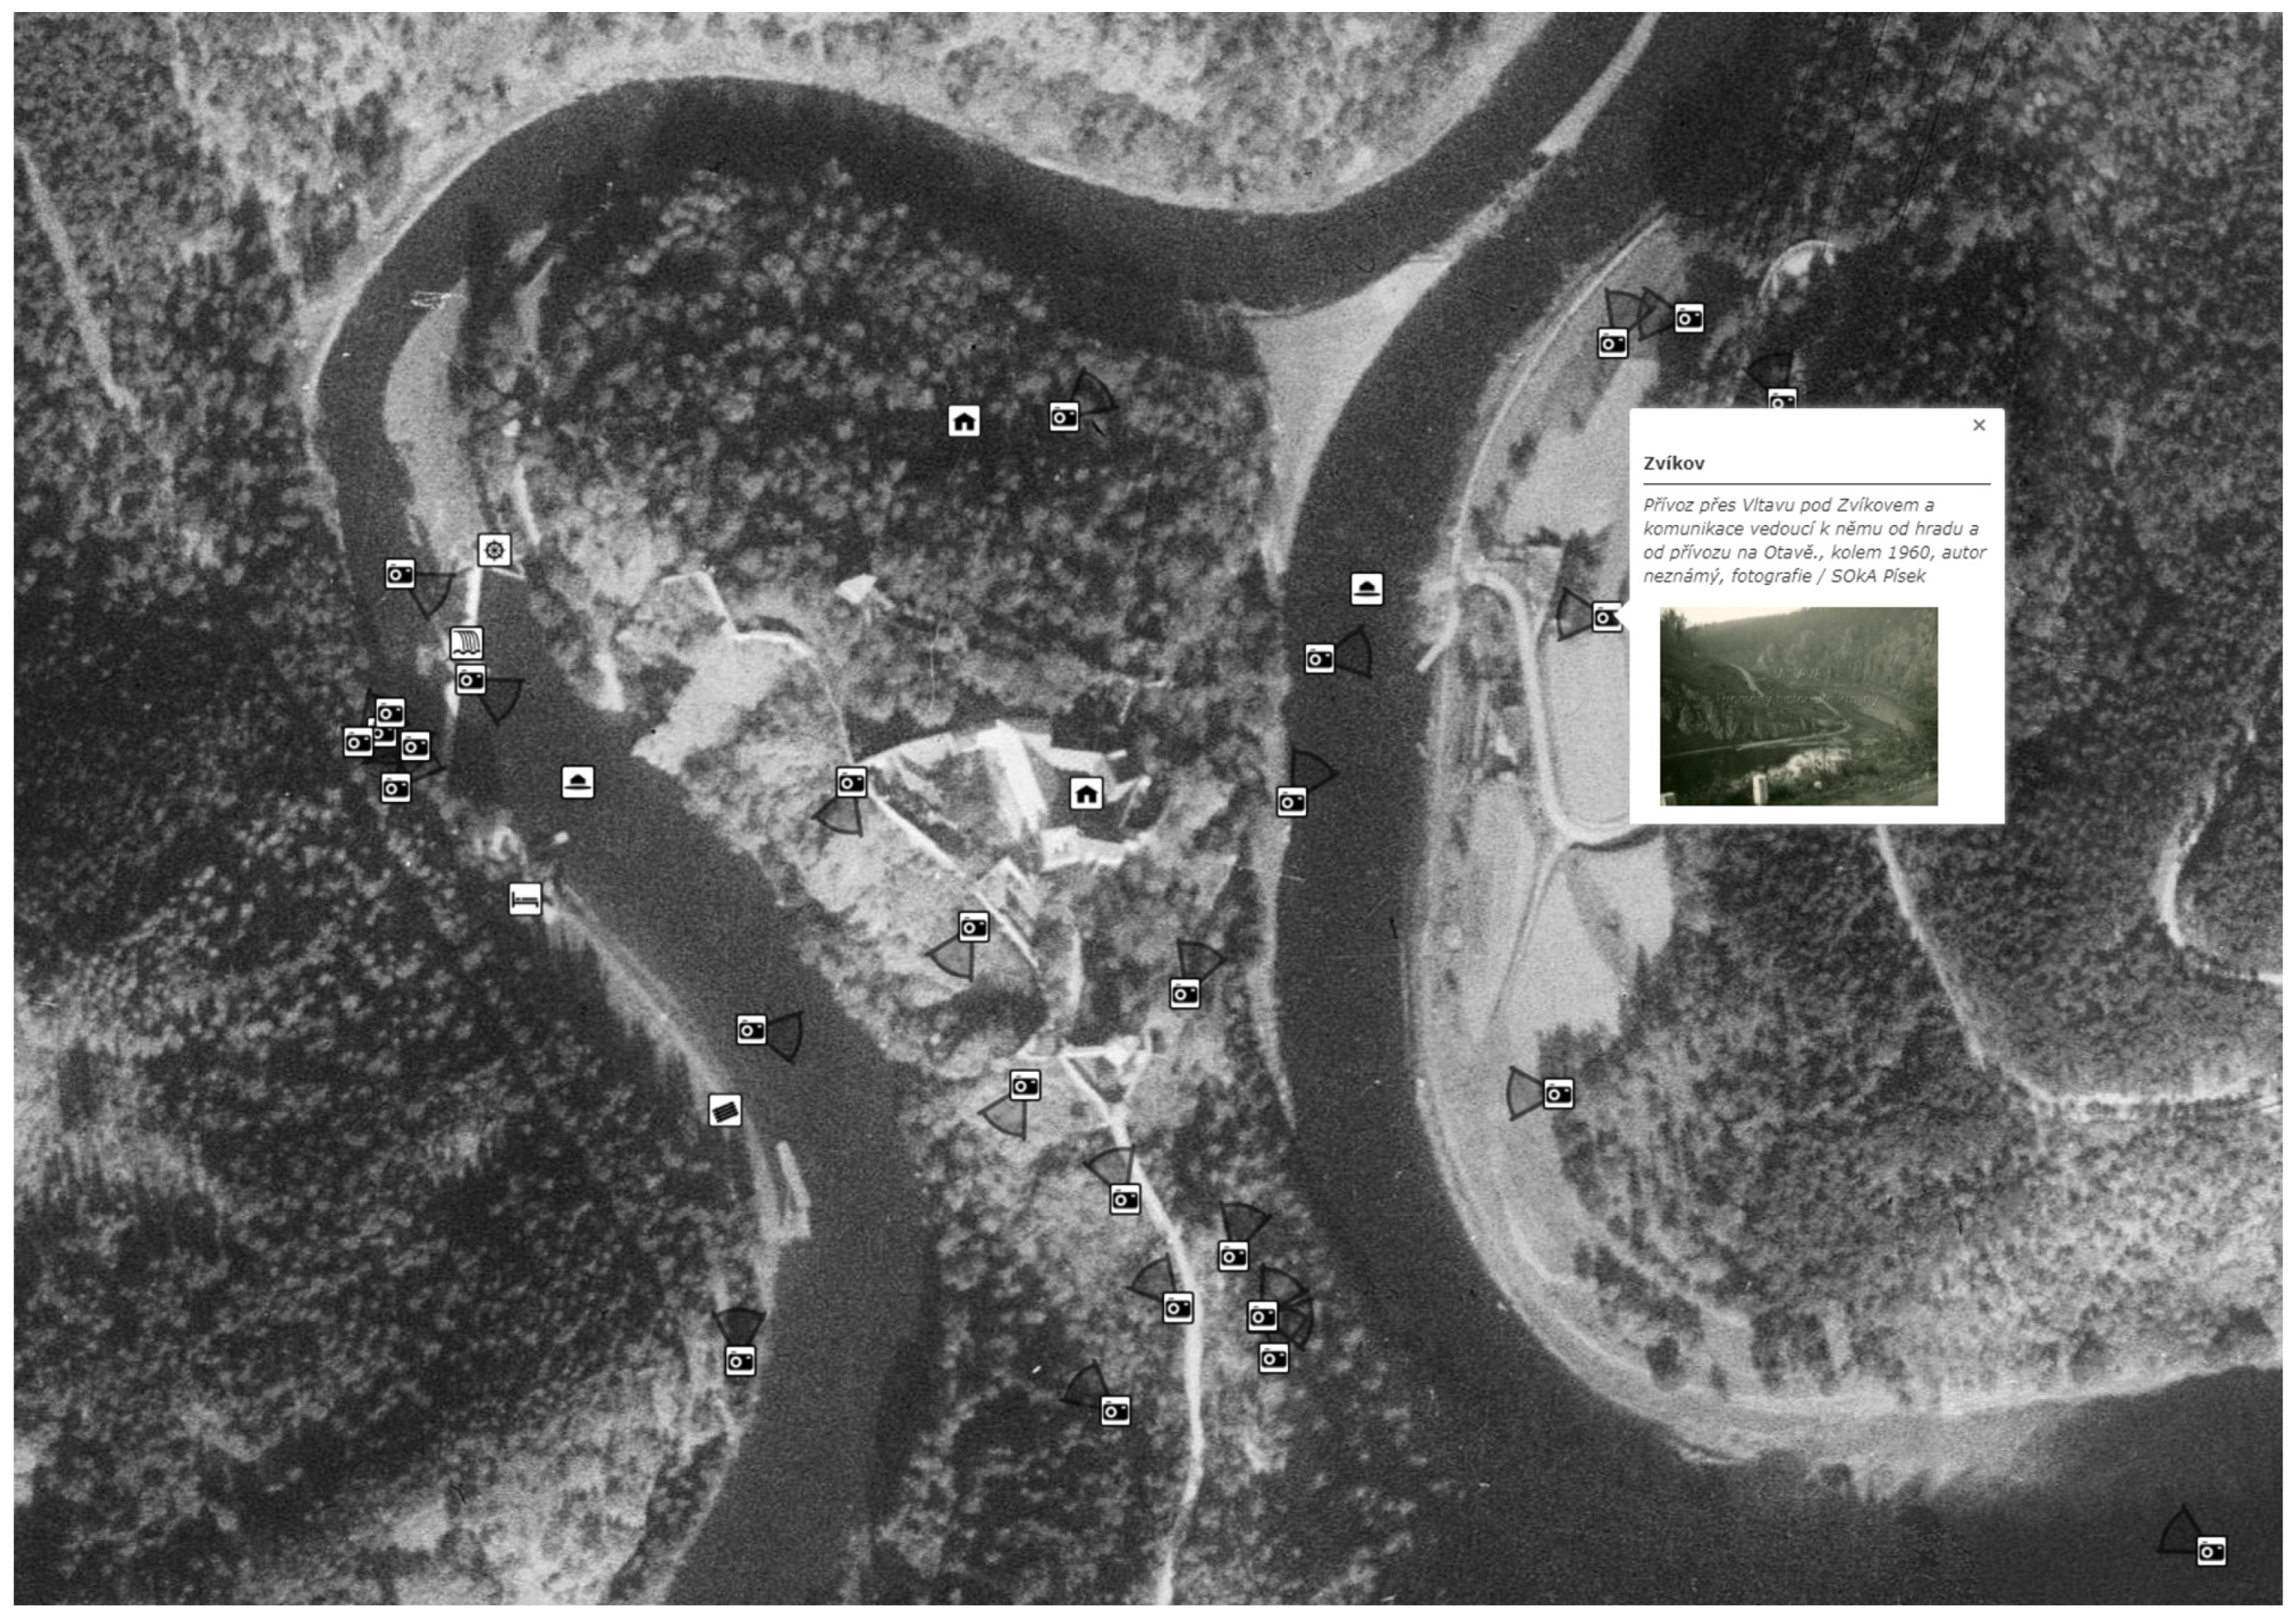
An excellent source of information about the historic landscape is also old photographs and postcards, or even paintings, drawings and views. In large numbers, they show already extinct or changed places and provide an easy idea of the appearance and changes of the landscape. For the needs of the information system and map applications, all photos are located and represented by one reference point (Figure 2). This allows us to view one site in different documents, on old maps, current maps, historical and current photos from different places, and attain a comprehensive view of the development of the landscape.
There are a large number of photographs and postcards, which puts great demands on their selection and also on the identification of the photographed place. Above all, significant, high-quality and unique, and not commonly known photographs were selected. We went through many important archives, museums or personal collections to attain such photographs (National Archives of the Czech Republic, Prague, Czech Republic, State Regional Archives, Prague, Třeboň, both Czech Republic, regional museums in Horní Planá, Písek, Český Krumlov, České Budějovice, Příbram, all Czech Republic). The disadvantage is the uneven distribution of photographs. Popular and easily accessible places were photographed often, hard-to-reach places not at all. A good knowledge of the Vltava landscape, as well as other historical and contemporary photographs, is essential for the correct location. The utilization of orthophotos from the 1950s, which capture the yet unflooded landscape and are also close to the time of the creation of the most interesting photographs (first half of the twentieth century), proved to be an essential tool for localization. The determination of the reference points of the photographs was carried out in an online map application using different map layers. Basic metadata are stored as reference point attributes available for each photo. The photographs were searched in the photographic collections of various archives, museums, institutions and private collectors.
One of the goals of the information system is to show particular places, buildings and structures that have either disappeared or still exist. A database of important objects connected with the river and life around the river was established. These objects are water management facilities (weirs, culverts, dams, limnigraphs), transportation (fords, ferries, bridges), economic structures (mills, sawmills, mills, power plants, paper mills, raft binding yards), sacral buildings (churches, chapels), tourist attractions (inns, restaurants and guesthouses), as well as major homesteads and hamlets. The structure of the database was designed with regard to the uniform storage of inconsistent information on different types of objects. The resources for selecting and identifying objects are diverse: literature, old maps, archival sources, existing databases (for example Available online: http://vodnimlyny.cz (accessed on 9 December 2021), and the knowledge of witnesses and researchers as well. The aim of the application is to offer basic information: location, description and purpose of the object, dating, and if there is also a photograph, reference to literature, selected plan documentation, link to archival and online resources for further research, with everything linked to one reference point.
In order to display the detailed situation in a specific locality (mill, paper mill, church), another interesting source are situational and construction floor plans of individual buildings or areas. These are very different in dating, processing, scale, and availability. They are used together with photographs and text descriptions to supplement information about selected important objects within the information system.
In addition to the possibility of viewing raster maps in the information system, the conversion into a vector data model is suitable for selected layers and elements. At a minimum, it is suitable for the water surface of the river in order to be able to observe and analyze changes in the riverbed. The vectorization of a complete land use in a corridor about six km wide was chosen for cadastral maps. The area up to a distance of three km on each side of the river banks includes the area most affected by land-use changes in connection with the river. It is an area of cadastre units that are adjacent to or affected by the river (for example, flooded by a dam reservoir).
Maps from the years 1843 (Stable Cadastre), 1953 (SMO5) and 2021 were chosen as time sections. The oldest period (1843) refers to the oldest possible high-quality, large-scale maps. We assume that here we can see the characteristics of the pre-industrial landscape. The 1950s are the second period with an important situation before creating most of the dam reservoirs. Here, we can see the state of the landscape right before its flooding. The third period refers to the current state of the landscape. The current data use the RUIAN database, which contains a drawing of cadastral boundaries. Vector data can be used for the LUC analysis. They also serve as a basis for 3D visualizations, with the footprints of buildings being used for procedural modeling [34].
To vectorize the hypsography, we described the methodology of its conversion from SMO5 raster maps to the final 3D model of the whole valley [47]. It is a workflow in which the amount of colors is reduced first; then, automatic vectorization is performed in the ArcScan software. Subsequently, automatic vector adjustments are performed and information on contour heights is manually added. These contour lines, together with elevation spots, form the basis for the creation of the DEM of the historic Vltava valley.
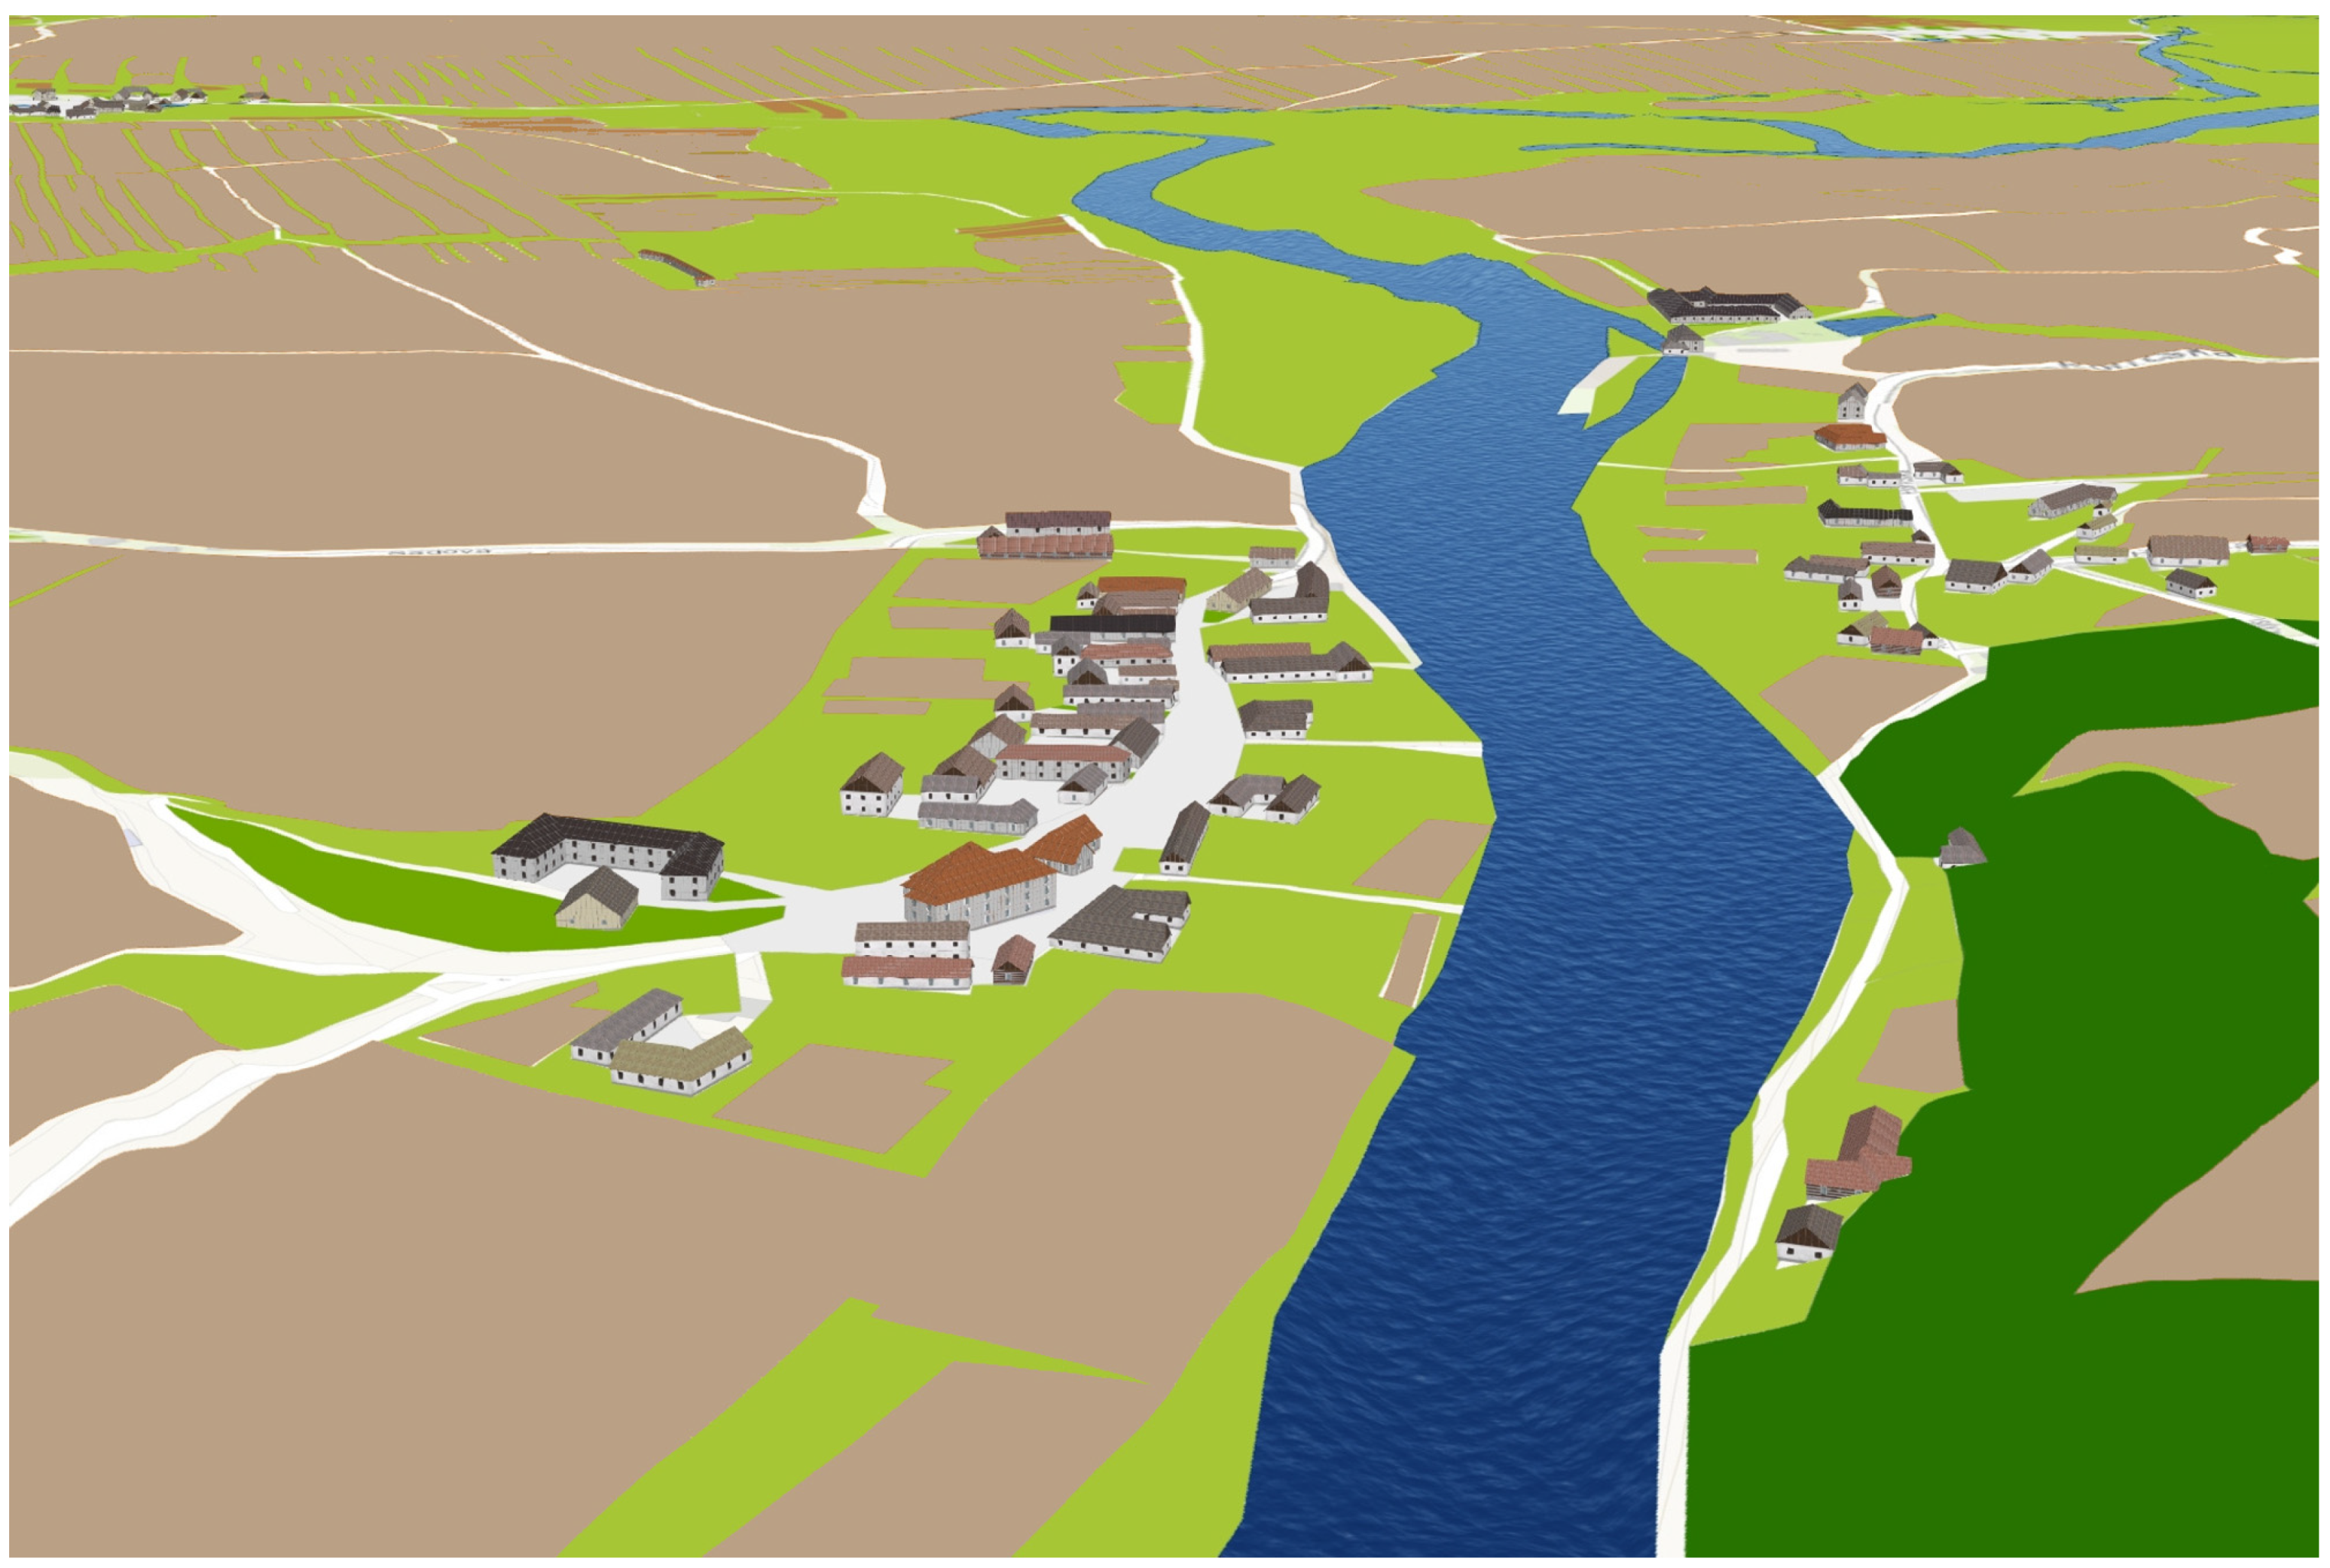
The resulting data (georeferenced maps, vectorized layers, DEM) can be used to model the virtual landscape in 3D. As mentioned, the footprints of buildings are used for procedural modeling (Figure 3). Various types of soil cover determine the texture of the surface (or it is possible to use the texture of the raster image of the map). The elevation used from DEM is usually exaggerated (2.5 times) to make the terrain more distinctive. The created virtual model is the basis for a potential creation of physical 3D models (3D printing technology or architectural modeling). The whole model can then be transferred to VR and presented with greater impact on users [37].
The aim is to create a comprehensive system that allows us to display and analyze cartographic, photographic, textual and other materials in the context of their geographical location and their relationships. We use the Esri platform for the entire data processing. The georeferencing and vectorization is undertaken in ArcGIS Pro, along with the database creation and their filling as well. The City Engine product is used for procedural modeling. As part of VR testing, we opted for the Unreal Engine platform. ArcGIS Server is used for publishing map layers; the basic composition is created on ArcGIS Online and the application itself uses ArcGIS API for JavaScript 4.17.
Within the information system, in addition to the introductory texts, emphasis is placed primarily on the presentation of the results through a combination of a 2D map application and 3D scenes. The 2D map application should enable basic orientation in space, search for localities, the display and comparison of each map layers, as well as the display and viewing of localized photographs and points of interest. These points contain not only basic descriptive information about the object, but, furthermore, they contain links to photographs, plan documentation and other data stored externally (website, archive fund, etc.).
The 3D scene combines the created DEM of the historical landscape, vector models of land use in different time sections as possible surface layers, and a procedurally generated model of development (buildings). The procedural modeling of buildings based on their footprints and determined building rules allows a quick creation of a 3D model of thousands of individual buildings and, thus, completes the 3D landscape. We do not create historically accurate models of individual buildings via procedural modeling. However, appropriately selected rules will enable the creation of a model of built-up areas that corresponds in the structure and style. Significant objects can be accurately modeled in CAD. The result is published as a 3WS web scene and made available to the public via ArcGIS Online. The aim of the web scene is to enable a smooth interactive movement and exploration of the now flooded Vltava River landscape in the entire area of interest.
Notably, 2D and 3D applications are complemented by other documents focused on the river landscape and its changes, aspects of life around the river, hydrotechnic objects and human use of the river during the past century.
3. Results
The georeferencing of the maps used in the information system was relatively complicated. The maps of military topographic mappings were georeferenced for the whole territory of Bohemia within research on other projects. The mean errors achieved by individual mappings in the standard alignment can be found in the literature [48]. It can be seen that the First Military Survey achieves about ten times greater errors than the Second Military Survey. Therefore, it was necessary to use another proposed method [46]. A total of 250 map sheets and almost 7000 GCPs were used. When adjusted together by a polynomial transformation using the robust IRLS method, a mean error of 280 m was achieved. A preview of the resulting mosaic can be seen in Figure 4.
Peripheral map sheets remain an unsolved problem, which could not be included in the compensation due to a small amount of GCPs. It will be necessary to add them to the mosaic manually, probably using a polynomial transformation using points on the edges of map sheets. Alternatively, the Grid Shift Binary method could be used for georeferencing of the First Military Survey, which results in similar accuracy [49].
Newer map works (SMO5, Czechoslovak topographic maps) were georeferenced relatively easily using the map sheet layouts and corner point coordinates. For the SMO5 maps, the resulting mosaic has 334 map sheets. Although a projective transformation using the corners of map sheets was used, the affine transformation was also tested in order to eliminate potential gross errors (for example subtraction of the map corner). The mean errors of these transformations for all map sheets did not exceed five meters.
A total of more than 26,000 km of contours and more than 3000 elevation spots were vectorized using the above mentioned procedure of altimetry vectorization from SMO5 maps. The territory was analyzed to find the used contour interval. Almost 60% of the territory has a contour interval of ten meters, about 24% has an interval of only twenty meters. For ideal modeling, it would be better to have an interval of five meters or less. It is, therefore, necessary to consider that the model created by us is relatively rough. For DEM modeling, the points of the longitudinal profile of the Vltava River from 1940 were also used for refinement. The shoreline is, therefore, very well assigned a height. For broader relationships, it was necessary to link the created DEM with the current quality DMR5G (Digital Terrain Model of the Czech Republic of the 5th generation). It was necessary to smooth the data at the contact between the models so that the transition of both models would be smooth. We analyzed the quality of the DEM created by us using the current flood line of the Slapy, Orlík and Lipno reservoirs.
Figure 5 shows the mismatch of the line generated from the created DEM (blue line) and the current shoreline (red line).
The georeferencing of the Stable Cadastre maps was the most difficult step in raster data processing. This is mainly because the resulting mosaic contains almost 2000 map sheets. These map sheets had to be georeferenced using both corner points and GCPs. As these are island maps, the connection of individual cadastral areas was a serious issue. These are masked on the map sheets according to cadastral boundaries so that there is no gap or overlap anywhere. Most map sheets were transformed using a projective or affine transformation. A polynomial transformation was used on fewer sheets. The mean errors of these transformations ranged in the order of units of meters, with a mean value of 2–3 m. Nevertheless, in some places it was not possible to eliminate completely the discrepancy (conflict) at the contact of the map sheets (Figure 6).
Both the mosaic of the Stable Cadastre and the SMO5 mosaic were used for the Land-Use vectorization. At the time of writing, the vectorization of the Stable Cadastre is complete, in the form of approximately 150,000 polygons. The vector data accurately follow the rasters in the form of a data model that uses the map key of the Imperial Obligatory Imprints of the Stable Cadastre. Of course, the vector data have passed through a complete topology check. The vector data will be used for standard LUC comparisons.
All raster and vector layers will be available to the user within the 2D web map application. This application will be the basis for the information system. In addition to the 2D application, we are working on the development of a 3D application that will allow a better visual perception of the historic landscape. Vector data serve here as a basis for modeling in 3D.
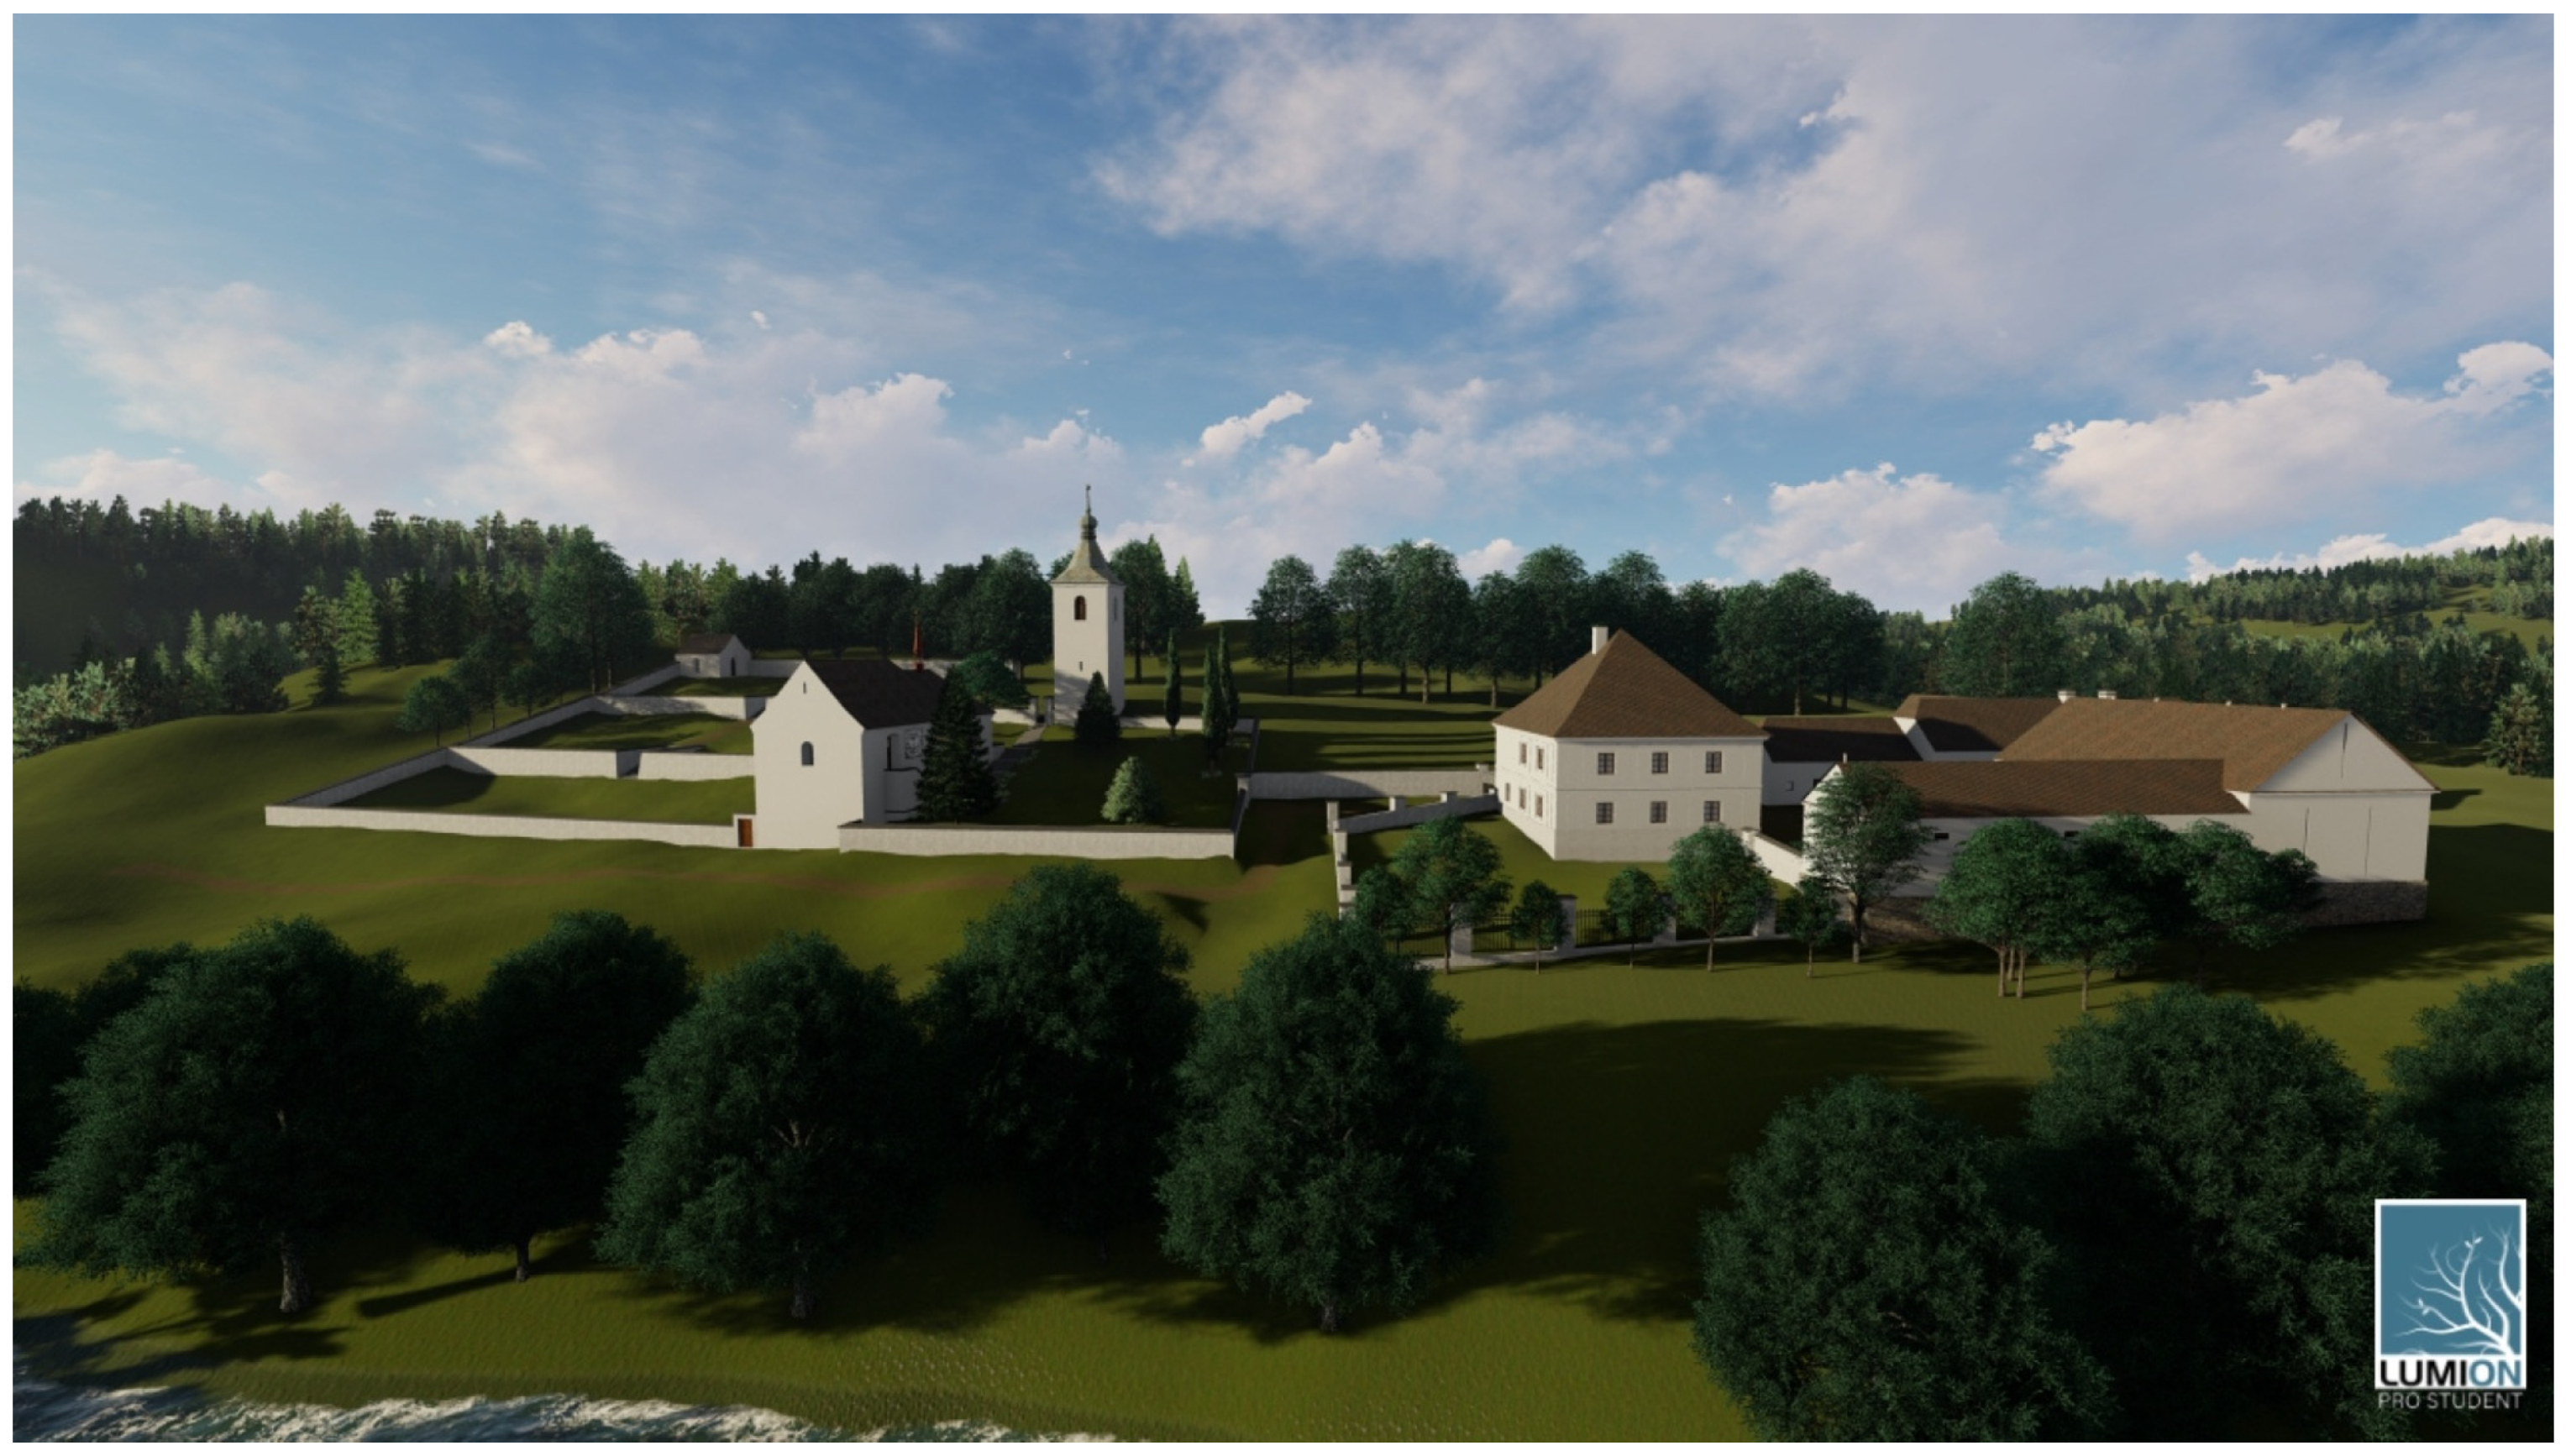
For our purposes, 3D modeling of buildings can be most easily divided into procedural and detailed in CAD (SketchUp). Accurate modeling of individual buildings brings a detailed graphical representation of an extinct building, but it is very time consuming. It is possible to create models of only carefully selected significant buildings by this method. An important basis for accurate modeling is the planning documentation, construction-historical survey of the building, drawings, and photographs. The model with a surrounding terrain can then be modeled using the SketchUp or another CAD software. The Lumion 3D software, for example, can be used as a possible visualization tool, which enables the rendering of a 3D scene and animations in real time. In addition to photorealistic textures, a library of other elements (tree, grass) can be used, as well as the effects of sun exposure, time of day, weather, clouds, etc. The use and combination of effects was tested to achieve the most realistic visualization of an extinct site. The disadvantage is that in a detailed form, it is possible to present only a local model with its immediate surroundings. Due to the laboriousness, only the most valuable objects can be processed in this way. In Figure 7 is an example of the visualization of the parish complex in Červená nad Vltavou. The presentation in an online environment is problematic and the possibilities are limited to sharing a non-interactive video or images.
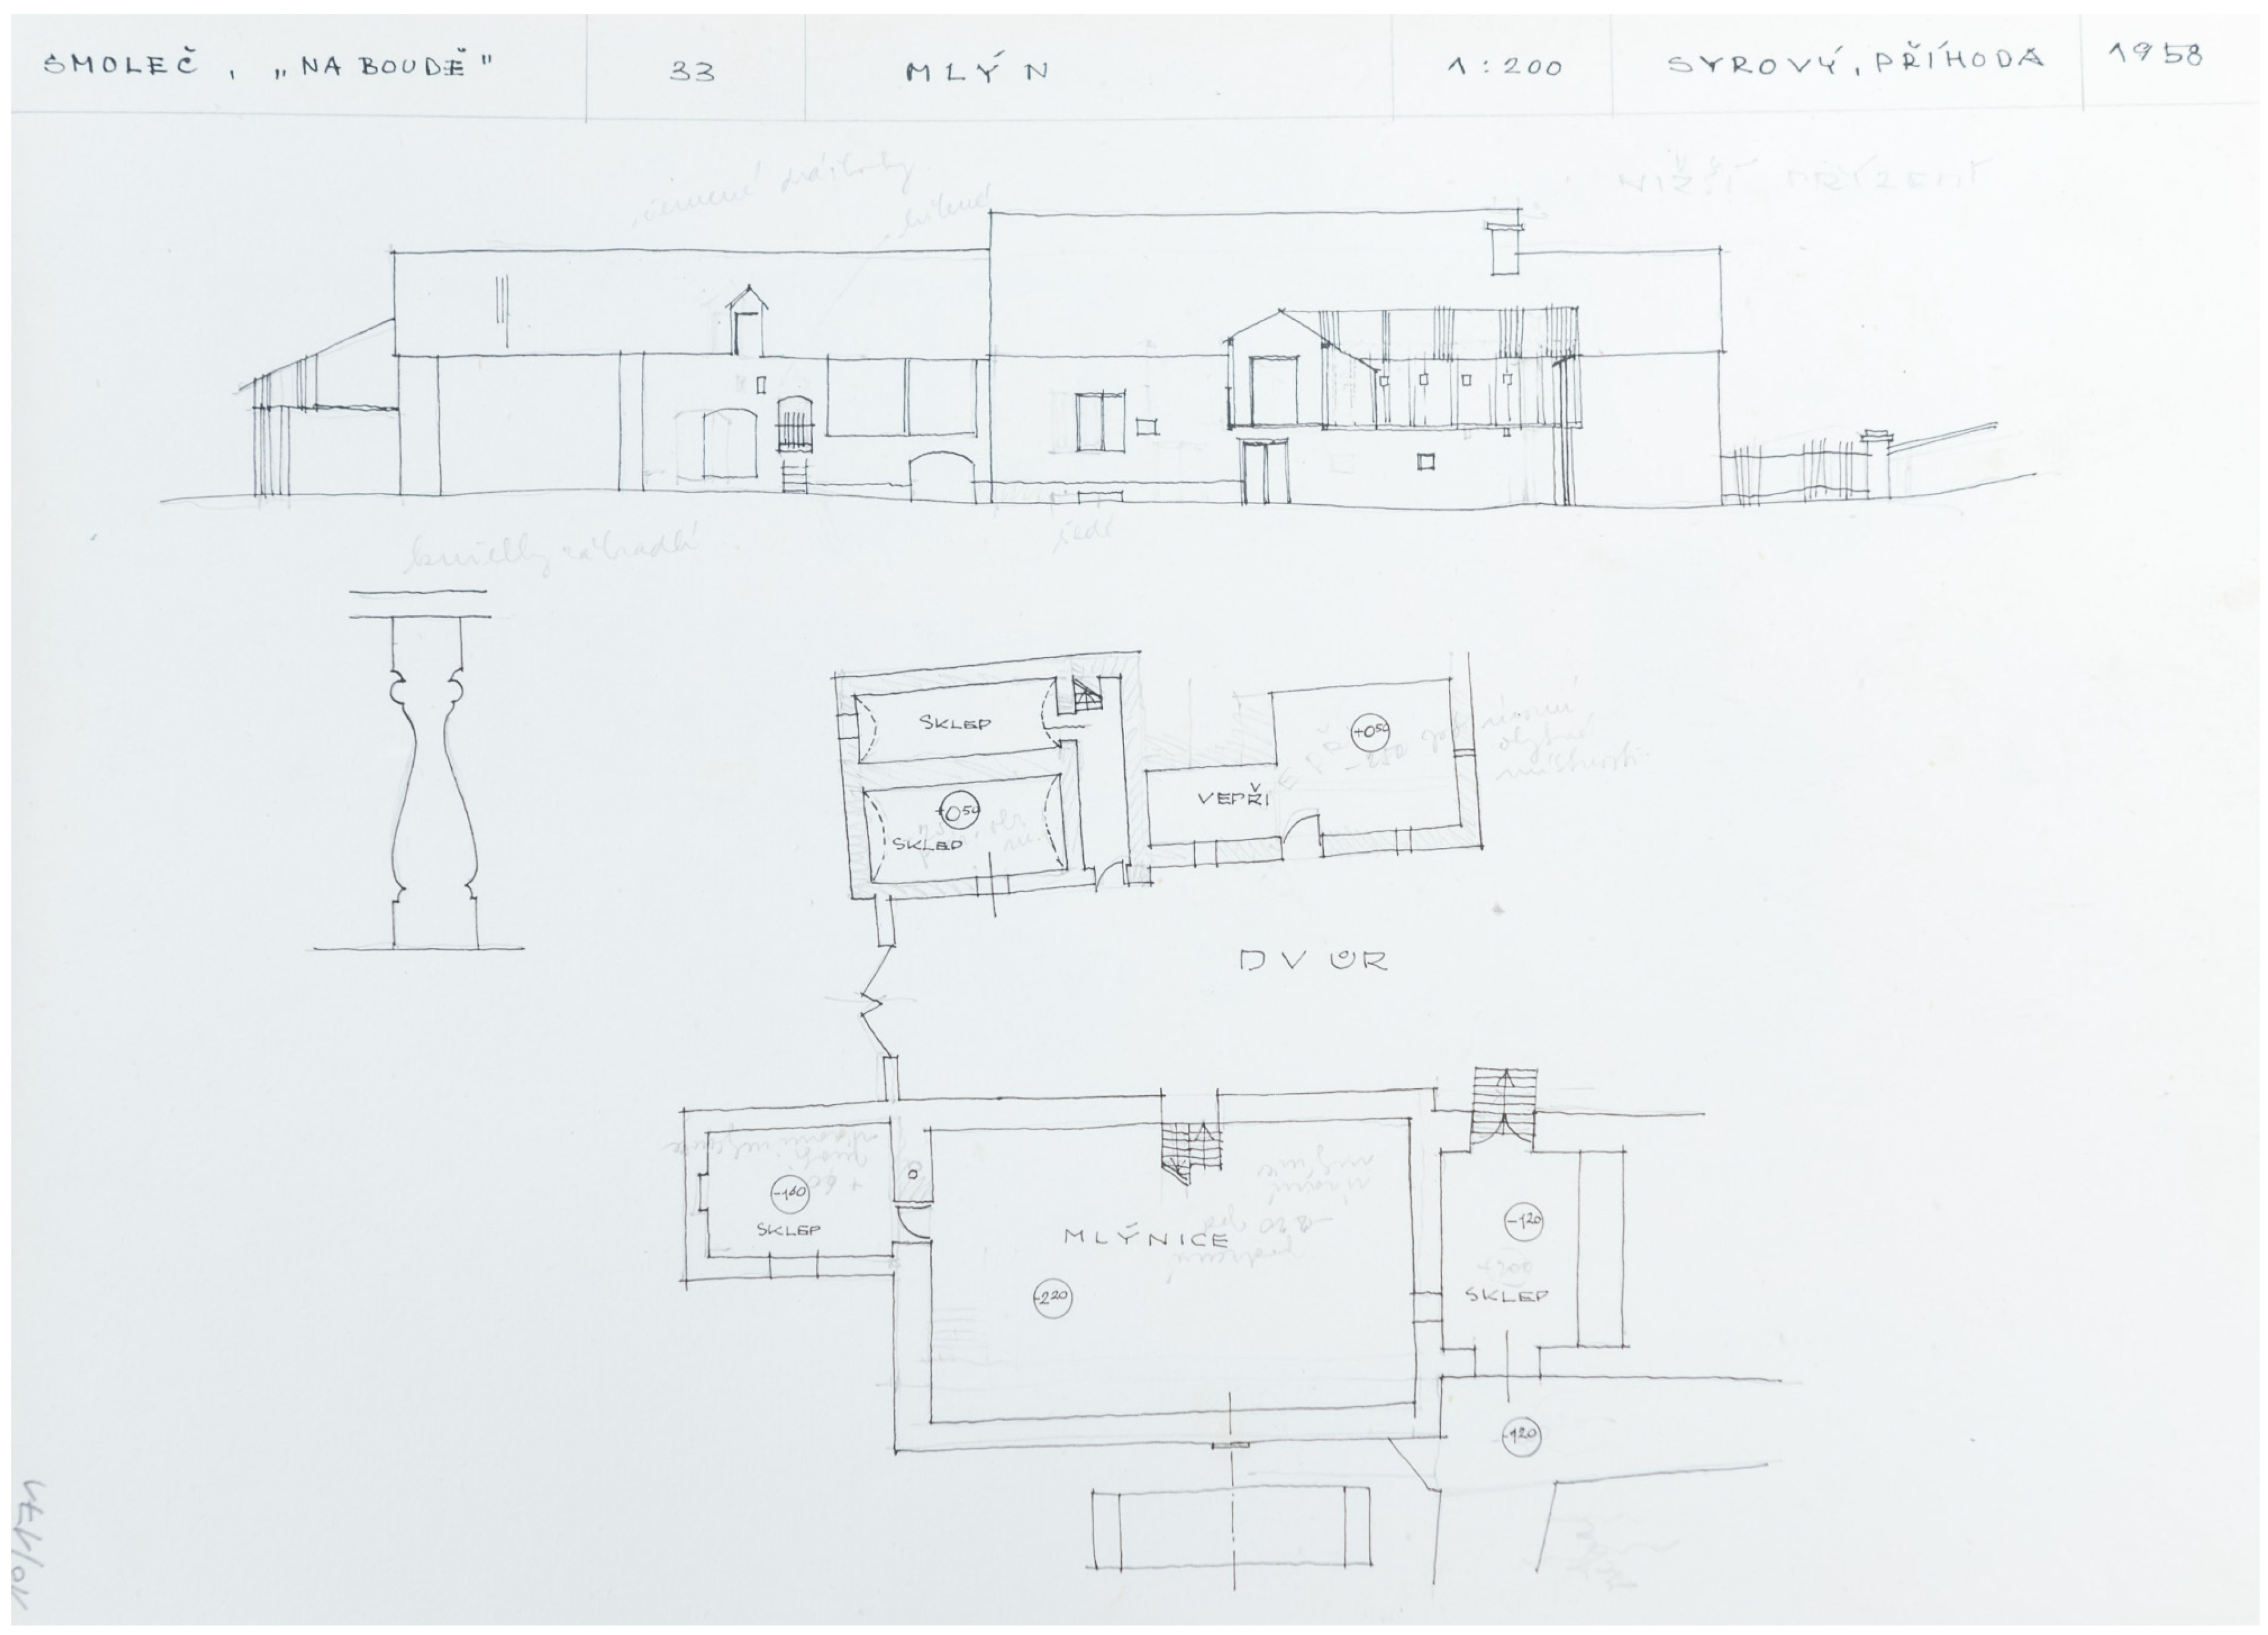
The aim is a 3D visualization of the original landscape and buildings along the entire Vltava River, and thus it is necessary to choose a procedural modeling for the modeling of a huge number of buildings. This allows the generation of approximate models of individual buildings according to specified rules. Although the buildings themselves do not exactly correspond to the original, the overall structure style of the development does. Moreover, it is possible to create models of tens of thousands of buildings. It is essential to define the rules according to which individual buildings are drawn and, subsequently, select suitable textures for the visualization of partial parts of buildings. To determine the rules of common development, we use various sources, for example, the literature concerned with rural development in the nineteenth century [50,51]. A very valuable source is the information, drawings and floor plans of buildings that were created during the rescue survey (Figure 8) carried out by the Institute of Ethnology of the Czech Academy of Sciences before the Orlík Dam had been dammed up. During the survey, all buildings in the area to be flooded were recorded, as well as buildings in the surrounding area. This created a set of data specifying the building style around the river. Due to the fact that a less developed area was involved, a number of buildings have been preserved in a form corresponding to the middle of the nineteenth century. Significant features of buildings were statistically evaluated and rules for building modeling were defined.
Existing buildings can also be modeled using photogrammetric or laser scanning and subsequent processing.
Most of the available photographs show well-known and popular places; postcards and photographs are also described and, therefore, at least the approximate location (the nearest village, a significant landscape point) is known. The localization of some photographs, which were taken in little-known and less photographed places and are not described proved to be a problem. These photographs are often the only depiction of the landscape in an individual locality. A careful and laborious comparison of photography, landscape morphology, and old maps will allow at least an approximate localization of the photo. All photographs, as well as map plans from various sources, are provided with a watermark of its owner or administrator or the ‘Vltava’ project logo for licensing reasons. Obviously, there are tens of thousands of photographs that could be included in the application. At the moment, we have processed over 1400 photographs, which will be supplemented by others in the coming years.
The database of objects of hydrotechnic, economic, transportation, sacral or touristic character contains over 1200 entries at the moment. As the archival research is still in progress, information and related documents to these objects will be improved. Additionally, the number of entries might slightly increase.
The 2D map application uses and displays most of the data mentioned above. The basic map layers consist of maps of the Stable Cadastre from 1843, SMO5 from 1953 and their vector models. For an easy land-use comparison, a layer from the present RUIAN data is available. An equally important layer is the historical orthophoto from the 1950s and the current orthophoto as well. For a broader view of the region, the layers of three military surveys are attached as well. Manuscript river maps also provide an interesting view of the river, the riverbed and its transformations. Situation and floor plans of important buildings are added as another layer, or they are tied to the important object points.
In addition to common map tools, the map application itself is extended using ArcGIS API for JavaScript with more advanced functions. It allows filtering the content of point layers according to the type of object, comparing different map layers using user transparency settings, dividing the map window into two parts with different maps and using the swipe tool (Figure 9). The visualization of data and other image materials is solved with regard to user-friendly accessibility. This, as well as the entire map application, can be tested, evaluated and modified. Another goal is to connect the 2D and 3D content within one application, which will allow a more comprehensive view of the site and a closer understanding of all the context and changes in the transformed landscape.
The 3D view of the Vltava Valley is intended for presentation to the general public, and thus different ways of presenting the data were chosen:
- presentation videos and scenes that use photorealistic textures;
- user-friendly 3D application based on procedural landscape modeling;
- physical models of areas flooded by the 3 largest reservoirs.
Detailed models of important objects rendered using Lumion 3D rendering software are visualized separately with the immediate surroundings using video animation or images. A great advantage here is the use of a library with a great number of natural and artificial surfaces and objects. Cloud movements, various daylighting, the nature of the weather and visibility, as well as movements of trees and grass when wind is blowing, are applied here. Thanks to this, there are impressive scenes that can bring inexperienced users a feeling of the modeled landscape.
Procedural modeling of landscape is used for 3D web map application. Here we use the Esri City Engine product, which allows us to present a full-fledged 3D model in the web environment, of course, with the limitations of the web environment. For example, an application must be loaded into memory at startup. This means a delay of a few seconds before viewing the landscape. Texture handling also has a big impact on the size and speed of the entire application. It is possible to use rather colored surfaces with simple effects (water ripples), but it is not possible to achieve photorealistic fidelity as in the case of Lumion 3D software. As for the detail of individual objects, it is given by the rules for their generation. For buildings, for example, it is possible to set rules for the representation of roof types, building heights, textures of their facades, etc. When modeling, it is possible to set a degree of uncertainty with which the objects are modeled. Then, based on the rules, the buildings are created as 3D objects with the appropriate textures. There are more than 20,000 buildings generated in our scene. Other elements of the landscape are visualized using colorful textures of land use. Only some important objects (castles, chateaux, churches) are inserted in the form of a detailed model created in Trimble SketchUp.
The planned output also includes three large-format physical models of the landscape around large reservoirs, popular with tourists, aimed to present the extinct landscape in local places (regional museum, information center). The models have a scale of 1:6000 (or 1:8000, respectively), consisting of several parts and show an area of six by twenty four km (or ten by thirty-two km, respectively). Analogically to the virtual model, heights are 2.5 times exaggerated. Due to their dimensions, the models are divided into parts. The terrain is milled from permanent hardened polystyrene. In critical areas (river bank, urban area), it can be modeled by hand. The original method of the translation of the topographic content to the model by applying and adhering the surface texture printed on the elastic foil proved to be non-functional due to the high fragmentation and altitude differences of the terrain. For this reason, a more laborious method of manually redrawing the surface according to the image projected on the model was chosen. Detailed areas in the urban part of municipalities are solved by a sticker with a printed texture. The original river surface is shown in deep blue. The new water level of dam reservoirs is represented by a lightly tinted transparent modeling material, so that the flooded terrain underneath remains visible. The mass is self-leveling, and during pouring, it is necessary to proceed very carefully and within the limits of a truly flooded valley. Significant objects and localities can be easily identified on the large models using interactively controlled diodes. The models are currently in production.
4. Discussion
In the article, we presented our vision of a comprehensive information system of the historic landscape, specifically the Vltava River valley. Commonly presented information systems serve mainly to promote tourism [6]. In our work, we try to comprehensively process various materials so that they can be used not only by the public, but also by other experts (geographers, historians). It turns out that there are not too many information systems focused on historical river flows. It is possible to find more applications focused on databases of specific objects [8]. We focused not only on hydrotechnic objects, but also on other important objects of economic and social importance, for which we make resources and information available for further research. Our work is based on the concept of HGIS not only in classical 2D, but also in 3D [3]. We can state that the approach in which the position of the object is the basic identifier is still not a standard. In contrast to our approach, it is more often possible to find the classic approach of an information system based on a table-oriented database, where maps and locations are only additional data with links to external map applications. We consider our method more synoptic and approachable. Various materials, while geolocated, can be presented together in the map application giving a deep view into archival and current material for the particular location (area) or period. Metadata and attributes of these materials are still table-oriented. Therefore, the searching and filtering in data is easy to contrive. The processing and geolocation of archival material can be undertaken by cooperating experts in proper fields. Our approach is complex and thereby very time-consuming.
The georeferencing of maps and geolocation of photographs, our main workflow, is limited to raster data and 2D applications [14]. It is possible to observe problematic georeferencing of riverine maps, where only the close vicinity of the watercourse is depicted. For this reason, in our approach, we combine global transformation methods and local methods based on interpolation algorithms. Our approach to georeferencing military survey maps and Stable Cadastre, where we use a joint adjustment of map sheets with robust IRLS method, is quite unique as well. Of course, it is necessary to distinguish between the achieved accuracy of georeferencing and the accuracy of used old maps. The resulting mean transformation error gives us information about the estimated accuracy. This information should be kept in mind when further interpreting the information displayed on the maps. Therefore, the oldest maps with higher errors are used only in the raster form and are not suitable for vectorising data for further geographical analysis.
The processing and localization of old photographs is used in a number of projects [16]. Unlike them, we try to capture the probable place of taking a photograph on the map, rather than the place of interest in the photograph, and thus enable a more illustrative approach. The photographs are not available in the form of a classic web gallery, but they are available directly at the places in the GIS where the objects of interest are located. The link to external sources of information is then possible thanks to the unambiguous position of the object. Using old maps, their data model, important objects, building plans and photographs, we try to restore the valuable extinct landscape and present it to the public in a 2D map application and in a 3D environment.
When processing 3D scenes, we try not only for classical modeling of 3D objects [29]; we are focused rather on a procedural approach [34]. This makes it possible to create large-scale models in the order of tens of kilometers, even with buildings. Compared to single monument online visualization a web scene with thousands of buildings using photorealistic textures of objects and surfaces seems to be slightly problematic, so far [52]. It will be important to focus on the generalization and the use of different levels of detail (LOD) [53]. For visualization, we will try to work with photorealistic scenes [33]. The disadvantage of this procedure is the creation of only fly-through videos and the inability of the user to browse the entire model. Browsing in our model is enabled not only by 3D applications, but also by the intended VR application, as is the trend today [37].
The 2D web map application, 3D scene and thus the entire information system aims to summarize, synthesize, publish and attractively visualize a wide range of information, old maps, photographs, archival documents and research results in one place. The focus of the information system is very wide, and the main common denominator is the Vltava River.
The project itself is in its middle phase. Used methods seem to be working well for our needs. The majority of important data have already been processed. Databases of objects and photographs are sufficiently filled by hundreds of entries. Moreover, archival research is still in progress, and there will be more photographs or additional data to process; even any forgotten river map might be discovered. In the future, we will focus on the analysis of land use, the addition of more maps, the refilling of data entries of individual objects, the development and evaluation of map applications and, last but not least, on the methods of 3D visualization and use of VR.
There exist some other projects focused on the virtual reconstruction of the landscape [26,33]. Their approach is usually slightly different. They are creating 2D or 3D virtual environments for landscape reconstruction, especially for visualization purposes. We are using maps as a medium for other material connections. We would like to utilize maps as a center point of the information system. This is the uniqueness of the project.
5. Conclusions
As written above, the Vltava River is an important river for many reasons, outlined above. The motivation for our project was the missing complex information system about the history of the river. There are many visual materials such as maps, plans and photographs that are not processed nor used within combined information systems. The idea of our work was to digitize and process the most interesting items and bring them together into the digital environment. Providing easier access to the information in the future was our main driving force.
Our work documents the processing of various map, and photographic and descriptive materials, which are the basis for the future information system about the historic valley of the Vltava River. The aim was to present particular data components and the methodology of their processing so that they can be used for the information system. The system is based on the spatial determination of all available data, or their link to a spatial point object. Map as well as image data are processed on the Esri platform. In addition to the classical methods of georeferencing, more complex methods were used, especially the polynomial transformation with the conditions of the linkup of map sheets, supplemented by the robust IRLS statistical method. The proposed work procedure was used to vectorize the hypsography, which leads to a high-quality vector model of contour lines.
In addition to data processing methods, the text also provides an overview of the possibilities for visualizing the historic landscape. It is obvious that traditional 2D applications must be the basis of the whole system. It is appropriate to complement this application with a 3D visualization, as a virtual historical landscape. It can be viewed either in a web browser or as a VR application. If there is a suitable exhibition space, physical models created by 3D printing or architectural modeling methods can be used.
It is very important to supplement the information system with localized photographs of the historic landscape. The photos suitably complement the maps and map outputs, which are not intuitive for every user. Maps and photographs are suitably complemented by plans of important buildings, text documents and links to external sources.
The comprehensive information system revives the extinct historical Vltava landscape, presents valuable old maps and photographs and enables their mutual comparison. The database of important objects is a detailed list of cultural, hydrotechnic, technical and economic objects. Each record contains position information, basic descriptive information and other additional data.
The aim of the application is to bring closer the historical landscape, which has largely disappeared as a result of the construction of a cascade of a total of nine dams. Our approach is very interdisciplinary. We try to connect humanities (history, archiving) with a technical approach (georeferencing of maps, web map applications, 3D modeling). We think that our system will increase awareness of the entire area under study, and that it will serve as an entry point for research into the extinct surroundings of the Vltava River.
We see the novelty of our approaches mainly in complex methods of georeferencing old maps, in the method of using reference points of photographs, in the use of procedural modeling of the historical landscape for its visualization in 3D, and in plans to use VR as an access point for a virtual walk through the landscape. The scope of our work is very wide, so the text is a selection of descriptions of the methods and techniques used and an overview of some specific implementations.
Author Contributions
Conceptualization, Jiří Krejčí and Jiří Cajthaml; methodology, Jiří Krejčí and Jiří Cajthaml; software, Jiří Krejčí; writing—original draft preparation, Jiří Krejčí and Jiří Cajthaml; writing—review and editing, Jiří Krejčí and Jiří Cajthaml; visualization, Jiří Cajthaml; project administration, Jiří Cajthaml. All authors have read and agreed to the published version of the manuscript.
Funding
This work was supported by the Grant Agency of the Czech Technical University in Prague, grant SGS22 “Modern cartographic methods for processing, analysis, visualization and presentation of spatial data in 2D and 3D”.
Institutional Review Board Statement
Not applicable.
Informed Consent Statement
Not applicable.
Data Availability Statement
Not applicable.
Conflicts of Interest
The authors declare no conflict of interest.
References
- Gregory, I.N.; Geddes, A. Toward Spatial Humanities: Historical GIS and Spatial History; Indiana University Press: Bloomington, IN, USA, 2014. [Google Scholar]
- Trpáková, I. The use of historical sources and their ecological interpretation in the course of almost two centuries—A literature review. J. Landsc. Stud. 2009, 3, 97–119. [Google Scholar]
- Gregory, I.N.; Healey, R.G. Historical GIS: Structuring, mapping and analysing geographies of the past. Prog. Hum. Geogr. 2007, 31, 638–653. [Google Scholar] [CrossRef]
- Schlichting, K. Historical GIS: New ways of doing history. Hist. Methods 2008, 41, 191–196. [Google Scholar] [CrossRef]
- Bitelli, G.; Cremonini, S.; Gatta, G. Cartographic Heritage: Toward unconventional methods for quantitative analysis of pre-geodetic maps. J. Cult. Herit. 2014, 15, 183–195. [Google Scholar] [CrossRef]
- Sahahiri, R.; Arrowsmith, C. Mapping The Historical Places: A case study of Promoting Tourism in Jeddah, The Kingdom of Saudi Arabia. J. Aging Humanit. Arts 2019, 6, 1691315. [Google Scholar] [CrossRef]
- Myers, D. Heritage inventories: Promoting effectiveness as a vital tool for sustainable heritage management. J. Cult. Herit. Manag. Sustain. Dev. 2016, 6, 102–112. [Google Scholar] [CrossRef]
- Blanco, A.; Bustamante, I.; Pascual-Aguilar, J.A. Using old cartography for the inventory of a forgotten heritage: The hydraulic heritage of the Community of Madrid. Sci. Total Environ. 2019, 665, 314–328. [Google Scholar] [CrossRef] [PubMed]
- Gatta, G.; Bitelli, G. A HGIS for the study of waterways: The case of Bologna as ancient city of waters. IOP Conf. Ser. Mater. Sci. Eng. 2020, 949. [Google Scholar] [CrossRef]
- Schmutz, S.; Sendzimir, J. (Eds.) Riverine Ecosystem Management: Science for Governing Towards a Sustainable Future; Springer: Cham, Switzerland, 2018. [Google Scholar]
- Hohensinner, S.; Herrnegger, M.; Blaschke, A.; Habereder, C.; Haidvogl, G.; Hein, T.; Jungwirth, M.; Wei, M. Type-specific reference conditions of fluvial landscapes: A search in the past by 3D-reconstruction. Catena 2008, 75, 200–215. [Google Scholar] [CrossRef]
- Ranzi, R.; Rebuschi, M.; Gentilin, F.; Balistrocchi, M. Geomorphological changes of the Adige river from the Claricini map (1847) and the impact on flood routing. In Proceedings of the 14th International Workshop on Digital Approaches to Cartographic Heritage, Thessaloniki, Greece, 8–10 May 2019; International Cartographic Association: Bern, Switzerland, 2019; pp. 49–58. [Google Scholar]
- Sánchez, J.; Ruiz, A.C.; Navarro, S.; Martín, A.I. Old Maps of Madrid and Interactive Web Applications by National Geographic Institute of Spain. E-Perimetron 2018, 13, 221–235. [Google Scholar]
- Katchadourian, J.C.; López-Herrera, A.-G.; Ruiz-Rodríguez, A.-Á. Proyecto Histocarto: Aplicación de SIGs (georreferenciación y geolocalización) para mejorar la recuperación de la documentación histórica gráfica. Prof. De La Inf. 2019, 28, 1–17. [Google Scholar] [CrossRef] [Green Version]
- Katchadourian, J.C.; Ruiz-Rodríguez, A.-Á.; Alberich-Pascual, J. P Uses and applications of georeferencing and geolocation in old cartographic and photographic document management. Prof. De La Inf. 2018, 27, 202–212. [Google Scholar] [CrossRef]
- Meyer, J.L.; Youngs, Y. Historical Landscape Change in Yellowstone National Park: Demonstrating the Value of Intensive Field Observation and Repeat Photography. Geogr. Rev. 2018, 108, 387–409. [Google Scholar] [CrossRef]
- Brandolini, F.; Reynard, E.; Pelfini., M. Multi-temporal mapping of the Upper Rhone Valley (Valais, Switzerland): Fluvial landscape changes at the end of the Little Ice Age (18th–19th centuries). J. Maps 2020, 16, 212–221. [Google Scholar] [CrossRef] [Green Version]
- Hanušík, V. Laborec riverine landscape between Brekov and Michalovce from the half of 18th century to the half of 19th century. Geogr. Cassoviensis XI 2017, 1, 5–21. [Google Scholar]
- Pătru-Stupariu, I.; Stupariu, M.-S.; Cuculici, R.; Huzui, A. Understanding landscape change using historical maps. Case study Sinaia, Romania. J. Maps 2011, 7, 206–220. [Google Scholar] [CrossRef]
- Pavelková, R.; Frajer, J.; Havlíček, M.; Netopil, P.; Rozkošný, M.; David, V.; Dzuráková, M.; Šarapatka, B. Historical ponds of the Czech Republic: An example of the interpretation of historic maps. J. Maps 2016, 12 (Suppl. 1), 551–559. [Google Scholar] [CrossRef] [Green Version]
- Skaloš, J.; Engstová, B.; Podrázský, V.; Šantrůčková, M.; Trpáková, I. Long-term changes in forest cover 1780–2007 in central Bohemia, Czech Republic. Eur. J. For. Res. 2012, 131, 871–884. [Google Scholar] [CrossRef]
- Bičík, I.; Himiyama, Y.; Feranec, J.; Štych, P. (Eds.) Land Use, Cover Changes in Selected Regions in the World; International Geographical Union Commission on Land Use and Land Cover Change: Prague, Czech Republic, 2012; Volume VII. [Google Scholar]
- Maio, C.V.; Tenenbaum, D.E.; Brown, C.J.; Mastone, V.T.; Gontz, A.M. Application of geographic information technologies to historical landscape reconstruction and military terrain analysis of an American Revolution Battlefield: Preservation potential of historic lands in urbanized settings, Boston, Massachusetts, USA. J. Cult. Herit. 2013, 14, 317–331. [Google Scholar] [CrossRef]
- da Gomes, P.C.C.; Berdoulay, V.V. Imagens na geografía: Importancia da dimensão visual no pensamento geográfico. Cuad. De Geogr. Rev. Colomb. De Geogr. 2018, 27, 356–371. [Google Scholar] [CrossRef]
- Daniels, S.; Cosgrove, D. Introduction: Iconography and landscape. In The Iconography of Landscape. Essays on the Symbolic Representation, Design and Use of Past Environments; Cosgrove, D., Daniels, S., Eds.; Cambridge University Press: Cambridge, UK, 2008; pp. 1–10. [Google Scholar]
- Pietroni, E.; Forte, M.; Pescarin, S.; Rufa, C. The virtual Reconstruction of Archaeological Landscape: From the Fieldwork to the communication through real time applications. The Digital Narrative Museum of the Appia Antica Park. Virtual Retrosp. 2005, 2, 134–139. [Google Scholar]
- Crang, M.; Crang, P.; May, J. (Eds.) Virtual Geographies. Bodies, Space and Relations; Routledge: London, UK, 1999. [Google Scholar]
- Sun, S.; Meng, Q.; Ma, Y.; and Ren, Z. Application of Virtual Reality Technology in Landscape Design. In Proceedings of the 2021 International Symposium on Artificial Intelligence and Its Application on Media (ISAIAM), Xi’an, China, 21–23 May 2021; pp. 91–95. [Google Scholar] [CrossRef]
- Guidi, G.; Frischer, B.; Lucenti, I. Rome Reborn—Virtualizing the ancient imperial Rome. In Workshop on 3D Virtual Reconstruction and Visualization of Complex Architectures; ISPRS: Zürich, Switzerland, 2007. [Google Scholar]
- De Boer, A. Processing old maps and drawings to create virtual historic landscapes. E-Perimetron 2010, 5, 49–57. [Google Scholar]
- Housarová, E.; Pavelka, K.; Šedina, J. Study of Erbil Al-Qala citadel time changes by comparison of historical and contemporary image data. Eur. J. Remote Sens. 2019, 52 (Suppl. 1), 202–208. [Google Scholar] [CrossRef] [Green Version]
- Guidi, G.; Gonizzi Barsanti, S.; Micoli, L.; Malik, U. Accurate Reconstruction of the Roman Circus in Milan by Georeferencing Heterogeneous Data Sources with GIS. Geosciences 2017, 7, 91. [Google Scholar] [CrossRef] [Green Version]
- Brůha, L.; Laštovička, J.; Palatý, T.; Štefanová, E.; Štych, P. Reconstruction of Lost Cultural Heritage Sites and Landscapes: Context of Ancient Objects in Time and Space. ISPRS Int. J. Geo-Inf. 2020, 9, 604. [Google Scholar] [CrossRef]
- Tobiáš, P.; Cajthaml, J.; Krejčí, J. Rapid reconstruction of historical urban landscape: The surroundings of Czech chateaux and castles. J. Cult. Herit. 2018, 30, 1–9. [Google Scholar] [CrossRef]
- Tobiáš, P. BIM, GIS and semantic models of cultural heritage buildings. Geoinformatics FCE CTU 2016, 15, 27–42. [Google Scholar] [CrossRef] [Green Version]
- Bruno, F.; Bruno, S.; De Sensi, G.; Luchi, M.-L.; Mancuso, S.; Muzzupappa, M. From 3D reconstruction to virtual reality: A complete methodology for digital archaeological exhibition. J. Cult. Herit. 2010, 11, 42–49. [Google Scholar] [CrossRef]
- Dolejš, M.; Raška, P.; Pacina, J. The use of 3D immersive virtual reality for visualization of landscape affected by opencast mining. In 14th SGEM GeoConference on Informatics, Geoinformatics and Remote Sensing; STEF92 Technology Ltd.: Sofia, Bulgaria, 2014; Volume 1, pp. 865–872. [Google Scholar]
- Kuča, K.; Malina, O.; Salašová, A.; Weber, M. Historické Kulturní Krajiny České Republiky; Výzkumný ústav Silva Taroucy pro krajinu a okrasné zahradnictví, v.v.i.: Průhonice, Czech Republic, 2020; (In Czech Republic). [Google Scholar]
- Bičík, I.; Kupková, L.; Jeleček, L.; Kabrda, J.; Štych, P.; Janoušek, Z.; Winklerová, J. Land Use Changes in Czechia 1845–2010. In Land Use Changes in the Czech Republic 1845–2010; Springer: Cham, Switzerland, 2015; pp. 95–170. [Google Scholar] [CrossRef]
- Fialová, D.; Chromý, P.; Marada, M. Historickogeografická analýza změn funkčního využití břehů Vltavy (v období od přelomu 18. a 19. století do současnosti). Hist. Geogr. 2007, 34, 307–317, (In Czech Republic). [Google Scholar]
- Fialová, D. Vltava ve službách člověka. Geogr. Rozhl. 2019, 28, 20–21, (In Czech Republic). [Google Scholar]
- Janata, T.; Krejčí, J. Depiction of Line Features on Folded Maps on Example of Old Maps of the Vltava River. In Proceedings of the International Cartographic Association; Copernicus GmbH: Göttingen, Germany, 2019; Volume 2, ISSN 2570-2092. [Google Scholar]
- Kretschmer, I.; Dörflinger, J.; Wawrick, F. Österreichische Kartographie. Wiener Schiften zur Geographie und Kartographie—Band 15; Institut für Geographie und Regionalforschung der Universität Wien: Wien, Austria, 2004. [Google Scholar]
- Hofstätter, E. Beiträge zur Geschichte der Österreichischen Landesaufnahmen; 1. Teil; Bundesamt für Eich-und Vermessungswesen: Wien, Austria, 1989. [Google Scholar]
- Fundamental Base of Geographic Data of the Czech Republic (ZABAGED). Available online: https://geoportal.cuzk.cz/Default.aspx?lng=EN&mode=TextMeta&metadataID=CZ-CUZK-ZABAGED-VP&side=zabaged (accessed on 15 October 2021).
- Cajthaml, J.; Janata, T. Georeferencing of First Military Mapping survey maps in the area of Bohemia using polynomial method. E-Perimetron 2017, 12, 181–188. [Google Scholar]
- Kratochvílová, D.; Cajthaml, J. Using The Automatic Vectorisation Method In Generating The Vector Altimetry Of The Historical Vltava River Valley. Acta Polytech. 2020, 60, 303–312. [Google Scholar] [CrossRef]
- Zimová, R.; Pešťák, J.; Veverka, B. Historical military mapping of the Czech lands–cartographic analysis. In International Conference on Cartography and GIS; ICA: Borovets, Bulgaria, 2006; pp. 1–7. [Google Scholar]
- Molnár, G.; Timár, G.; Biszak, E. Can the First Military Survey maps of the Habsburg Empire (1763–1790) be georeferenced by an accuracy of 200 meters? In 9th International Workshop on Digital Approaches to Cartographic Heritage; International Cartographic Association: Budapest, Hungary, 2014; pp. 127–132. [Google Scholar]
- Kupková, L.; Bičík, I.; Jeleček, L. At the Crossroads of European Landscape Changes: Major Processes of Landscape Change in Czechia since the Middle of the 19th Century and Their Driving Forces. Land 2021, 10, 34. [Google Scholar] [CrossRef]
- Bürgi, M.; Bieling, C.; von Hackwitz, K.; Kizos, T.; Lieskovský, J.; García Martín, M.; Printsmann, A. Processes and driving forces in changing cultural landscapes across Europe. Landsc. Ecol. 2017, 32, 2097–2112. [Google Scholar] [CrossRef] [Green Version]
- Hejmanowska, B.; Glowienka, B.; Michalowska, K.; Mikrut, S.; Kramarczyk, P.; Opalinski, P.; Twardowski, M.; Guidi, G.; Barsanti, S.G.; Micoli, L.; et al. The Comparison of the Web GIS Applications Relevant for 4D Models Sharing. IOP Conf. Ser. Earth Environ. Sci. 2019, 362, 12158. [Google Scholar] [CrossRef]
- Jedlička, K.; Čada, V.; Fiala, R.; Hájek, P.; Janečka, K.; Ježek, J.; Jan, R.; Strejcová, J.; Vichrová, M. Techniques Used for Optimizing 3D Geovisualization of Terezín Memoria. In Proceedings of the 26th International Cartographic Conference Proceedings, Dresden, Germany, 25–30 August 2013; International Cartographic Association: Bern, Switzerland, 2013. [Google Scholar]
Figure 1.
Depiction of a manuscript river map derived from the Ebert’s map of the Vltava river from eighteenth century, Source: Archive of the Povodí Vltavy, State Enterprise (Prague, Czech Republic).
Figure 1.
Depiction of a manuscript river map derived from the Ebert’s map of the Vltava river from eighteenth century, Source: Archive of the Povodí Vltavy, State Enterprise (Prague, Czech Republic).

Figure 2.
Visualized database of localized photographs and other places, Source: author’s elaboration.
Figure 2.
Visualized database of localized photographs and other places, Source: author’s elaboration.

Figure 3.
Virtual landscape with procedurally modeled built-up areas, Source: author’s elaboration.

Figure 4.
Complete mosaic of the First Military Survey, Source: author’s elaboration.

Figure 5.
Mismatch between modeled and right shoreline, Source: author’s elaboration.

Figure 6.
Visual problems at the borders of cadastral areas, Source: author’s elaboration.

Figure 7.
Parish complex in Červená visualized using Lumion 3D, Source: author’s elaboration.

Figure 8.
Depiction of rescue survey documentation, Source: Masaryk Institute and Archive of the CAS.
Figure 8.
Depiction of rescue survey documentation, Source: Masaryk Institute and Archive of the CAS.

Figure 9.
Map application comparing two map layers with the swipe tool, Source: author’s elaboration.
Figure 9.
Map application comparing two map layers with the swipe tool, Source: author’s elaboration.


Table 1.
Manuscript river maps of the Vltava River, Source: author’s elaboration.
| Map | Origin Date | Approx. Scale | Map Type | Number of Map Sheets |
|---|---|---|---|---|
| Carte Ideale de la Moldau | 1768 | 1:28,800 | Concertina book | 14 |
| Darstellung des Moldauflusses | 1st half of 18th century | 1:48,000 | Book | 20 |
| Untitled | 1840s/1850s | 1:2800 | Single sheets | 94 |
| Situations Plan des Moldau Flußes | unknown | 1:22,000 | Two concertina books | 16 |
| Moldau Charte | 1776 | 1:10,500 | Single sheets | 41 |
Table 2.
Topographic surveys of the Habsburg Monarchy in the research area, Source: author’s elaboration.
Table 2.
Topographic surveys of the Habsburg Monarchy in the research area, Source: author’s elaboration.
| Mapping | Origin Date | Scale | Suitable Transformation | Estimated Accuracy [m] |
|---|---|---|---|---|
| First Military Survey | 1764–1768 | 1:28,800 | polynomial (control points) | 200–300 |
| Second Military Survey | 1842–1852 | 1:28,800 | projective (corner points) | 20–30 |
| Third Military Survey | 1874–1880 | 1:25,000 | projective (corner points) | 20–30 |
Publisher’s Note: MDPI stays neutral with regard to jurisdictional claims in published maps and institutional affiliations. |
© 2022 by the authors. Licensee MDPI, Basel, Switzerland. This article is an open access article distributed under the terms and conditions of the Creative Commons Attribution (CC BY) license (https://creativecommons.org/licenses/by/4.0/).
Share and Cite
MDPI and ACS Style
Krejčí, J.; Cajthaml, J. Historical Vltava River Valley–Various Historical Sources within Web Mapping Environment. ISPRS Int. J. Geo-Inf. 2022, 11, 35. https://0-doi-org.brum.beds.ac.uk/10.3390/ijgi11010035
AMA Style
Krejčí J, Cajthaml J. Historical Vltava River Valley–Various Historical Sources within Web Mapping Environment. ISPRS International Journal of Geo-Information. 2022; 11(1):35. https://0-doi-org.brum.beds.ac.uk/10.3390/ijgi11010035
Chicago/Turabian StyleKrejčí, Jiří, and Jiří Cajthaml. 2022. "Historical Vltava River Valley–Various Historical Sources within Web Mapping Environment" ISPRS International Journal of Geo-Information 11, no. 1: 35. https://0-doi-org.brum.beds.ac.uk/10.3390/ijgi11010035
Note that from the first issue of 2016, this journal uses article numbers instead of page numbers. See further details here.