Article

Geospatial Information Technologies for Mobile Collaborative Geological Mapping: The Italian CARG Project Case Study

by
Christian Natale Gencarelli
*,†,
Debora Voltolina
,
Mohammed Hammouti
,
Marco Zazzeri
and
Simone Sterlacchini
Italian National Research Council (CNR), Institute of Environmental Geology and Geoengineering (IGAG), 20131 Milan, Italy
*
Author to whom correspondence should be addressed.
These authors contributed equally to this work.
ISPRS Int. J. Geo-Inf. 2022, 11(3), 192; https://0-doi-org.brum.beds.ac.uk/10.3390/ijgi11030192
Submission received: 14 January 2022 / Revised: 25 February 2022 / Accepted: 10 March 2022 / Published: 12 March 2022

Abstract

:
A collaborative open-source IT infrastructure is designed and implemented to optimize the process of geological field data collection, integration, validation, and sharing. Firstly, field data collection is carried out by multiple users using free and open-source GIS-based tools for mobile devices according to a predefined database structure; then, data integration is automatically performed in a central server, where the collected geological information is stored and validated; finally, data are shared over the Internet, providing users with up-to-date information. The IT infrastructure is currently being employed to accomplish surveys for the realization of the “Brescia” geological map within the New Geological Map of Italy, scale 1:50,000 (CARG Project). Users are only required to run the field data collection application on their mobile devices, add different geometric features to predefined thematic layers and fill in the dialogue forms with the required information to store the new structured and georeferenced data in the central database. The major advantage of the proposed IT infrastructure consists of guaranteeing the operational continuity between field surveys and the finalization of geological or geothematic maps leveraging field data collection tools that are operational both online and offline to ensure the overall system resilience.

1. Introduction

Geological maps are, among others, strategic tools for territorial planning and sustainable environmental management. At the same time, thematic maps represent the evolution and deepening of the geological maps in specific fields of application (geomorphology, engineering geology, hydrogeology, geophysics, etc.) and are aimed at providing further essential information for an interdisciplinary perspective with different scopes of research and applications, such as natural hazard and risk analysis, environmental impact assessment, groundwater vulnerability, etc. The transition from traditional to digital technology-based approaches in geological and geothematic mapping has now been made possible by increasingly accessible and user-friendly devices and applications, and their use is no longer just an option but a requirement.
In Italy, the CARG (geological cartography) Project started in 1988 with the aim of improving the existing national geological map of Italy (at a scale of 1:100,000) and is currently carried out by ISPRA (Istituto Superiore Protezione Ricerca Ambientale—Institute for Environmental Protection and Research) in partnership with regional governmental agencies as well as research institutes and universities. At the end, the CARG project will provide 636 new geological and geothematic georeferenced maps, at a scale of 1:50,000, covering the entire national territory. Although the CARG project started in 1988 with a traditional approach to geological mapping, in the following years, a digital database, composed of different themes and tables, has been designed and implemented. The advantage offered by the CARG project relies on its capability to gather nation-wide geologic information essential to implement planning, prevention, and management actions for mitigating hydraulic and hydrogeological risk [1,2]. However, as far as the authors know, no conceptual models have yet been proposed for the implementation of collaborative tools for digital mapping applied to the geological field data collection and sharing within the context of the CARG project.
The central role of geographic information systems (GIS) in the creation of geospatial databases is an undeniable fact [3,4,5]. GIS applications flourished in the 1980s when the first commercial GIS packages were released, such as ARC/INFO developed by the Environmental System Research Institute (ESRI), and then GRASS (geographic resources analysis support system), the first free and open-source software (FOSS) for GIS, was made available [6]. The emergence of web and mobile technologies inherently fueled the development of collaborative web mapping and volunteered geographic information (VGI). Moreover, web and mobile GIS applications and technologies are increasingly being employed by the scientific community to collect and edit data directly in the field as well as geocode and upload media and text in real time to populate shared databases on the web [3,4,7,8,9,10,11,12]. Crucial for these purposes is the availability of recent mobile devices (tablets and smartphones) with adequate hardware and software capabilities to support the operation of GIS-based applications for field data collection. The recent models include many sensors (e.g., cameras, magnetometer, accelerometer, gyroscope, clinometer, and GPS) and therefore can be used as an efficient tool for geological surveys in the field offering substantial enhancements for collecting more accurate data [13,14].
The aim of this study is to present an information technology (IT) infrastructure based on open-source geospatial technologies, which is designed to support the CARG project by enabling collaborative data collection, editing, validation, integration, and sharing. Specifically, this infrastructure strives for improving temporal continuity among different processes ranging from field surveys and database population, to data interpretation and validation, and geological and geothematic map finalization. After a brief introduction to the free and open source software exploited in this study, the manuscript provides an overview of the two major components of the IT infrastructure and describes an application case study. The IT infrastructure is meant to support field data collection as follows. Firstly, the database structure is defined and implemented in a GIS environment to be packaged and deployed to multiple mobile devices (MDs). By collecting data during field surveys, geologists (hereafter users) populate their local databases whose structure fully complies with the guidelines and requirements of the CARG project. After that, local projects and data are asynchronously exchanged with a central server, which gathers and integrates geological information to build up a shared knowledge, which is then made available to visualize the project progress. Finally, shared information is ready to be processed by the GIS analysts to finalize and publish the geological map.

2. Materials and Methods

Free and open-source software and tools, namely QGIS, QField, QFieldSync plugin for QGIS, and Syncthing, are exploited and integrated to build the IT infrastructure, without substantial modifications or changes to their original functioning. Specifically, the professional GIS desktop application QGIS, version 3.16 Hannover [15] is used to define the initial database structure according to the specific CARG project guidelines. The free and open source GIS application QField, version 1.9.0 Taivaskero [16], together with the QFieldSync plugin for QGIS, is employed to enable a structured and georeferenced field data collection through MDs. Developed by opengis.ch and released under the GNU Public License (GPL) Version 2 or above, QField and QFieldSync are increasingly being adopted in recent years for field data collection within different fields of application [17,18,19,20]. Among the wide variety of recently developed FOSS solutions for field data collection, QField is chosen due to its high compatibility with QGIS. Indeed, QField is “built on top of the professional QGIS open-source project, allowing users to set-up maps and forms in QGIS on their workstation” [16]. Those maps and forms will be deployed in the field through the QFieldSync plugin for QGIS, which is specifically designed to package QGIS projects to make them readable by QField. Packaged projects are finally distributed to multiple devices to permit a collaborative mapping by means of Syncthing, version 1.18.5 [21], an open-source file synchronization program which allows a continuous and secured data exchange between two or more devices identified and authorized by means of cryptographic certificates [22]. The innovative component of the framework concerns the development of a data exchange and storage (DES) module, developed in Python, version 3.6, which automates the interactions amongst the mentioned open-source software and tools. The DES module is the core of the IT infrastructure, allowing for collaborative data collection by multiple users, and its functioning is detailed in Section 3.3.

3. Results and Discussion

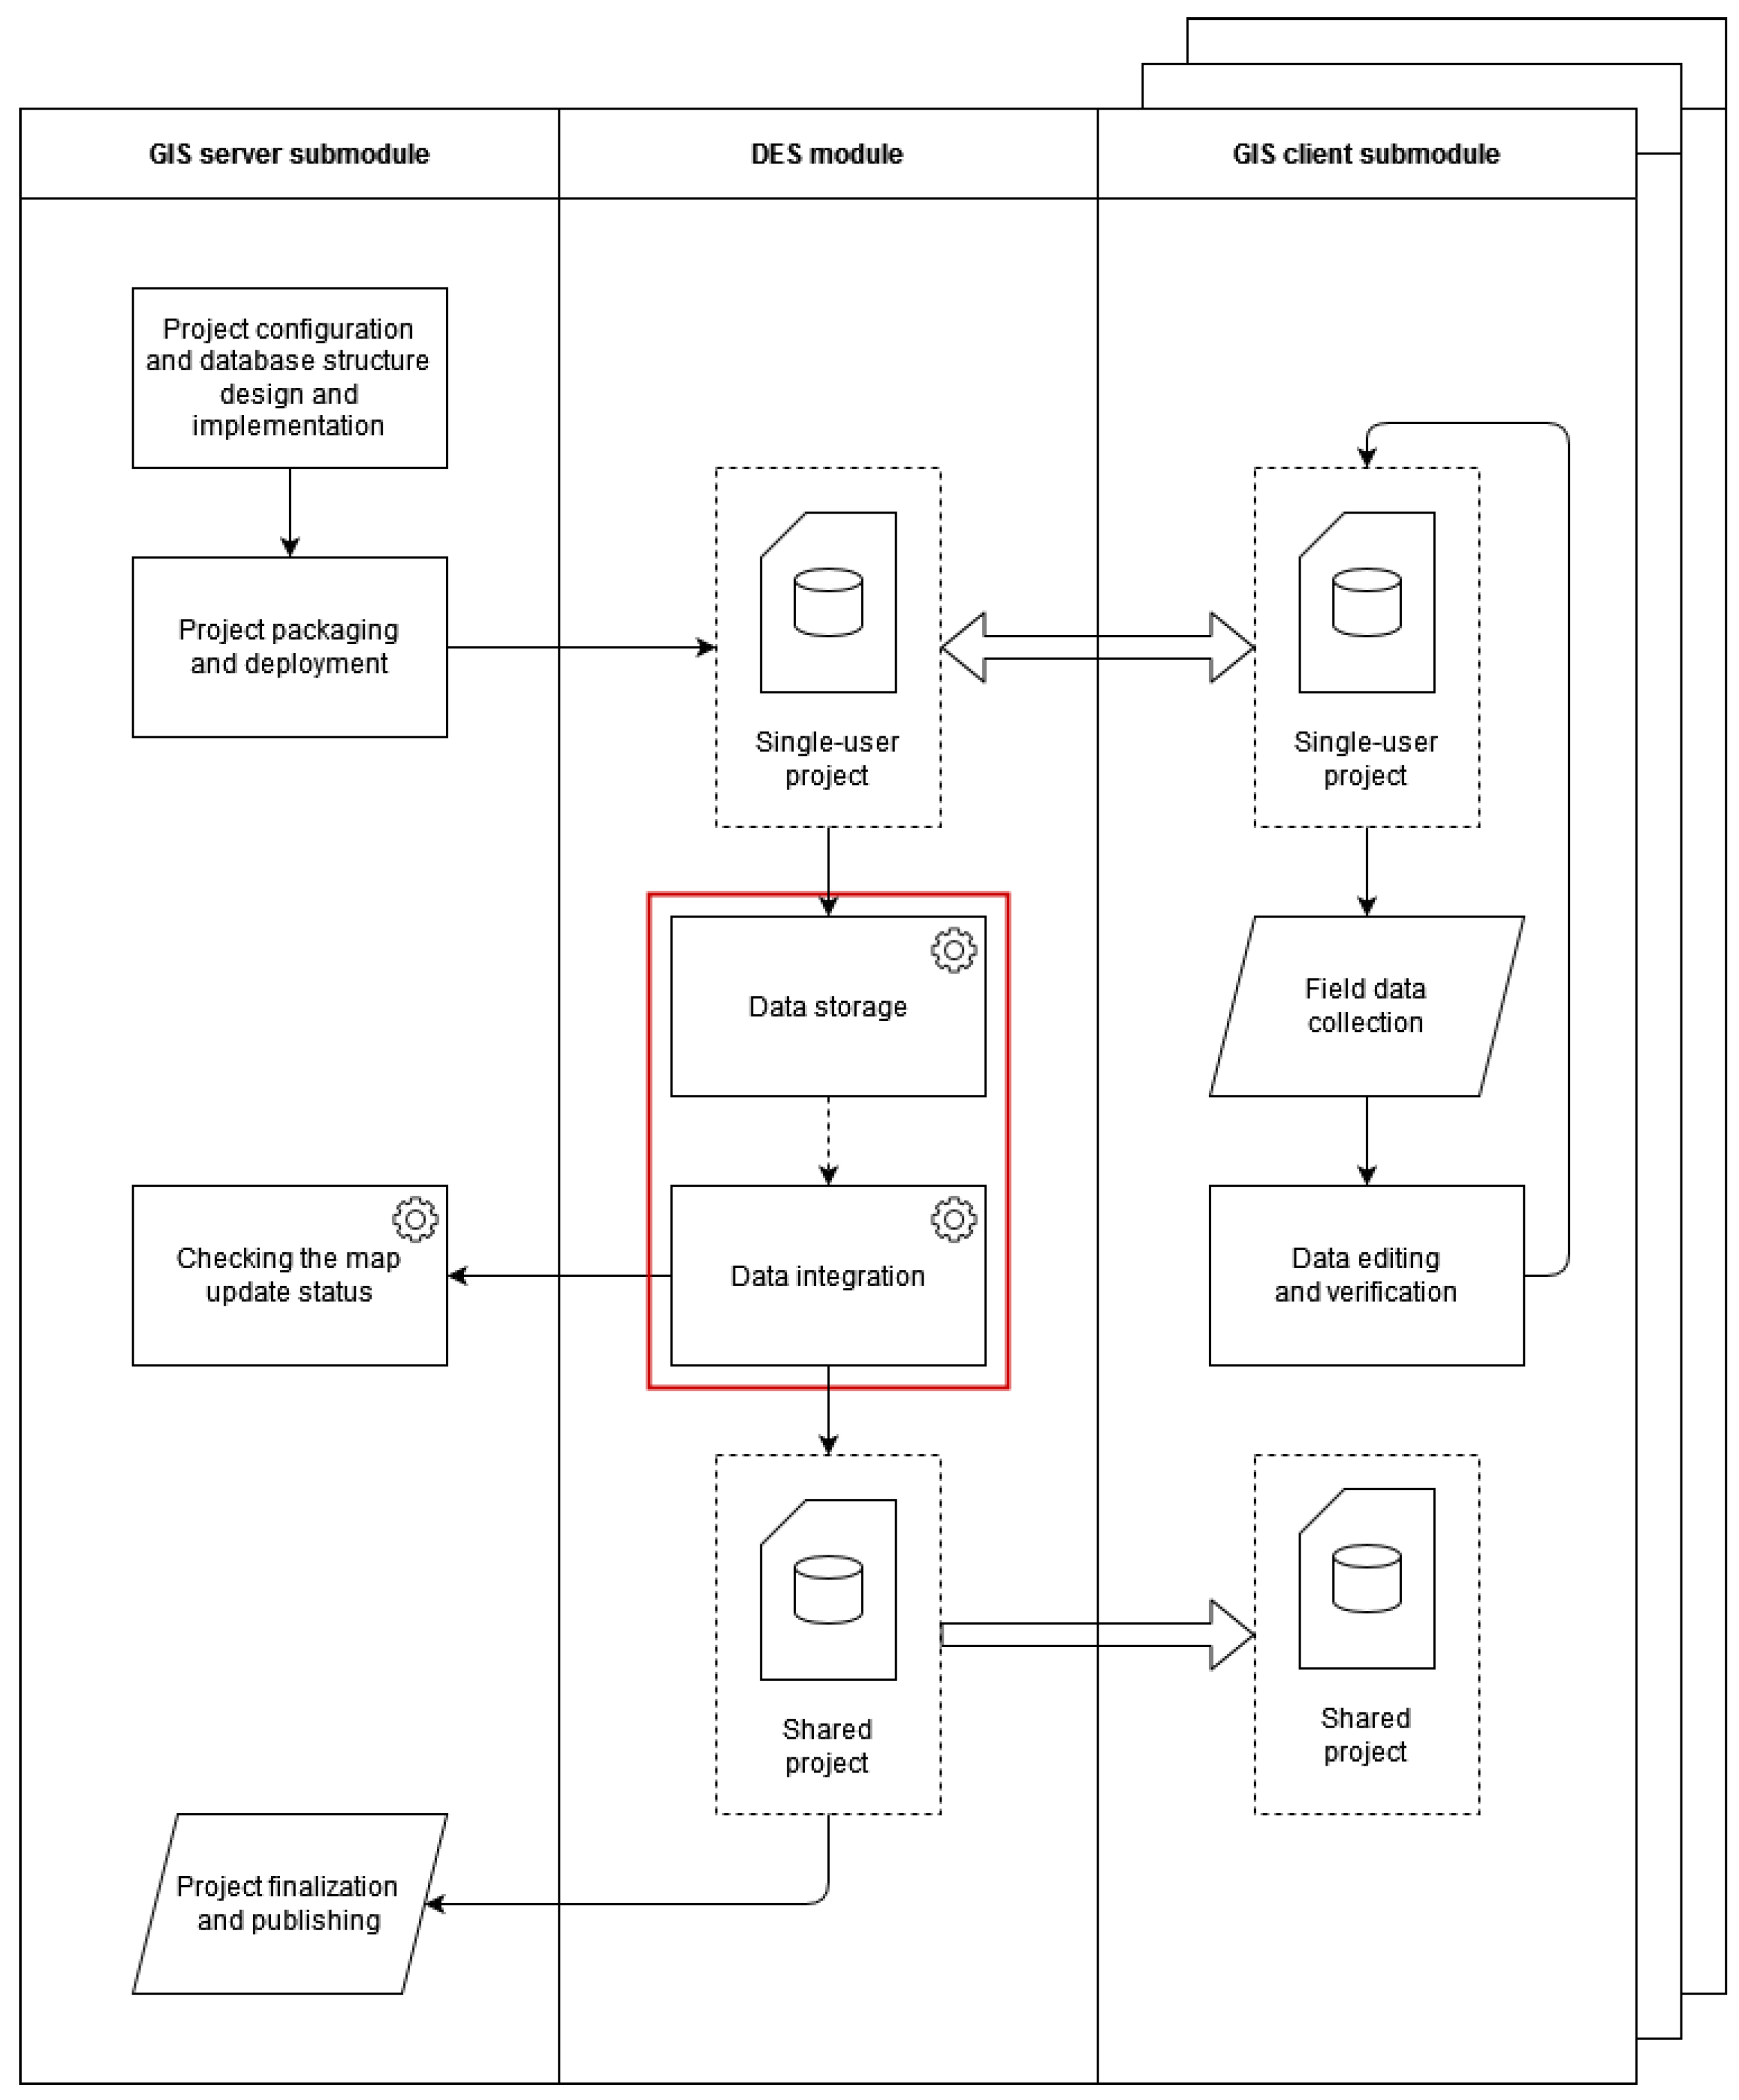
3.1. The Infrastructure Overview

The IT infrastructure relies on the use of a variable number of MDs for data collection and a central server that communicates with them via the internet. Figure 1 summarizes this infrastructure, where multiple users are provided with MDs (tablets or smartphones) equipped with QField, the GIS-based application for field data collection, while the central server stores and manages all the data collected by multiple users, integrating them in a common QGIS project through two modules:
  • A GIS module is composed of a GIS server submodule, which enables the design and implementation of a database structure, including predefined constraints useful to a preliminary check of the data inconsistency, and a GIS client submodule, which allows multiple users to carry out the field data collection.
  • A DES module guarantees synchronization between the central database (hosted on the central server) and the local databases (hosted on the MDs) without any user intervention.
The modules are described in detail in Section 3.2 and Section 3.3.

3.2. GIS Module: Project Settings and Data Collection

The GIS module provides the users deployed in the field with a useful tool for easily collecting and storing digital data in a predefined database structure. It includes two submodules, the GIS server submodule, hosted on the central server, and the GIS client submodule, hosted on each MD involved in the IT infrastructure.
The GIS server submodule deals with the definition of (i) the structure of the database, which is populated during field surveys and (ii) the specific constraints to check the data consistency. The database structure is defined in QGIS leveraging the GeoPackage encoding standard as well as the built-in attributes forming widgets, which allow the storing of newly digitized data attributes by means of high-usability dialog forms. The design of the database structure acknowledges the CARG requirements, as described in [23], prearranging only required layers, defining their geometric, geographic, topological, and descriptive components, and presetting attribute domains for each single field. Constraints are also integrated in the dialog forms to enable a preliminary validity check to improve the database consistency [24].
The project integrates multiple alternative basemaps, ranging from OpenStreetMap® (OSM, [25]) to national and regional topographic maps (CTR, Carte Tecniche Regionali). Besides the structured database, the QGIS project (hosted on the GIS server submodule) was designed to provide users with auxiliary information, including orthophotos, digital elevation models (DEM), existing geological maps or other thematic maps that may be useful during field surveys, as long as size optimization is performed. Finally, symbols for each geological feature are designed according to [24] and embedded in the QGIS project, so that once a geometric feature is mapped and its attributes are stored, the corresponding symbol is automatically displayed in the view.
The GIS client submodule is intended to enable users involved in geological field surveys to (i) collect in situ geological information by means of MDs and (ii) share data with both colleagues in the field and project stakeholders. Once the database structure is defined, the QGIS project is transferred to each MD deployed in the field to enable the users to populate their local database with the prearranged dialog forms and expression constraints. Then, the submodule is predefined to allow users to promptly verify the correctness of the collected data and eventually edit them. Finally, verified information is sent to the central server in order to be stored and integrated into a common project database before being shared with all the other users involved in the field surveys.

3.3. Data Exchange and Storage (DES) Module

The DES module is designed and implemented in order to automate the process of information exchange, storage, and integration. This module makes use of QGIS, QFieldSync, Syncthing, and a customized algorithm developed in Python to (i) exchange data between the GIS server and the GIS client submodules, and (ii) store and integrate data collected by multiple users to produce and distribute an updated shared geological map. Figure 1 (central panel) illustrates the flowchart of the DES module. The DES module, hosted on the central server, integrates functions from both the QFieldSync plugin for QGIS and Syncthing to automatically exchange the collected data and the newly generated shared information. The bi-directional data synchronization and sharing between the server and all the MDs deployed in the field always require an Internet connection, whilst the data collection can be performed offline and shared with the central server afterwards. Finally, at the end of the synchronization process, each MD is provided with (i) a single-user GIS project, which the user can modify by adding new geometric features (points, lines and polygons) and related attributes and editing the previously collected ones, and (ii) a multi-user shared GIS project where each user can visualize (but not edit) data collected by all the other users working in the same or in adjacent survey areas.
The DES module plays a central role in the IT infrastructure, which allows any user to monitor the status of fieldworks in each survey area and to track work progress easily. Particularly, the main steps carried out by this module are generally described as follows:
  • The data collected by multiple users and stored in their single user GIS projects are synchronized with the central server several times a day (when an internet connection is available) through Syncthing;
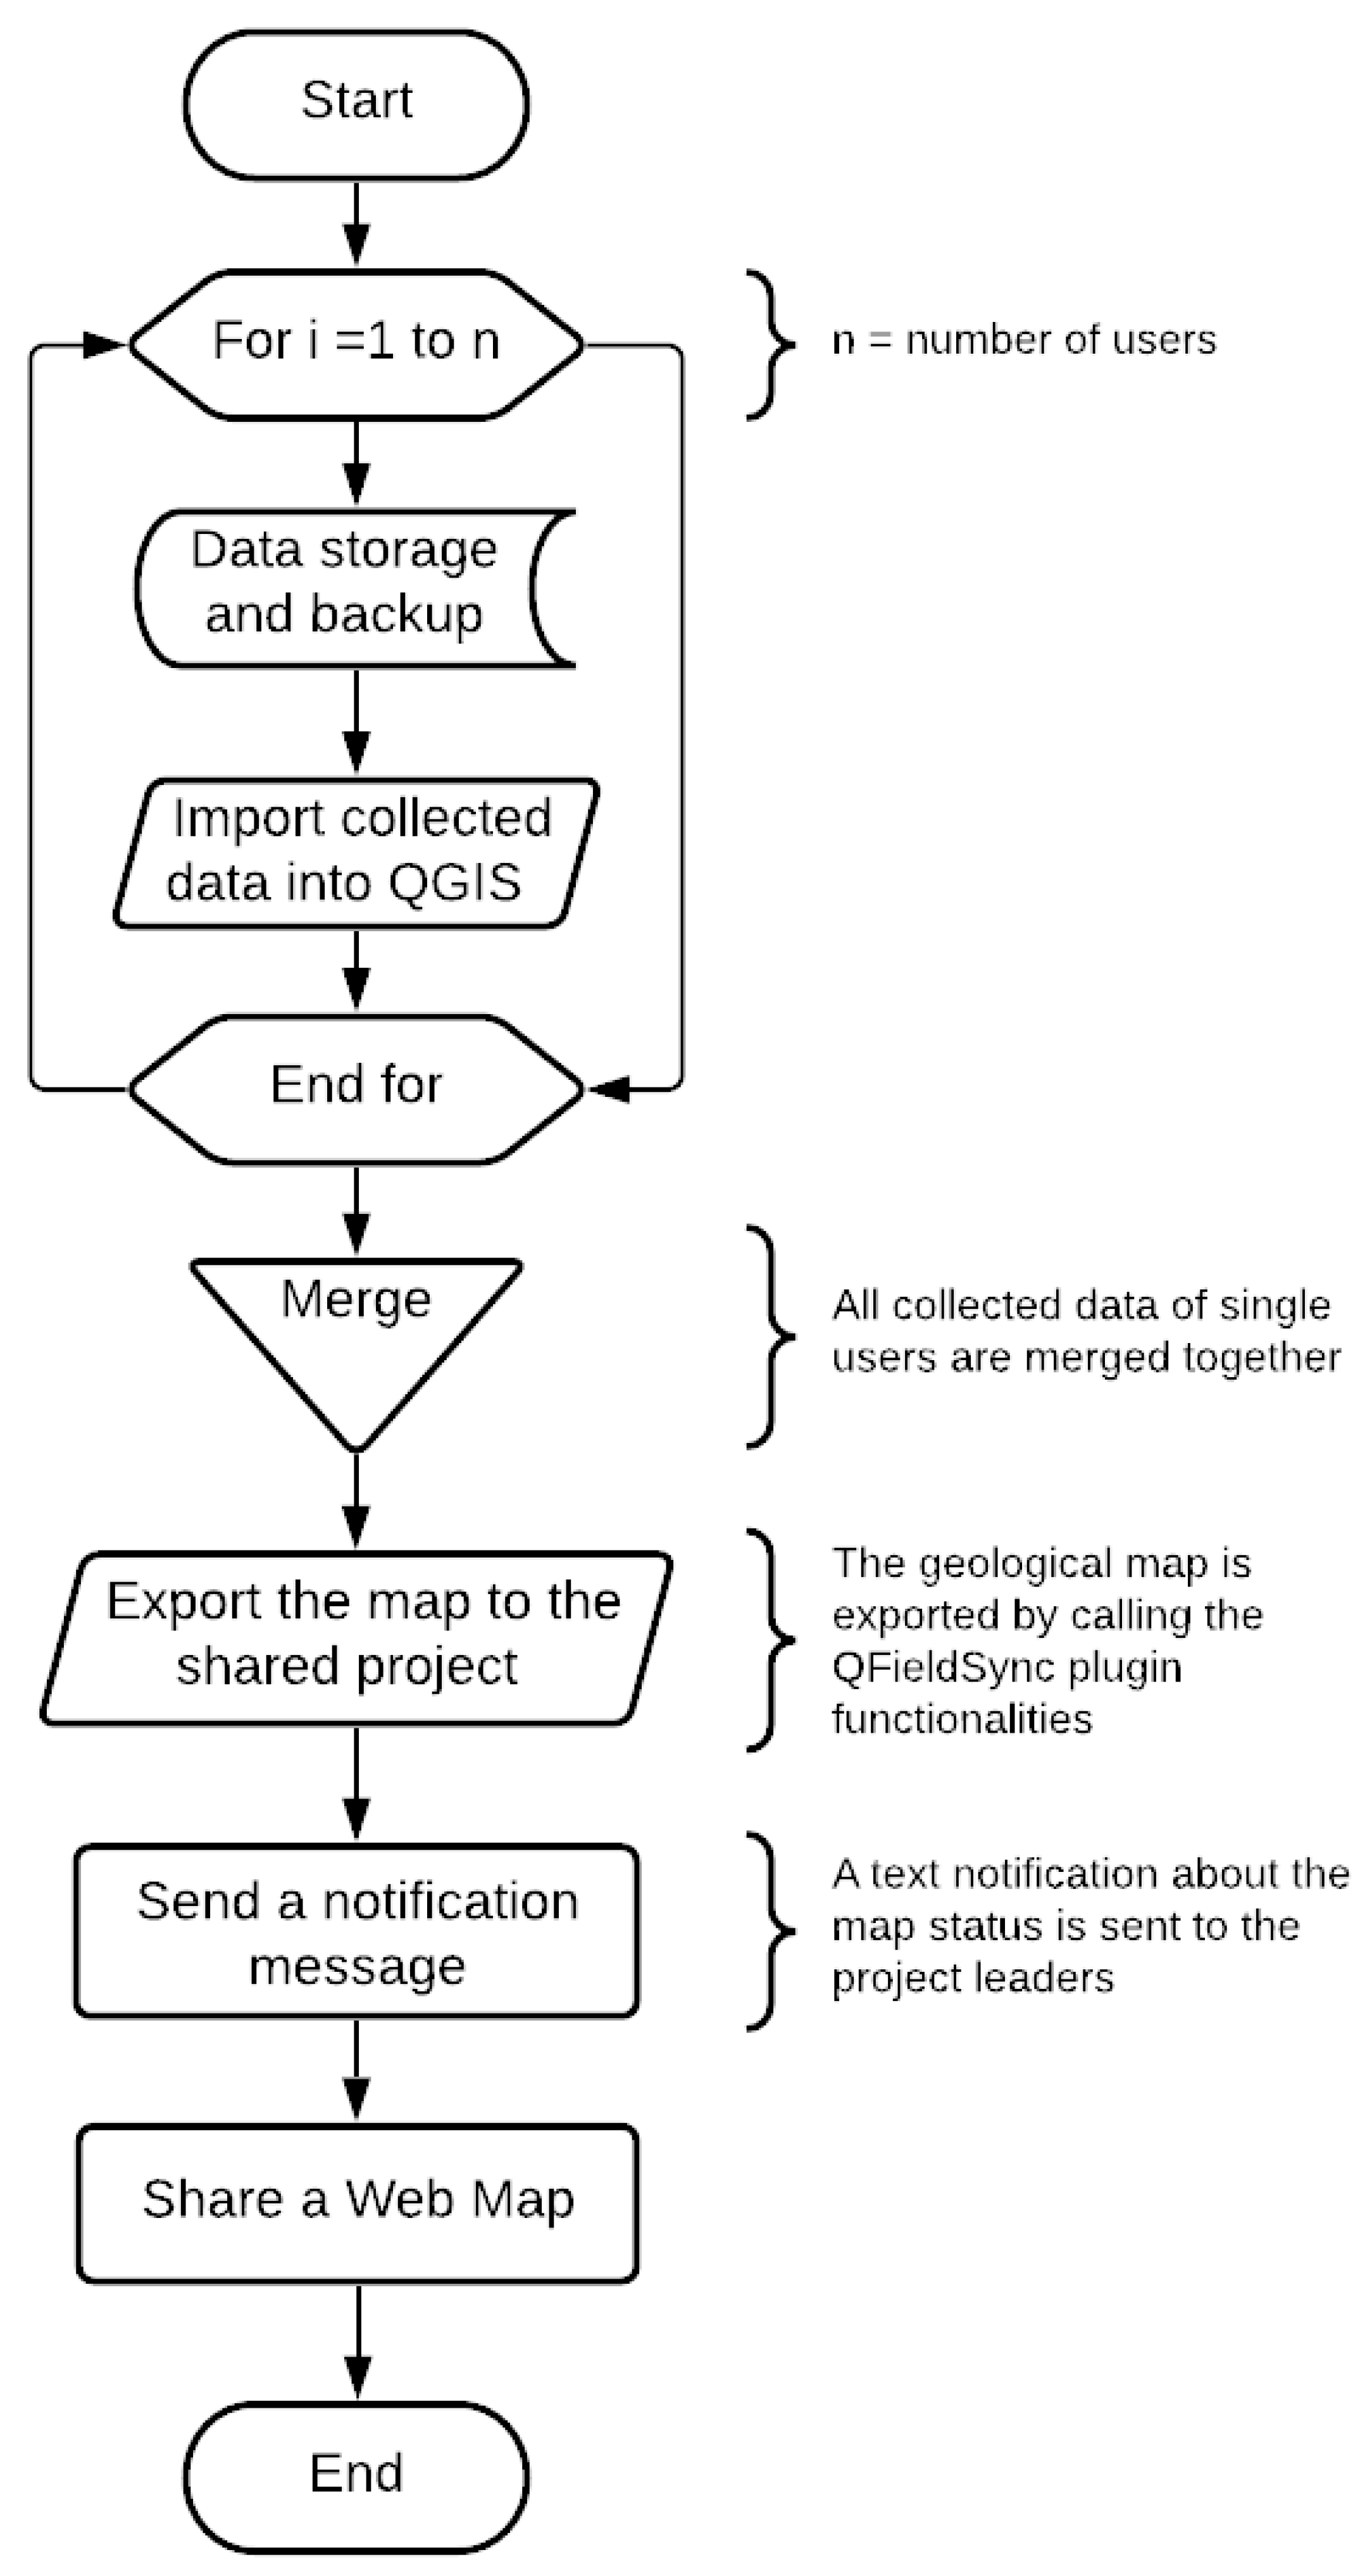
  • The developed algorithm is run automatically once per day and performs the following functions:
    • Store and create a backup copy of the recently collected and/or modified geological data on the central server;
    • Import the recently collected and/or modified data in QGIS;
    • Integrate all the single-users’ databases, i.e., all the information coming from adjacent survey areas in order to create a common geological map;
    • Export the common geological map to a shared QGIS project through the QFieldSync plugin functionalities;
    • Notify the project leaders of the fieldwork progress, the errors that may have occurred during the update process, and the required manual correction;
    • Share the common geological map on a WebGIS platform in order to make it available to the users and the stakeholders involved in the CARG project.
  • Once the MDs are synchronized with the central server, the common geological map will be available to all the users involved in the survey so that everyone can appreciate the survey progress in their own area and in adjacent areas.
The flowchart of the algorithm is shown in Figure 2.
Consequently, users will only focus on adding geometric features in different thematic layers, composing the CARG database and filling up the dialog forms with the required descriptive information (including notes and photos) to build up new structured and georeferenced data by leveraging the integrated mobile device location services provided by the MD or by manually choosing a different position on the map. Data can be collected and edited directly in the field, also by taking advantage of online and offline maps, available during the fieldwork.

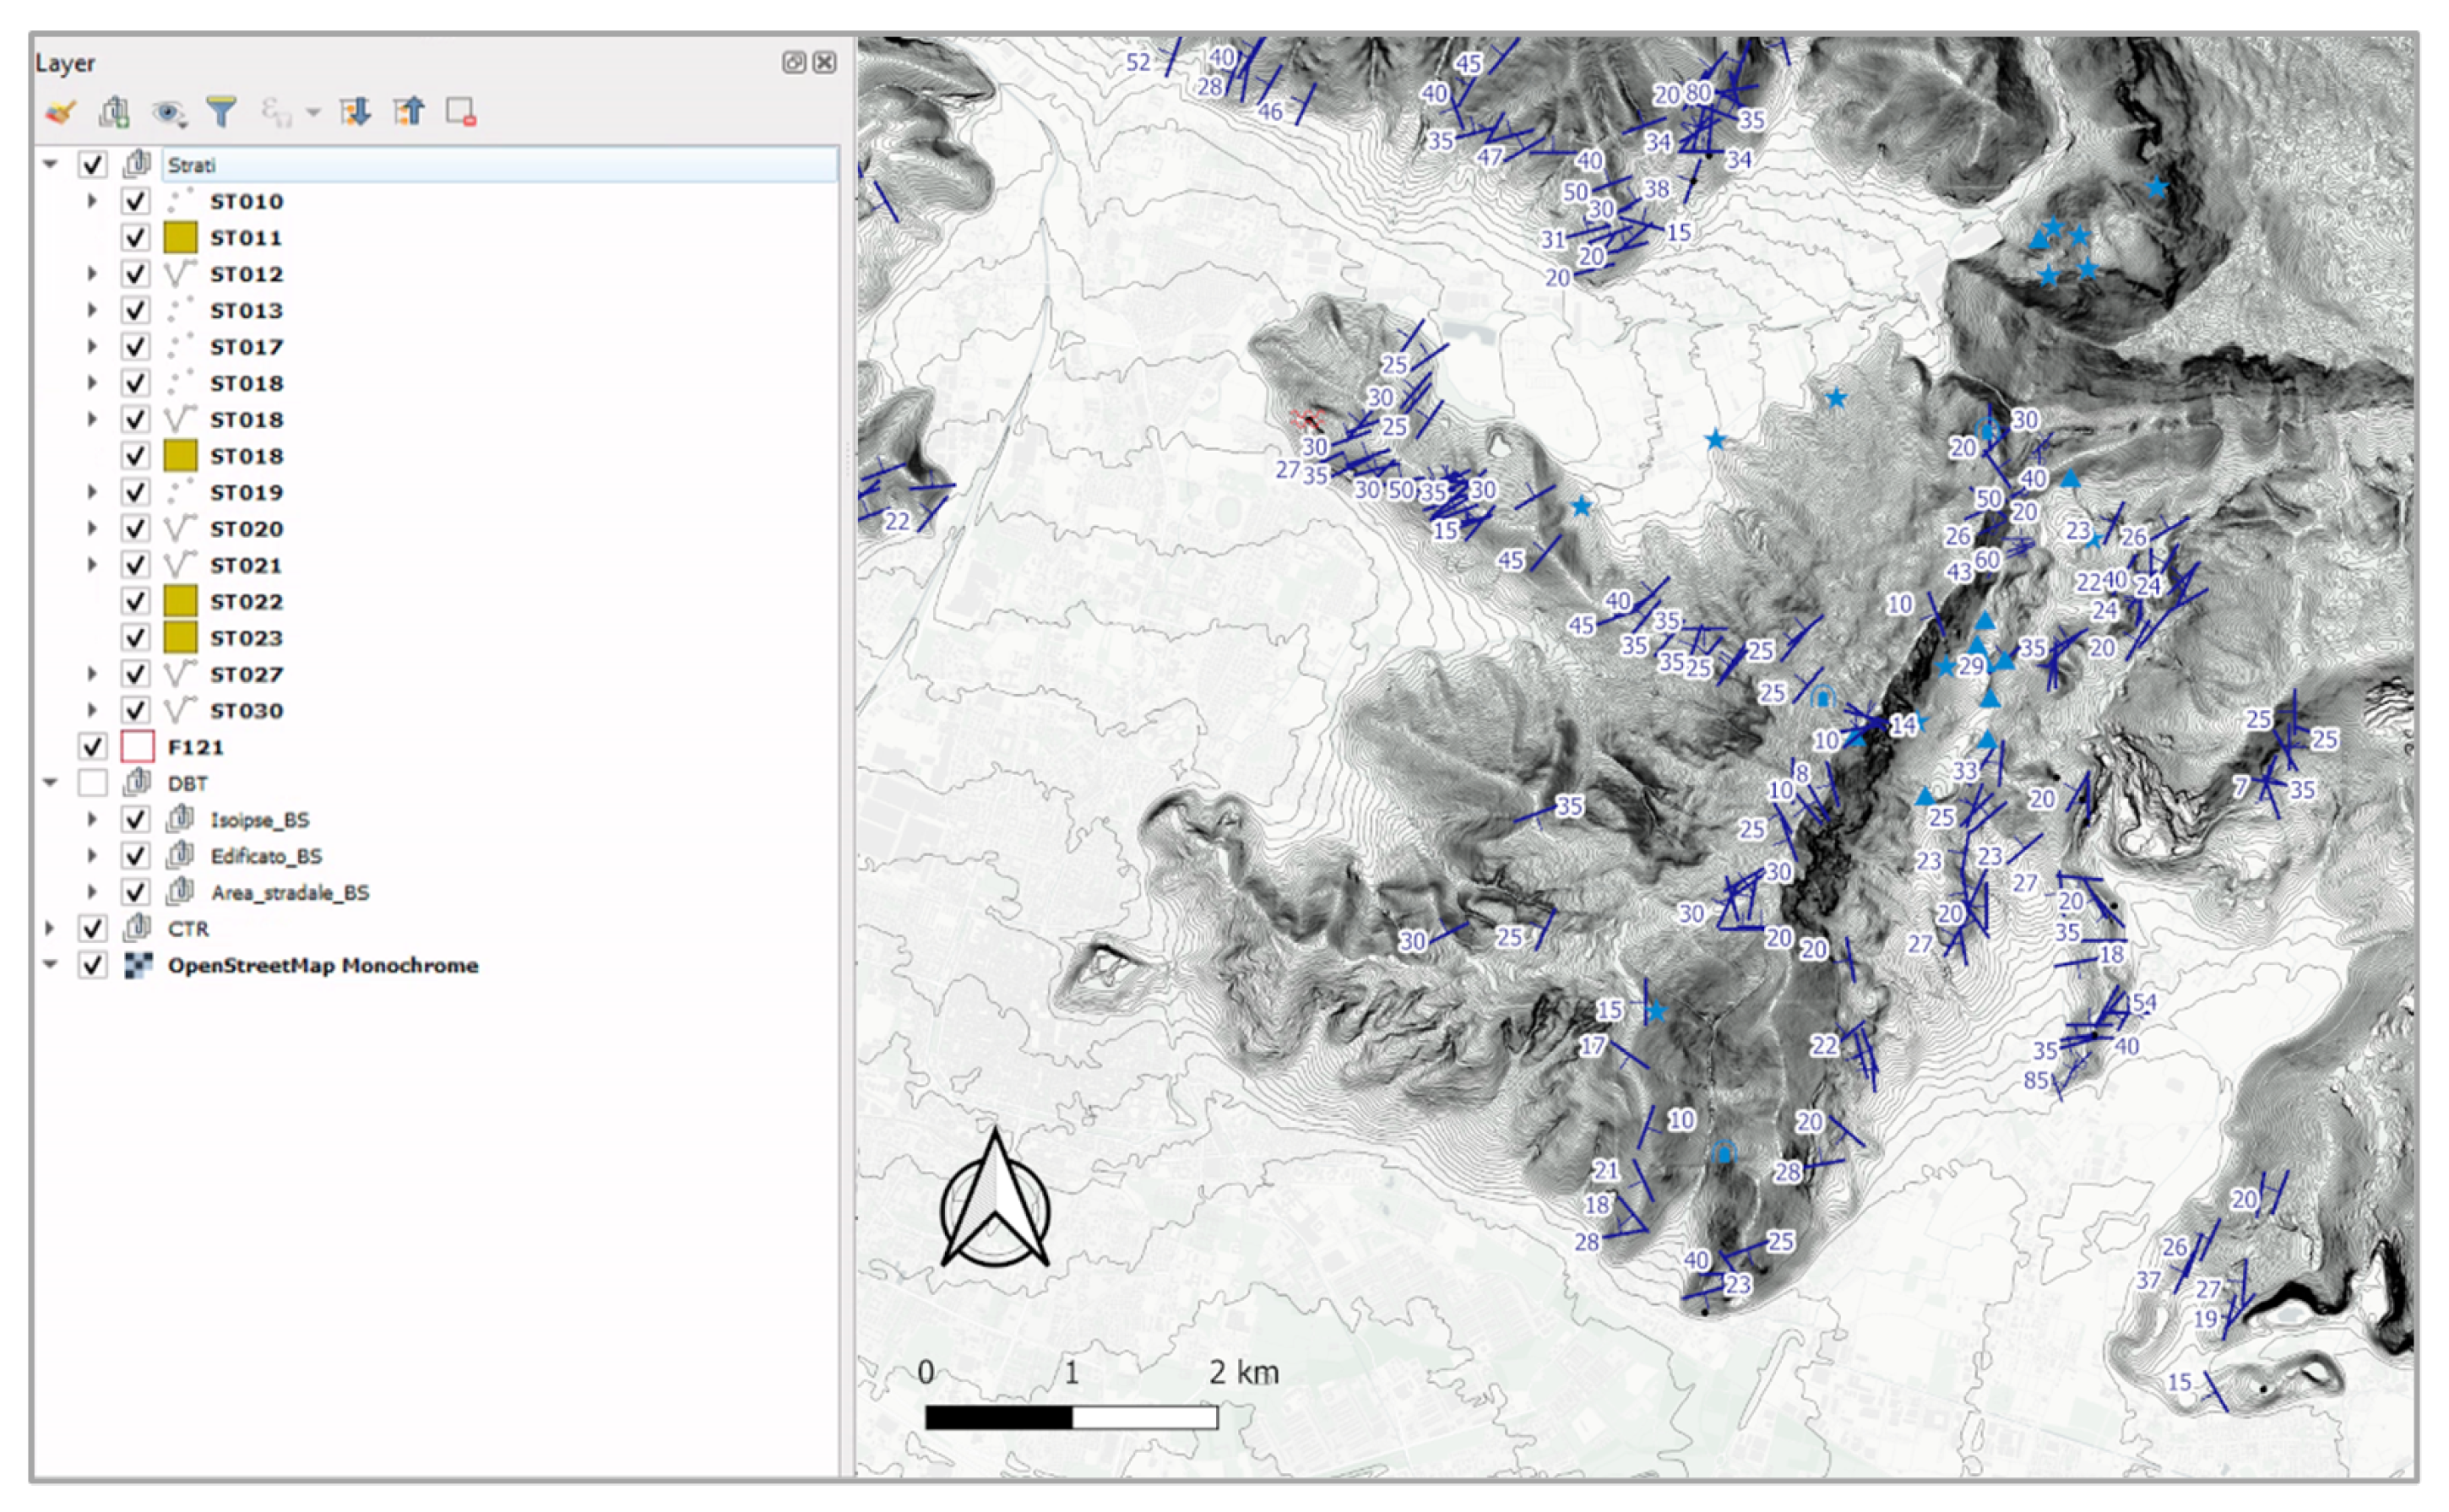
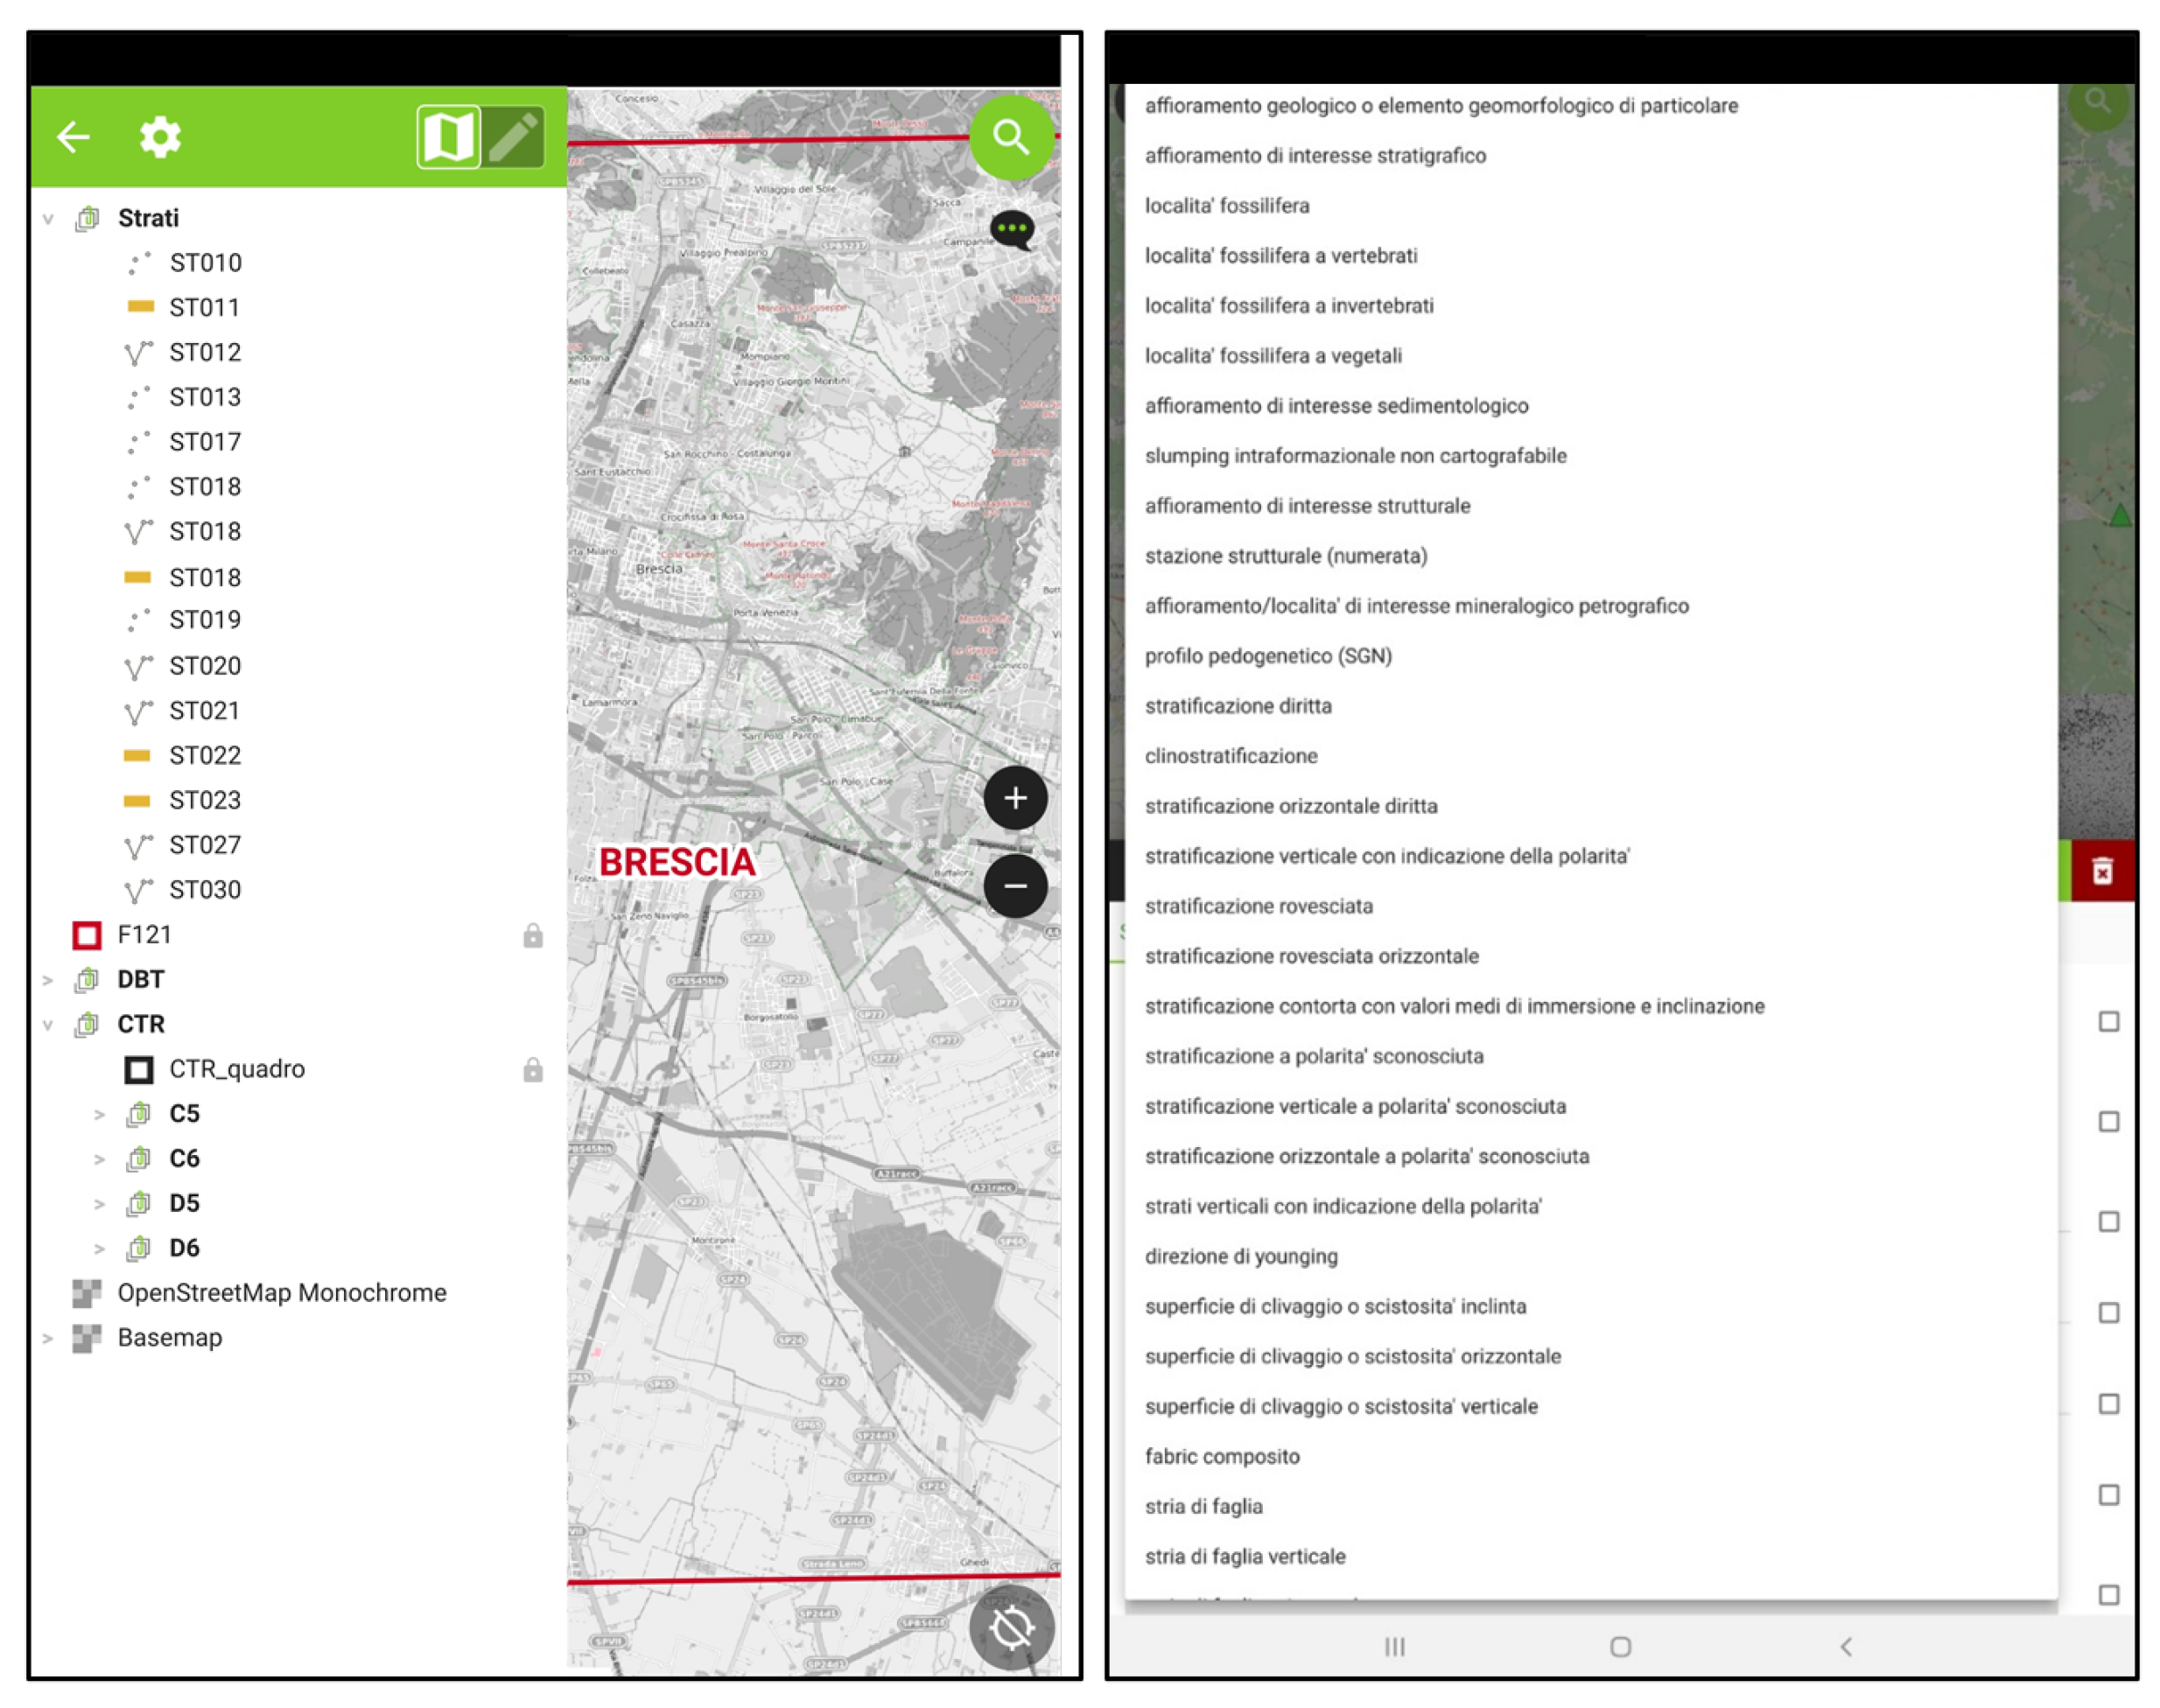
3.4. Case Study: Brescia Geological Map

A first test of the IT infrastructure is underway and is currently being employed by the users involved in the geological field surveys for data collection and database population of the geological map “Brescia”, at a scale of 1:50,000. The map covers about 570 km 2 (26 × 22 km) around the city of Brescia, in the northwestern section of the Po Valley, at the foot of the Italian Prealps. From a geological viewpoint, this area includes three main environments: (i) the morainic deposits in the northwest section of the map belonging to the so-called Sebino Amphitheater, (ii) the marine Mesozoic terrain outcropping in the hills north of the city of Brescia and (iii) the alluvial and fluvioglacial deposits carved from the Mella river that cover the central and southern sectors of the map [26].
The testing phase concerns the application of both the GIS and the DES modules, as described in Section 3.2 and Section 3.3. The designed GIS project is composed of 15 vector layers whose geometric and descriptive structures fully acknowledge the CARG requirements. The structure and the description of each layer composing the CARG database are shown in Table 1; in addition, although not strictly requested by the CARG requirements, for each feature, the user can store the date and time of acquisition, georeferenced photos, and notes in textual format. In order to reduce the topological inconsistencies, in some cases, it is preferred to provide the users with multiple layers referring to the same data type. For example, three layers are defined for the collection of information concerning geological units (ST018): point layer, linear layer, and polygonal layer. The point features are used when the outcrop area of a given geological unit is too small at the map scale to be represented by a polygon; however, this information is fundamental for the interpretation of the geological structure of the area. The linear and polygon features are used when the outcrop area of a given geological unit is large enough at the map scale to be represented by a polygon with area and perimeter. Polygon features will support users in the geologic interpretation of large areas. Since the field data collection is still ongoing, topological inconsistencies will be fixed by a GIS analyst afterwards, before the official release of the CARG database and the finalization of the geological map. The GIS project makes other vector maps available (Table 2), such as contour lines, roads, and buildings, to help users to improve the positioning accuracy. In addition to vector maps, the GIS project also hosts raster maps (Table 2): regional topographic maps at a 1:10,000 scale (CTR), DEM and morphometric maps derived from the DEM (slope, aspect, internal relief, etc.). Figure 3 shows an example of the field data collection progress map visualized as a QGIS project with corresponding CARG symbology, while Figure 4 illustrates an example of the interface on the MD of a generic user. Through the DES module, the GIS project is transferred from the central server to the MDs deployed in the field: in this way, the up-to-date information stored in the CARG database (whose structure is shown in Table 1) and all the additional data (shown in Table 2) are made available to users on a daily basis. Furthermore, the final users are trained by the infrastructure developers on how to use MD for data collection and sharing. Moreover, the ongoing feedback from geologists helps in the improvement of the whole infrastructure and its usability. The testing phase of the IT infrastructure began in early 2021 and is currently in progress as this article is being written. The infrastructure was initially tested by 12 users simultaneously, and 4 of them are still involved in the geological field surveys. Hundreds of features have been mapped and loaded into the CARG database since then. Data collection will continue for two more years, and the database will be finally post-processed, validated, and checked for topological consistency by GIS analysts. Then, the geological map will be finalized to make it ready for the official release. During the testing phase, the authors had the opportunity to validate the functioning of the various infrastructure modules and to improve their functionality and usability, thanks to feedback from the users. Major implementations arising from these feedback concern the addition of ancillary layers (e.g., mountain path maps, orthophotos, and path tracks) useful to improve the visibility and interpretability of the geological structural elements in the study areas. Other implementations concern the revision of the final version of the DES module, the improvement of the readability and usability of the dialog forms, the upgrade of the project structure to speed up the synchronization of the collected information and the design of the shared web map. From a hardware requirements point of view, for the specific case study, 3 GB is the minimum amount of RAM to manage the GIS project and collect data by the MDs.

4. Conclusions

This study describes an open-source-software-based IT infrastructure which consists of two modules (GIS and DES modules) to ease the entire process from data collection to map sharing within the CARG project. Comprehensively, the IT infrastructure enables a collaborative and asynchronous mapping of geological entities by populating the CARG database with the help of predefined dialog forms and constraints and by sharing collected information. The DES module imports the collected data from all MDs and integrates them in a common QGIS project on the central server, creates backup copies of each local QGIS project, then merges the newly collected data from all the MDs and shares the newly generated map on a daily basis. The shared geological map allows the users to have an overview of the spatial distribution of the features stored in different layers, therefore easing data interpretation through information exchange and representing a valuable tool for planning and optimizing future surveys. Moreover, besides the specific application to the CARG project, preliminary results suggest the infrastructure’s flexibility and suitability to support other geological surveys or similar applications aimed at the production of thematic maps in different geographic areas. The major advantage of the infrastructure is its orientation to guarantee the operational continuity between the field surveys and the finalization of the geological and geothematic maps. This objective was pursued by leveraging the capability of the chosen GIS applications for field data collection to remain operational both online and offline and, hence, to ensure the overall system resilience.
The ongoing activities aim at a solution that allows users to insert the collected data directly into a centralized database (e.g., PostGIS), making the implementation of the infrastructure for other areas and CARG maps even easier, also at the national level. Further improvements and integrations could originate from the release of QFieldCloud [29], currently available in a beta version, which seems to give promising results for the development and stability of the infrastructure.

Author Contributions

Conceptualization, Simone Sterlacchini and Marco Zazzeri; methodology, Debora Voltolina, Christian Natale Gencarelli and Mohammed Hammouti; software, Mohammed Hammouti; validation, Christian Natale Gencarelli, Debora Voltolina, Mohammed Hammouti and Marco Zazzeri; writing—original draft preparation, Christian Natale Gencarelli, Debora Voltolina and Mohammed Hammouti; writing—review and editing, all authors. All authors have read and agreed to the published version of the manuscript.

Funding

This research has been supported by the funds of the CARG-Project-Geological Map of Italy 1: 50,00.

Acknowledgments

The authors would like to thank Chiara D’Ambrogi, Gianluca Norini, Davide Tantardini, Paolo Schirolli and Federica Barilaro for their feedback and useful suggestions for the infrastructure improvement and development.

Conflicts of Interest

The authors declare no conflict of interest.

Sample Availability

The infrastructure is available from the corresponding author on reasonable request.

Abbreviations

The following abbreviations are used in this manuscript:
ITInformation Technology
CARGGeological Cartography
GISGeographic Information Systems
FOSSFree and Open-Source Software
MDsMobile Devices
DESData Exchange and Storage
OSMOpen Street Map
CTRCarte Tecniche Regionali
DEMDigital Elevation Models

References

  1. Lettieri, M.; Carta, R.; Apuzzo, R. Carta geologica d’Italia Stato di attuazione del Progetto CARG (aggiornamento agosto 2008) 1:50,000. GEOmedia 2008, 10, 3. [Google Scholar]
  2. D’Ambrogi, C.; Pantaloni, M.; Pichezzi, R. I 20 Anni del Progetto di Cartografia Geologica Nazionale; ISPRA: Ispra, Italy, 2010.
  3. De Donatis, M.; Bruciatelli, L. MAP IT: The GIS software for field mapping with tablet pc. Comput. Geosci. 2006, 32, 673–680. [Google Scholar] [CrossRef]
  4. McCaffrey, K.; Jones, R.; Holdsworth, R.; Wilson, R.; Clegg, P.; Imber, J.; Holliman, N.; Trinks, I. Unlocking the spatial dimension: Digital technologies and the future of geoscience fieldwork. J. Geol. Soc. 2005, 162, 927–938. [Google Scholar] [CrossRef] [Green Version]
  5. Jones, R.; McCaffrey, K.; Wilson, R.; Holdsworth, R. Digital field data acquisition: Towards increased quantification of uncertainty during geological mapping. Geol. Soc. Lond. Spec. Publ. 2004, 239, 43–56. [Google Scholar] [CrossRef] [Green Version]
  6. Chang, K. Geographic information system. International Encyclopedia of Geography: People, The Earth, Environment and Technology: People, the Earth, Environment and Technology; Wiley Online Library: Hoboken, NJ, USA, 2016; pp. 1–9. [Google Scholar]
  7. Briner, A.; Kronenberg, H.; Mazurek, M.; Horn, H.; Engi, M.; Peters, T. FieldBook and GeoDatabase: Tools for field data acquisition and analysis. Comput. Geosci. 1999, 25, 1101–1111. [Google Scholar] [CrossRef]
  8. Soller, D. Digital Mapping Techniques’ 00, Workshop Proceedings; US Department of the Interior, US Geological Survey: Reston, VA, USA, 2000.
  9. Brimhall, G.; Vanegas, A.; Soller, D. Removing Science Workflow Barriers to Adoption of Digital Geological Mapping by Using the GeoMapper Universal Program and Visual User Interface; US Geological Survey Open File Report; U.S. Geological Survey: Reston, VA, USA, 2001; pp. 1–223.
  10. Akciz, S.; Sheehan, D.; Niemi, N.; Nguyen, H.; Hutchison, W.; Carr, C.; Hodges, K.; Burchfiel, B.; Fuller, E. What does it take to collect GIS data in the field. In Geological Society of America Annual Meeting, Abstracts with Program; Geological Society of America: Denver, CO, USA, 2002; p. 419. [Google Scholar]
  11. Howard, A. Capturing digital data in the field-The British Geological Survey’s SIGMA Project: Digital field data capture in a corporate context. In Proceedings of the Capturing Digital Data in the Field Workshop, Keyworth, UK, 25–26 April 2002. [Google Scholar]
  12. Brodaric, B. The design of GSC FieldLog: Ontology-based software for computer aided geological field mapping. Comput. Geosci. 2004, 30, 5–20. [Google Scholar] [CrossRef]
  13. Yeon, Y. KMapper: A Field Geological Survey System. ISPRS Int. J. Geo-Inf. 2021, 10, 405. [Google Scholar] [CrossRef]
  14. Lee, S.; Suh, J.; Choi, Y. Review of smartphone applications for geoscience: Current status, limitations, and future perspectives. Earth Sci. Inform. 2018, 11, 463–486. [Google Scholar] [CrossRef]
  15. QGIS Development Team; Open Source Geospatial Foundation: Beaverton, OR, USA, 2019; Available online: https://qgis.org/it/site/ (accessed on 8 October 2021).
  16. QFIELD. Available online: https://qfield.org/ (accessed on 10 January 2022).
  17. Schattschneider, J.; Daudt, N.; Mattos, M.; Bonetti, J.; Rangel-Buitrago, N. An open-source geospatial framework for beach litter monitoring. Environ. Monit. Assess. 2020, 192, 1–14. [Google Scholar] [CrossRef] [PubMed]
  18. Ostadabbas, H.; Weippert, H.; Behr, F. Using the synergy of qfield for collecting data on-site and qgis for interactive map creation by alkis® data extraction and implementation in postgresql for urban planning processes. Int. Arch. Photogramm. Remote Sens. Spat. Inf. Sci. 2020, 43, 679–683. [Google Scholar] [CrossRef]
  19. Ielli, N.; Coli, M.; Donigaglia, T.; Ciuffreda, A. An Unconventional Field Mapping Application: A Complete Opensource Workflow Solution Applied to Lithological Mapping of the Coatings of Cultural Heritage. ISPRS Int. J.-Geo-Inf. 2021, 10, 357. [Google Scholar]
  20. Quirini-poplawski, L.; Semczuk, M. Use of Geographic Information Systems in the Cataloguing of Tourist Facilities: The Proposal of a New Research Procedure. In Proceedings of the 37th International Business Information Management Association (IBIMA), Cordoba, Spain, 30–31 May 2021. [Google Scholar]
  21. Syncthing. Available online: https://syncthing.net/ (accessed on 10 January 2022).
  22. Quinn, C.; Scanlon, M.; Farina, J.; Kechadi, M. Forensic analysis and remote evidence recovery from syncthing: An open source decentralised file synchronisation utility. In Proceedings of the International Conference on Digital Forensics and Cyber Crime, Seoul, Korea, 6–8 October 2015; pp. 85–99. [Google Scholar]
  23. Campobasso, C.; Carton, A.; Chelli, A.; D’Orefice, M.; Dramis, F.; Graciotti, R. Aggiornamento ed integrazioni delle Linee guida della Carta geomorfologica d’Italia alla scala 1:50,000. Quad. Ser. III 2018, 13, 1–96. [Google Scholar]
  24. D’italia, S.G. Aggiornamento ed integrazione delle Linee Guida della Carta Geologica d’Italia alla scala 1:50,000. Quad. Ser. III 2009, 12, 1–80. [Google Scholar]
  25. OpenStreetMap®, OSM. Available online: https://www.openstreetmap.org/ (accessed on 10 January 2022).
  26. Carta Geologica D’Italia, Foglio 47. Available online: http://sgi.isprambiente.it/geologia100k/mostra_pdf.aspx?pdffile=47.pdf (accessed on 9 March 2021).
  27. CTR. Available online: https://www.geoportale.regione.lombardia.it/download-ctr (accessed on 10 January 2022).
  28. Lombardy Region Geoportal. Available online: https://www.geoportale.regione.lombardia.it/ (accessed on 10 January 2022).
  29. QFIELD CLOUD. Available online: https://qfield.cloud/ (accessed on 10 January 2022).
Figure 1. Conceptual scheme of the IT infrastructure: GIS server submodule, DES module and GIS client submodule. The “gears” point out the operations that are performed automatically, the large arrows indicate the synchronization process, and the red box highlights the designed algorithm, which is further detailed in Figure 2.
Ijgi 11 00192 g001
Figure 2. Flowchart of the developed algorithm with its main functionalities.
Ijgi 11 00192 g002
Figure 3. Example of the integrated GIS project view. OSM is used as the basemap.
Ijgi 11 00192 g003
Figure 4. QField mobile survey activity sample on the mobile device. Left panel: main project and menu with layers and additional data. Right panel: list of the “type” attributes for the geological observation layer (ST019).
Ijgi 11 00192 g004
Table 1. The list of layers composing the CARG database used during the fieldwork. The original structure of the CARG database is much more complex and includes many other layers. A selection was made in advance in order to choose the fundamental layers that must be characterized in the field.
NameTypeDescriptionAttributes
ST010PointGeomorphologic and anthropogenic features in symbolic formType, Typology, Status
ST011PolygonGeomorphologic and anthropogenic featuresType, Typology
ST012LineGeomorphologic and anthropogenic featuresType, Typology, Status
ST013PointResources and prospectingType
ST017PointGeological samplesFeature_ID, Set_of_Sample_Initials, Sample_Initials, Sample_ID
ST018PointGeological units in symbolic formName, Typology, Status, Texture, Cement, Environment, Deposits
ST018LineGeological unitsType, Typology
ST018PolygonGeological unitsType, Typology, Status
ST019PointGeological observationType, Typology, Strike, Direction, Dip, Phase, Asymmetry
ST020LineGeological units in symbolic formType, Typology
ST021LineFolding structures and structural elementsType, Typology, Phase
ST022PolygonGeological and biological processesType, Typology
ST023PolygonStratigraphic-sequential unitsType, Typology
ST027LineGeological and geophysical tracesType
ST030LineSubsoil description using contour linesType
Table 2. Additional data.
NameDescriptionSource
CTRRegional Topographic Maps at 1:10,000 scale[27]
ContourContour Lines Maps (equidistance of 5 m)[28]
DEM20Digital Elevation Model (pixel size 20 m)[28]
DEM5Digital Elevation Model (pixel size 5 m)[28]
RoadsRoad map[28]
BuildingsBuilding map[28]
OSMOpenStreetMap®[25]
Publisher’s Note: MDPI stays neutral with regard to jurisdictional claims in published maps and institutional affiliations.

