Article

Applying Decision Trees to Examine the Nonlinear Effects of Multiscale Transport Accessibility on Rural Poverty in China

Northwest Land and Resources Research Center, Shaanxi Normal University, Xi’an 710119, China
*
Author to whom correspondence should be addressed.
ISPRS Int. J. Geo-Inf. 2022, 11(6), 352; https://0-doi-org.brum.beds.ac.uk/10.3390/ijgi11060352
Submission received: 11 May 2022 / Revised: 30 May 2022 / Accepted: 14 June 2022 / Published: 16 June 2022

Abstract

:
Accessibility plays an important role in alleviating rural poverty. Previous studies have explored the relationship between accessibility and rural poverty, but they offer limited evidence of the collective influence of multiscale transport accessibility (town-level, county-level, and prefecture-level accessibility) and its nonlinear effects on rural poverty. This study adopted the gradient-boosting decision tree model to explore the nonlinear association and threshold effects of multiscale transport accessibility on the rural poverty incidence (RPI). We selected Huining, a poverty-stricken county in China, as a case study. The results show that multiscale transport accessibility collectively has larger predictive power than other variables. Specifically, town-level accessibility (12.97%) plays a dominant role in predicting the RPI, followed by county-level accessibility (9.50%) and prefecture-level accessibility (7.38%). We further identified the nonlinear association and effective ranges of multiscale transport accessibility to guide poverty-alleviation policy. Our results help inform policy and planning on sustainable poverty reduction and rural vitalization.

1. Introduction

Poverty is the most acute social problem in the contemporary world [1,2]. Extreme poverty (at the US$1.90 per day poverty line) affected approximately 9.4% of the world’s population in 2020, meaning that an estimated 88 million people will be pushed into poverty, especially in rural areas [3]. Poverty is caused by a variety of factors, and these factors are both time- and location-specific [4]. Among them, transport accessibility, as the potential for opportunities for interaction, plays a central role for people to access essential services [5]. Transport accessibility is widely recognized as one of the main reasons for poverty and the key precondition for poverty reduction [6]. However, the relationship between transport accessibility and poverty is still poorly understood, and it often varies with spatial scale of location, ranging from the town- to prefectural-level in different regions [7]. This paper aims to identify the effects of multiscale accessibility on rural poverty in China.
Many studies have explored the correlates of rural poverty and suggest that rural poverty is associated with the physical environment surrounding poor rural areas, geographical location, and accessibility. First, the distribution of rural poverty largely follows physical environmental conditions. Previous studies show that rural poverty is affected by slope, elevation, soil erosion, land-use type, ecological degradation, and natural disasters [8,9,10,11,12,13]. Most poor rural populations in China are distributed in ecologically fragile areas, rocky desertification areas, soil erosion areas, and land desertification areas [14,15,16]. Second, geographical location plays an important role in the occurrence of rural poverty. Geographic remoteness is usually considered as the main explanatory factor of a high level of rural poverty [17,18]. Spatial poverty traps, which are defined as the spatial agglomeration of poverty areas or impoverished populations, result from location characteristics [19,20]. Geographic location affects poverty via the natural environment, infrastructure, public service conditions, and job opportunities [21]. As a result, accessibility is often used as a major explanatory factor of rural poverty, as high accessibility provides rural dwellers with easy access to basic services and market opportunities [6,22,23,24]. Many empirical studies have stated that many poor communities living in rural areas are excluded from economic and social opportunities due to isolation, poor road conditions and low-level accessibility. For instance, the findings from Sewell and Shepherd suggested that poor connectivity and accessibility have a high correlation with high levels of unemployment and poverty. Accessibility is still a constraint for the development of many rural areas in developing countries. Pozzi et al. [7] stated that accessibility and rural poverty have not been clear, and the main reason is the different geographical scales of analysis. Some studies have also shown that poverty is more strongly correlated with travel time to medium-size towns, rather than to local markets or to large capitals.
These studies are useful for understanding the association between rural poverty and the geographical environment and offer critical implications for promoting poverty alleviation. However, some questions remain to be resolved. First, the literature pays little attention to assessing how large a role accessibility plays in rural poverty [22,25]. This assessment is central to implementing targeted poverty-alleviation policies through road infrastructure and accessibility improvement. Second, previous studies often assume that accessibility is linearly related to rural poverty. In fact, changes to transport and spatial attribute variables may have a weak impact on rural poverty after accessibility reaches a certain threshold [4,26]. As a result, the effective ranges in which accessibility influences rural poverty remain unknown. Moreover, the assessment of accessibility inherently includes a spatial analysis exercise that requires the selection of destinations. Specifically, accessibility of destinations with different administrative ranks (settlements), referred to as multiscale transport accessibility in this study, has different effects on rural poverty. This is especially true in China, as the politico-bureaucratic hierarchies of cities (e.g., prefectural-level cities, county-level cities, and townships) determine, to a large extent, their political and economic power. The implications of multiscale transport accessibility have not been comprehensively investigated in the literature focused on the relationship between accessibility and rural poverty.
Our research aims to fill in these three gaps. The objective of this paper is to explore the nonlinear influences of prefecture-level accessibility, county-level accessibility, and town-level accessibility on rural poverty, controlling for other geographic environment variables. To this end, we applied the gradient-boosting decision tree (GBDT) model proposed by Friedman [27]; it has been widely applied in transport travel analysis [28,29]. To the best of our knowledge, this is the first time that GBDT has been applied to a rural poverty analysis. We selected Huining in Gansu province, a poverty-stricken county in China, for a case study. Specifically, we attempted to answer two research questions: (1) Which types of accessibility play important roles in predicting rural poverty? (2) Do the three types of accessibilities have nonlinear or threshold effects on rural poverty? Addressing these questions is very important, as assessing the collective contribution of accessibility and quantifying the relative importance of individual multiscale transport accessibility can guide governments in prioritizing these factors when resources are limited.
This paper is organized as follows. The next section introduces the study area, data and the GBDT method. Section 3 describes the spatial patterns of the RPI and elaborates the effects of multiscale transport accessibility on the RPI. Subsequently, in Section 4, we discuss the results and associated policy implications. Finally, in the conclusion, we present an overview of our key findings.

2. Study Area, Data, and Method
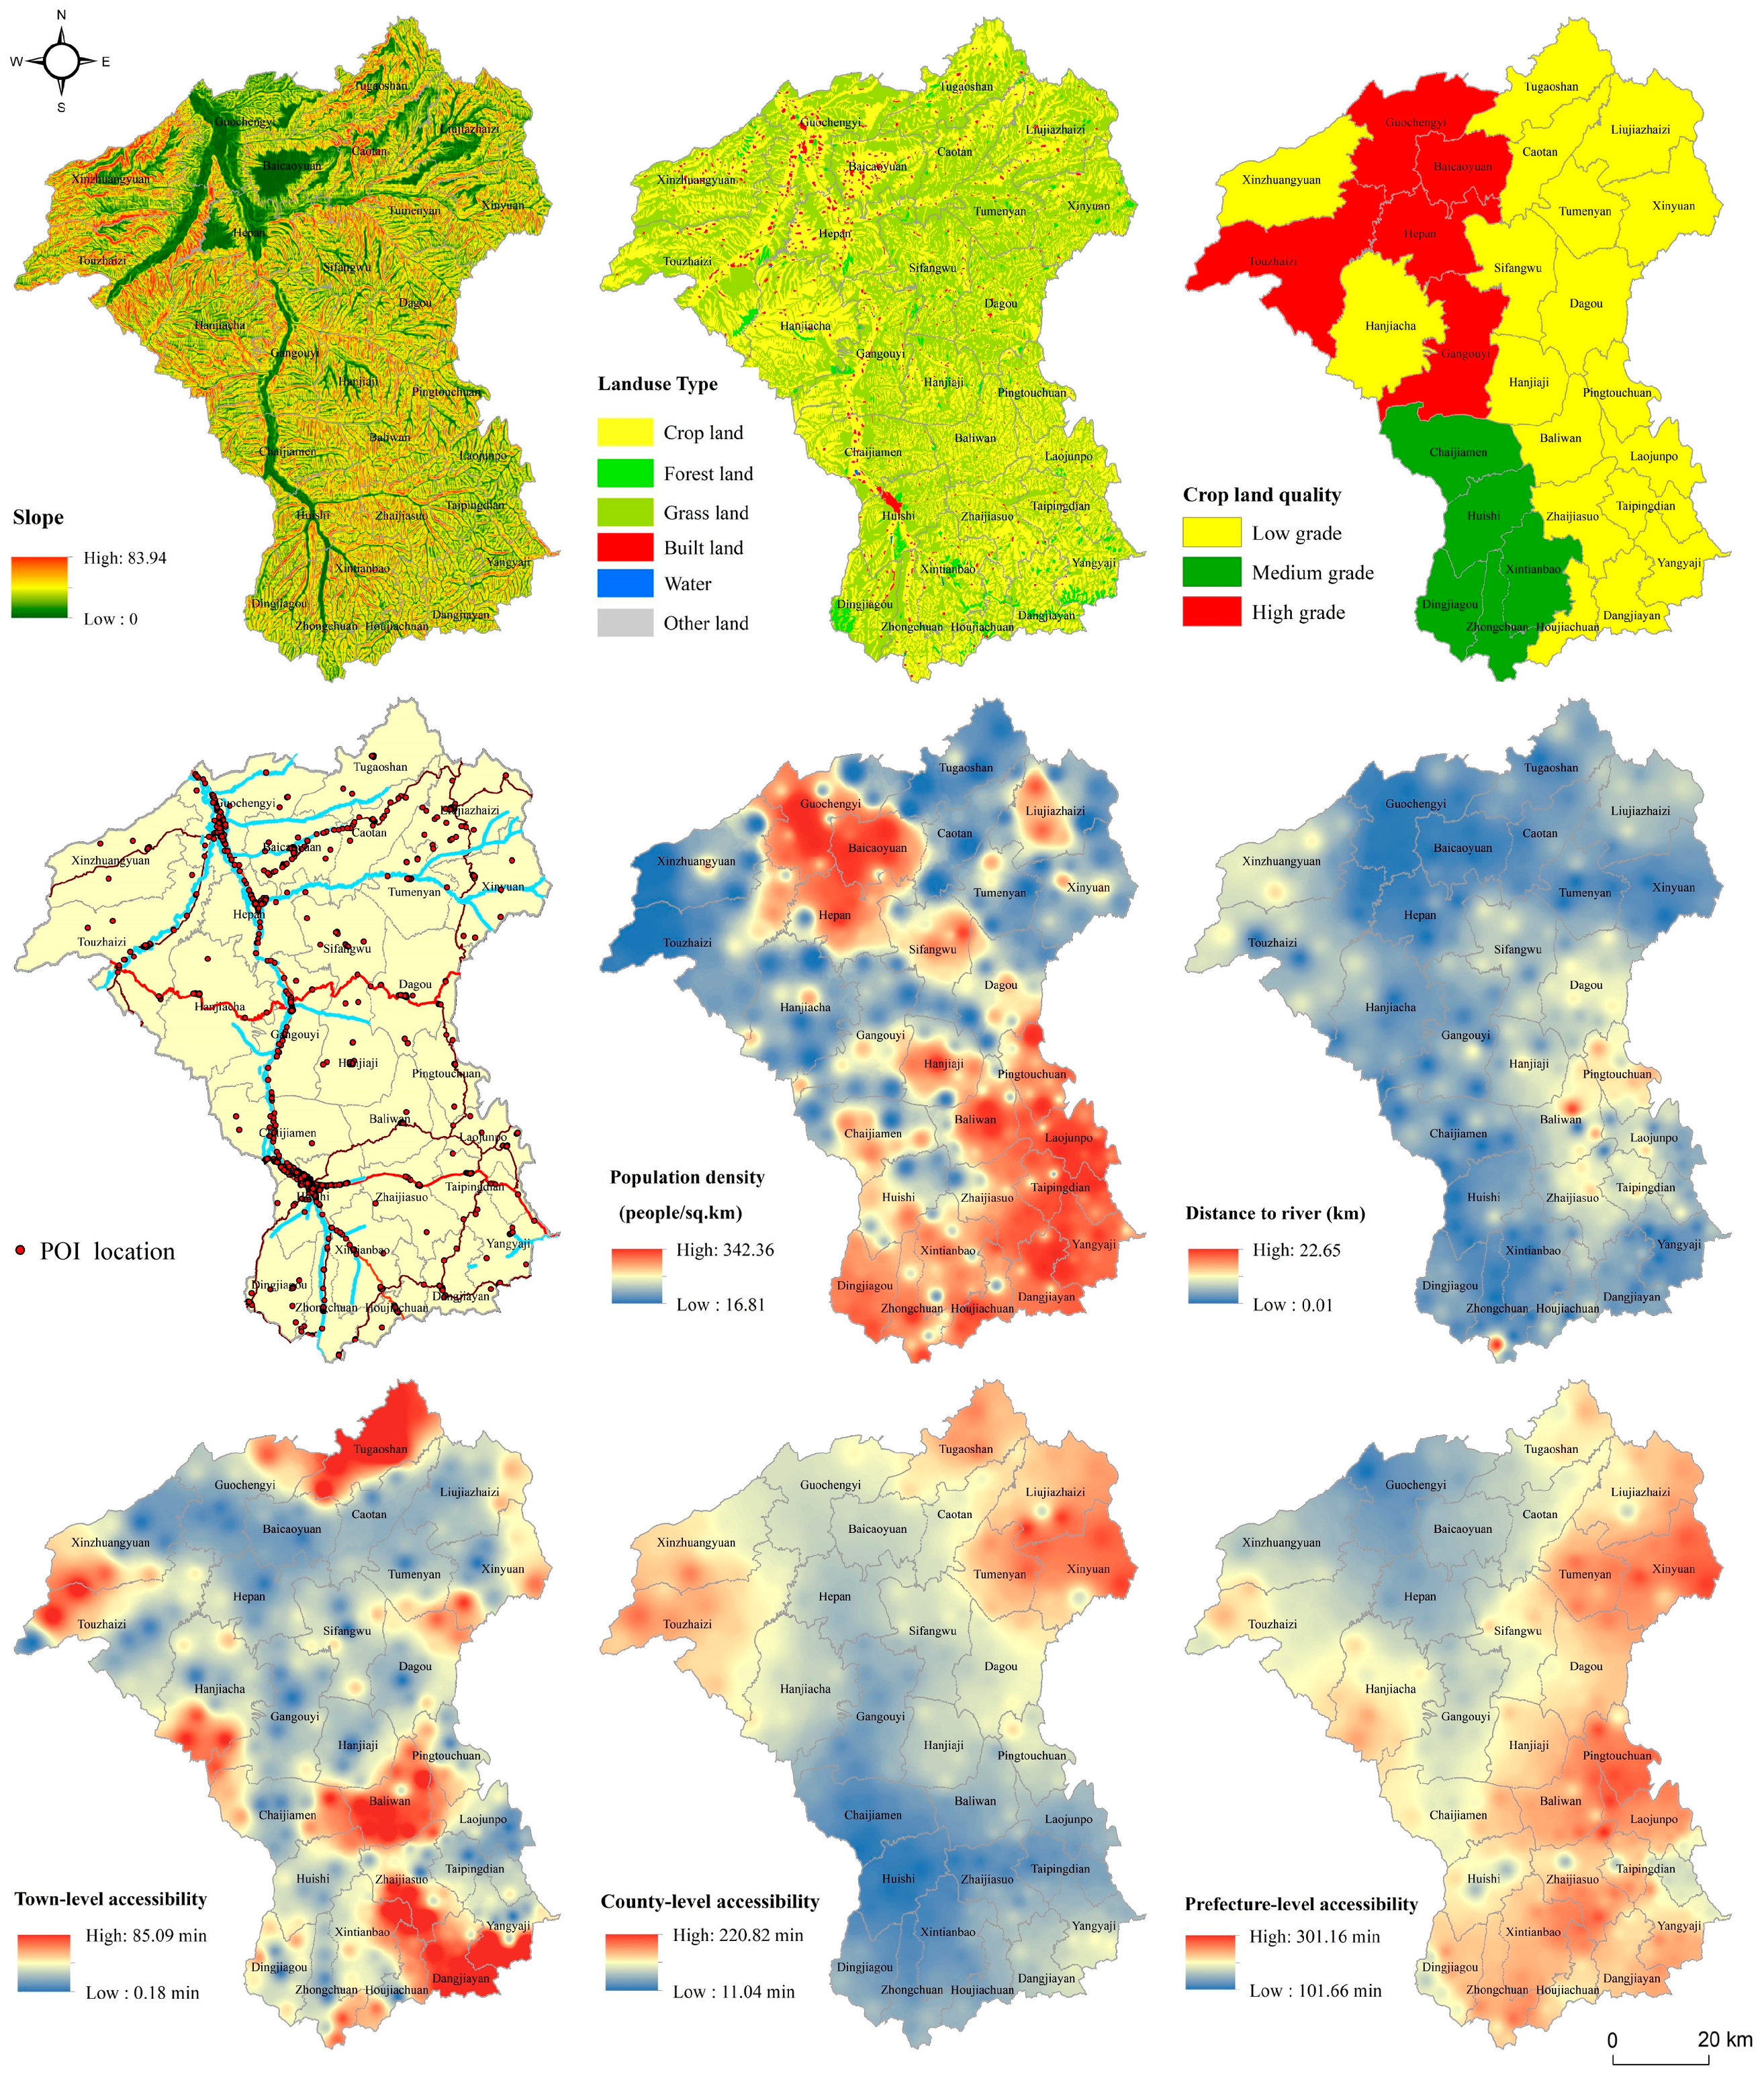
2.1. Study Area

Huining, a poverty-stricken county of Gansu province, is located at the junction of the Northwestern Loess Plateau and Qinghai-Tibet Plateau in the central part of the Liupan Mountain area. Huining is divided into 28 towns, 284 administrative villages, and 16 communities, with a total area of 6439 km2. Huining is also one of the fourteen contiguous poverty-stricken areas with special difficulties in China (CPASDs) (Figure 1) (As an important means of poverty reduction, the Chinese State Council Group Office of Poverty Alleviation and Development (CPAD) determined 14 contiguous low-income areas with special difficulties and set these areas as the main battlefield for targeted poverty alleviation policy.). In 2018, the county had a total population of 580.3 thousand people, of which 492.2 thousand lived in rural areas, accounting for 84.8% of the total population. In 2019, the county’s total GDP was 7168.09 million RMB, and the per capita GDP was 13.2 thousand RMB. The per capita disposable income of urban residents was 19.9 thousand RMB, while that of rural residents was 8.2 thousand RMB [30]. Of all the counties in Gansu province, 50%, including Huining, are classed as poverty-stricken counties by the Chinese State Council Group of Poverty Alleviation and Development. Additionally, Huining is adjacent to the Xi–Hai–Gu (including Xiji, Haiyuan, and Guyuan) region of Ningxia Hui Autonomous Region, which was identified as one of the most inhospitable areas for human activity by the United Nations World Food Programme (WFP) in 1972. Therefore, Huining was selected as a typical example of a spatial poverty trap areas and a typical county in Northwestern China. According to the statistics of the registered poverty (Jiandang Lika) rate of the county government in 2014, the county had 130 poor villages, 39 thousand poor households, and 172.3 thousand poor people, accounting for 32.10% of the total population and 42.54% of the total rural population.

2.2. Data and Variables

To explore the correlates of rural poverty, five categories of explanatory variables were included on the basis of previous studies [31,32,33] and field surveys: topography, land-use resources, water resources, socioeconomic resources, and multiscale transport accessibility. Table 1 summarizes these variables and presents their descriptive statistics. Figure 2 presents the spatial distribution of these variables. The land-use and digital-elevation-model (DEM) data were obtained from the 1:4 M fundamental element version of the National Fundamental Geographic Information System. Socioeconomic data, including the population and GDP of Baiyin municipality, Huining county, and the towns included in the study, were derived from the Gansu Development Yearbook (2015), Huining Statistics Yearbook (2015), and China’s County-Scale Statistics Yearbook—Villages and Towns volume (2015), respectively. The POI data were obtained from the Baidu API (a Chinese equivalent of Google Maps). The rural poverty incidence (RPI) data for each village in 2014 were obtained from a statistics sheet of the registered poverty (Jiandang Lika) rate. The RPI refers to the proportion of the impoverished population in a given village.

2.3. Method

2.3.1. Multiscale Transport Accessibility

Accessibility is traditionally defined as the potential opportunity for interaction and can be considered a proxy to measure welfare and economic development [34,35]. In this study, the weighted average travel time (WATT) index was used as a measure of the average travel time between one node and all other nodes weighted by the mass of the destinations [36]. Multiscale transport accessibility in this paper includes prefecture-level accessibility, county-level accessibility, and town-level accessibility. The classic mathematical equation of WATT is as follows:
W A T T i = j = 1 n T i j × M j j = 1 n M j
where Tij is the shortest travel time between village i and destination j, and it is obtained from the Baidu online map. In contrast to network analysis, travel-time data acquired from big data sources can reflect real-time speed, congestion, and other traffic conditions. Mj is the mass of destination j, and it is measured as the square root of the product of the population and GDP for prefecture-level destinations and county-level destinations [36] and as the number of POIs for town-level destinations. The 28 towns in Huining are considered destinations for measuring town-level accessibility. Huining county and Baiyin municipality are considered the destinations for measuring county-level and prefecture-level accessibility, respectively. In this study, town-level accessibility is defined as the accessibility of the nearest town based on central place theory [37].

2.3.2. GBDT Model

We applied the GBDT algorithm, combining decision tree and gradient boosting, to analyze the dynamics of rural poverty. Recently, there has been an emergence of a rich body of the literature regarding exploring the nonlinear effects of built environment on transport travel using GBDT [28,29]. Compared with the traditional statistical regression framework, the key advantages of applying the GBDT model to examine the dynamics of rural poverty are as follows. (1) The model does not make any predefined linear assumptions about the relationship between rural poverty and its influencing factors: a nonlinear relationship between two variables can be fit by creating partial dependence plots showing the association between rural poverty and accessibility, controlling for other explanatory variables. (2) The model is capable of evaluating the relative influences of multiscale transport accessibility on rural poverty, contributing to the efficacy of targeted poverty reduction policy. (3) The model is not sensitive to multicollinearity and is less vulnerable to outliers.
We used the “gbm” package in the R programming language, designed by Greg [38], to execute the GBDT algorithm. Fivefold cross-validation was applied to develop the GBDT model, as in previous studies. The dataset was split into five distinct subsets of 20% of the data. Each subset was sequentially used as the test data, while the remaining subsets were used to train the model. GBDT uses the boosting technique to create an ensemble learner. Boost in GBDT is an iteration of sample targets, not an iteration of re-sampling. The sample set of each step of boost in GBDT is unchanged. GBDT iterates with all samples each time, including 282 administrative villages. Following previous studies [29], the final model has a maximum of 10,000 trees, a learning rate of 0.001, and ten-way interactions. The model converged after 2005 iterations. The pseudo-R2, “the fraction of variation explained by the model” [39], is 0.510.

3. Results

3.1. Distribution and Spatial Patterns of RPI

Figure 3a illustrates the distribution of the RPI and population density as a violin graph. The median (center red and blue dotted line) RPI and population density are 17.8% and 99.16 people/km2, respectively. The distributions of the RPI and population density show opposite trends. Specifically, the RPI values are sparse near the median and are concentrated near the 25th quantile (8.6%) and 75th quantile (69.7%), with a typical dumbbell distribution. That is, the number of villages with high and low RPIs is greater than the number of villages with moderate RPIs. In contrast, the population density near the median is the highest, with an almost normal distribution. Overall, villages with a higher population density and higher RPI have high population pressure and an uncoordinated human–land relationship.
The RPI in Huining exhibits a significant geographic dimension (Figure 3b) that is highly coupled with the topographical pattern of Huining (Figure 1). The RPI tends to be considerably higher in the mountainous areas of the southern, eastern, and northeastern areas along the border of the Xi–Hai–Gu (Xihaigu) region of Ningxia Hui Autonomous Region. Villages with lower RPIs spread from north to south in the form of belts and are concentrated in low–lying valley plateau areas, such as the Zuli River and Guanchuan River in the northwestern region, the Zu River in the county town of Huishi, and the Li River in the southern region. These villages include Guochengyi, Hepan, Baicaoyuan, Gangouyi, Chaijiamen, and Huishi.

3.2. Relative Importance of Independent Variables

Table 2 shows the relative importance of multiscale transport accessibility and other independent variables. The total relative influence of all independent variables adds up to 100%. The number of POIs is the most important variable in predicting the RPI, with a relative influence of 19.60%. This result is reasonable, as a high number of POIs entails a good supply of basic services, including education, healthcare, job opportunities, and markets for rural dwellers, thus promoting a reduction in rural poverty. The average elevation is the second most important variable in predicting the RPI, with a relative influence of 15.64%. Elevation, a dominant factor of topography, directly influences rural development by impacting other development conditions, such as agricultural productivity and location isolation. Town-level accessibility is the third most important variable in predicting the RPI, and its contribution is 12.97%. This is plausible because the driving effects of towns is higher than those of counties and urban areas in mountainous areas, meaning that easy access to basic services and market opportunities of towns is important for the production and daily life of farmers. This effect was also observed in the process of field work and is consistent with previous studies [4,23,40], primarily due to the poor accessibility between villages and Huining county and Baiyin. Notably, town-level accessibility is strongly influenced by the number of POIs, which we used to represent the mass of towns when calculating town-level accessibility. The POI factor therefore has indirect effects via accessibility, in addition to its direct effect. Unsurprisingly, water resources rank fifth and have a nontrivial effect in predicting the RPI, with a contribution of 8.82%. This finding is reasonable because water resources in arid and semiarid areas are essential for supporting human activity and agricultural production. This finding is also consistent with previous studies [10].
Among all categories of independent variables, multiscale transport accessibility accounts for 29.85% of the predictive power, followed by socioeconomic resources (27.09%), topography (21.25%), land-use resources (12.99%), and water resources (8.82%). Therefore, multiscale transport accessibility is the dominant variable for predicting the RPI. In terms of the individual accessibility variables, town-level accessibility, which ranks third, contributes 12.97% of the ability to predict the RPI, followed by county-level accessibility (9.50%) and prefecture-level accessibility (7.38%), which rank fourth and seventh, respectively. This suggests that town units are a key element in the process of rural development and farmers’ daily lives, owing to the greater isolation from urban areas and county towns in mountainous regions. Meanwhile, these results also demonstrate the efficiency of promoting rural poverty reduction by optimizing the layouts of villages and towns, cultivating special small towns, and improving the service function of towns. Notably, county-level accessibility, which ranks fourth, has a nontrivial effect in predicting the RPI. Socioeconomic resources are the second most important variable and collectively account for 27.09% of the predictive ability. This finding is reasonable, as socioeconomic conditions are a critical correlate of farmer and rural development. The population density also plays a substantial role in predicting the RPI and ranks sixth, with a 7.49% contribution. The collective influence of topography variables is 21.25%, and the average elevation (15.64%) has a stronger role compared than the average slope (5.61%). Finally, the individual contributions of the land-use variables have a relatively limited influence: their contributions do not exceed 5%.

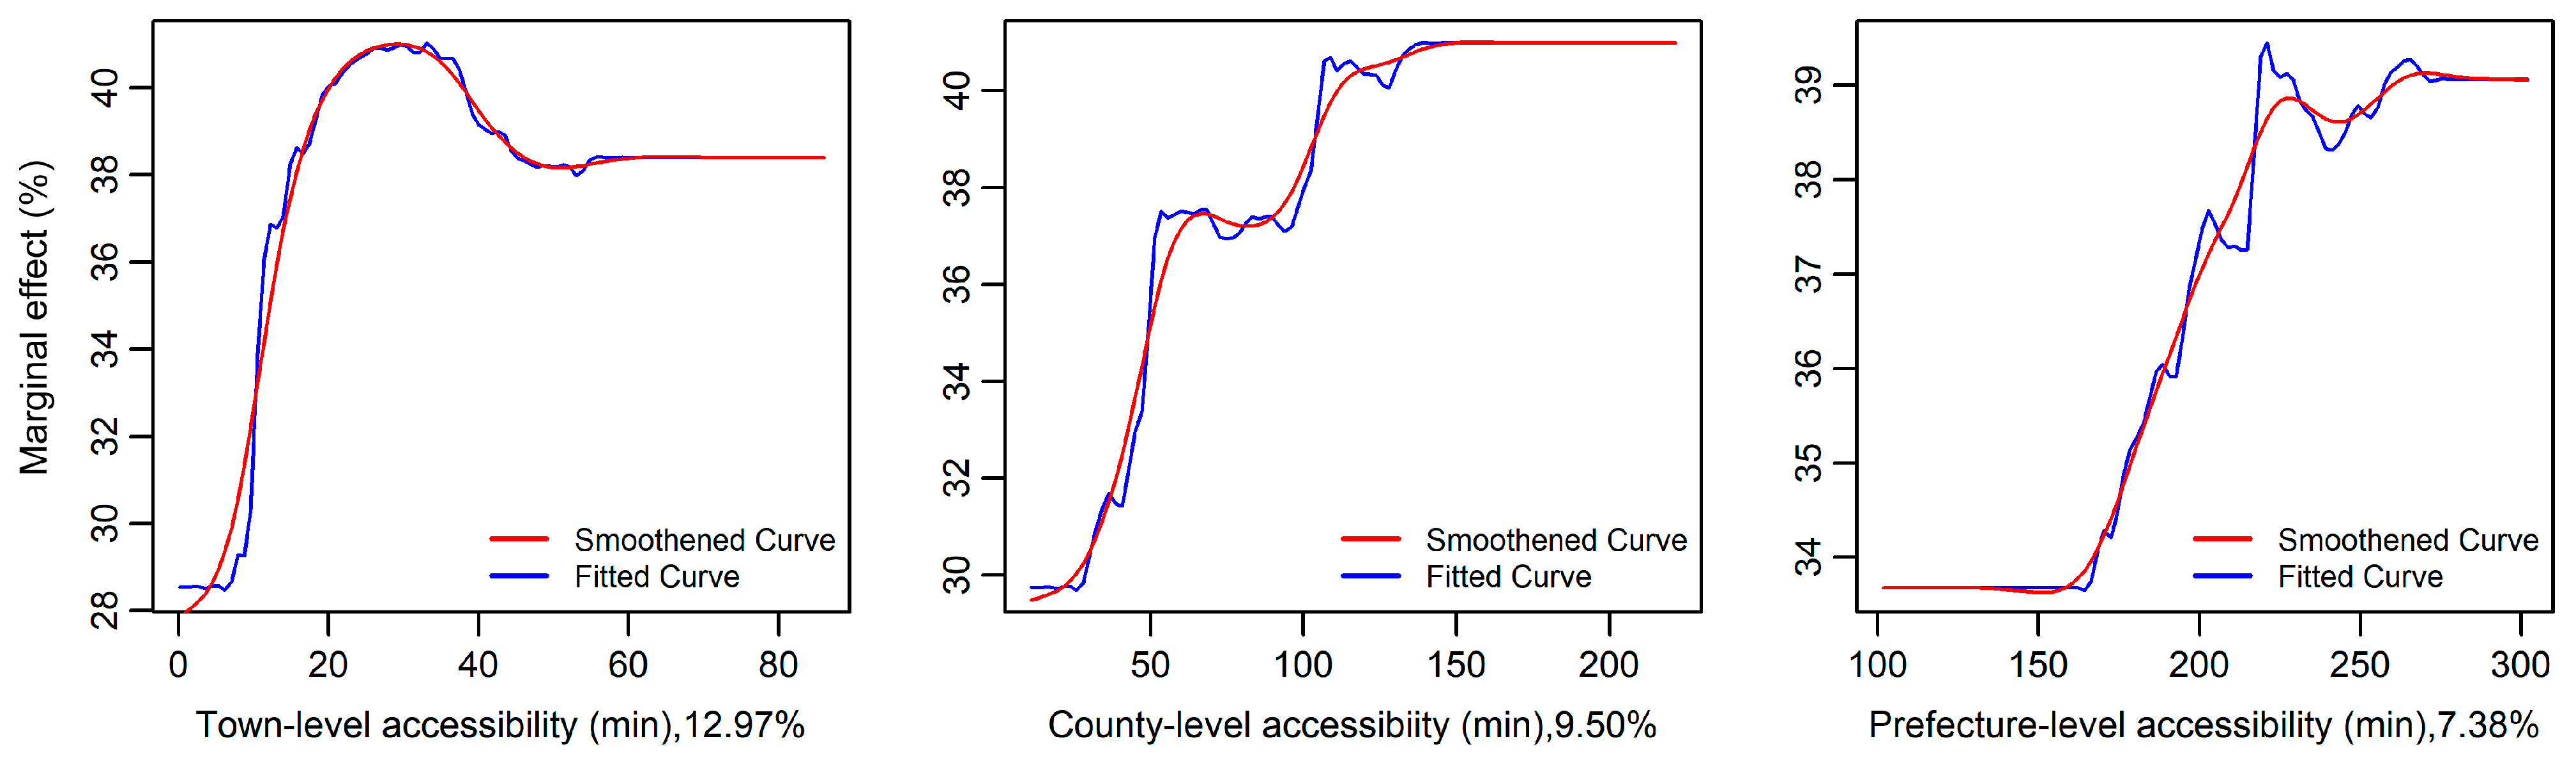
3.3. The Relationship between Independent Variables and RPI

We used the partial dependence plot to demonstrate the marginal effect of a variable on the RPI after controlling for all other variables in the model, as previous studies did. Regarding multiscale transport accessibility, all three accessibility variables have a nonlinear and positive relationship with the RPI (Figure 4). With respect to town-level accessibility, the marginal effect could reach nearly 10%, within the range of 10–20 min. When town-level accessibility is less than 8 min, it appears to have a limited impact on the RPI. Within this range, accessibility to public services and market opportunities of towns are relatively high; hence, the RPI is low. The RPI increases substantially as town-level accessibility moves into the range of 10–20 min. Further increases beyond 20 min do not substantially affect the RPI. However, when it exceeds 35 min, the RPI decreases slightly and then becomes stable. The effective ranges of county-level and prefecture-level accessibility is 25–55 min and 160–220 min, respectively, and their contributions to the RPI are approximately 6%. Below 25 min of county-level accessibility and 160 min of prefecture-level accessibility, the RPI does not change substantially and remains low. The different effective ranges of the three accessibility factors are congruent with central place theory.
Socioeconomic variables include the number of POIs and population density (Figure 5). The number of POIs has a negative association with the RPI. However, the association varies across the range of the variable, with a linear decrease below approximately 250 establishments and a flat line showing no effect on the RPI when the number of POIs exceeds 250. This finding is reasonable, as a greater number of POIs means that villagers enjoy more public services, education, jobs, and other opportunities, which can further increase villagers’ income and development opportunities. Overall, the population density is negatively associated with the RPI. As the population density grows from 50 to 120 people/km2, the RPI drops substantially. When the population density exceeds 150 peoples/km2, the RPI increases substantially, and it further increases beyond 200 peoples/km2, resulting in a stable RPI. This finding is consistent with the distribution of the RPI and population density illustrated by the violin graph (Figure 3a). This suggests that villages with high population density and high poverty incidence have high population pressure and an uncoordinated human–land relationship in Huining [14,41].
Figure 6 shows the relationship between water resources and the RPI. As expected, the distance to the nearest river has a positive association with the RPI, as water resources are the key resource of socioeconomic development in the Loess Plateau [41]. The influence of distance to the nearest river varies in two ranges. Specifically, when the distance to a river is less than 6 km, the RPI increases by approximately 5%. Then the RPI increases by approximately 6% when the distance to a river increases from 5 to 14 km, and the effect of a further increase beyond 14 km is negligible. This finding provides important implications for the spatial distribution of water sources.
Land-use-resource variables include the percentage of crop-land area, percentage of forest-land area, and percentage of grassland area (Figure 7). Although the overall association between the percentage of crop-land area and RPI is negative, in line with previous studies [4,23], the plot of the percentage of crop-land area is somewhat surprising. Below 30%, the RPI does not change much and remains high. When the percentage of crop-land area exceeds 48%, the crop-land area has a positive association with the RPI. Specifically, the RPI increases linearly as the proportion of crop land increases from 48% to 60%. The trend becomes stable when the crop-land area increases further beyond 58%. In Huining, villages where the proportion of crop-land area is less than 30% and greater than 48% are areas with a relatively low grain-production capacity and crop-land quality (Figure 2). Hence, because agriculture is still the main industry in Huining, this effect makes sense. In the range between 30% and 48%, the percentage of crop-land area has a negative association with the RPI. The percentage of forest-land area also has a negative relationship with the RPI, consistent with previous studies, as some projects, including “Grain for Green” and “Natural Forest Protection”, have had an important impact on rural production and lives [41,42,43]. In contrast, the percentage of grassland area has a positive association with the RPI.
Topography variables consist of the average elevation and average slope, which are both positively associated with the RPI (Figure 8). This result is consistent with previous studies [11,13]. When the average elevation is less than 1750 m, elevation has a limited impact on the RPI, which increases substantially when the elevation increases from 1750 m to approximately 2100 m. The RPI then remains stable with further increases in elevation. The most effective range of elevation is between 1750 and 2000 m. Meanwhile, slopes greater than 14 have the greatest effect in increasing the RPI.

4. Discussion and Policy Implications

As a measure of potential opportunities for interaction, accessibility has long been recognized as an important precondition for rural development and rural-poverty reduction [24,44]. However, mobility and accessibility remain major limitations for rural areas in developing countries [45]. In this study, we found that multiscale transport accessibility collectively has larger predictive power than other variables, and we identified the nonlinear association and effective ranges of multiscale transport accessibility to guide poverty-alleviation policy.
Most empirical studies have shown that many poor villages and communities are isolated due to poor accessibility and inadequate transport connectivity [9,21]. Similarly, in terms of rural poverty in mountainous regions, our study produced similar findings and further clarified the nonlinear and threshold effects of multiscale transport accessibility. Town-level accessibility, ranking third, contributes 12.97% to predicting the RPI, followed by county-level accessibility and prefecture-level accessibility. The effective ranges of multiscale transport accessibility on the RPI provide several important implications for resettlement planning in Huining. To maximize the influence on the RPI, special attention should be paid to 10–35 min for town-level accessibility, 30–55 min for county-level accessibility, and 160–220 min for prefecture-level accessibility, respectively. However, high-level transport accessibility is difficult to achieve for many towns located in peripheral mountainous regions, where accessibility is often lower, owing to topography (Figure 9). Hence, rural service-facility revitalization is of particular importance for promoting effective connections between targeted poverty alleviation and rural revitalization after achieving the goal of absolute poverty reduction.
Socioeconomic resources can directly impact rural poverty reduction by providing basic services, including education, healthcare, job opportunities, and markets [33]. In this study, the effective level of the number of POIs is less than 250 establishments. In this interval, the RPI drops by approximately 20%. The threshold effects of the number of POIs can provide guidance for governments and planners to determine the appropriate number of POIs within towns to reduce rural poverty. Moreover, human–land relation incompatibility is usually considered an external manifestation of regional poverty in specific areas. High-population pressure remains the main problem in some areas of the Loess Plateau, owing to the limited carrying capacity of resources and environments. When the population density exceeds 150 people/km2 in the villages of Huining, the RPI increases substantially. The threshold effects of population density on the RPI imply that the appropriate village population density is approximately 50–150 peoples/km2.
Land use is the material basis for production and life [46,47]. Crop land in Huining covers 285.8 thousand hm2, including 120.5 thousand hm2, with a slope greater than 15°. Crop land with a slope greater than 15° directly affects agricultural productivity, as steep slopes lead to water loss and soil erosion, reduce land accessibility, and increase the cost of farming [4]. Meanwhile, poor crop land quality greatly restricts agricultural productivity. Villages where the proportion of crop land area is less than 30% or higher than 48% are areas with relatively low crop land quality and low agricultural capacity. Land consolidation projects are an important means of reducing rural poverty and improving rural development [48,49]. Most research has shown that land consolidation plays an active role in increasing crop land area, promoting the scale of agricultural production, improving rural production and living conditions, alleviating ecological risk, and supporting rural development [26,50]. The percentage of forest land area also has a negative relationship with the RPI. Since the end of the last century, many ecological conservation projects, such as the “Grain for Green” and “Natural Forest Protection” projects, have been implemented in this area [41]. These projects have had an important impact on rural productivity and lives through measures such as stimulating the transformation of rural livelihoods, subsidies compensating for the opportunity cost of income foregone from retired cropland, improving the efficiency of the intensive farming of crop land, and affecting household labor allocation.
The average elevation is the most important variable for predicting the RPI, and the effective range is above 1750 m. Therefore, decreasing settlement isolation in areas above approximately 1800 m is an effective way to reduce poverty in Huining. The necessity of resettlement for poverty reduction in remote mountainous areas and arid and semiarid areas was studied previously [51]. However, various problems, such as financial pressure and influence on the sustainable livelihood of households after resettlement, must be avoided in the process of implementing resettlement policy. Some scholars have proposed selecting suitable resettlement plans according to local conditions, household realities, and poverty-stricken households’ ability to maximize the efficiency of poverty-alleviation resettlement planning [52].
This study has several limitations that deserve further research. One limitation relates to the causality between the variables and the RPI. This study uses cross-sectional data and can only identify associations between variables and not causality. The second concern is that the threshold effects may be location-specific. The generalizability of the findings merits further investigation.

5. Conclusions

Targeted understanding of the rural poverty problem is of particular importance for targeted poverty-alleviation policies. This study adopted the GBDT model to explore the nonlinear association and threshold effects of multiscale transport accessibility, including town-level, county-level, and prefecture-level accessibility, on the RPI after controlling for topography, land use, water resources, and socioeconomic factors. Our results provide a basis for effectively targeting poverty alleviation.
We investigated the relative importance of multiscale transport accessibility, topography, land-use resources, water resources, and socioeconomic factors in predicting the RPI. Multiscale transport accessibility collectively accounts for 29.85% of the predictive power for the RPI, confirming the important role of accessibility in determining the RPI. Specifically, town-level accessibility, ranking third, contributes 12.97% to predicting the RPI, followed by county-level accessibility (9.50%) and prefecture-level accessibility (7.38%). Among all other independent variables, socioeconomic resources collectively account for 27.09% of the predictive power for the RPI, followed by topography (21.25%), land-use resources (12.99%), and water resources (8.82%).
We further identified the nonlinear association and effective ranges of multiscale transport accessibility variables and other controlling variables. The three accessibility levels have the largest effects on the RPI when the town-level accessibility is 10–35 min, county-level accessibility is 30–55 min, and prefecture-level accessibility is 160–220 min. High population pressure remains a major main problem in some areas of the Loess Plateau, owing to the limit of the carrying capacity of resources and environments. The threshold effects of population density (approximately 50–150 people/km2) on the RPI suggest an appropriate population density for villages.

Author Contributions

Conceptualization, formal analysis, visualization, and writing—original draft, Leibo Cui; investigation, supervision, visualization, writing—original draft, and review and editing, Tao Li; data curation and investigation, Menglong Qiu; funding acquisition, Xiaoshu Cao. All authors have read and agreed to the published version of the manuscript.

Funding

The funding was provided by the National Natural Science Foundation of China (Grant No. 41831284 and No. 41901262); and The Fundamental Research Funds for the Central Universities, SNNU (Grant Nos. GK202103124).

Institutional Review Board Statement

Not applicable.

Informed Consent Statement

Not applicable.

Data Availability Statement

Not applicable.

Acknowledgments

The authors acknowledge the anonymous reviewers and the editors for their constructive comments that helped to improve the paper significantly.

Conflicts of Interest

The authors declare no conflict of interest.

References

  1. Haushofer, J.; Fehr, E. On the psychology of poverty. Science 2014, 344, 862–867. [Google Scholar] [CrossRef]
  2. Liu, Y.; Li, J. Geographic detection and optimizing decision of the differentiation mechanism of rural poverty in China. Acta Geogr. Sin. 2017, 72, 161–173. [Google Scholar]
  3. World Bank Group. Poverty and Shared Prosperity 2020; World Bank Group: Washington, DC, USA, 2020. [Google Scholar]
  4. Liu, M.; Hu, S.; Ge, Y.; Heuvelink, G.B.M.; Ren, Z.; Huang, X. Using multiple linear regression and random forests to identify spatial poverty determinants in rural China. Spat. Stat. 2020, 42, 100461. [Google Scholar] [CrossRef]
  5. Gutiérrez, J.; Cardozo, O.D.; García-Palomares, J.C. Transit ridership forecasting at station level: An approach based on distance-decay weighted regression. J. Transp. Geogr. 2011, 19, 1081–1092. [Google Scholar] [CrossRef]
  6. Ahlström, A.; Pilesjö, P.; Lindberg, J. Improved accessibility modeling and its relation to poverty—A case study in Southern Sri Lanka. Habitat Int. 2011, 35, 316–326. [Google Scholar] [CrossRef]
  7. Pozzi, F.; Robinson, T.; Nelson, A. Accessibility Mapping and Rural Poverty in the Horn of Africa; PPLPI Working Paper-Pro-Poor Livestock Policy Initiative; FAO: Rome, Italy, 2009; Volume 47, pp. 1–35. [Google Scholar]
  8. Cheng, X.; Shuai, C.-M.; Wang, J.; Li, W.-J.; Shuai, J.; Liu, Y. Building a sustainable development model for China’s poverty-stricken reservoir regions based on system dynamics. J. Clean. Prod. 2018, 176, 535–554. [Google Scholar] [CrossRef]
  9. Epprecht, M.; Müller, D.; Minot, N. How remote are Vietnam’s ethnic minorities? An analysis of spatial patterns of poverty and inequality. Ann. Reg. Sci. 2011, 46, 349–368. [Google Scholar] [CrossRef] [Green Version]
  10. Ma, Z.; Chen, X.; Chen, H. Multi-scale Spatial Patterns and Influencing Factors of Rural Poverty: A Case Study in the Liupan Mountain Region, Gansu Province, China. Chin. Geogr. Sci. 2018, 28, 296–312. [Google Scholar] [CrossRef] [Green Version]
  11. Okwi, P.O.; Ndeng’E, G.; Kristjanson, P.; Arunga, M.; Notenbaert, A.; Omolo, A.; Henninger, N.; Benson, T.; Kariuki, P.; Owuor, J. Spatial determinants of poverty in rural Kenya. Proc. Natl. Acad. Sci. USA 2007, 104, 16769–16774. [Google Scholar] [CrossRef] [Green Version]
  12. Scherr, S.J. A downward spiral? Research evidence on the relationship between poverty and natural resource degradation. Food Policy 2000, 25, 479–498. [Google Scholar] [CrossRef]
  13. Zhou, L.; Xiong, L.-Y. Natural topographic controls on the spatial distribution of poverty-stricken counties in China. Appl. Geogr. 2017, 90, 282–292. [Google Scholar] [CrossRef]
  14. Liu, Y.; Liu, J.; Zhou, Y. Spatio-temporal patterns of rural poverty in China and targeted poverty alleviation strategies. J. Rural Stud. 2017, 52, 66–75. [Google Scholar] [CrossRef]
  15. Liu, Y.; Xu, Y. A geographic identification of multidimensional poverty in rural China under the framework of sustainable livelihoods analysis. Appl. Geogr. 2016, 73, 62–76. [Google Scholar] [CrossRef]
  16. Yang, R.; Xu, Q.; Long, H. Spatial distribution characteristics and optimized reconstruction analysis of China’s rural settlements during the process of rapid urbanization. J. Rural Stud. 2016, 47, 413–424. [Google Scholar] [CrossRef]
  17. Bird, K.; Shepherd, A. Livelihoods and Chronic Poverty in Semi-Arid Zimbabwe. World Dev. 2003, 31, 591–610. [Google Scholar] [CrossRef]
  18. Watmough, G.R.; Marcinko, C.L.J.; Sullivan, C.; Tschirhart, K.; Mutuo, P.K.; Palm, C.A.; Svenning, J.-C. Socioecologically informed use of remote sensing data to predict rural household poverty. Proc. Natl. Acad. Sci. USA 2019, 116, 1213–1218. [Google Scholar] [CrossRef] [Green Version]
  19. Daimon, T. The Spatial Dimension of Welfare and Poverty: Lessons from a Regional Targeting Programme in Indonesia. Asian Econ. J. 2001, 15, 345–367. [Google Scholar] [CrossRef]
  20. Jalan, J.; Ravallion, M. Transient Poverty in Postreform Rural China. J. Comp. Econ. 1998, 26, 338–357. [Google Scholar] [CrossRef]
  21. Xu, J.; Song, J.; Li, B.; Liu, D.; Wei, D.; Cao, X. Do settlements isolation and land use changes affect poverty? Evidence from a mountainous province of China. J. Rural Stud. 2020, 76, 163–172. [Google Scholar] [CrossRef]
  22. Benevenuto, R.; Caulfield, B. Measuring access to urban centres in rural Northeast Brazil: A spatial accessibility poverty index. J. Transp. Geogr. 2020, 82, 102553. [Google Scholar] [CrossRef]
  23. Li, T.; Cao, X.; Qiu, M.; Li, Y. Exploring the Spatial Determinants of Rural Poverty in the Interprovincial Border Areas of the Loess Plateau in China: A Village-Level Analysis Using Geographically Weighted Regression. ISPRS Int. J. Geo-Inf. 2020, 9, 345. [Google Scholar] [CrossRef]
  24. Velaga, N.R.; Beecroft, M.; Nelson, J.D.; Corsar, D.; Edwards, P. Transport poverty meets the digital divide: Accessibility and connectivity in rural communities. J. Transp. Geogr. 2012, 21, 102–112. [Google Scholar] [CrossRef] [Green Version]
  25. Yang, D.; Song, W. Does the Accessibility of Regional Internal and External Traffic Play the Same Role in Achieving Anti-Poverty Goals? Land 2022, 11, 90. [Google Scholar] [CrossRef]
  26. Ying, L.; Dong, Z.; Wang, J.; Mei, Y.; Shen, Z.; Zhang, Y. Rural economic benefits of land consolidation in mountainous and hilly areas of southeast China: Implications for rural development. J. Rural Stud. 2020, 74, 142–159. [Google Scholar] [CrossRef]
  27. Friedman, J.H. Greedy function approximation: A gradient boosting machine. Ann. Stat. 2001, 29, 1189–1232. [Google Scholar] [CrossRef]
  28. Ding, C.; Cao, X.Y.; Næss, P. Applying gradient boosting decision trees to examine non-linear effects of the built environment on driving distance in Oslo. Transp. Res. Part A Policy Pract. 2018, 110, 107–117. [Google Scholar] [CrossRef]
  29. Zhang, W.; Zhao, Y.; Cao, X.; Lu, D.; Chai, Y. Nonlinear effect of accessibility on car ownership in Beijing: Pedestrian-scale neighborhood planning. Transp. Res. Part D Transp. Environ. 2020, 86, 102445. [Google Scholar] [CrossRef]
  30. HCBS. Huining Statistics Yearbook; Huining County Bureau of Statistics: Huining, China, 2019.
  31. Ge, Y.; Yuan, Y.; Hu, S.; Ren, Z.; Wu, Y. Space–time variability analysis of poverty alleviation performance in China’s poverty-stricken areas. Spat. Stat. 2017, 21, 460–474. [Google Scholar] [CrossRef]
  32. Li, Y.; Su, B.; Liu, Y. Realizing targeted poverty alleviation in China: People’s voices, implementation challenges and policy implications. China Agric. Econ. Rev. 2016, 8, 443–454. [Google Scholar] [CrossRef]
  33. Ren, Z.; Ge, Y.; Wang, J.; Mao, J.; Zhang, Q. Understanding the inconsistent relationships between socioeconomic factors and poverty incidence across contiguous poverty-stricken regions in China: Multilevel modelling. Spat. Stat. 2017, 21, 406–420. [Google Scholar] [CrossRef]
  34. Hansen, W.G. How Accessibility Shapes Land Use. J. Am. Inst. Plan. 1959, 25, 73–76. [Google Scholar] [CrossRef]
  35. Salas-Olmedo, M.H.; García, P.; Gutiérrez, J. Accessibility and transport infrastructure improvement assessment: The role of borders and multilateral resistance. Transp. Res. Part A Policy Pract. 2015, 82, 110–129. [Google Scholar] [CrossRef]
  36. Jiao, J.; Wang, J.; Jin, F.; Dunford, M. Impacts on accessibility of China’s present and future HSR network. J. Transp. Geogr. 2014, 40, 123–132. [Google Scholar] [CrossRef]
  37. Christaller, W. Central Place in Southern Germany; Prentice Hall: Englewood Cliffs, NJ, USA, 1966. [Google Scholar]
  38. Greg, R. Generalized Boosted Models: A Guide to the Gbm Package. Compute 2005, 1, 1–12. [Google Scholar]
  39. Schonlau, M. Boosted regression (boosting): An introductory tutorial and a Stata plugin. Stata J. 2005, 5, 330–354. [Google Scholar] [CrossRef]
  40. Watmough, G.R.; Atkinson, P.M.; Saikia, A.; Hutton, C.W. Understanding the Evidence Base for Poverty–Environment Relationships using Remotely Sensed Satellite Data: An Example from Assam, India. World Dev. 2016, 78, 188–203. [Google Scholar] [CrossRef]
  41. Wang, S.; Fu, B.; Chen, H.; Liu, Y. Regional development boundary of China’s Loess Plateau: Water limit and land shortage. Land Use Policy 2017, 74, 130–136. [Google Scholar] [CrossRef]
  42. Guo, Y.; Zhou, Y.; Liu, Y. Targeted poverty alleviation and its practices in rural China: A case study of Fuping county, Hebei Province. J. Rural Stud. 2019, 93, 430–440. [Google Scholar] [CrossRef]
  43. Li, E.; Deng, Q.; Zhou, Y. Livelihood resilience and the generative mechanism of rural households out of poverty: An empirical analysis from Lankao County, Henan Province, China. J. Rural Stud. 2019, 93, 210–222. [Google Scholar] [CrossRef]
  44. Porterfield, S.L.; McBride, T.D. The Effect of Poverty and Caregiver Education on Perceived Need and Access to Health Services Among Children With Special Health Care Needs. Am. J. Public Health 2007, 97, 323–329. [Google Scholar] [CrossRef]
  45. Barrios, E.B. Infrastructure and rural development: Household perceptions on rural development. Prog. Plan. 2008, 70, 1–44. [Google Scholar] [CrossRef]
  46. Guo, Y.Z.; Zhou, Y.; Cao, Z. Geographical patterns and anti-poverty targeting post-2020 in China. J. Geogr. Sci. 2018, 28, 1810–1824. [Google Scholar]
  47. Kupkanchanakul, W.; Kwonpongsagoon, S.; Bader, H.-P.; Scheidegger, R. Integrating Spatial Land Use Analysis and Mathematical Material Flow Analysis for Nutrient Management: A Case Study of the Bang Pakong River Basin in Thailand. Environ. Manag. 2015, 55, 1022–1035. [Google Scholar] [CrossRef]
  48. Li, Y.; Li, Y.; Fan, P.; Sun, J.; Liu, Y. Land use and landscape change driven by gully land consolidation project: A case study of a typical watershed in the Loess Plateau. J. Geogr. Sci. 2019, 29, 719–729. [Google Scholar] [CrossRef] [Green Version]
  49. Long, H. Land consolidation: An indispensable way of spatial restructuring in rural China. J. Geogr. Sci. 2014, 24, 211–225. [Google Scholar] [CrossRef]
  50. Zhou, Y.; Guo, L.; Liu, Y. Land consolidation boosting poverty alleviation in China: Theory and practice. Land Use Policy 2019, 82, 339–348. [Google Scholar] [CrossRef]
  51. Lo, K.; Xue, L.; Wang, M. Spatial restructuring through poverty alleviation resettlement in rural China. J. Rural Stud. 2016, 47, 496–505. [Google Scholar] [CrossRef]
  52. Yang, Y.Y.; de Sherbinin, A.; Liu, Y.S. China’s poverty alleviation resettlement: Progress, problems and solutions. Habitat Int. 2000, 98, 13. [Google Scholar] [CrossRef]
Figure 1. Location of Huining county. (a) The location of Huining county in China. (b) Location of Huining county in Loess Plateau. (c) Topography characteristics of Huining county.
Ijgi 11 00352 g001
Figure 2. Spatial distribution of explanatory variables.
Ijgi 11 00352 g002
Figure 3. The distribution and spatial pattern of RPI in Huining.
Ijgi 11 00352 g003
Figure 4. The relationships between multiscale transport accessibility and RPI.
Ijgi 11 00352 g004
Figure 5. The relationships between socioeconomic resources and RPI.
Ijgi 11 00352 g005
Figure 6. The relationships between water resources and RPI.
Ijgi 11 00352 g006
Figure 7. The relationships between land-use resources and RPI.
Ijgi 11 00352 g007
Figure 8. The relationships between topography and RPI.
Ijgi 11 00352 g008
Figure 9. High circuity of the road network in Huining (photo by author).
Ijgi 11 00352 g009
Table 1. Definition and descriptive statistics of variables.
Variable NameVariable DescriptionMeanStandard Deviation
Dependent Variable
Rural poverty incidence (RPI)Proportion of the impoverished population in a given village (%)36.930.31
Topography
ElevationAverage village elevation (m)1919.29120.95
SlopeAverage village slope (°)15.642.75
Land use resources
Crop landPercentage of crop-land area of each village (%)46.3611.58
Forest landPercentage of forest-land area of each village (%)2.365.64
GrasslandPercentage of grassland area of each village (%)49.6512.80
Water resources
Distance to riverDistance to nearest river (km)5.434.20
Socioeconomic resources
Population densityPopulations per km2 of each village (people/km2)110.1060.96
Point of interest (POI)Number of retails, service, and industrial facilities point of interest of each town (count)19.9136.09
Multiscale transport accessibility
Town-level accessibilityAccessibility to nearest town (min)23.7717.80
County-level accessibilityAccessibility to Huining county town (min)83.4943.27
Prefecture-level accessibilityAccessibility to Baiyin city (min)212.4639.36
Table 2. Relative importance of independent variables in predicting RPI.
VariablesOverall RankingRelative Importance (%)Total (%)
Topography
Elevation (m)215.6421.25
Slope (°)85.61
Land-use resources
Crop land (%)104.7112.99
Forest land (%)94.85
Grassland (%)113.43
Water resources
Distance to river (km)58.828.82
Socioeconomic resources
Population density (people/sq.km)67.4927.09
POI (count)119.60
Multiscale transport accessibility
prefecture-level accessibility (min)77.3829.85
county-level accessibility (min)49.50
town-level accessibility (min)312.97
Publisher’s Note: MDPI stays neutral with regard to jurisdictional claims in published maps and institutional affiliations.

