Article

Crime Prediction and Monitoring in Porto, Portugal, Using Machine Learning, Spatial and Text Analytics

1
CEGOT—Centre of Studies in Geography and Spatial Planning, Faculty of Arts and Humanities, University of Porto, Via Panorâmica s/n, 4150-564 Porto, Portugal
2
Data Science Institute, Saint Peter’s University, Jersey City, NJ 07306, USA
*
Author to whom correspondence should be addressed.
ISPRS Int. J. Geo-Inf. 2022, 11(7), 400; https://0-doi-org.brum.beds.ac.uk/10.3390/ijgi11070400
Submission received: 13 May 2022 / Revised: 5 July 2022 / Accepted: 12 July 2022 / Published: 14 July 2022

Abstract

:
Crimes are a common societal concern impacting quality of life and economic growth. Despite the global decrease in crime statistics, specific types of crime and feelings of insecurity, have often increased, leading safety and security agencies with the need to apply novel approaches and advanced systems to better predict and prevent occurrences. The use of geospatial technologies, combined with data mining and machine learning techniques allows for significant advances in the criminology of place. In this study, official police data from Porto, in Portugal, between 2016 and 2018, was georeferenced and treated using spatial analysis methods, which allowed the identification of spatial patterns and relevant hotspots. Then, machine learning processes were applied for space-time pattern mining. Using lasso regression analysis, significance for crime variables were found, with random forest and decision tree supporting the important variable selection. Lastly, tweets related to insecurity were collected and topic modeling and sentiment analysis was performed. Together, these methods assist interpretation of patterns, prediction and ultimately, performance of both police and planning professionals.

1. Introduction

Crime is defined as any act that is unlawful. The existence of crime, and more importantly the feelings of insecurity that may stem directly from it, affects quality of life and the sustainability of societies. Relevant policy and planning agendas such as the UN’s Sustainable Development Goals, UN Habitat’s Safer Cities Program, OECD’s well-being index [1] or the EU’s Cohesion Reports [2] clearly stress the need to create urban spaces where inhabitants feel safe and secure. In that sense, it has long been established that traditional crime fighting responses are not, in themselves, enough [3]. Already since the 1970s, but particularly in the last two decades, policing paradigms have shifted from reaction to prevention, and from analyzing just the perpetrator and contextual social factors, to take into account urban factors associated to space, time and the generation of opportunities.
Environmental criminology principles [4,5,6] are thus based on three main ideas. First that criminal behavior is significantly influenced by the contextual nature of the environment it occurs in, i.e., place matters [5], because it possesses individual characteristics that potentiate or mitigate crime. Second, the distribution of crime patterns is not random, because it is a consequence of such territorial conditions that vary in space and time. Third, by changing the characteristics and also by channeling resources (of police, of urban design or of social or cultural intervention) to these hot-spot locations, a significant reduction in insecurity can be obtained.
The proliferation of computer modelling, geographical information systems and geospatial technologies [7,8,9] has allowed for significant advances in crime georeferencing, mapping and hot-spotting. Such use of spatial data and analytics to improve performance and prevention has been dubbed as hot-spot policing [10,11], place-based policing [12] or even forensics GIS [13], part of what Couldren et al. [14] have called the new paradigm of “smart policing”, which also urges for greater integration and knowledge sharing between police organizations and research institutes, such as universities. On one hand, increasingly advanced methods as Space Syntax [15], as well as data mining and machine learning algorithms are being used to understand spatial patterns and even predict occurrences, using linear methods or Bayesian models [16,17,18]. These include, but are not limited to, random forest algorithm (RF) [19], decision tree [20,21], K-nearest neighbor (KNN) [22,23], support vector machine (SVM) [24] or artificial neural networks (ANN) [25]. On the other, authors such as Bannister et al. [26] have recently cautioned for the increasing dependency of results derived from Big Data and modelling algorithms, where “causation is dead, correlation is king” [26] (p. 323), because they privilege “method over meaning by adopting a non-critical approach to the spatial and temporal features of the data” [26] (p. 323). Furthermore, it is clear from the literature that the use of these techniques is more prevalent in certain countries, whereas other countries are still in the early stages of place-based policing, with a low academic and institutional culture of crime mapping or even crime georeferencing [27].
Consequently, these advances need to be properly framed and understood in local contexts. First, the impact that new technologies and this unprecedented capacity for data management and spatial analysis can have on evidence-based policing needs to be addressed. Second, how they can go beyond computation to a more holistic contribution to decision support, in line with the sharing and shifting of responsibilities promoted by new models of policing [28]. Third, as Andresen and Weisburd [12] suggest, how such theories, methods and models behave outside the locations where most of them have been developed and tested, namely outside larger metropolis and also in peripheral countries.
In this paper, these queries are addressed in a case study in Porto, Portugal. At the western edge of Europe and recently overcoming a deep financial crisis, Portugal is considered one of the safest countries in the world, holding the fourth worldwide position in the Global Peace Index [29] and presenting one of the lowest victimization rates in Europe [30], as well as a medium-threat status [31]. At the same time, it presents high fear of crime [32], something which may be reflected on the fact that it has one of the highest rates of police officers per inhabitant in Europe [33]. Furthermore, there is still a low crime mapping, georeferencing and spatial analysis culture in the country [27] and very few examples of crime modelling using space-based algorithms exist [34,35,36].
Using official registries of crime data from Porto’s Public Security Police from the pre-pandemic period between January 2016 to December 2018, this paper aims to contribute to the current literature on geospatial crime modelling by combining spatial analysis with machine learning to create an experimental predictive model. More than the use of the techniques themselves, the production of evidence- and space-based knowledge for urban safety is deemed crucial at a time when often scarce local resources need to be properly managed and integrated with planning and territorial agendas, catering for quality of life and sustainability.

2. Machine Learning, Sentiment Analysis and Topic Modelling in Crime Hot-Spotting and Prediction

The recent popularity of Criminology of Place research combined with the technological advances of the 21st Century, allowed for a “nascent literature of algorithmic approaches to time—and place—specific crime hot spot prediction” [26] (p. 323), where Big Data should be recognized as “profound new instruments of social perception” [37] (p. 7). In the last few years this has even been more pressing. Machine learning approaches have been widely applied in different fields, such as urban science, transport and pedestrian flow prediction, healthcare, biology, archeology, finance and even arts [38,39]. They have been used to monitor illegal activities [40,41] and to model and predict crime, with authors often comparing various methods [42,43,44,45,46].
For example, Lin et al. [42], working in Taiwan, proposed a data-driven method based on the broken windows theory to predict emerging crime hotspots, improving model performance by accumulating data with different time scales. Of all methods tested, deep learning algorithms, random forest and naïve Bayes provided better predictions. For Zhang et al. [43], however, the results based on the historical crime data and using built environment points of interests and urban road network density as co-variates to improve performance, suggested that the deep learning long short-term memory (LSTM) model outperformed others. In another recent study on the space-time patterns of theft in Manhattan, where an application prototype for searching safer parking was developed, Matijosaitiene et al. [44] discovered that linear models performed better. Comparing five boroughs of New York city, Pinto et al. [45] also uncovered that multivariate linear regression yielded a better accuracy at predicting the type of crime represented but decision trees were best at predicting the borough where the crime occurred.
Such findings should imply that considering place-specific conditions, rather than universal computation (a one-method fits all approach), should guide the use of these algorithms. Indeed, authors have applied machine learning methods to extract knowledge and predict crime data trends with underlying place-based social, urban and economic factors. Mittal et al. [46], for example, used machine learning in an Indian context to predict the causality between crime rates, such as of theft, robbery and burglary, with economic indicators, observing, in that case, that unemployment was the greatest explanatory variable.
Recurrent as well is the integration of these models with spatial analysis using geographical information systems (GIS), as a way to clarify space-time patterns, uncover spatial determinants and overall improve the geographical hot-spot and place-based approach of modern day Criminology of Place. For example, Bogomolov et al. [47] used aggregated behavioral Big Data derived from mobile phones in combination with basic demographic information, to predict if areas in London were prone to being crime hotspots or not, arriving at an accuracy of 70%. The experiments of Zhou et al. [48] arrive at similar conclusions, uncovering high efficiency and accuracy rates using a combined approach of a non-linear algorithms, gradient boost decision trees (GBDT) and GIS models, to assess the influence of over one thousand factors ranging from demographic, housing, education, economy, social and city planning. GBDT performed, in this case, better than other methods as logistic regression (LR), support vector machines (SVM), artificial neural networks (ANN) or random forest (RF).
Such area-specific crime prediction models, as Boni et al. [49] named them, should recognize the geographical non-homogeneity of crime patterns, something which fits with Weisburd’s Law of Crime Concentration [50]. In the case of Boni, hierarchical and multi-task statistical learning was used to predict crimes at ZIP code level, through localized models where sparseness was mitigated by sharing information across areas. Spatial-temporal prediction through the encoding of area-specific crime incidents was also applied, for example, by Zhang et al. [51] and Bappee et al. [52], showing results in compliance with Weisebud’s Law. The first used histogram-based statistical methods, discriminant analysis (LDA), and K-nearest neighbors (KNN), comparing patterns with neighborhood features and the temporal distance to important holidays, noticing greater performance as more fine-tuned the temporal data was. The second used hierarchical density-based spatial clustering of applications with noise (HDBSCAN) to extract hotpoints from crime hotspots for different categories of crime, then computing a spatial distance between the cluster centroids (i.e., hotpoints of crime hotspots) as a feature for classifiers. In this case LR and SVM displayed more accuracy than RF. Like those of spatial analysis, these area-specific and space-based results of machine learning can, to a certain extent, be displayed, interpreted and shared in web GIS applications, to assist in decision support of local authorities but also citizens [53].
Another point of debate is how to include non-structured data, related to perceptions, routines and overall sentiments of city dwellers. Moving beyond surveys, research has increasingly looked into mobile phone data as a proxy for activity patterns [47,54] but also extensively at social media, constructing sentiment analyses, i.e., based on emotions derived from the study of individual messages. Many of these have used Twitter data as a source, due to substantial use in many countries, the free availability of data and the fact that tweets are often associated to spatial and temporal coordinates [55,56,57,58,59]. In the United States, Gerber [55] showed how the use of Twitter data, through linguistic analysis and statistical topic modeling, improved the performance of prediction models for 19 of 25 types of crime, in comparison with a standard interpolation approach based on kernel density estimation. In India, Thanh et al. [56] found that sentiment analysis based on Twitter data led to results which matched with real crime rate data, whereas Wang et al. [57] display how a model including the automatic semantic analysis of Twitter posts combined with dimensionality reduction and prediction via linear modeling outperformed baseline models. Using data from nearby tweets of a criminal occurrence, Siriaraya et al. [58] also used sentiment analysis to uncover the negative characteristics of spatial areas related to different crimes, again emphasizing the relevance of a geographical baseline in such analysis.
Contrary to sentiment analysis, not many examples are found that have used topic modelling on crime-related data [60,61]. This method uses statistical machine learning techniques to identify patterns (as a verbal description) in a corpus or large amount of unstructured text. For example, Pandey et al. [60] analyzed crime reports from Los Angeles, evaluating topic coherence against spatial concentration, in a test of the Law of Crime Concentration. Their findings suggest that latent dirichlet allocation (LDA) generated crime-related topics with higher coherence and crime concentration, whereas non-negative matrix factorization (NMF) improved the coherence, but the spatial concentration was not as high.
As Bannister et al. [26] suggest, studies like these all have data limitations related to the representativeness of the social media data but also in connection with the accuracy of the geographical and temporal crime data used [62]. More research is needed into models that can cross detailed spatial analysis using GIS and official geo-temporal crime data, with the advances in machine learning and data-mining techniques.

3. Data and Methods

3.1. Case-Study Context

The case-study of this research is the city of Porto, in Portugal. The second city in the country, after the capital Lisbon, Porto is home to around 240,000 inhabitants [63]. Recent diagnoses have placed Porto as one of the cities with the highest reported levels of criminality in Portugal, registering particularly crimes against property (e.g., auto-thefts, pickpocketing, robbery of buildings); against people (notably physical integrity but also domestic violence, threat or coercion); crimes against society (such as forgery or drunk driving) and miscellaneous crimes (as narcotics traffic) [27] (p. 64). As a prime tourist destination in Europe, it is also prone to rises in non-violent street crime in the summer months [31]. The total number of registered crimes per year has been decreasing somewhat over the last decade in Porto (from around 16 to 14 thousand), yet the city has also lost inhabitants to peripheral suburbs, leading to a more or less steady number of 65 criminal occurrences per thousand inhabitants [64].

3.2. Data Sources

The crime data used in this study are confidential data purposely supplied to the research team by the Public Safety Police of Porto, as the only publicly available crime data in Portugal are the totals by municipality. This restricted and not georeferenced dataset consisted of a spread sheet, compiled by the police, containing the date, the hour, the typology, the parish and the street name of all reported crimes occurring inside the city limits between January 2016 and December 2018, amounting to around 42 thousand entries. Only 4% of data had not enough information to be georeferenced. The remainder, after extensively cleaning the database (mainly street names, which were not unified), was georeferenced by the research team at street segments, considering parish divisions.
Other datasets included census data, obtained from the Portuguese Institute of National Statistics [63], reporting from the last population census or more recent data, when available. This consisted of over 150 indicators at a city block level, related to building data (such as building type, age and type of use); dwelling data (such as size, typology, conditions and occupancy); population data (such as age, gender or education); family data (types, size, number of children) and employment data. Urban and land-use data were retrieved either from official sources of Porto’s Municipality or Open Street Maps when the first was unavailable. This includes land-use and points-of-interest; connectivity, road network and traffic signal data; as well as the location of police stations and CCTV cameras.
Tweets for topic modeling and sentiment analysis were extracted using Snscrape [65]. A radius of 1 km from all crime data points was considered to extract the tweets, and a specific set of terms related to crime in English and Portuguese were searched. Based on the literature analysis, a set of crime-related terms was prepared. The list consists of over fifty crime-related terms.

3.3. Methodology

Three types of methodological procedures were used to identify the crime pattern in the city, forecast crime rates and then predict crime as occurs/does not occur. These were geospatial analysis, machine learning modeling and natural language processing (NLP).
For understanding crime patterns, spatial analysis tools were applied to the dataset, using ArcGIS 10.7.1. After all datasets were merged and the final merged dataset was preprocessed and cleaned, crime entries were georeferenced considering street coordinates, and then plotted with a kernel density estimation (KDE), an interpolation technique often used in crime analysis, as it presents more precise results and is easily understood by stakeholders [66,67]. Although there is not a consensus regarding which parameters to use [68], authors have advocated that it is a very useful methodology to describe small local changes [69]. For that reason, and also catering to the smaller size of Portuguese cities, a cell size of 50 m was tested. This is smaller than those recently used in crime mapping literature as for example 63 m [67], 90 m [70] or 100 m [71], but consistent with previous research for Portugal [72]. Results were validated with officers from the Public Safety Police of Porto. Further emerging hot-spot analysis was performed [73], i.e., a data-mining technique which reveals which hot and cold spots have been maintained or changed over space and time. A fishnet grid was used, taking into account a larger cell size.
Considering this information, a random forest algorithm was used to predict the values of each location of a space-time cube. The tool builds two models for each location in cube, and then forecasts the future time phase values. The fit of the model is determined by the value of the forecast root mean square error (RMSE). A “windowing” technique is used, when for each location of the space-time cube two random forest regression models are built. The model uses the actual and then forecasted values to forecast the values for the future time steps. The model with a smaller RMSE is selected as the best fit model out of two models for each location of a space-time cube.
After understanding the point pattern of registered crimes, various machine learning analysis based on supervised methods were performed to determine the influence of contextual urban, morphological and socio-economic factors. Variable selection, in order to pick the most appropriate subset of predictors for the model, thus avoiding noise, complexity and multicollinearity issues, was carried out using LASSO regression (least absolute shrinkage and selection operator) [74]. Then, for the crime modeling, where crime rates were converted into a binary target—0 if no crime occurred and 1 if at least one crime occurred—four different classification methods were applied to predict crime classes 0 “No Crime Will Occur” or 1 “At Least One Crime Will Occur”. First logistic regression, where the sigmoid function is used to map the predictions to probabilities, where L-1 penalty is added to perform variable selection (i.e., to select only the most important for crime variables out of a large number of initial variables), which shrinks the coefficients of the less contributive variables to zero. Second, decision trees, a non-parametric supervised learning method where a model is built by splitting the data records until all or most of the records classify into their respective class labels 0 “No Crime Will Occur” or 1 “At Least One Crime Will Occur”. Decision trees are applied with the “pruning” of leaves and branches responsible for classification [75] to prevent tree-based model from overfitting. Overfitting happens when the model learns very well patterns in the training data and therefore, demonstrates a high model performance on the training data; however, it is unable to generalize the learned patterns on a new data. Third, random forest, where a large number of individual decision trees, constructed from samples taken from the training set, are considered, with each predicting a class and then an ensemble method determining the class with the most votes as the prediction of the model [76,77]. To build and train the random forest model, a random split on the features is also performed, in addition to a random selection of bootstrap samples. Fourth, support vector machine (SVM), which aims to allocate hyperplanes that specifically classify data points, i.e., the ones with the greatest difference between data points in both groups [78].
Lastly, two natural language processing methods, topic modeling and sentiment analysis, were used. The first, through latent dirichlet allocation (LDA) [79], classifies text in a document to a particular topic. For each document d, it processes each word w and computes p (topic t|document d), i.e., the proportion of words in document d that are assigned to topic t. Then p (word w|topic t), i.e., the proportion of assignments to topic t over all documents that come from the word w. On the other hand, sentiment analysis mines the text to identify and extract subjective information related, for example, to positive or negative sentiments [80]. An approach is to use machine learning and different functions to construct a classifier that can recognize sentimental text. Another, which does not include data training, is lexicon based and uses a variety of terms annotated by the polarity score. Both approaches can be merged into a third hybrid approach. Though, in this research, the two methods LDA and sentiment analysis are used separately as valuable additions to each other.

4. Porto’s Crime Pattern between 2016 and 2018

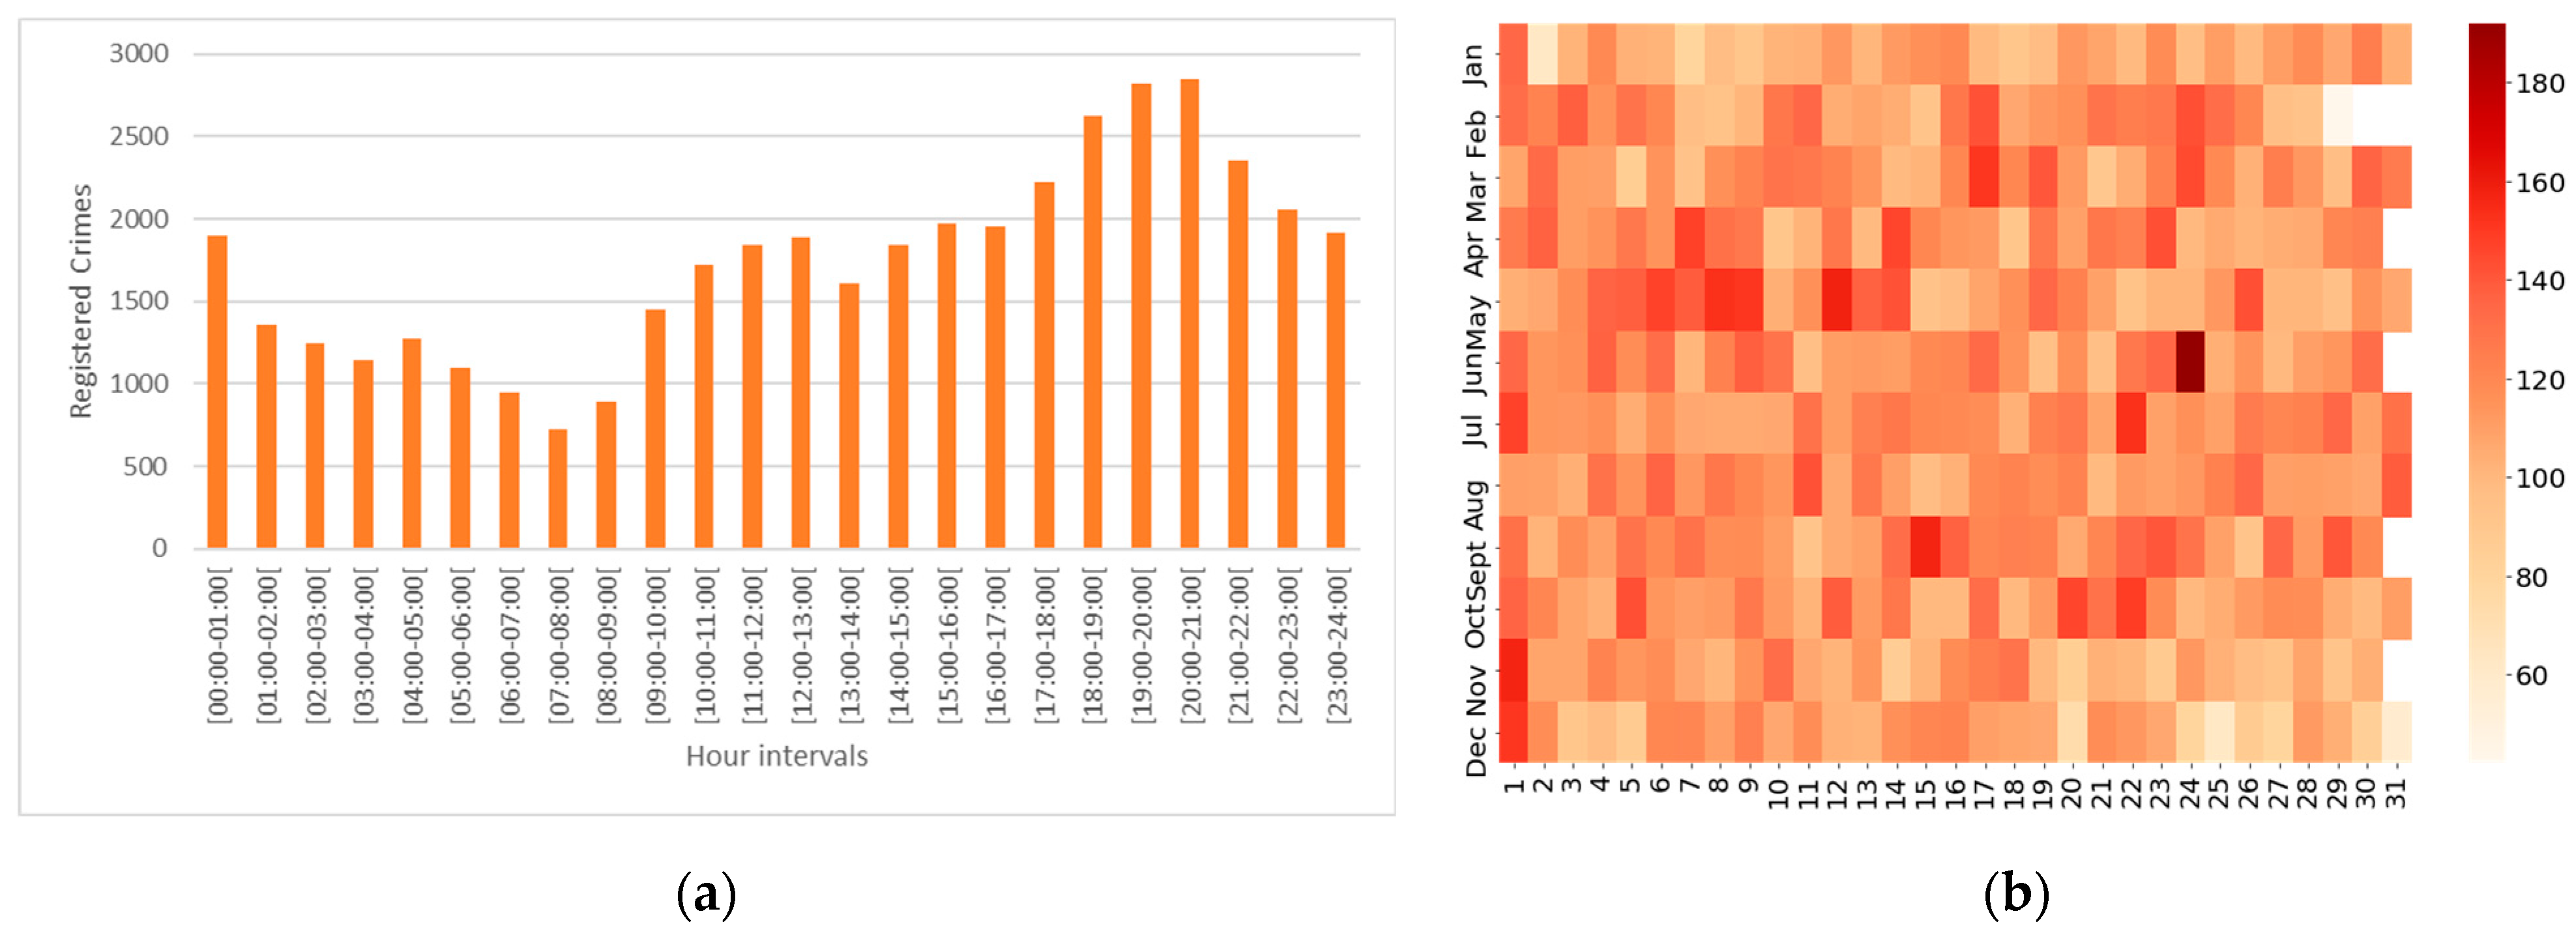
4.1. Statistical Pattern

Between 2016 and 2018, official police records contain a little over 42 thousand entries, of which around 1600 (3.8%) cannot be georeferenced at street level, due to lack of information in the registry or in the case of a crime where the victim is unable to know the exact location (e.g., a wallet theft). The total amount of registered crimes has been slightly augmenting, from around 13 thousand in 2016, to 14 thousand in 2017 and to around 14,500 in 2018. Consistent with national tendencies reported elsewhere [27], in Porto the most common types of crime are crimes against heritage/property (64%; including as the main subcategories auto theft and wallet theft) and crimes against people (18%; including offense against physical integrity, domestic violence or threats and coercion). These are followed by crimes against life in society (as drunk driving or gun trafficking) and miscellaneous crimes (as drug trafficking or driving without a license); with around 8% each. Other types of crimes, against cultural identity, against pets or against the state, account for less than 2%.
During the day (Figure 1a), crime occurrences gradually increase from 8 a.m. onward, peaking between 6 p.m. and 8 p.m., then gradually decreasing again, which indicates that the evenings are more crime-prone than any other time of the day. During the year (Figure 1b), the number of overall registered crimes per month is relatively steady (between 3200 and 3700), with the highest numbers occurring between May and September, something which corresponds to previous country assessments [31]. The days with the least reported crimes are associated to Christmas and New Year festivities (20, 25 and 31 December and 2 January), while the largest number of reported crimes are associated to other holidays: 24 June, the day of Porto’s municipal holiday (celebrated on the night of the 23) or 1 November, a religious holiday.

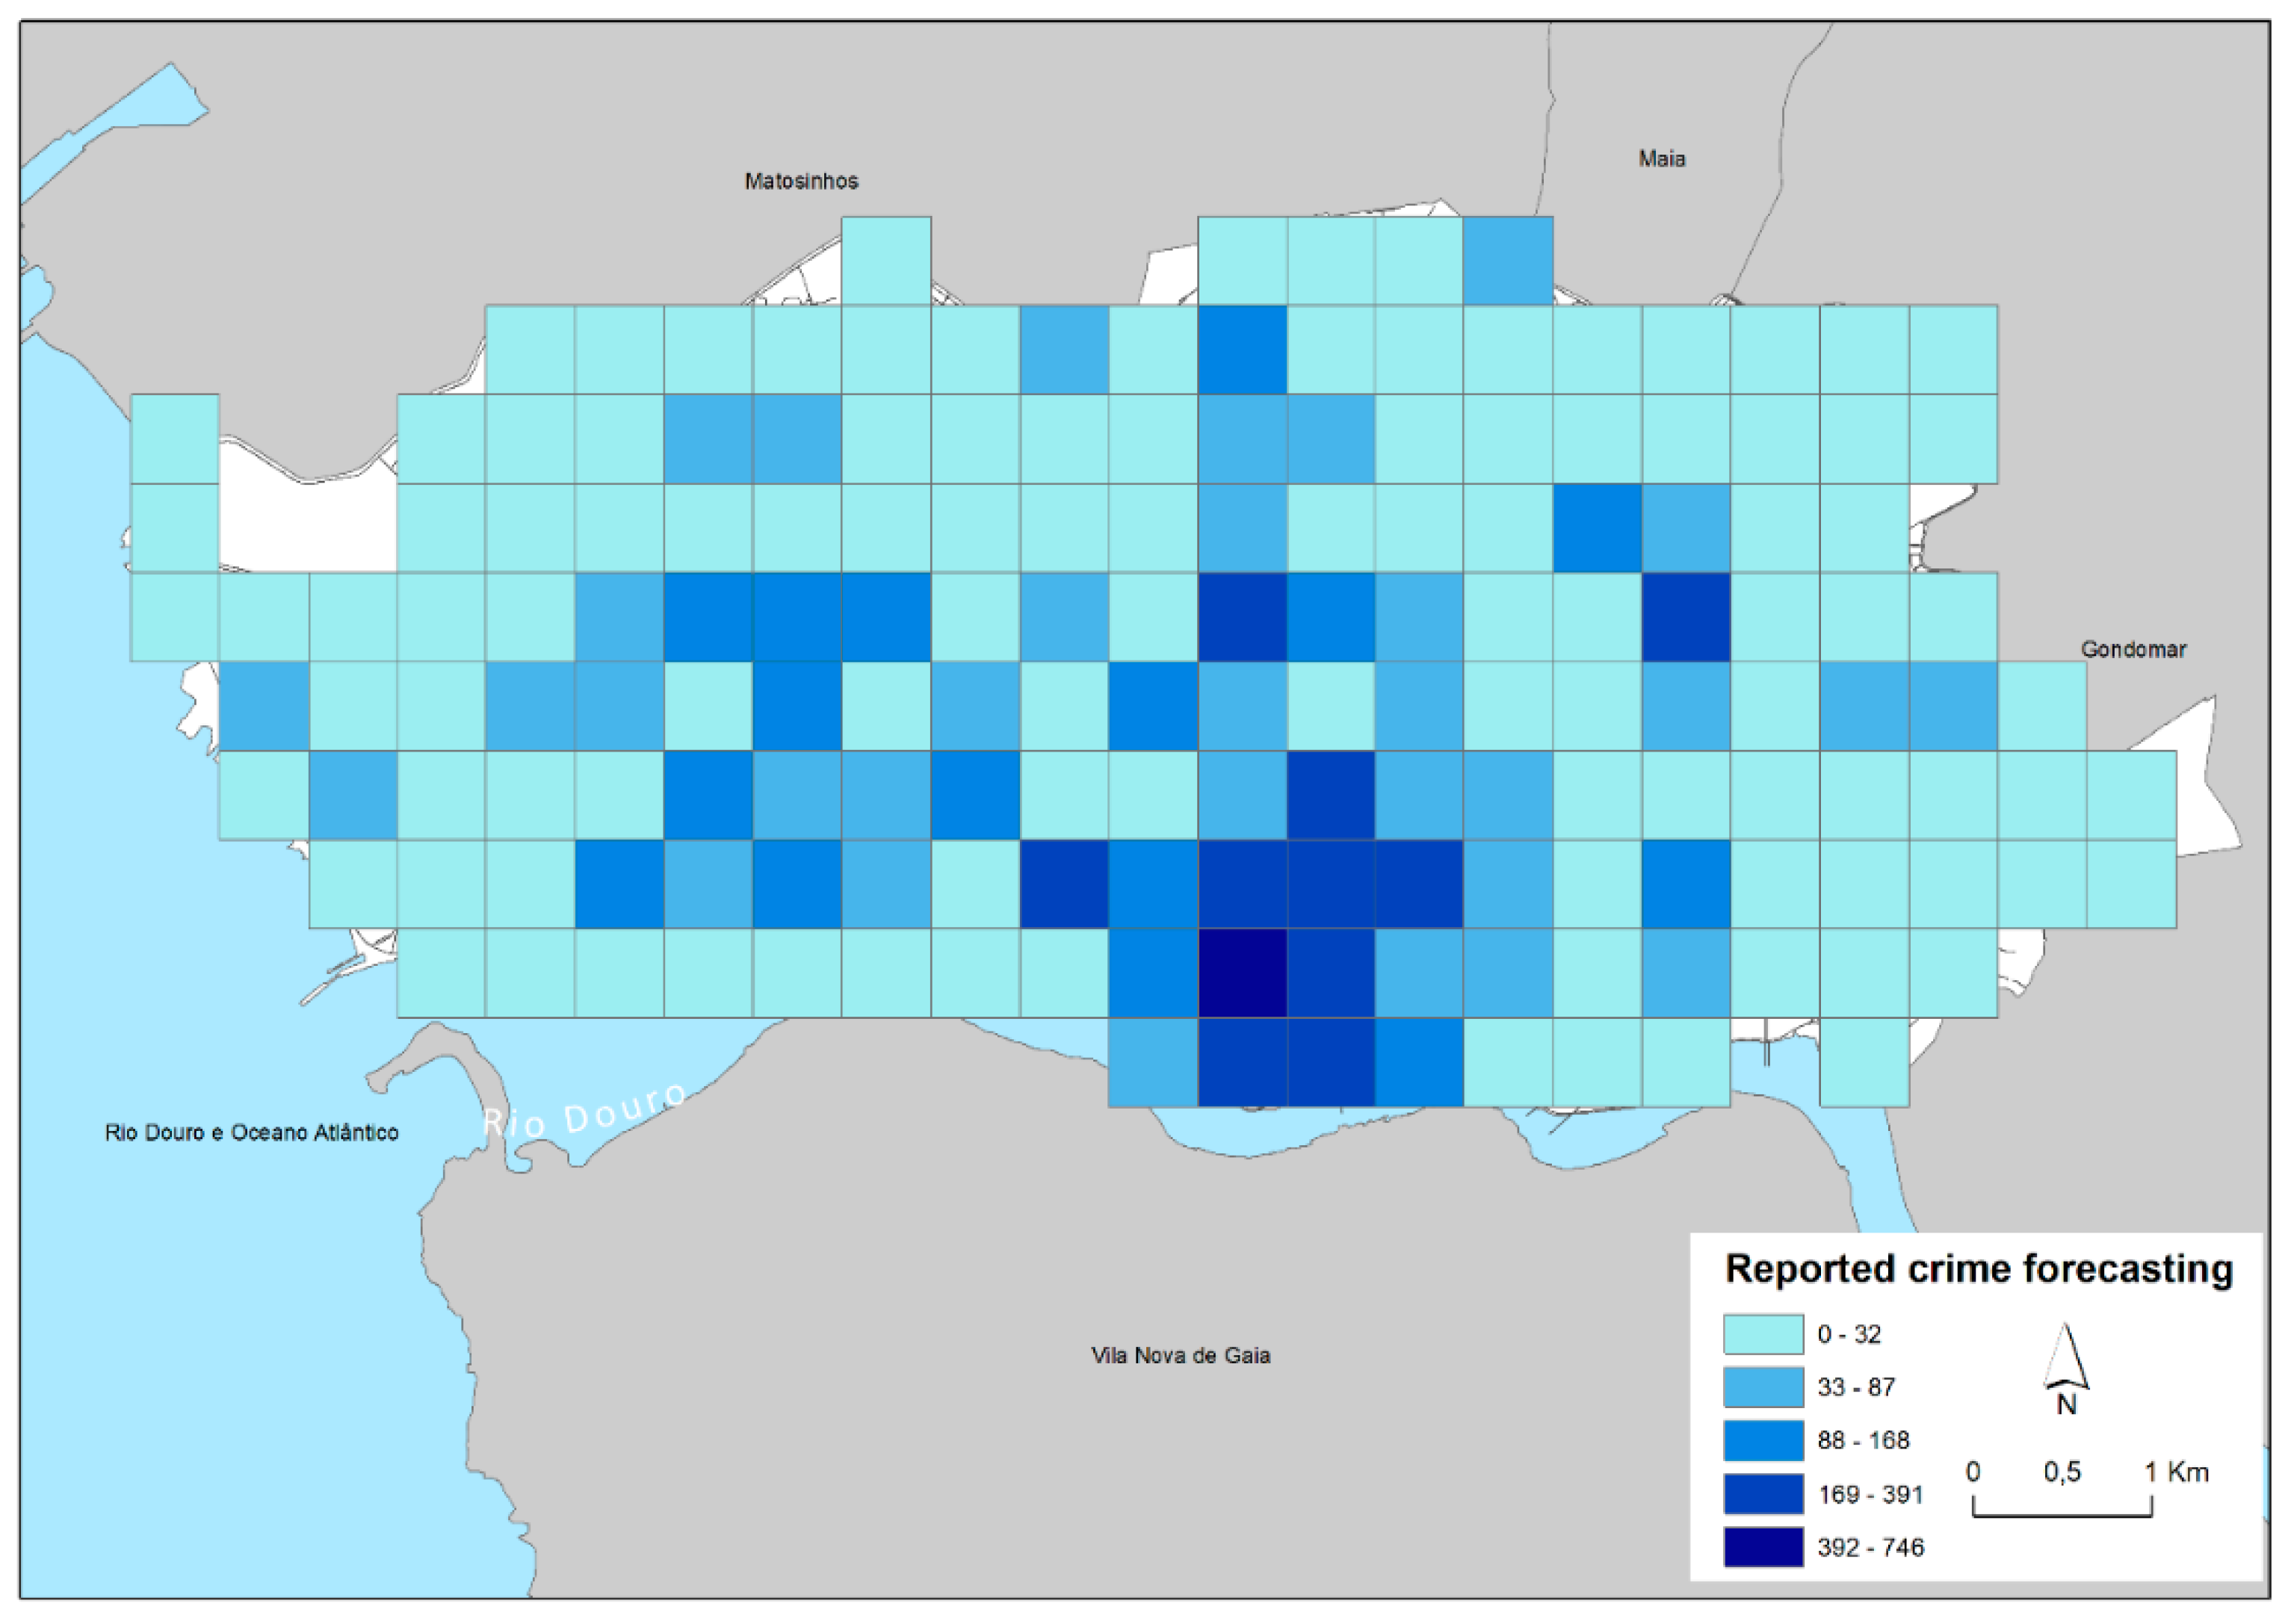
4.2. Spatial and Temporal Pattern

Figure 2 shows a KDE for Porto, based on the values of street segments. The Law of Crime Concentration is confirmed, as specific segments and areas of the city are more prone to criminal occurrences than others. This happens particularly in the downtown area (the greatest concentration) in and around the main pedestrian/shopping street of the city, Santa Catarina Street, and the main square where the City Hall is located (Aliados Avenue), both close to the city’s nighttime district. Elsewhere, noticeable concentrations also occur on the northern edge of the city, where the largest university campus and the city’s main hospital are located, and in other main avenues as Boavista Avenue (to the city’s west), Campo Alegre Street (west of the city center), Constituição Avenue (north of the city center), Costa Cabral or Fernando Magalhães Street (to the northeast).
Emerging hot-spot analysis was performed considering a space-time bin of 3 months (Figure 3). The downtown is confirmed as the most statistically significant hotspot of the city, being a hotspot for ninety percent or more of the time steps, including the final time step (intensifying and persistent hotspot, respectively). The Boavista and Campo Alegre areas have locations of consecutive hotspots (single uninterrupted run of statistically significant hotspot bins in the final time-steps), or sporadic hotspots (a location on-again then off-again hotspot). A small persistent hotspot pattern is witnessed up north around the Hospital/University campus. Noteworthy is the sporadic and particularly the new hotspot area (i.e., a location that is a statistically significant hotspot for the final time step and has never been a statistically significant hotspot before) west of the city center around the middle of Boavista Avenue.

4.3. Forecasting

Using clustering, an unsupervised machine learning tool, it is possible to identify natural patterns of clusters in the data. To obtain spatial clusters of crime in regard to census data, the latter was merged with crime data using a spatial join technique (i.e., a merged crime-census data is used as input into the clustering algorithm). Then DBSCAN clustering analysis was performed, where epsilon = 533 m (optimum radius for cluster analysis) was defined by the “elbow” method while plotting cluster distance against a wide range of possible epsilon values.
Then, to forecast the crime counts, random forest forecast tool within ArcGIS was used. Using the Breiman’s [81] extension of the random forest algorithm, the model forecasts the values of each space-time cube location, in this case performed on a cell size of 500m. The forecasting of crimes was performed for the twelve months after the dataset, from January 2019 to December 2019. Figure 4 demonstrates forecasted crime counts on the unseen test data set. The forecasted crime counts vary from 0 to 746 per square, with the highest crime density areas being in the center of the city and then along the main axes as previously identified. A new hotspot location has also been indicated.

5. Machine Learning for Crime Prediction

To apply machine learning methods for crime prediction, all datasets were spatially joined: Crime data, census data about buildings, dwellings, population, family and employment data, urban and land-use data with points-of-interest, connectivity, road network and traffic signals, locations of police stations and CCTV cameras.

5.1. Feature Selection with Lasso Regression

Lasso regression was applied to Porto’s crime data to select a subset of predictors that are the most important in terms of crime. Having fewer predictors that have a stronger predictive power decreases the prediction error and minimizes the computational time and resources, as well as prevents the prediction model from overfitting. Lasso regression uses L1 penalty that allows regression coefficients for unimportant and less important predictors to shrink to zero. The proportion of the training and test sets used for the Lasso regression was 67% and 33% accordingly. A positive regression coefficient indicates that as the value of the predictor variables increases, the value of the response variable also tends to increase. Whereas a negative regression coefficient suggests that as the predictor variable increases, the response variable tends to decrease. Variables “Population with a low level of schooling” and “Percentage of youngsters” have positive coefficients, and therefore, with the increase of these variables, crime rates tend to increase. Whereas variables “Population with a higher education (university degree)”, “Institutional families”, “Present population (male)”, “Classic family dwellings of usual residence with 1 or 2 rooms”, “Mainly residential buildings” and the presence of CCTV have negative coefficients, and therefore, with the increase of these variables crime rates tend to decrease.

5.2. Classification

Classification is a machine learning task that classifies records into classes by predicting and assigning them labels. There are many methods in the classification, in this study different classification algorithms were applied. For classification purposes, the target, i.e., crime rate, is transformed into a binary variable, where 0 means “No Crime Will Occur” and 1 means “At Least One Crime Will Occur”.
First, logistic regression with L1 penalty was applied to identify variables that are associated with crime as a binary target. To train and test the logistic regression model, records in the data set were divided into 70% train and 30% test sets. Using the grid search with cross-fold validation over a range of hyper-parameters allowed us to tune the best alpha = 0.151 for L1 penalty that selected the most important variables for the presence of reported crime. “Buildings with a wall structure in masonry with plate”, “Buildings built before 1919”, “Present population (male)”, “Buildings built between 1946 and 1960”, “Buildings built between 2006 and 2011” and CCTV have negative coefficients and, therefore, make crime less likely to occur. Whereas “Classic family dwellings of usual residence with 1 or 2 rooms”, “Population with a low level of schooling”, “Buildings with 5 or more floors” have positive coefficients and, therefore, make crime more likely to occur.
To build the SVM classification model, the grid search with cross-fold validation over a range of hyper-parameters allowed us to tune the best kernel = rbf, regularization parameter C = 1 and gamma parameter = 0.1.
Crime prediction models were also built using decision tree and random forest by tuning the hyper-parameters and using the grid search with cross-fold validation, as well as the support vector machine. Decision tree and random forest identified the following important variables: “Buildings (classic)”, “Residents with the 1st cycle of basic education” and “Present population (male)”. The model comparison Table 1 advises that the random forest has the best model performance accuracy = 0.832, recall = 0.99, precision = 0.79 and F1 score = 0.89. Random forest also provides a set of important for crime variables. Thus, the logistic regression model provides a detailed set of important for crime variables and impact (positive or negative) of these variables on crime, although it underperforms based on the precision metric.

5.3. Natural Language Processing (NLP)

To analyze the social activity and opinion dimension in regard to crime, tweets from Twitter were collected by using Snscrape library, a social networking service scraper in Python. The longitude and latitude of crime data points have been used to extract tweets within 1 km radius around crime locations. To try and relate to the crime pattern, in a first experimental iteration, tweets associated to words such as theft, burglary, arson, vandalism, violence, etc., in English and Portuguese were searched. These represented only a small amount of the total number of tweets in existence in this area, which may indicate that users do not log-in to report on crime-related subjects. In this case, around 1300 tweets were collected, with most of them actually associated to media sources, in particular the user “JornalNoticias” (literal translation: Newspaper of News), a Porto-based national Portuguese newspaper.
In Figure 5, these tweets are spatially plotted, and it can be seen that the biggest number of tweets are in and around downtown and, particularly, further south in the nightlife district of Ribeira, consistent with the persistence and intensifying hotspots of reported crime previously identified, as well as the areas where the forecasting was highest. Noticeable also is the concentrations in Campo Alegre (west of the city center) and in the Cerco social neighborhood (east of the city center), not temporal hotspot locations but with significant crime densities.

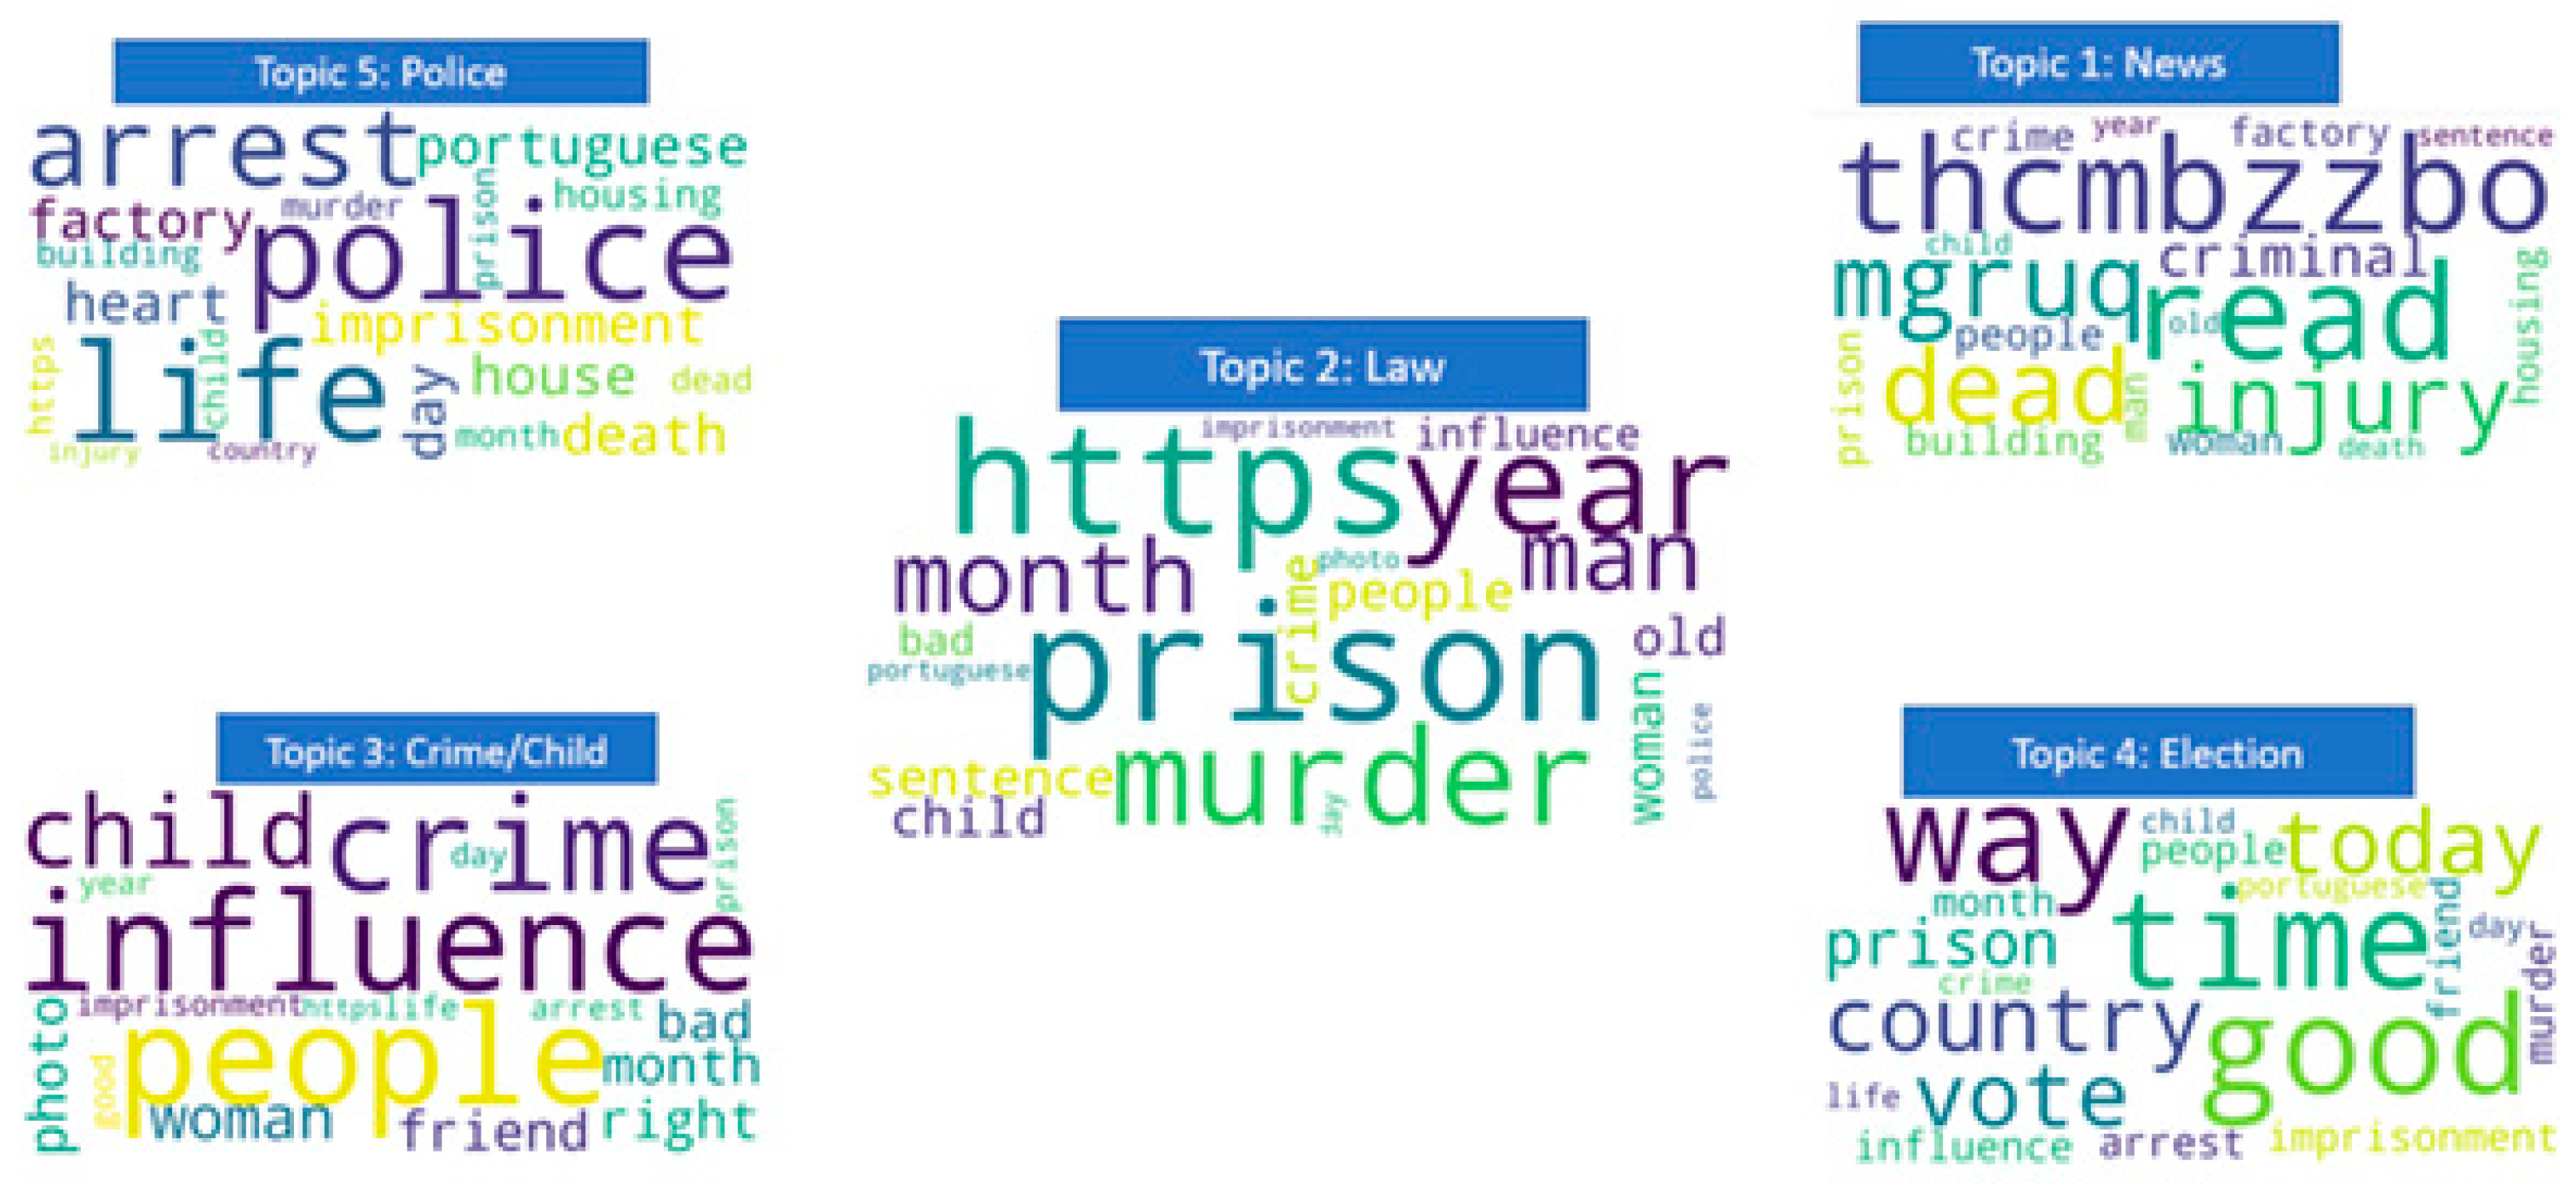
5.3.1. Topic Modeling (LDA)

Topic modeling is a type of statistical modeling that identifies the “topics” that occur in a collection of documents. Latent dirichlet allocation (LDA) is the method of topic modeling used in this research study. After cleaning the data (stemming, lemmatization and vectorization) and tuning the hyper-parameters using grid search and cross-fold validation, the LDA model was run, and the value of Log likelihood −56,491 and perplexity 134.68 was computed. Topics with different weights of tweets were computed (Figure 6), and from these topics, concerns of dwellers may be understood. The higher the weight, the bigger the word in the word cloud. As above seen, ordinary people may not directly tweet about crime; newspapers seem mostly to do that in Porto. So, words such as theft, burglary, battery, violence are not very common in the topics. On the contrary, other words more related to the sense of insecurity, including crime, police, police arrest, prison, murder, influence, people or injury, have high weight in their respective topics (Some non-topics such as “thcmbzzbo” or “mgruq” appear in this figure. This can be derived from incorrect spellings or a “personal language” used in the tweets. If a term does not make sense and is not a known abbreviation or slang, it was removed during text preprocessing).

5.3.2. Sentiment Analysis

Sentiment analysis is the mining of text which identifies and extracts subjective information of sentiment/opinion that can be positive or negative. For this analysis, the AFINN lexicon-based method was used. AFINN is a list of words rated for valence with an integer between minus five (negative) and plus five (positive). Figure 7 presents the word clouds of positive and negative sentiments found in the Tweeter analysis. Tweets including words such as love, god, win, book or awesome have high frequency in the most positive sentiments, whereas tweets such as prison, sentenced, killed and profane make the most negative sentiments.
Figure 8 demonstrates that the tweets have mostly a negative sentiment (negative values), in line with what was discussed above. The most negative segments are tweeted actually a little outside the main registered crime hotspots of the city center, to the southeast (in the Fontainhas and Campo 24 de Agosto neighborhoods) and to the northwest (around the main football stadium of the city). Negative sentiments are also seen in the middle of Boavista Avenue, to the west, the new hotspot. On the contrary, the most positive sentiments (2 being the maximum found in the [−5; 5] scale) are located in non-crime areas, such as Lordelo parish, the commercial/industrial area northwest and around the Oriental City Park, at the eastern edge of the city.

6. Discussion and Conclusions

The continuous evolution in the last 20 years of the mapping and modelling capacity of geospatial technologies has allowed for an unprecedented ability to understand the relationships between crime and place. This has definitely underlined the relevance of environmental criminology as a discipline and of its immediate contributions to decision making in terms of prevention, city management and support of cohesion and quality of life policies (in a general sense), as well as in terms of policing and micro-scale planning (in a more specific sense). It has become consensual that data-driven methods [26; 46] contribute effectively to the reduction of (real and perceived) insecurity, and that, within these, the geographical perception of patterns is paramount [82].
On one hand, crime does display concentrated and generally stable patterns over time, confirming for Porto the postulates of Weisburd’s Law of Crime Concentration [50] and the spatial principles of Environmental Criminology. The main concentration occurs in the downtown area, which is divided into persistent, consecutive but also intensifying hotspot areas, whereas other smaller concentrations have also been pinpointed, including a new hotspot location. The forecasting of crime counts allows following this trend, by showing these axes as those with higher potential for occurrences but also uncovering other locations that may display a rising trend. Along with a temporal perception (peaks in the late afternoon, and a May–September rise) this can be very relevant in the allocation of resources and in establishing prevention programs.
Obviously, this analysis was performed using for pre-pandemic data, the only kind available at the time of writing, so crime forecasting will be performed at a later stage and compared with actual values in order to further evaluate this model’s efficiency. However, as explained, the model was validated by using 30% of untouched data to compare to the basic reality, and it seems to fit with both the expected trends and the police stakeholders’ views of the territory, which have been consulted throughout this research. Additionally, the data are biased by the reporting of crime itself (not all crimes are reported), and all crimes of all typologies were considered in the forecasting and in the hotspotting, so fine-graining the analysis by crime categories would also be of importance to cater to different planning and prevention necessities. As discussed by other authors [83], the geographical analysis of crime patterns is conditioned by the level of geography used and how the spatial crime information has been supplied, in this case only by street segments, which have also been shown, in some locations, to perform worse than natural streets in the explanation of crime events [15]. Indeed, Space Syntax has often been used in crime prediction and could, in future research, be used to further test or enhance the results here presented. Furthermore, the visual representation of crime patterns, for example in kernel density estimation, is also very sensitive to parameter settings, as cell size and distance band. However, the initial iteration performed in this paper has revealed the importance of statistical and spatial modeling, as it is based on know-how often not possessed by institutions, but at the same time produces results that easily connect with, are understood and can be validated by stakeholders. It is proven that trans-disciplinary partnerships with universities and research centers can be the cornerstone for intelligence and place-based policing.
Nonetheless, on the other hand, although crime mapping supported by a combination of geospatial and statistical analysis is essential [84,85], authors call for a smarter aggregation of data [86], i.e., an integrated and holistic approach that includes additional, sometimes non-structured data sources reflecting the economic, morphological, social, perceptual or cultural context of urban areas to better optimize prevention, planning and cohesion policies [87,88,89]. In this research, machine learning methods, such as decision tree and random forest, aligned with the Lasso regression, plotted these dimensions together and revealed variables that, spatially and statistically, appear to have greater affinity with the increase in reported crime rates. These include the percentage of population with low level of schooling and the percentage of youngsters. On the contrary, places that have higher rates of population with a university degree, more CCTV and more males present in the population appear to relate less to crime rates. Building density and concentration of dwellings can appear as a catalyst for and against crime rates, depending on the method. However, even though the random forest prediction model demonstrated the best performance results (recall = 0.99 and precision = 0.79), we suggest applying results derived from the logistic regression, as it provides a broader set of important for crime variables with a direction of their effect on crime (positive or negative), as well as the size of that effect.
Overall, these results align with previous research. Higher density, walkable neighborhoods, a higher education and being a male are associated with lower fear of crime, whereas house characteristics do not display an unequivocal relationship [90]. Street population is strongly and positively related to crime, particularly female, as is concentrated disadvantage at the community level [89] and the presence of high-risk juveniles [91]. These studies also call attention to variables of collective efficacy. This was not directly approached in this research, but the topic modeling (LDA) of the Twitter data, although these data are also restricted in terms of users, themes and size of information (and hence cannot be deemed as an overall substitute for surveys, interviews and workshops with residents) was able to provide an expedite way to make a first iteration of how inhabitants feel about the city. As was to be expected, sentiments are mostly negative in discussing insecurity, close to the areas with higher rates of reported crime (the city center and Boavista) but also areas that are highly stigmatized and command media attention (such as the Cerco social neighborhood). Words such as “police”, “murder”, “injury” or “killed” reveal negative sentiments in these locations, while there is a close association of areas with low crime rates, such as green parks, with positive sentiments and words.
Such findings clearly reveal the importance of explanatory and predictive models in decision support and may steer the definition of place-specific policies but should be approached with caution. The capacity for pattern analysis is insightful and should definitely be a part of area diagnosis and monitoring. However, research should not end there, and the dependency of Big Data also hides great “dangers”, if meaning is lost [26]. First because correlation does not mean causality, and second, because, as discussed above, since micro-scale locations are complex urban and social systems, important variables related to personal and perceptual issues (for example those related to collective efficacy or defensible space) may be lost in computation or not computed at all. Universal algorithms and methods should be replaced by a deeper modelling and spatial understanding, and model outcomes should be the object of critique. After the identification of hotspots, a second stage of analysis should delve deeper into urban space, looking for the tangible and the intangible, understanding how quantifiable variables correlate at the micro-scale but also investigating the not immediately quantifiable, as community policing or CPTED teams have been doing for the recent decades. This way, spatial analysis and machine learning methods can effectively be used to properly frame these interventions, and more research and discussion in the scientific literature is required to raise awareness, increase know-how and avoid the fallacy of the “model for the model” of the “model without meaning”.

Author Contributions

Conceptualization, Miguel Saraiva and Irina Matijošaitienė; methodology, Miguel Saraiva and Irina Matijošaitienė; software, Miguel Saraiva, Irina Matijošaitienė, Saloni Mishra and Ana Amante; validation, Miguel Saraiva and Irina Matijošaitienė; investigation, Miguel Saraiva, Irina Matijošaitienė, Saloni Mishra and Ana Amante; data curation, Miguel Saraiva, Irina Matijošaitienė, Saloni Mishra and Ana Amante; writing—original draft preparation, Miguel Saraiva and Saloni Mishra; writing—review and editing, Miguel Saraiva and Irina Matijošaitienė; project administration, Miguel Saraiva and Irina Matijošaitienė; funding acquisition, Miguel Saraiva. All authors have read and agreed to the published version of the manuscript.

Funding

This research, as part of project CANVAS—Towards Safer and Attractive Cities: Crime and Violence Prevention through Smart Planning and Artistic Resistance, was supported by the European Regional Development Funds, through the COMPETE 2020—Operational Programme ‘Competitiveness and Internationalization’, under Grant POCI-01-0145-FEDER-030748. In addition, as part of the Centre of Studies on Geography and Spatial Planning (CEGOT) of the University of Porto, this work was partially supported by National Funds through the Portuguese Foundation for Science and Technology (FCT) under Grant UIDB/04084/2020.

Institutional Review Board Statement

Not applicable.

Informed Consent Statement

Not applicable.

Data Availability Statement

Not applicable.

Conflicts of Interest

The authors declare no conflict of interest.

References

  1. Organisation for Economic Co-operation and Development. How’s Life? OECD Publishing: Paris, France, 2020. [Google Scholar]
  2. My Region, My Europe, Our Future—Seventh Report on Economic, Social and Territorial Cohesion; European Commission: Luxembourg, 2017.
  3. Brantingham, P.L.; Brantingham, P.J. Situational crime prevention in practice. Can. J. Criminol. 1990, 32, 17. [Google Scholar] [CrossRef]
  4. Andresen, M.A. Environmental Criminology: Evolution, Theory, and Practice; Routledge: New York, NY, USA, 2014. [Google Scholar]
  5. Weisburd, D.; Eck, J.; Braga, A.; Telep, C.W.; Cave, B. Place Matters: Criminology for the Twenty-First Century; Cambridge University Press: New York, NY, USA, 2016. [Google Scholar]
  6. Wortley, R.; Townsley, M. Environmental Criminology and Crime Analysis; Routledge: New York, NY, USA, 2016. [Google Scholar]
  7. Leitner, M. Crime Modeling and Mapping Using Geospatial Technologies; Springer Science & Business Media: Berlin, Germany, 2013; Volume 8. [Google Scholar]
  8. Chainey, S.; Ratcliffe, J. GIS and Crime Mapping; John Wiley & Sons: Hoboken, NJ, USA, 2013. [Google Scholar]
  9. Kannan, M.; Singh, M. Geographical Information System and Crime Mapping; CRC Press: Boca Raton, FL, USA, 2020. [Google Scholar]
  10. Braga, A.; Papachristos, A.; Hureau, D. Hot spots policing effects on crime. Campbell Syst. Rev. 2012, 8, 1–96. [Google Scholar] [CrossRef]
  11. Weisburd, D.; Telep, C.W. Hot spots policing: What we know and what we need to know. J. Contemp. Crim. Justice 2014, 30, 200–220. [Google Scholar] [CrossRef]
  12. Andresen, M.A.; Weisburd, D. Place-based policing: New directions, new challenges. Polic. Int. J. 2018, 41, 310–313. [Google Scholar] [CrossRef] [Green Version]
  13. Elmes, G.A.; Roedl, G.; Conley, J. Forensic GIS: The Role of Geospatial Technologies for Investigating Crime and Providing Evidence; Springer: Dordrecht, The Netherlands, 2014; Volume 11. [Google Scholar]
  14. Coldren, J.R.; Huntoon, A.; Medaris, M. Introducing smart policing: Foundations, principles, and practice. Police Q. 2013, 16, 275–286. [Google Scholar] [CrossRef]
  15. Attig, S. The Organic Pattern of Space: A Space Syntax Analysis of Natural Streets and Street Segments for Measuring Crime and Traffic Accidents (Dissertation). 2019. Available online: http://urn.kb.se/resolve?urn=urn:nbn:se:kth:diva-264938 (accessed on 1 April 2022).
  16. Jordan, M.I.; Mitchell, T.M. Machine learning: Trends, perspectives, and prospects. Science 2015, 349, 255–260. [Google Scholar] [CrossRef] [PubMed]
  17. Zhao, X.; Tang, J. Modeling temporal-spatial correlations for crime prediction. In Proceedings of the 2017 ACM on Conference on Information and Knowledge Management, Singapore, 6–10 November 2017; pp. 497–506. [Google Scholar]
  18. Babakura, A.; Sulaiman, M.N.; Yusuf, M.A. Improved method of classification algorithms for crime prediction. In Proceedings of the 2014 International Symposium on Biometrics and Security Technologies (ISBAST), Kuala Lumpur, Malaysia, 26 August 2014; IEEE: Piscataway, NJ, USA; pp. 250–255. [Google Scholar]
  19. Alves, L.G.; Ribeiro, H.V.; Rodrigues, F.A. Crime prediction through urban metrics and statistical learning. Phys. A Stat. Mech. Its Appl. 2018, 505, 435–443. [Google Scholar] [CrossRef] [Green Version]
  20. Ivan, N.; Ahishakiye, E.; Omulo, E.O.; Taremwa, D. Crime Prediction Using Decision Tree (J48) Classification Algorithm. Int. J. Comput. Inf. Technol. 2017, 6, 188–195. [Google Scholar]
  21. Nasridinov, A.; Ihm, S.Y.; Park, Y.H. A decision tree-based classification model for crime prediction. In Information Technology Convergence; Springer: Dordrecht, The Netherlands, 2013; pp. 531–538. [Google Scholar]
  22. Tayal, D.K.; Jain, A.; Arora, S.; Agarwal, S.; Gupta, T.; Tyagi, N. Crime detection and criminal identification in India using data mining techniques. AI Soc. 2015, 30, 117–127. [Google Scholar] [CrossRef]
  23. Sivaranjani, S.; Sivakumari, S.; Aasha, M. Crime prediction and forecasting in Tamilnadu using clustering approaches. In Proceedings of the 2016 International Conference on Emerging Technological Trends (ICETT), Kollam, India, 21–22 October 2016; IEEE: Piscataway, NJ, USA; pp. 1–6. [Google Scholar]
  24. Kianmehr, K.; Alhajj, R. Effectiveness of support vector machine for crime hot-spots prediction. Appl. Artif. Intell. 2008, 22, 433–458. [Google Scholar] [CrossRef]
  25. Memon, Q.A.; Mehboob, S. Crime investigation and analysis using neural nets. In Proceedings of the 7th International Multi Topic Conference, 2003. INMIC 2003, Islamabad, Pakistan, 8–9 December 2003; IEEE: Piscataway, NJ, USA; pp. 346–350. [Google Scholar]
  26. Bannister, J.; O’Sullivan, A.; Bates, E. Place and time in the Criminology of Place. Theor. Criminol. 2019, 23, 315–332. [Google Scholar] [CrossRef]
  27. Saraiva, M.; Amante, A.; Marques, T.; Ferreira, M.; Maia, C. Perfis territoriais de criminalidade em Portugal (2009–2019). Finisterra 2021, 56, 49–73. [Google Scholar] [CrossRef]
  28. Freilich, J.D.; Newman, G.R. Situational Crime Prevention Oxford Research Encyclopedia of Criminology and Criminal Justice; Oxford University Press: Oxford, UK, 2017. [Google Scholar]
  29. Individualized Education Program. Global Peace Index 2021: Measuring Peace in a Complex World. 2021. Available online: https://www.visionofhumanity.org/wp-content/uploads/2021/06/GPI-2021-web-1.pdf (accessed on 1 April 2022).
  30. Grangeia, H.; Cruz, O.; Teixeira, R.; Alves, P. Vulnerabilidades urbanas: O caso da criminalidade associada às ourivesarias na cidade do Porto. Rev. Latit. 2013, 7, 69–89. [Google Scholar]
  31. Country Security Report. 2020. Available online: https://www.osac.gov/Country/Portugal/Content/Detail/Report/3e50b674-78b2-4997-8950-188df6d2cadf (accessed on 1 April 2022).
  32. Tulumello, S. Segurança urbana: Tendências globais, contradições portuguesas e tempos de crise. Cid. Em Reconstrução. Leituras Círitcas 2018, 2008–2018, 73–80. [Google Scholar]
  33. Eurostat. Crime and Criminal Justice Statistics. 2016. Available online: http://ec.europa.eu/eurostat/statistics-explained/index.php/MainPage (accessed on 1 April 2022).
  34. Ferreira, J.; João, P.; Martins, J. GIS for crime analysis-geography for predictive models. Electron. J. Inf. Syst. Eval. 2012, 15, 36–49. [Google Scholar]
  35. João, P. Modelo Preditivo de Criminalidade: Georeferenciação ao Concelho de Lisboa. Master’s Thesis, Universidade Nova de Lisboa, Lisboa, Portugal, 2009. [Google Scholar]
  36. Rodrigues, T.M.F.; Inácio, A.A.; Araújo, D.; Painho, M.; Henriques, R.; Cabral, P.d.C.B.; Oliveira, T.H.; Neto, M.d.C. SIM4SECURITY. In V Congresso Português de Demografia; A forecast and spatial analysis model for homeland security. Portugal 2030; Fundação Calouste Gulbenkian: Lisbon, Portugal, 2016. [Google Scholar]
  37. Innes, M.; Roberts, C.; Preece, A.; Rogers, D. Ten “Rs” of social reaction: Using social media to analyse the “post-event” impacts of the murder of Lee Rigby. Terror. Political Violence 2018, 30, 454–474. [Google Scholar] [CrossRef] [Green Version]
  38. Hu, S.; Gao, S.; Wu, L.; Xu, Y.; Zhang, Z.; Cui, H.; Gong, X. Urban function classification at road segment level using taxi trajectory data: A graph convolutional neural network approach. Comput. Environ. Urban Syst. 2021, 87, 101619. [Google Scholar] [CrossRef]
  39. Wu, H.; Lin, A.; Xing, X.; Song, D.; Li, Y. Identifying core driving factors of urban land use change from global land cover products and POI data using the random forest method. Int. J. Appl. Earth Obs. Geoinf. 2021, 103, 102475. [Google Scholar] [CrossRef]
  40. Abouheaf, M.; Qu, S.; Gueaieb, W.; Abielmona, R.; Harb, M. Responding to illegal activities along the Canadian coastlines using reinforcement learning. In Proceedings of the IEEE Instrumentation & Measurement Magazine, Catania, Italy, 12 April 2021; Volume 24, pp. 118–126. [Google Scholar] [CrossRef]
  41. Petrossian, G.A. Preventing illegal, unreported and unregulated (IUU) fishing: A situational approach. Biol. Conserv. 2015, 189, 39–48. [Google Scholar] [CrossRef]
  42. Lin, Y.L.; Chen, T.Y.; Yu, L.C. Using machine learning to assist crime prevention. In Proceedings of the 2017 6th IIAI International Congress on Advanced Applied Informatics (IIAI-AAI), Hamamatsu, Japan, 9–13 July 2017; IEEE: Piscataway, NJ, USA; pp. 1029–1030. [Google Scholar]
  43. Zhang, X.; Liu, L.; Xiao, L.; Ji, J. Comparison of machine learning algorithms for predicting crime hotspots. IEEE Access 2020, 8, 181302–181310. [Google Scholar] [CrossRef]
  44. Matijosaitiene, I.; McDowald, A.; Juneja, V. Predicting safe parking spaces: A machine learning approach to geospatial urban and crime data. Sustainability 2019, 11, 2848. [Google Scholar] [CrossRef] [Green Version]
  45. Pinto, M.; Wei, H.; Konate, K.; Touray, I. Delving into factors influencing New York crime data with the tools of machine learning. J. Comput. Sci. Coll. 2020, 36, 61–70. [Google Scholar]
  46. Mittal, M.; Goyal, L.M.; Sethi, J.K.; Hemanth, D.J. Monitoring the impact of economic crisis on crime in India using machine learning. Comput. Econ. 2019, 53, 1467–1485. [Google Scholar] [CrossRef]
  47. Bogomolov, A.; Lepri, B.; Staiano, J.; Oliver, N.; Pianesi, F.; Pentland, A. Once upon a crime: Towards crime prediction from demographics and mobile data. In Proceedings of the 16th International Conference on Multimodal Interaction, Istanbul, Türkiye, 12–16 November 2014; pp. 427–434. [Google Scholar]
  48. Zhou, J.; Li, Z.; Ma, J.J.; Jiang, F. Exploration of the hidden influential factors on crime activities: A big data approach. IEEE Access 2020, 8, 141033–141045. [Google Scholar] [CrossRef]
  49. Al Boni, M.; Gerber, M.S. Area-specific crime prediction models. In Proceedings of the 2016 15th IEEE International Conference on Machine Learning and Applications (ICMLA), Anaheim, CA, USA, 18–20 December 2016; IEEE: Piscataway, NJ, USA; pp. 671–676. [Google Scholar]
  50. Weisburd, D. The law of crime concentration and the criminology of place. Criminology 2015, 53, 133–157. [Google Scholar] [CrossRef]
  51. Zhang, Q.; Yuan, P.; Zhou, Q.; Yang, Z. Mixed spatial-temporal characteristics based crime hot spots prediction. In Proceedings of the 2016 IEEE 20th International Conference on Computer Supported Cooperative Work in Design (CSCWD), Nanchang, China, 4–6 May 2016; IEEE: Piscataway, NJ, USA; pp. 97–101. [Google Scholar]
  52. Bappee, F.K.; Junior, A.S.; Matwin, S. Predicting crime using spatial features. In Proceedings of the Canadian Conference on Artificial Intelligence, Toronto, Canada, 8–11 May 2018; Springer: Cham, Switzerland; pp. 367–373. [Google Scholar]
  53. Chen, Y. Crime Mapping Powered by Machine Learning and Web GIS. Ph.D. Thesis, California State University, Northridge, CA, USA, 2019. [Google Scholar]
  54. He, L.; Páez, A.; Jiao, J.; An, P.; Lu, C.; Mao, W.; Long, D. Ambient population and larceny-theft: A spatial analysis using mobile phone data. ISPRS Int. J. Geo-Inf. 2020, 9, 342. [Google Scholar] [CrossRef]
  55. Gerber, M. Predicting crime using Twitter and kernel density estimation. Decis. Support Syst. 2014, 61, 115–125. [Google Scholar] [CrossRef]
  56. Vo, T.; Sharma, R.; Kumar, R.; Son, L.H.; Pham, B.T.; Tien Bui, D.; Priyadarshini, I.; Sarkar, M.; Le, T. Crime rate detection using social media of different crime locations and Twitter part-of-speech tagger with Brown clustering. J. Intell. Fuzzy Syst. 2020, 38, 4287–4299, (Preprint). [Google Scholar] [CrossRef]
  57. Wang, X.; Gerber, M.S.; Brown, D.E. Automatic crime prediction using events extracted from twitter posts. In Proceedings of the International Conference on Social Computing, Behavioral-Cultural Modeling, and Prediction, College Park, MD, USA, 3–5 April 2012; Springer: Berlin, Heidelberg; pp. 231–238. [Google Scholar]
  58. Siriaraya, P.; Zhang, Y.; Wang, Y.; Kawai, Y.; Mittal, M.; Jeszenszky, P.; Jatowt, A. Witnessing crime through Tweets: A crime investigation tool based on social media. In Proceedings of the 27th ACM SIGSPATIAL International Conference on Advances in Geographic Information Systems, Chicago, IL, USA, 5–8 November 2019; pp. 568–571. [Google Scholar]
  59. El Hannach, H.; Benkhalifa, M. WordNet based implicit aspect sentiment analysis for crime identification from twitter. Int. J. Adv. Comput. Sci. Appl. 2018, 9, 150–159. [Google Scholar] [CrossRef]
  60. Pandey, R.; Mohler, G.O. Evaluation of crime topic models: Topic coherence vs. spatial crime concentration. In Proceedings of the 2018 IEEE International Conference on Intelligence and Security Informatics (ISI), Miami, FL, USA, 9–11 November 2018; IEEE: Piscataway, NJ, USA; pp. 76–78. [Google Scholar]
  61. Kuang, D.; Brantingham, P.J.; Bertozzi, A.L. Crime topic modeling. Crime Sci. 2017, 6, 12. [Google Scholar] [CrossRef]
  62. Tompson, L.; Johnson, S.; Ashby, M.; Perkins, C.; Edwards, P. UK open source crime data: Accuracy and possibilities for research. Cartogr. Geogr. Inf. Sci. 2015, 42, 97–111. [Google Scholar] [CrossRef] [Green Version]
  63. Instituto Nacional de Estatistica. Main Indicators. Instituto Nacional de Estatistica (INE), Lisbon, Portugal. 2012. Available online: http://www.ine.pt/xportal/xmain?xpid=INE&xpgid=inemain (accessed on 1 April 2022).
  64. Saraiva, M.; Amante, A. Geografia do bem-estar: Insegurança: O caso dos crimes contra as pessoas no Grande Porto. In Geografia do Porto; Fernandes, R., Ed.; Book Cover: Porto, Portugal, 2020; pp. 202–211. ISBN 9789898898517. [Google Scholar]
  65. GitHub—JustAnotherArchivist/Snscrape: A Social Website. Available online: www.github.com/JustAnotherArchivist/snscrape (accessed on 1 April 2022).
  66. Chainey, S.; Tompson, L.; Uhlig, S. The utility of hotspot mapping for predicting spatial patterns of crime. Secur. J. 2008, 21, 4–28. [Google Scholar] [CrossRef]
  67. Kalinic, M.; Krisp, J.M. Kernel density estimation (KDE) vs. hot-spot analysis–detecting criminal hot spots in the city of San Francisco. In Proceedings of the 21 Conference on Geo-Information Science, Lund, Sweden, 12–15 June 2018. [Google Scholar]
  68. Eck, J.; Chainey, S.; Cameron, J.; Wilson, R. Mapping Crime: Understanding Hotspots; U.S. Department of Justice Office of Justice Programs: Washington, DC, USA, 2005.
  69. Jansenberger, E.M.; Staufer-Steinnocher, P. Dual kernel density estimation as a method for describing spatio-temporal changes in the upper Austrian food retailing market. In Proceedings of the 7th AGILE Conference on Geographic Information Science, Heraklion, Crete, Greece, 29 April – 1 May 2004. [Google Scholar]
  70. Chainey, S.P. Examining the influence of cell size and bandwidth size on kernel density estimation crime hotspot maps for predicting spatial patterns of crime. Bull. Geogr. Soc. Liege 2013, 60, 7–19. [Google Scholar]
  71. Hu, Y.; Wang, F.; Guin, C.; Zhu, H. A spatio-temporal kernel density estimation framework for predictive crime hotspot mapping and evaluation. Appl. Geogr. 2018, 99, 89–97. [Google Scholar] [CrossRef]
  72. Meneses, B.M.; Reis, E.; Reis, R.; Vale, M.J. The effects of land use and land cover geoinformation raster generalization in the analysis of LUCC in Portugal. ISPRS Int. J. Geo-Inf. 2018, 7, 390. [Google Scholar] [CrossRef] [Green Version]
  73. Ord, J.K.; Getis, A. Local spatial autocorrelation statistics: Distribution issues and an application. Geogr. Anal. 1995, 27, 286–306. [Google Scholar] [CrossRef]
  74. Tibshirani, R. Regression shrinkage and selection via the lasso. J. R. Stat. Soc. Ser. B (Methodol.) 1996, 58, 267–288. [Google Scholar] [CrossRef]
  75. Du, W.; Zhan, Z. Building Decision Tree Classifier on Private Data. Electrical Engineering and Computer Science. 2002. Available online: https://surface.syr.edu/eecs/8 (accessed on 1 April 2022).
  76. Ho, T.K. Random decision forests. In Proceedings of the 3rd International Conference on Document Analysis and Recognition, Montreal, QC, Canada, 14–16 August 1995; IEEE: Piscataway, NJ, USA; Volume 1, pp. 278–282. [Google Scholar]
  77. Ho, T.K. The random subpace method for constructing decision forests. IEEE Trans. Pattern Anal. Mach. Intell. 1998, 20, 832–844. [Google Scholar]
  78. Wang, L. (Ed.) Support Vector Machines: Theory and Applications; Springer Science & Business Media: Berlin, Germany, 2005; Volume 177. [Google Scholar]
  79. Blei, D.M.; Ng, A.Y.; Jordan, M.I. Latent dirichlet allocation. J. Mach. Learn. Res. 2003, 3, 993–1022. [Google Scholar]
  80. Liu, B. Sentiment analysis and subjectivity. Handb. Nat. Lang. Processing 2010, 2, 627–666. [Google Scholar]
  81. Breiman, L. Bagging predictors. Mach. Learn. 1996, 24, 123–140. [Google Scholar] [CrossRef] [Green Version]
  82. Lasierra, F.G. Detecting and tackling the different levels of subjective security1. In The Dimensions of Insecurity in Urban Areas; Barabás, A.T., Ed.; National Institute of Budapest: Budapest, Hungary, 2018. [Google Scholar]
  83. Solymosi, R.; Bowers, K.; Fujiyama, T. Mapping fear of crime as a context-dependent everyday experience that varies in space and time. Leg. Criminol. Psychol. 2015, 20, 193–211. [Google Scholar] [CrossRef]
  84. LeBeau, J.L.; Leitner, M. Introduction: Progress in research on the geography of crime. Prof. Geogr. 2011, 63, 161–173. [Google Scholar] [CrossRef]
  85. Bunting, R.J.; Chang, O.Y.; Cowen, C.; Hankins, R.; Langston, S.; Warner, A.; Yang, X.; Louderback, E.R.; Roy, S.S. Spatial patterns of larceny and aggravated assault in Miami–Dade County, 2007–2015. Prof. Geogr. 2018, 70, 34–46. [Google Scholar] [CrossRef]
  86. Hunt, P.; Kilmer, B.; Rubin, J. Development of a European Crime Report: Improving Safety and Justice with Existing Crime and Criminal Justice Data; RAND Europe: Cambridge, UK, 2011. [Google Scholar]
  87. Partnership on Security in Public Spaces (PSPS). Action Plan Urban Agenda Partnership Security in Public Spaces. 2021. Available online: https://ec.europa.eu/futurium/en/system/files/ged/final_action_plan_security_in_public_spaces.pdf (accessed on 1 April 2022).
  88. Weisburd, D.; White, C.; Wooditch, A. Does collective efficacy matter at the micro geographic level?: Findings from a study of street segments. Br. J. Criminol. 2020, 60, 873–891. [Google Scholar] [CrossRef] [PubMed]
  89. Weisburd, D.; White, C.; Wire, S.; Wilson, D.B. Enhancing informal social controls to reduce crime: Evidence from a study of crime hot spots. Prev. Sci. 2021, 22, 509–522. [Google Scholar] [CrossRef]
  90. Foster, S.; Giles-Corti, B.; Knuiman, M. Neighbourhood design and fear of crime: A social-ecological examination of the correlates of residents’ fear in new suburban housing developments. Health Place 2010, 16, 1156–1165. [Google Scholar] [CrossRef]
  91. Weisburd, D.; Groff, E.R.; Yang, S.M. Understanding and controlling hot spots of crime: The importance of formal and informal social controls. Prev. Sci. 2014, 15, 31–43. [Google Scholar] [CrossRef]
Figure 1. Porto’s registered crime occurrence between 2016 and 2018: (a) by hour; (b) by month and day (source: authors, based on data reports of Porto’s Public Safety Police).
Ijgi 11 00400 g001
Figure 2. Porto’s kernel density estimation of reported crimes from 2016 to 2018 by street segment (source: authors, based on data reports of Porto’s Public Safety Police).
Ijgi 11 00400 g002
Figure 3. Emerging hotspot analysis for reported crimes (source: authors, based on data reports of Porto’s Public Safety Police).
Ijgi 11 00400 g003
Figure 4. Crime forecast in Porto based on 2016 to 2018 data (source: authors, based on data reports of Porto’s Public Safety Police).
Ijgi 11 00400 g004
Figure 5. Spatial Distribution of tweets collected (source: authors, based on Twitter data).
Ijgi 11 00400 g005
Figure 6. Five topics resulting from the LDA modeling (source: authors, based on Twitter data).
Ijgi 11 00400 g006
Figure 7. Word clouds of the most positive and most negative sentiments based on the sentiment analysis of tweets (source: authors, based on Twitter data).
Ijgi 11 00400 g007
Figure 8. Spatial distribution of sentiment scores (source: authors, based on Twitter data).
Ijgi 11 00400 g008
Table 1. Comparison of machine learning classification model performance.
ModelAccuracyRecallPrecisionF1 Score
Logistic Regression
(L1 penalty = 0.151)
0.650.840.640.72
Decision Tree
(criterion = entropy, max depth = 3)
0.610.560.700.63
Random Forest
(max. features = 2, number of trees = 100, max depth = 5)
0.830.990.790.89
SVM
(kernel = rbf, C = 1, gamma = 0.1)
0.800.870.820.91
Publisher’s Note: MDPI stays neutral with regard to jurisdictional claims in published maps and institutional affiliations.

