Spatio-Temporal Occurrence Modeling of Highly Pathogenic Avian Influenza Subtype H5N1: A Case Study in the Red River Delta, Vietnam

Abstract
:1. Introduction
2. Methods
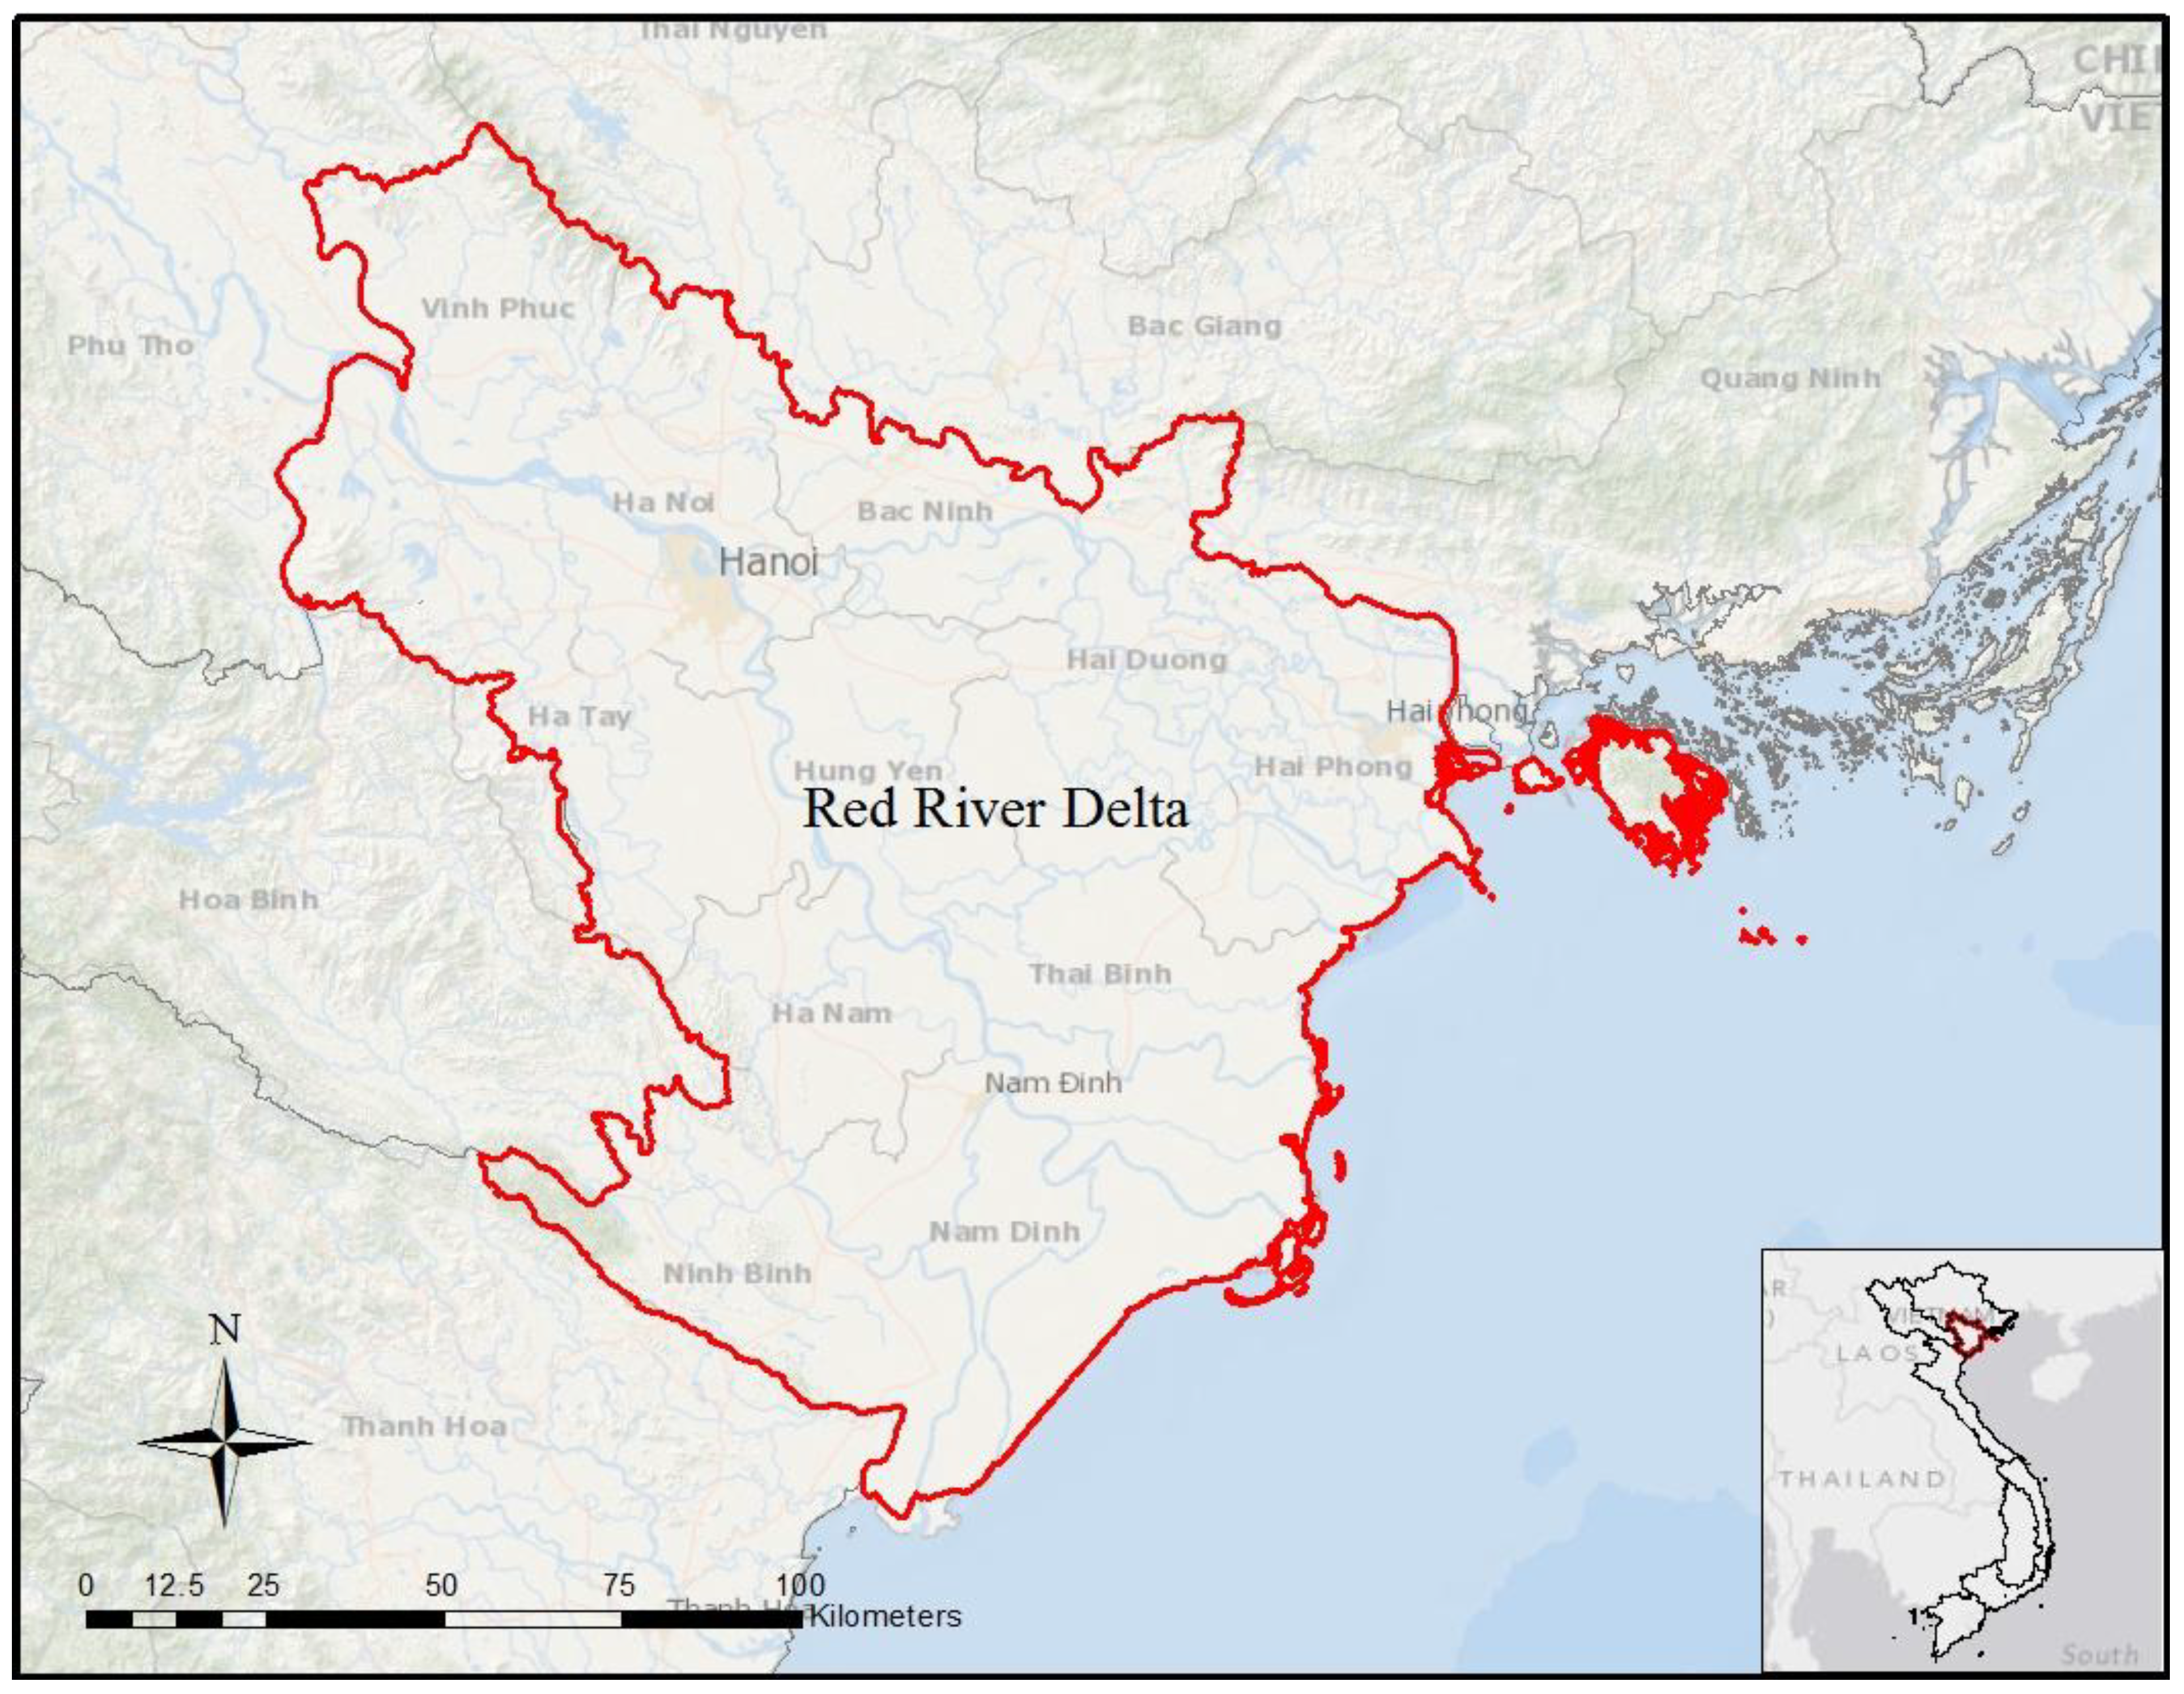
2.1. Study Area and Data Sources


| Variables | Unit | Description | Source |
|---|---|---|---|
| HPAI H5N1 occurrences | Locations and dates of occurrences | East West Center—National Science Foundation project | |
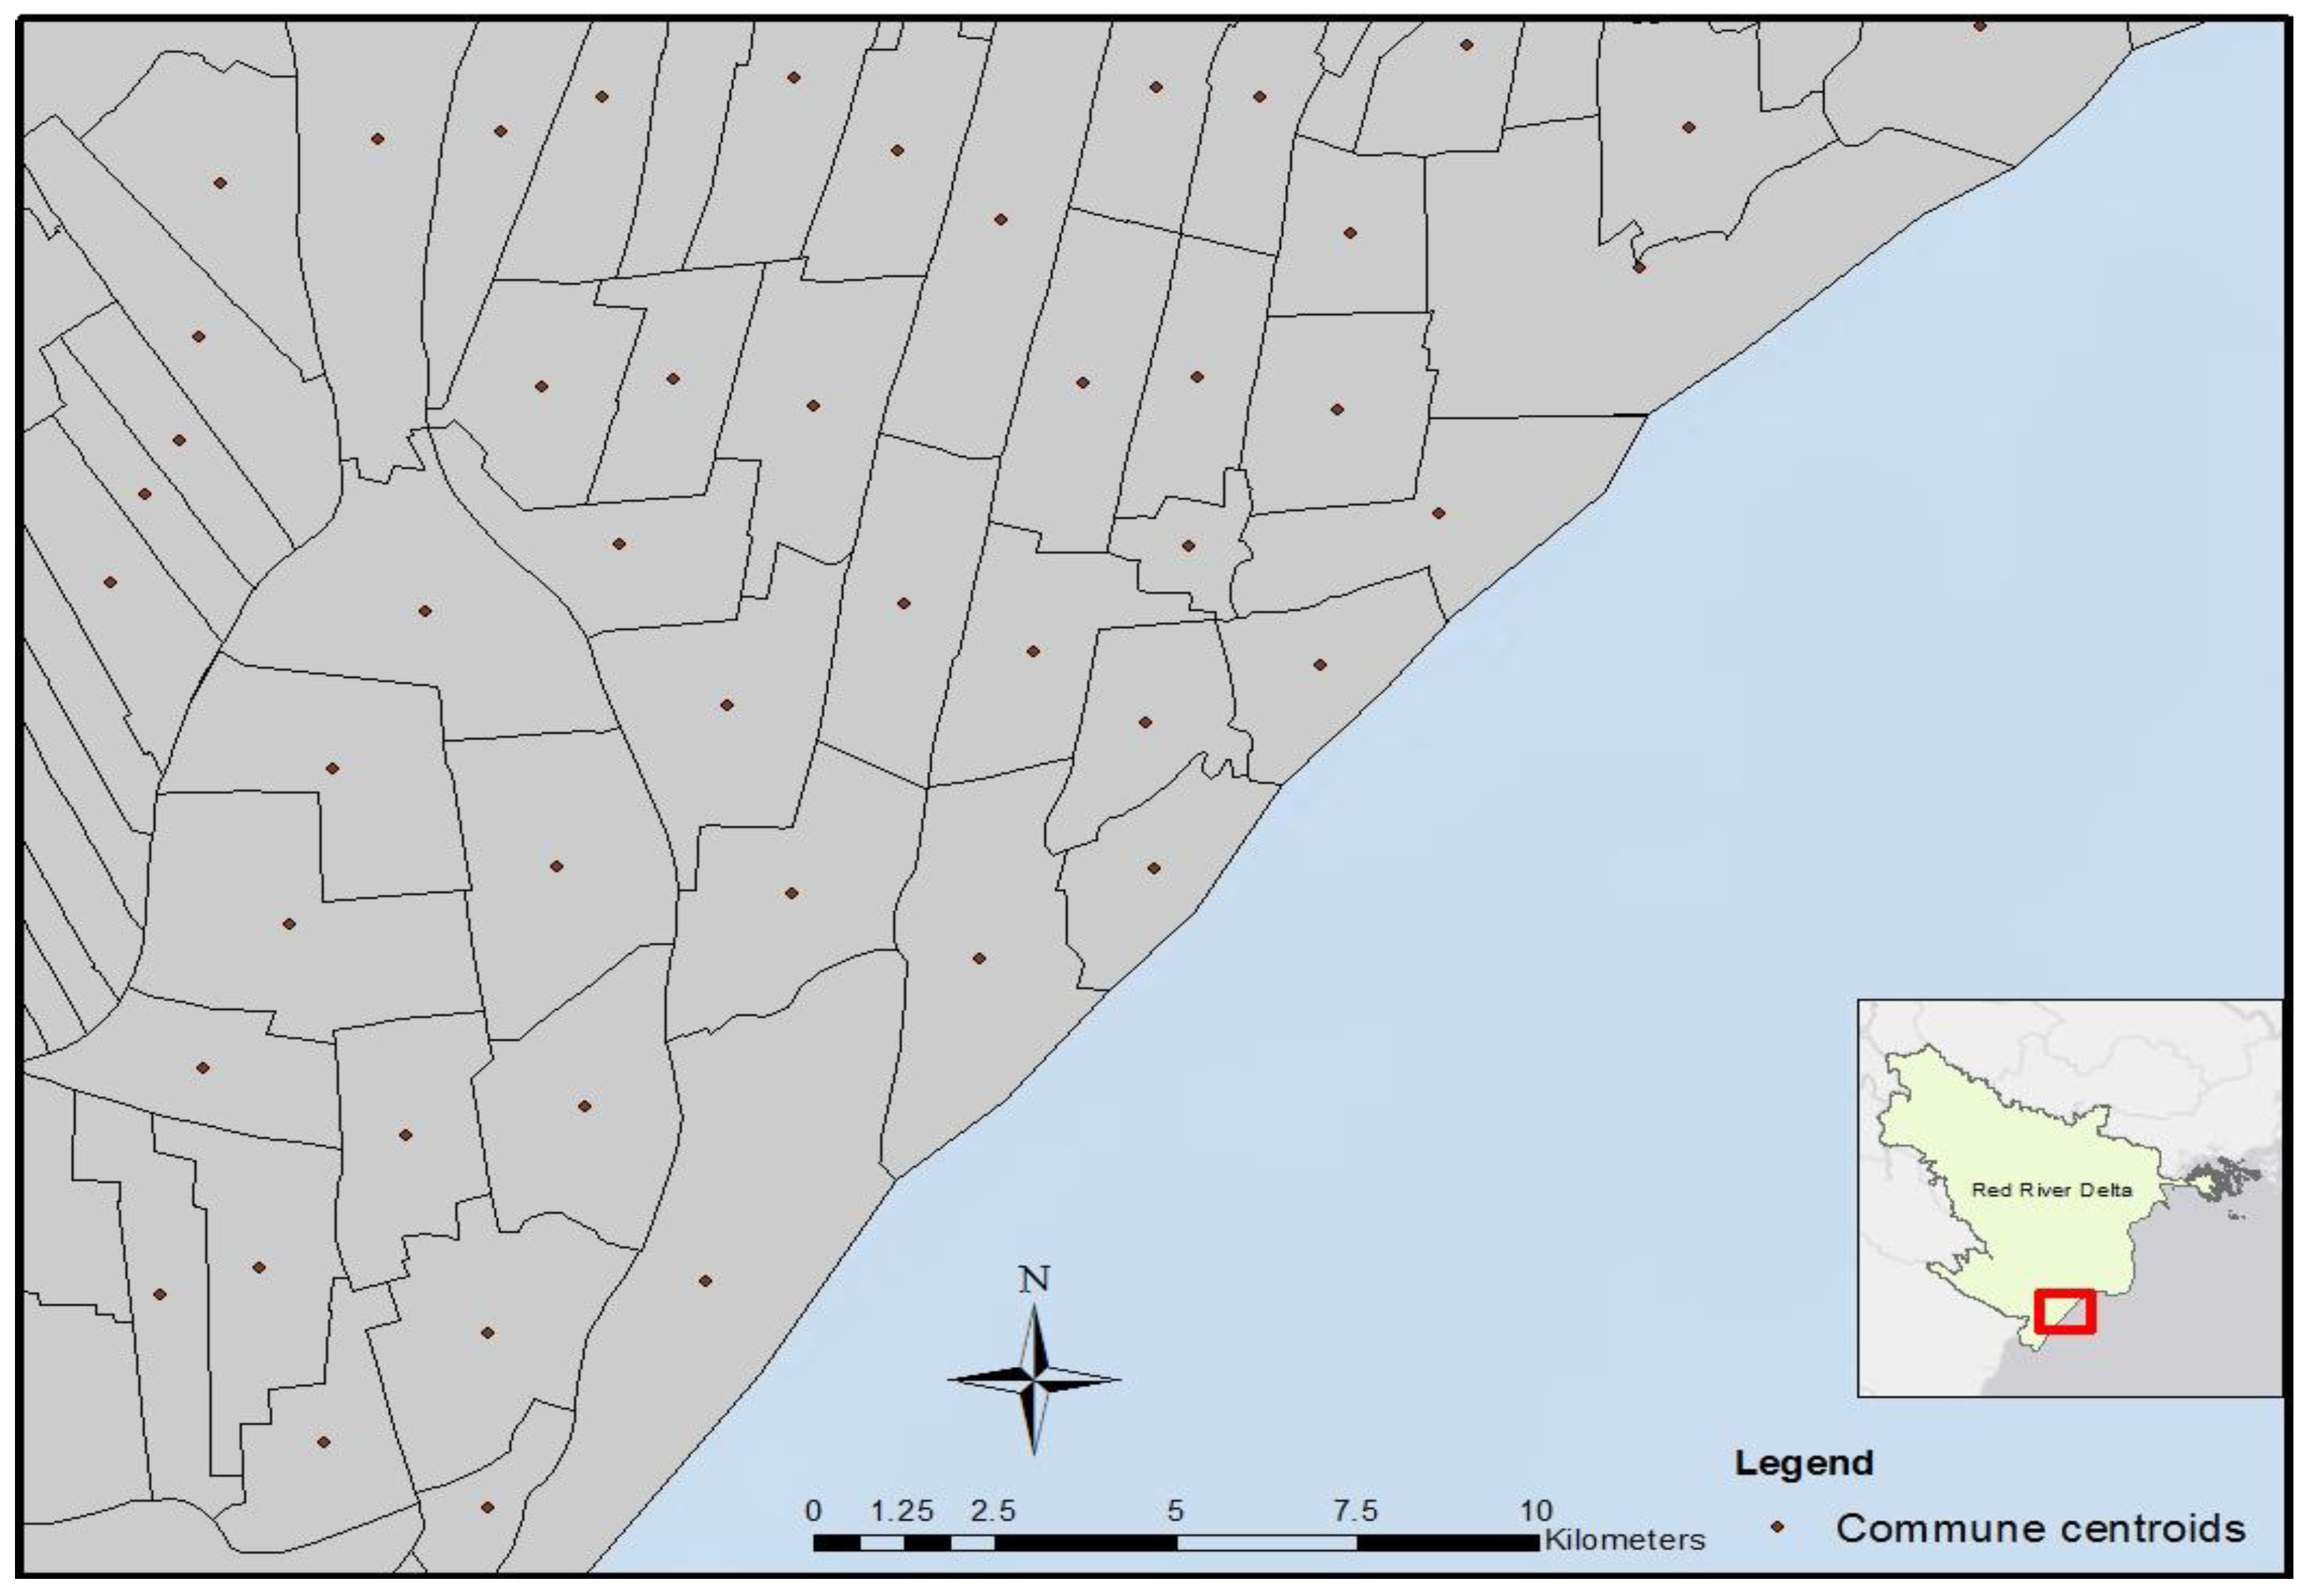
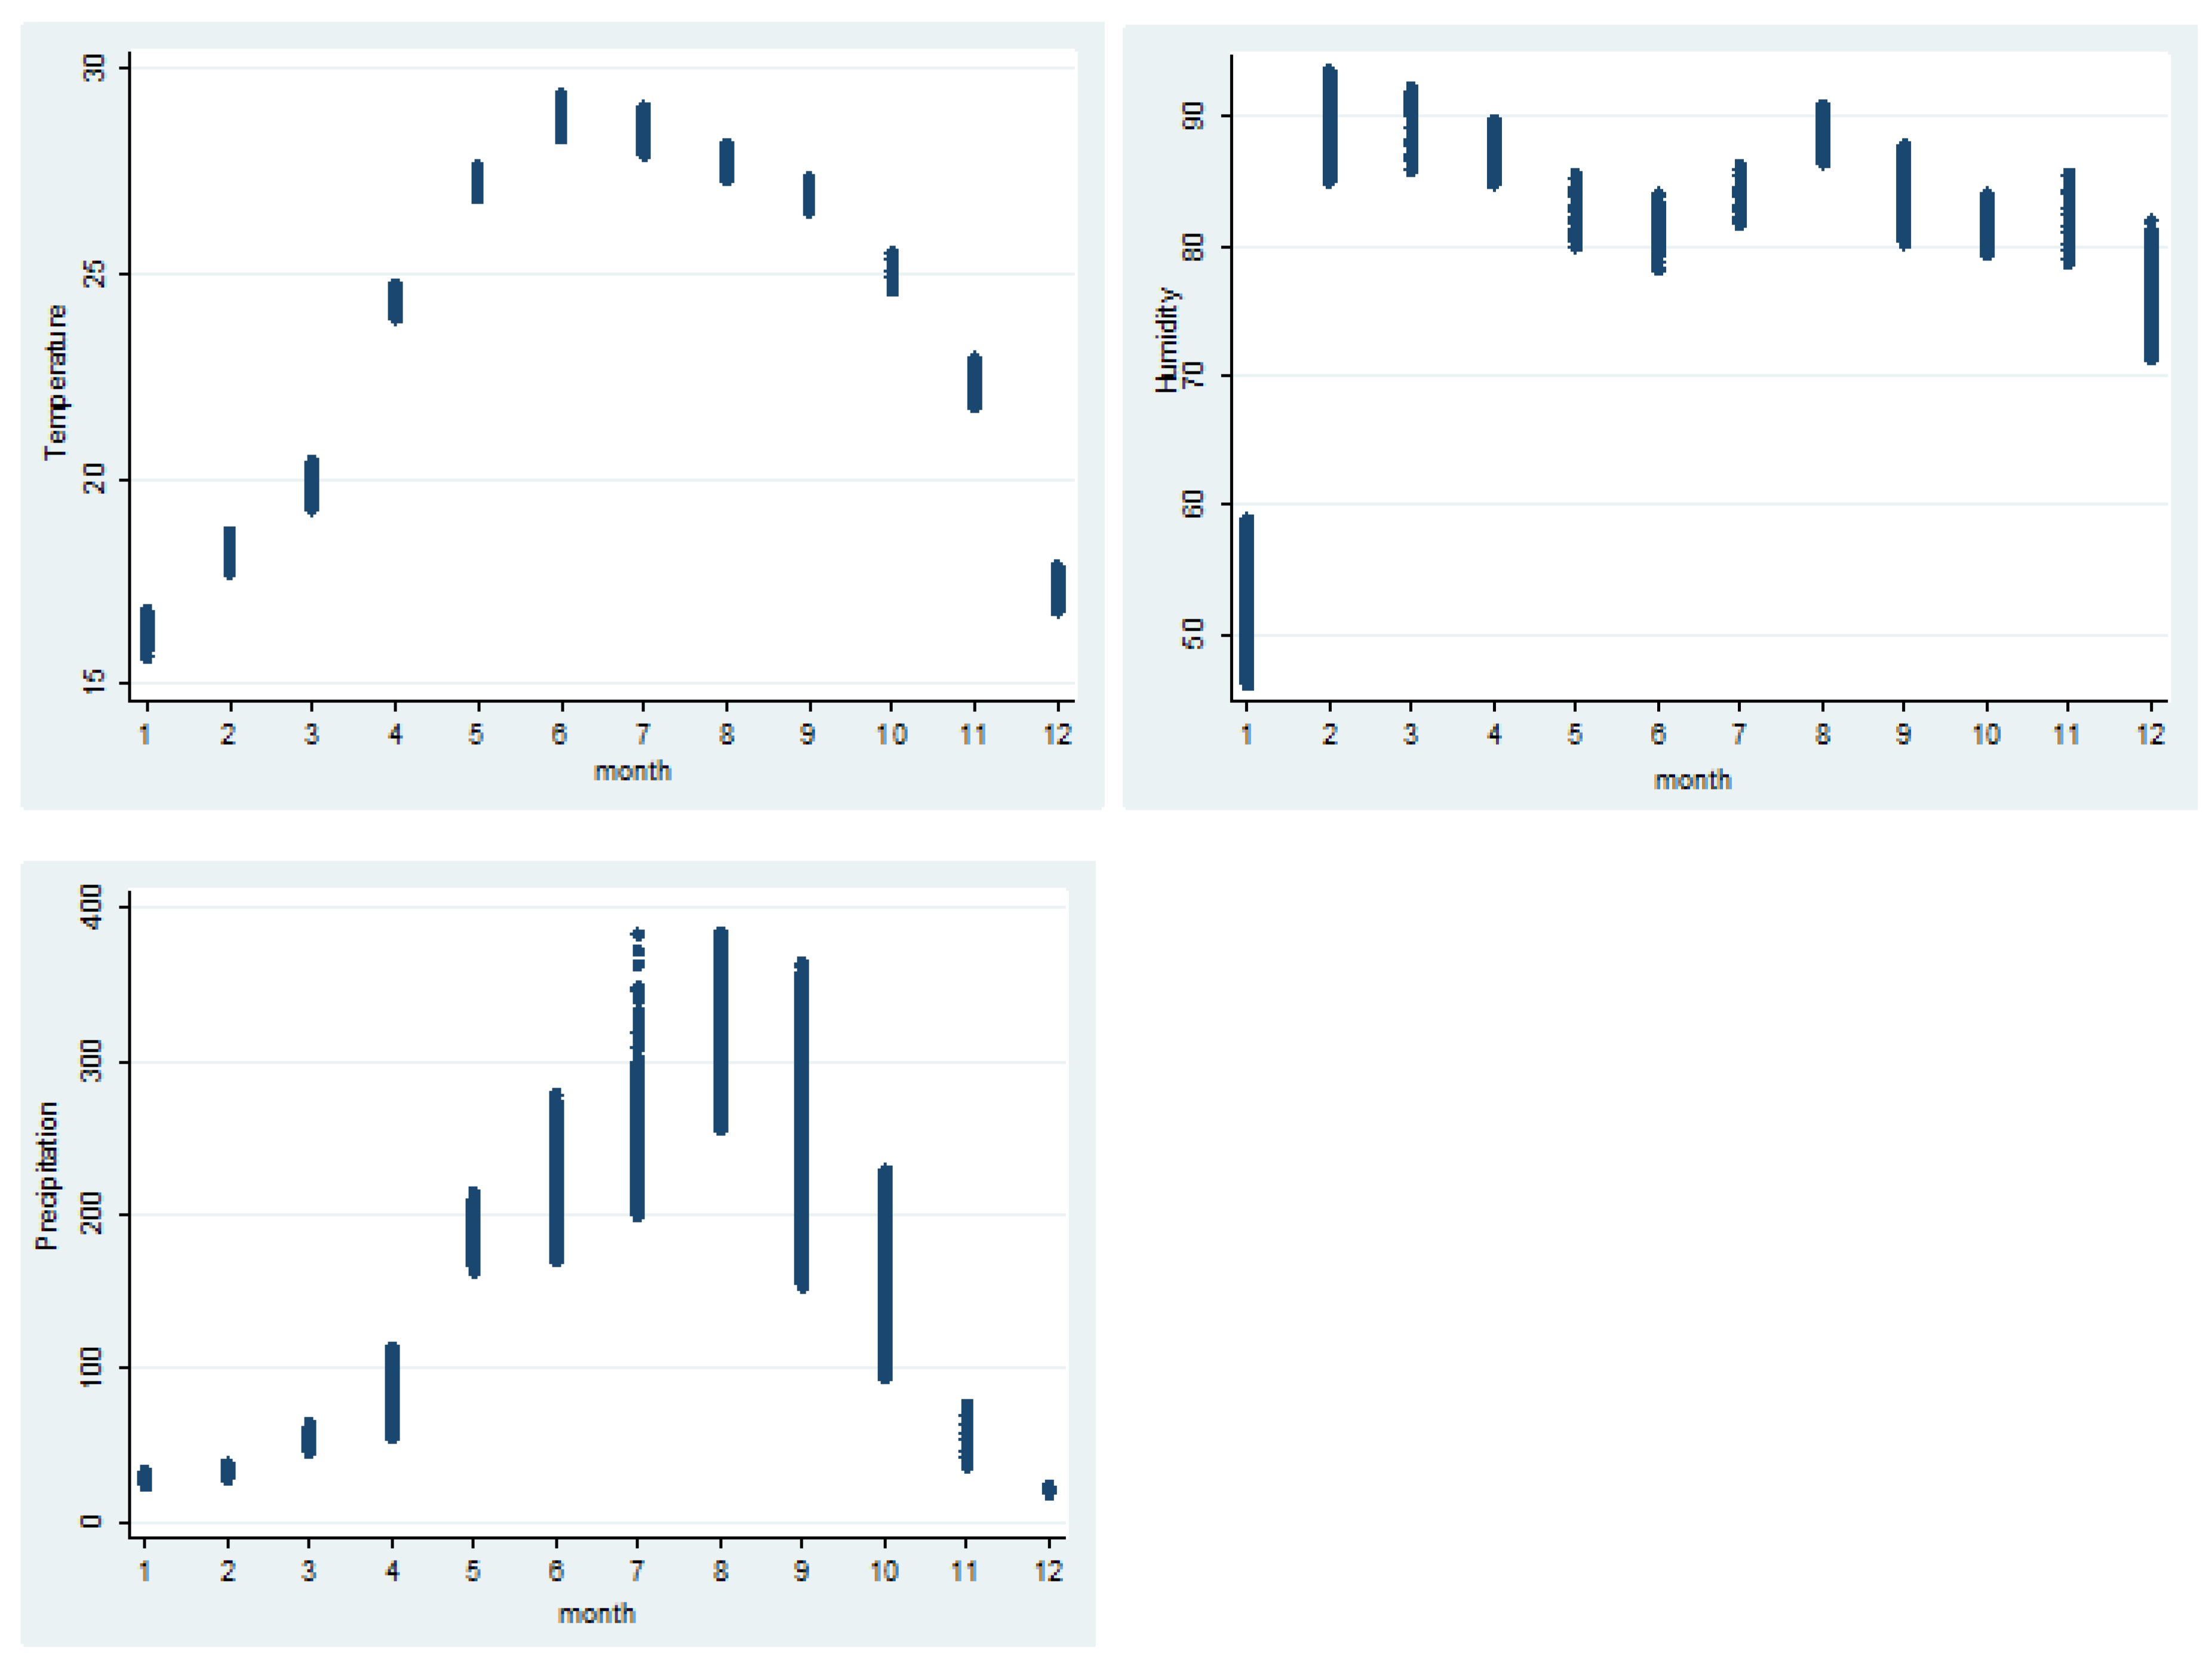
| Weather data | Measured at 30 weather stations located broadly in the Red River Delta and surrounding areas. Data contain both spatial and temporal aspects | Hydro Meteorological Data Center of Vietnam (HMDC) | |
| Precipitation | mm | ||
| Temperature | °C | ||
| Humidity | % | ||
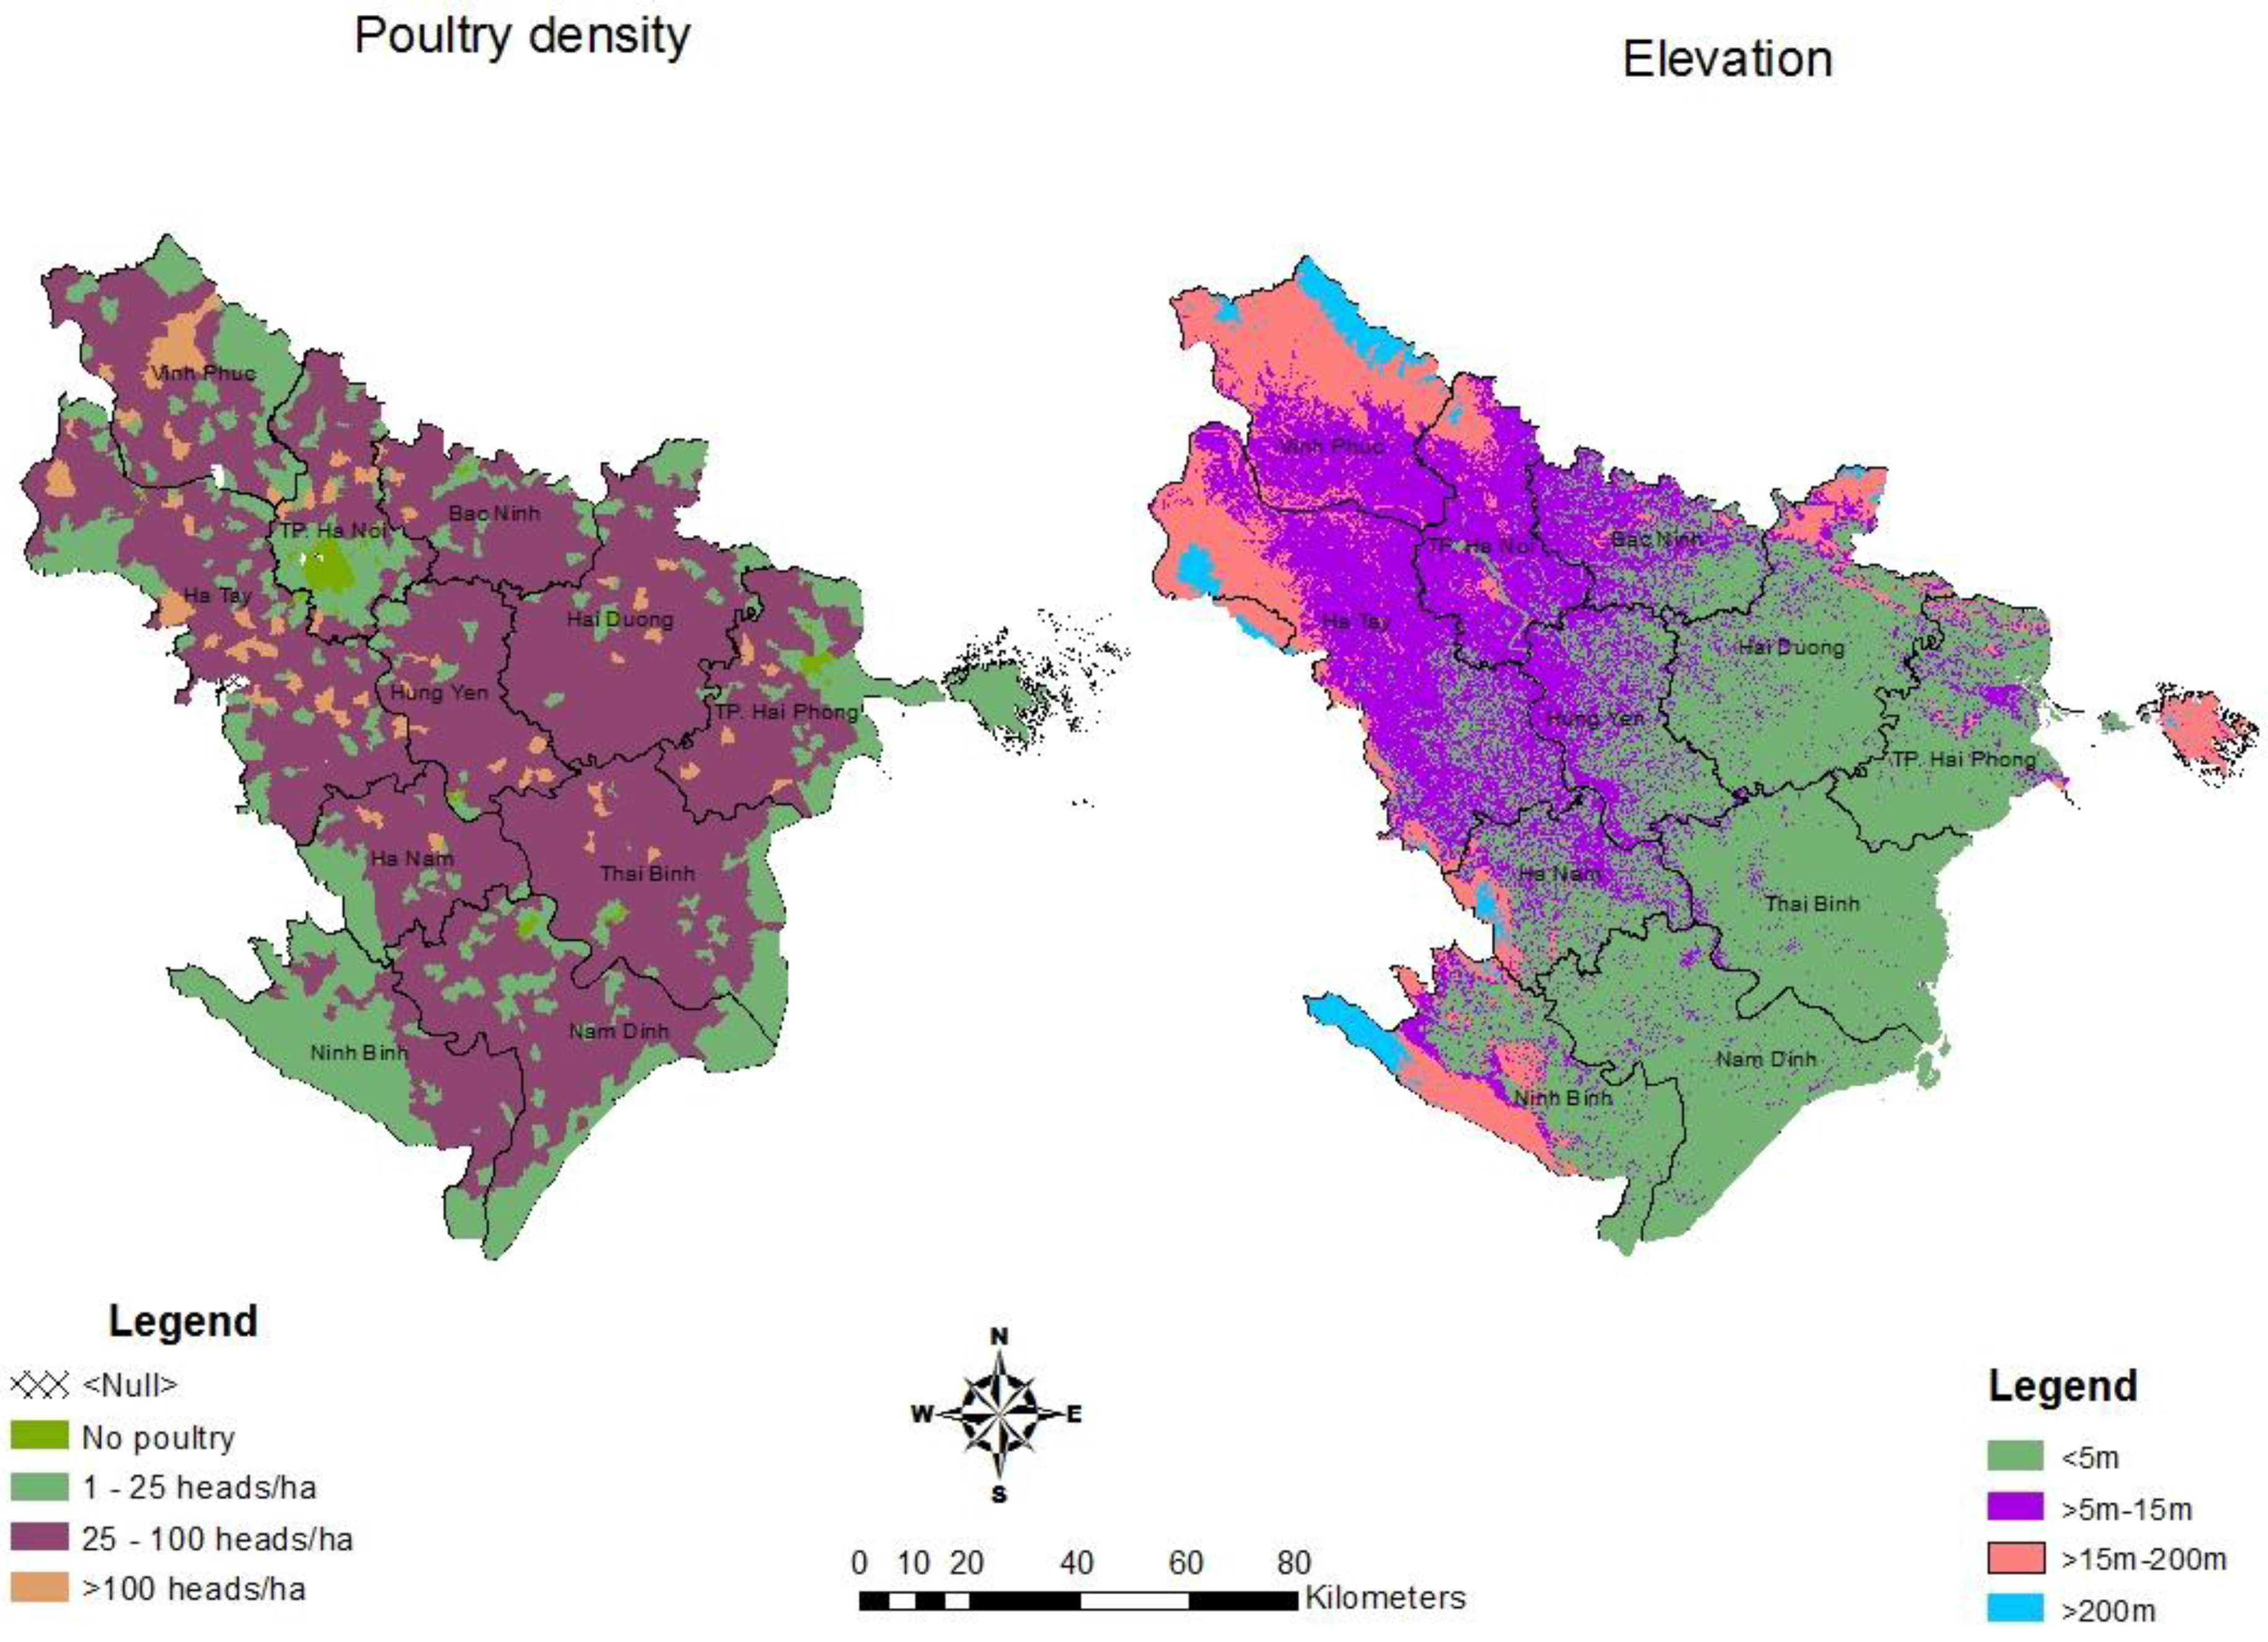
| Poultry density | Heads/ha | Derived from 2006 Vietnam agricultural census. Data contain the spatial aspect | East West Center—National Science Foundation project |
| Group 1: 0 | |||
| Group 2: 1–25 | |||
| Group 3: 26–100 | |||
| Group 4: >100 | |||
| Elevation | m | Derived from SRTM 90-m resolution Digital Elevation Model (DEM). Data contain the spatial aspect | SRTM 90-m resolution DEM: http://srtm.csi.cgiar.org/ [19] |
| Group 1: <5 | |||
| Group 2: >5–15 | |||
| Group 3: >15–200 | |||
| Group 4: >200 |
2.2. Statistical Analysis
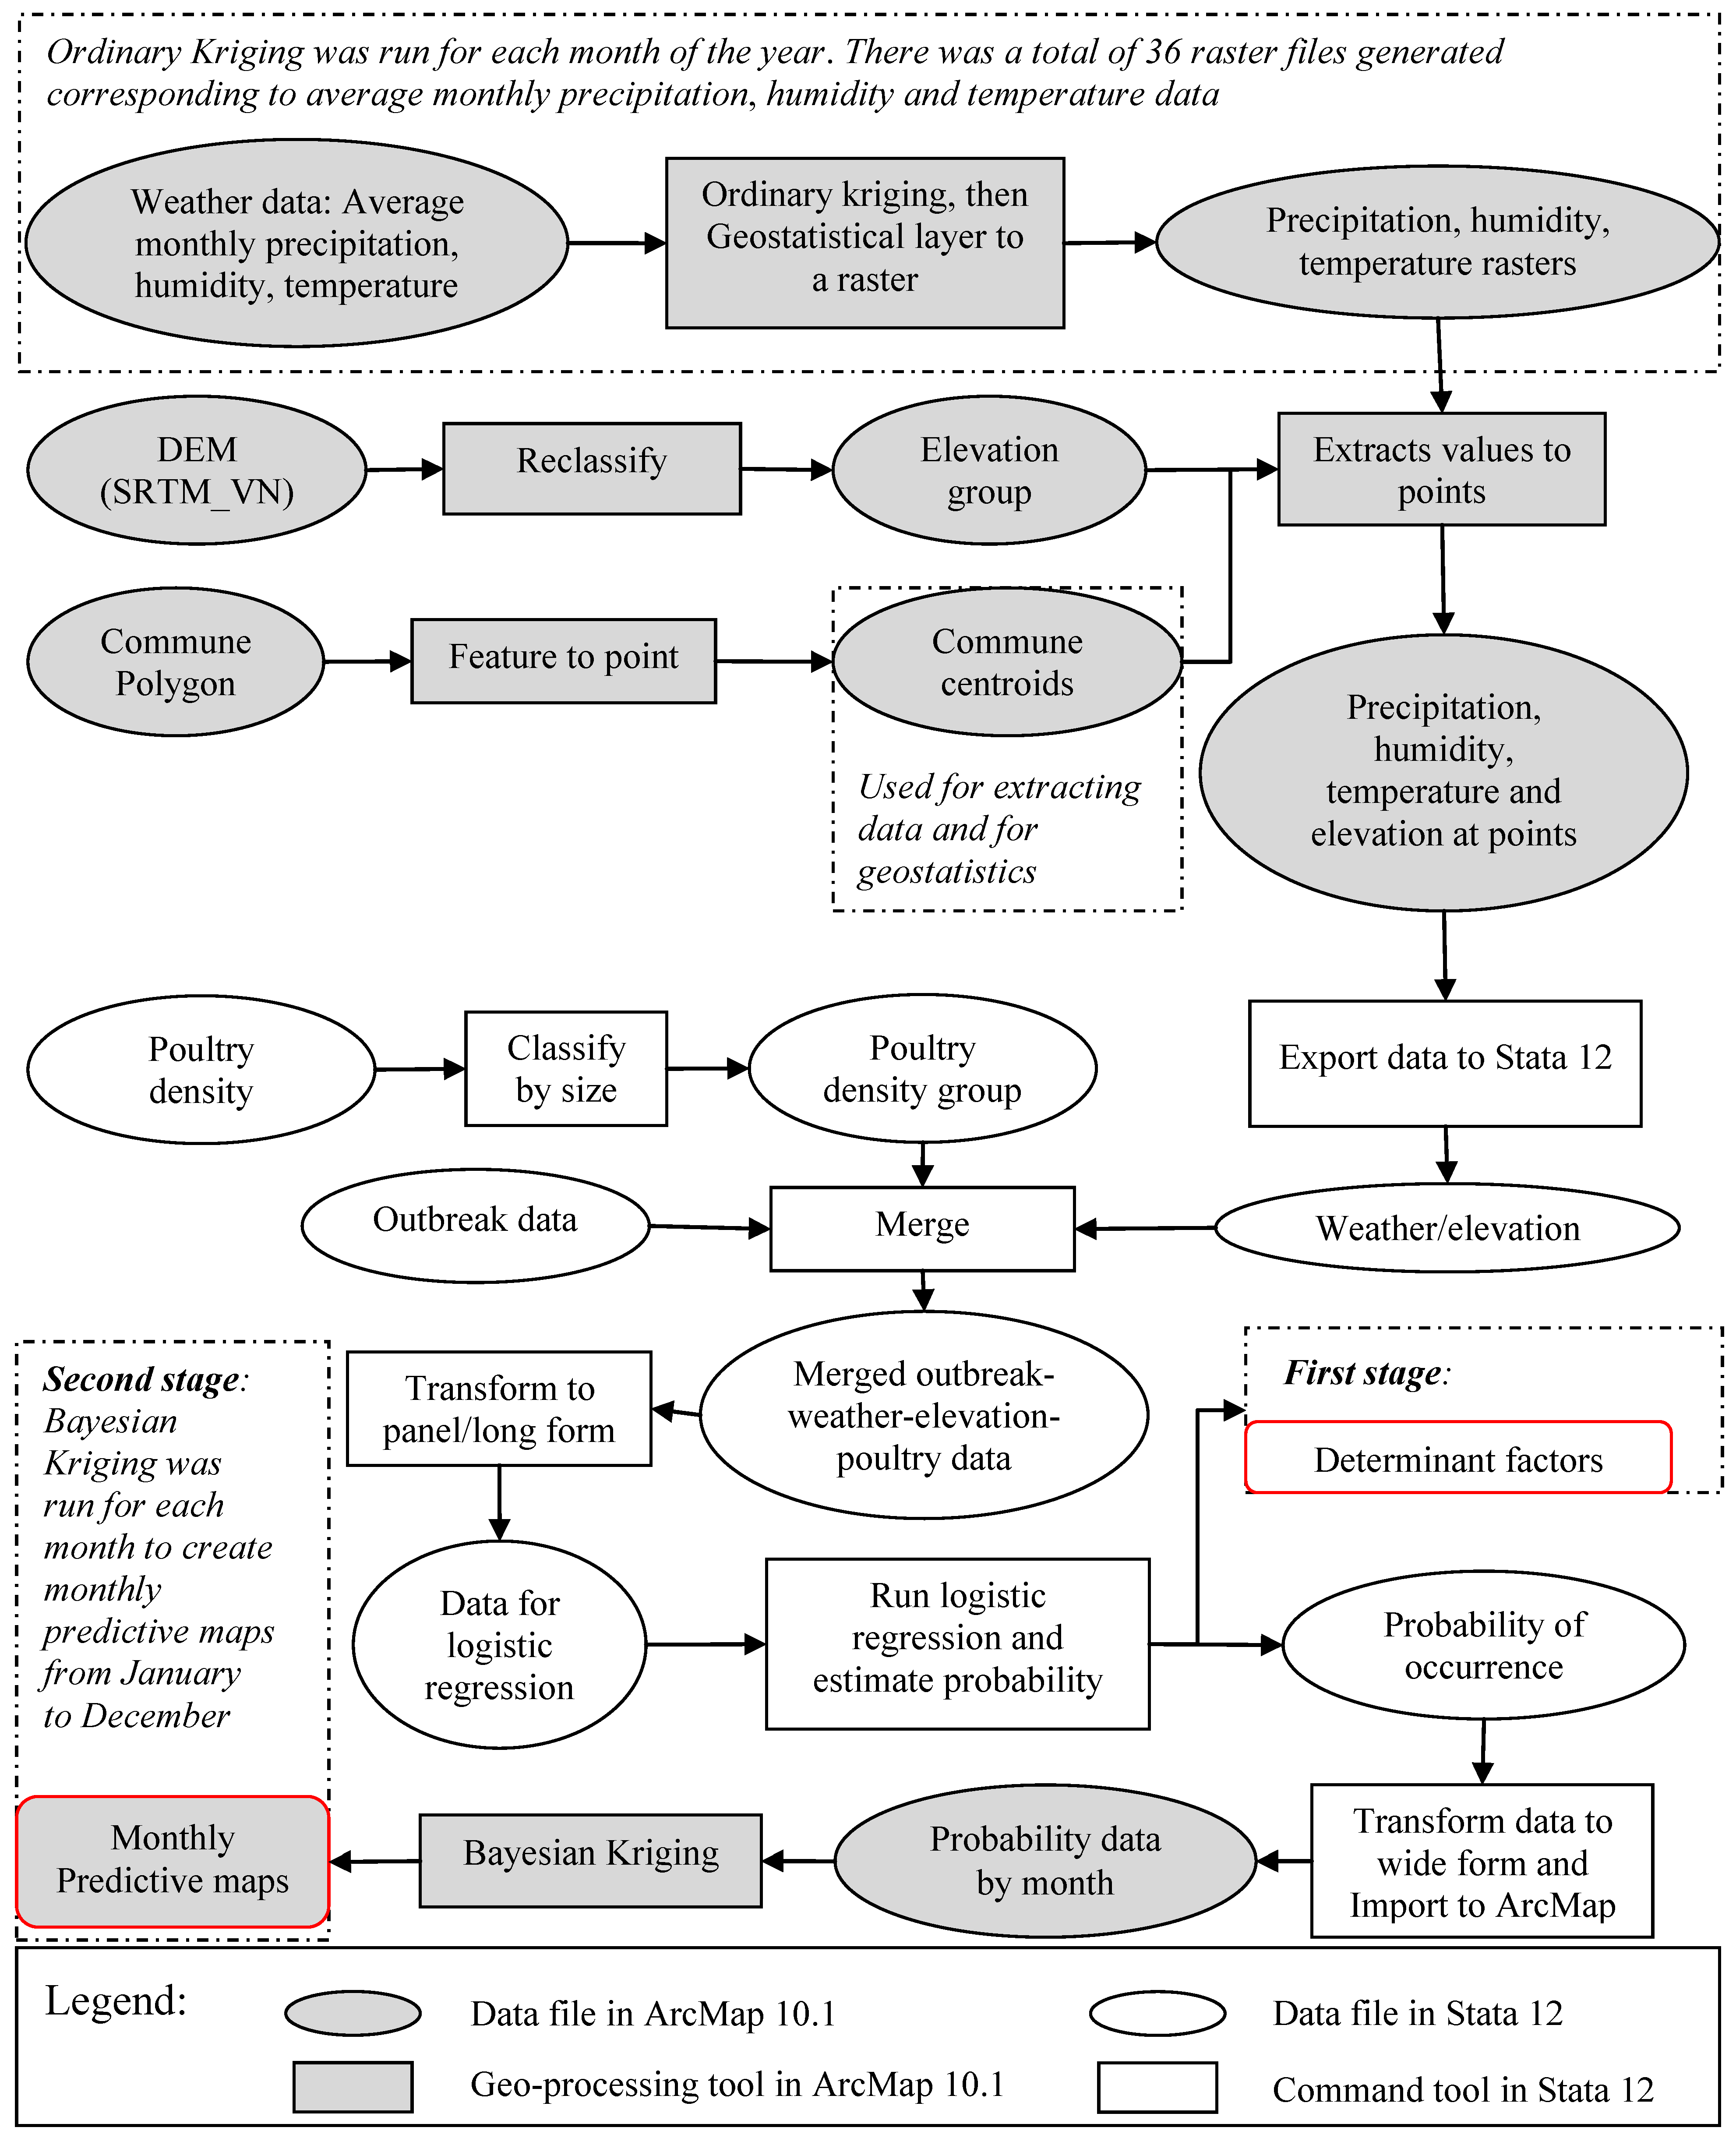
2.3. Geostatistical Analysis


3. Results and Discussion
3.1. Results
| Variable | OR 1 | SE | P | 95% CI | VIF | |
|---|---|---|---|---|---|---|
| Average monthly temperature | 1.518 *** | 0.066 | 0 | 1.394 | 1.653 | 5.65 |
| Average monthly humidity | 0.949 *** | 0.006 | 0 | 0.936 | 0.962 | 1.27 |
| Average monthly precipitation | 0.975 *** | 0.002 | 0 | 0.971 | 0.980 | 5.07 |
| Poultry density | 1.368 ** | 0.153 | 0.006 | 1.0912 | 1.696 | 1.08 |
| Elevation | 0.716 ** | 0.076 | 0.002 | 0.582 | 0.881 | 1.08 |
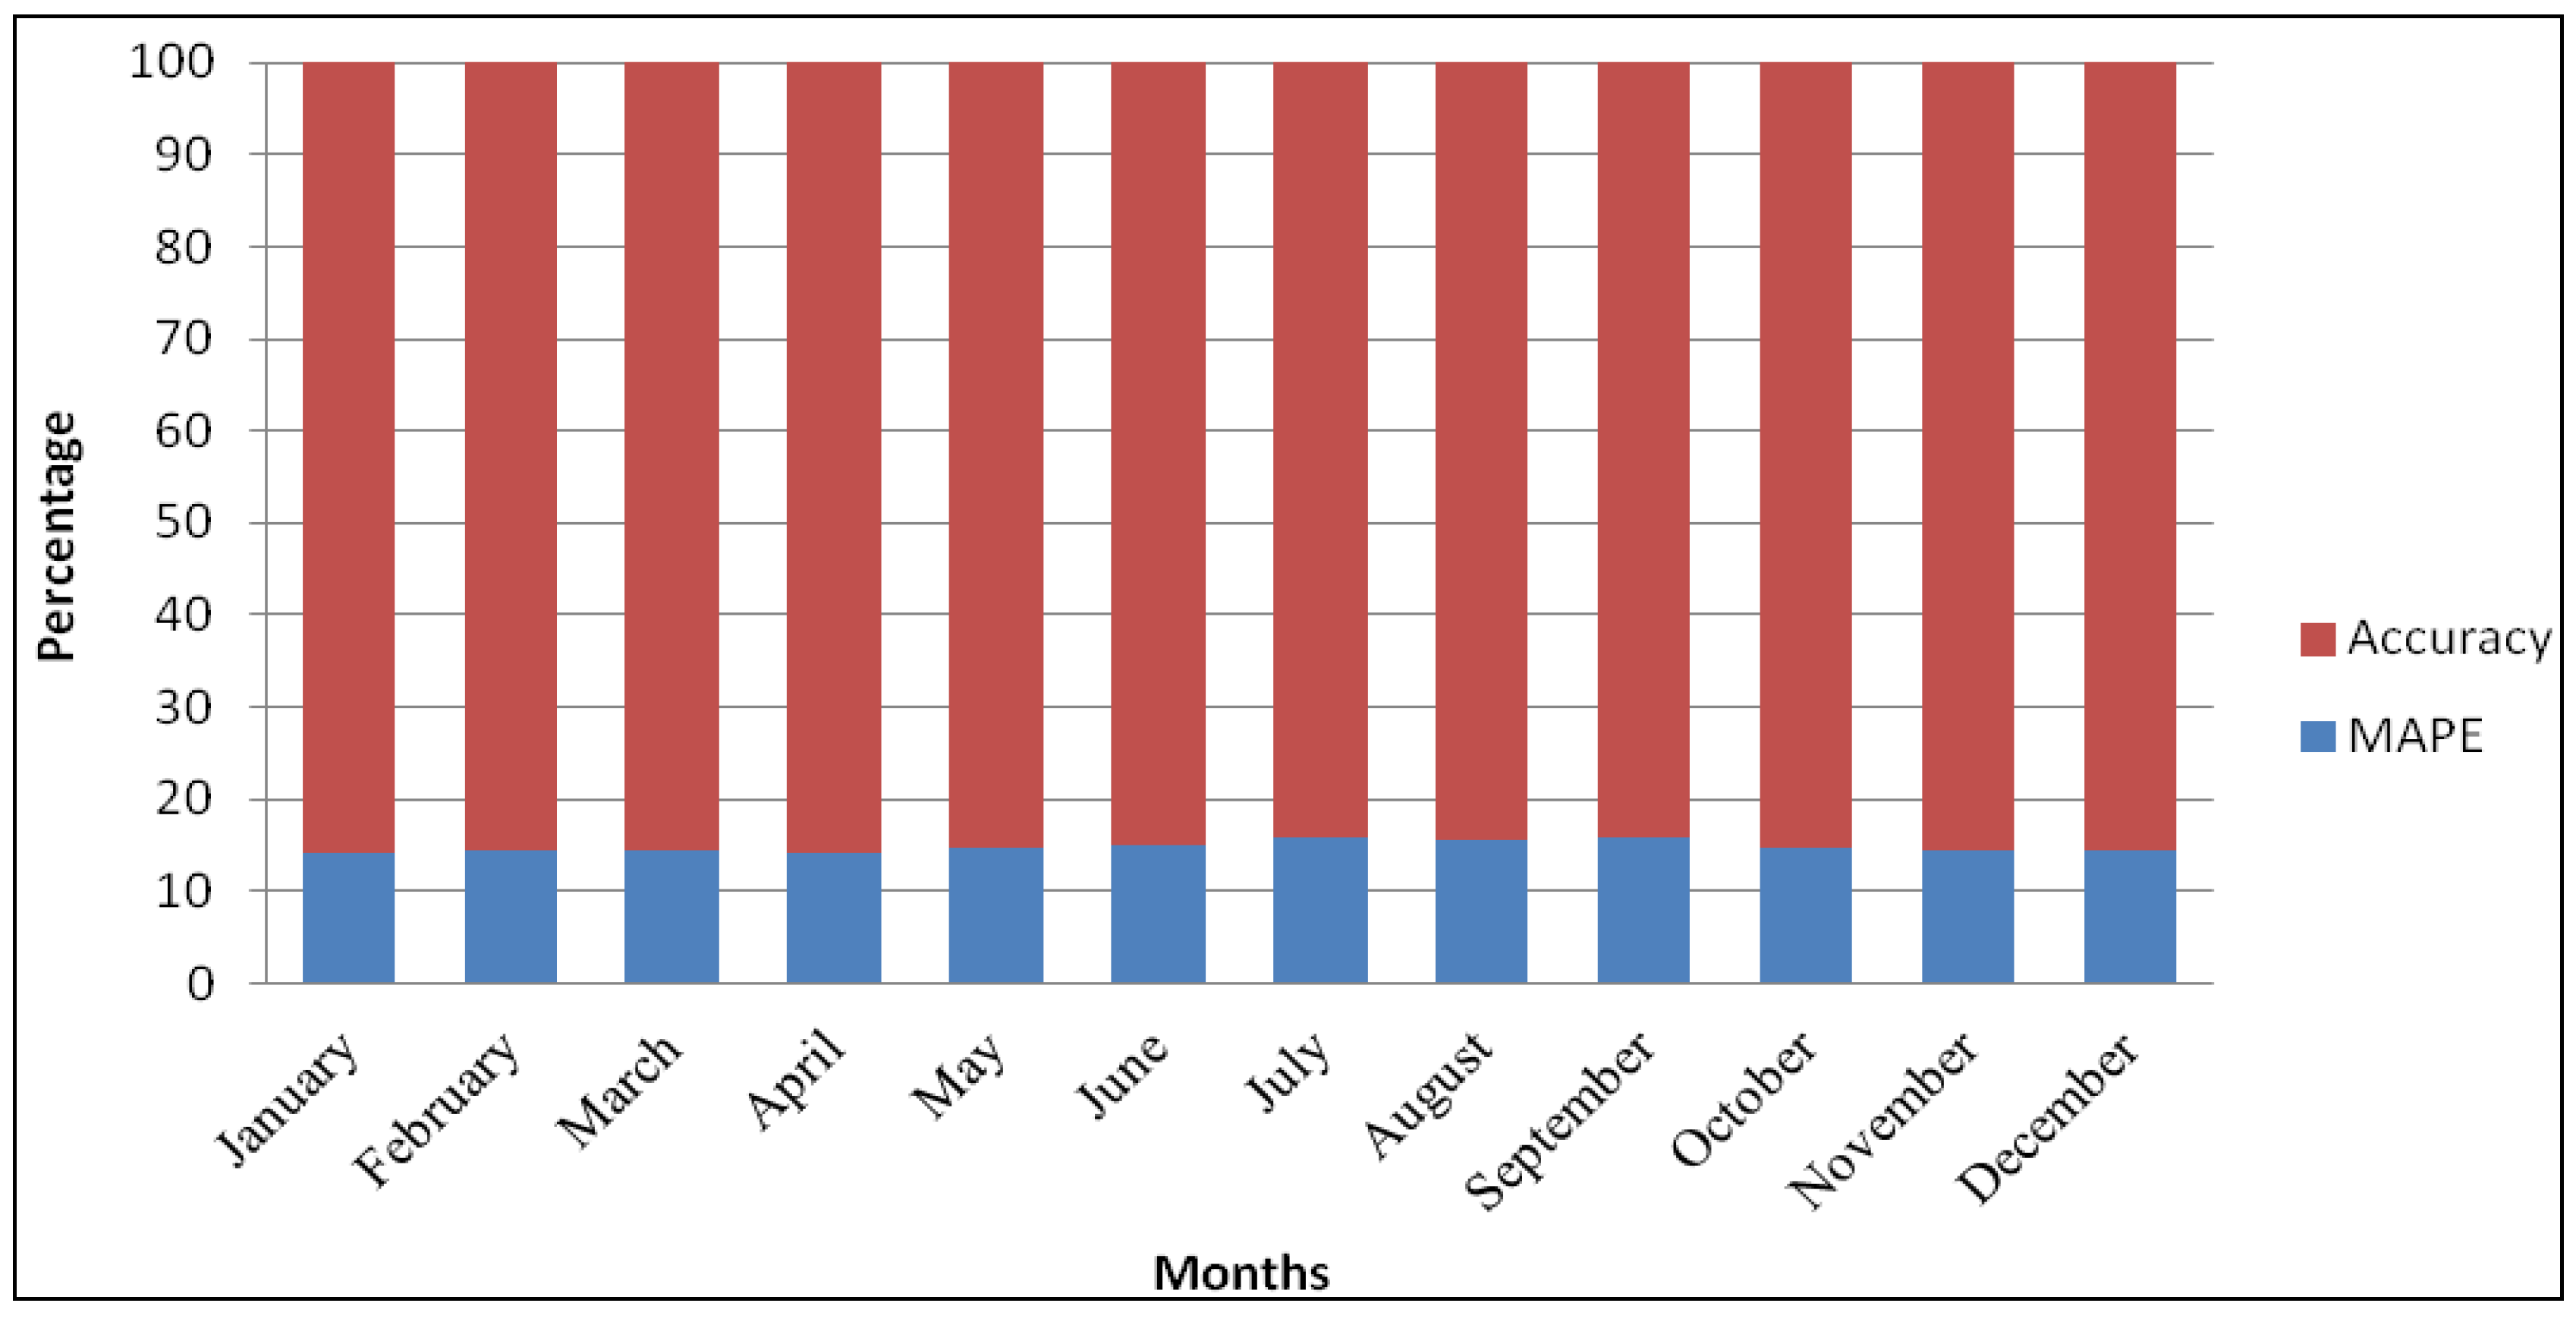
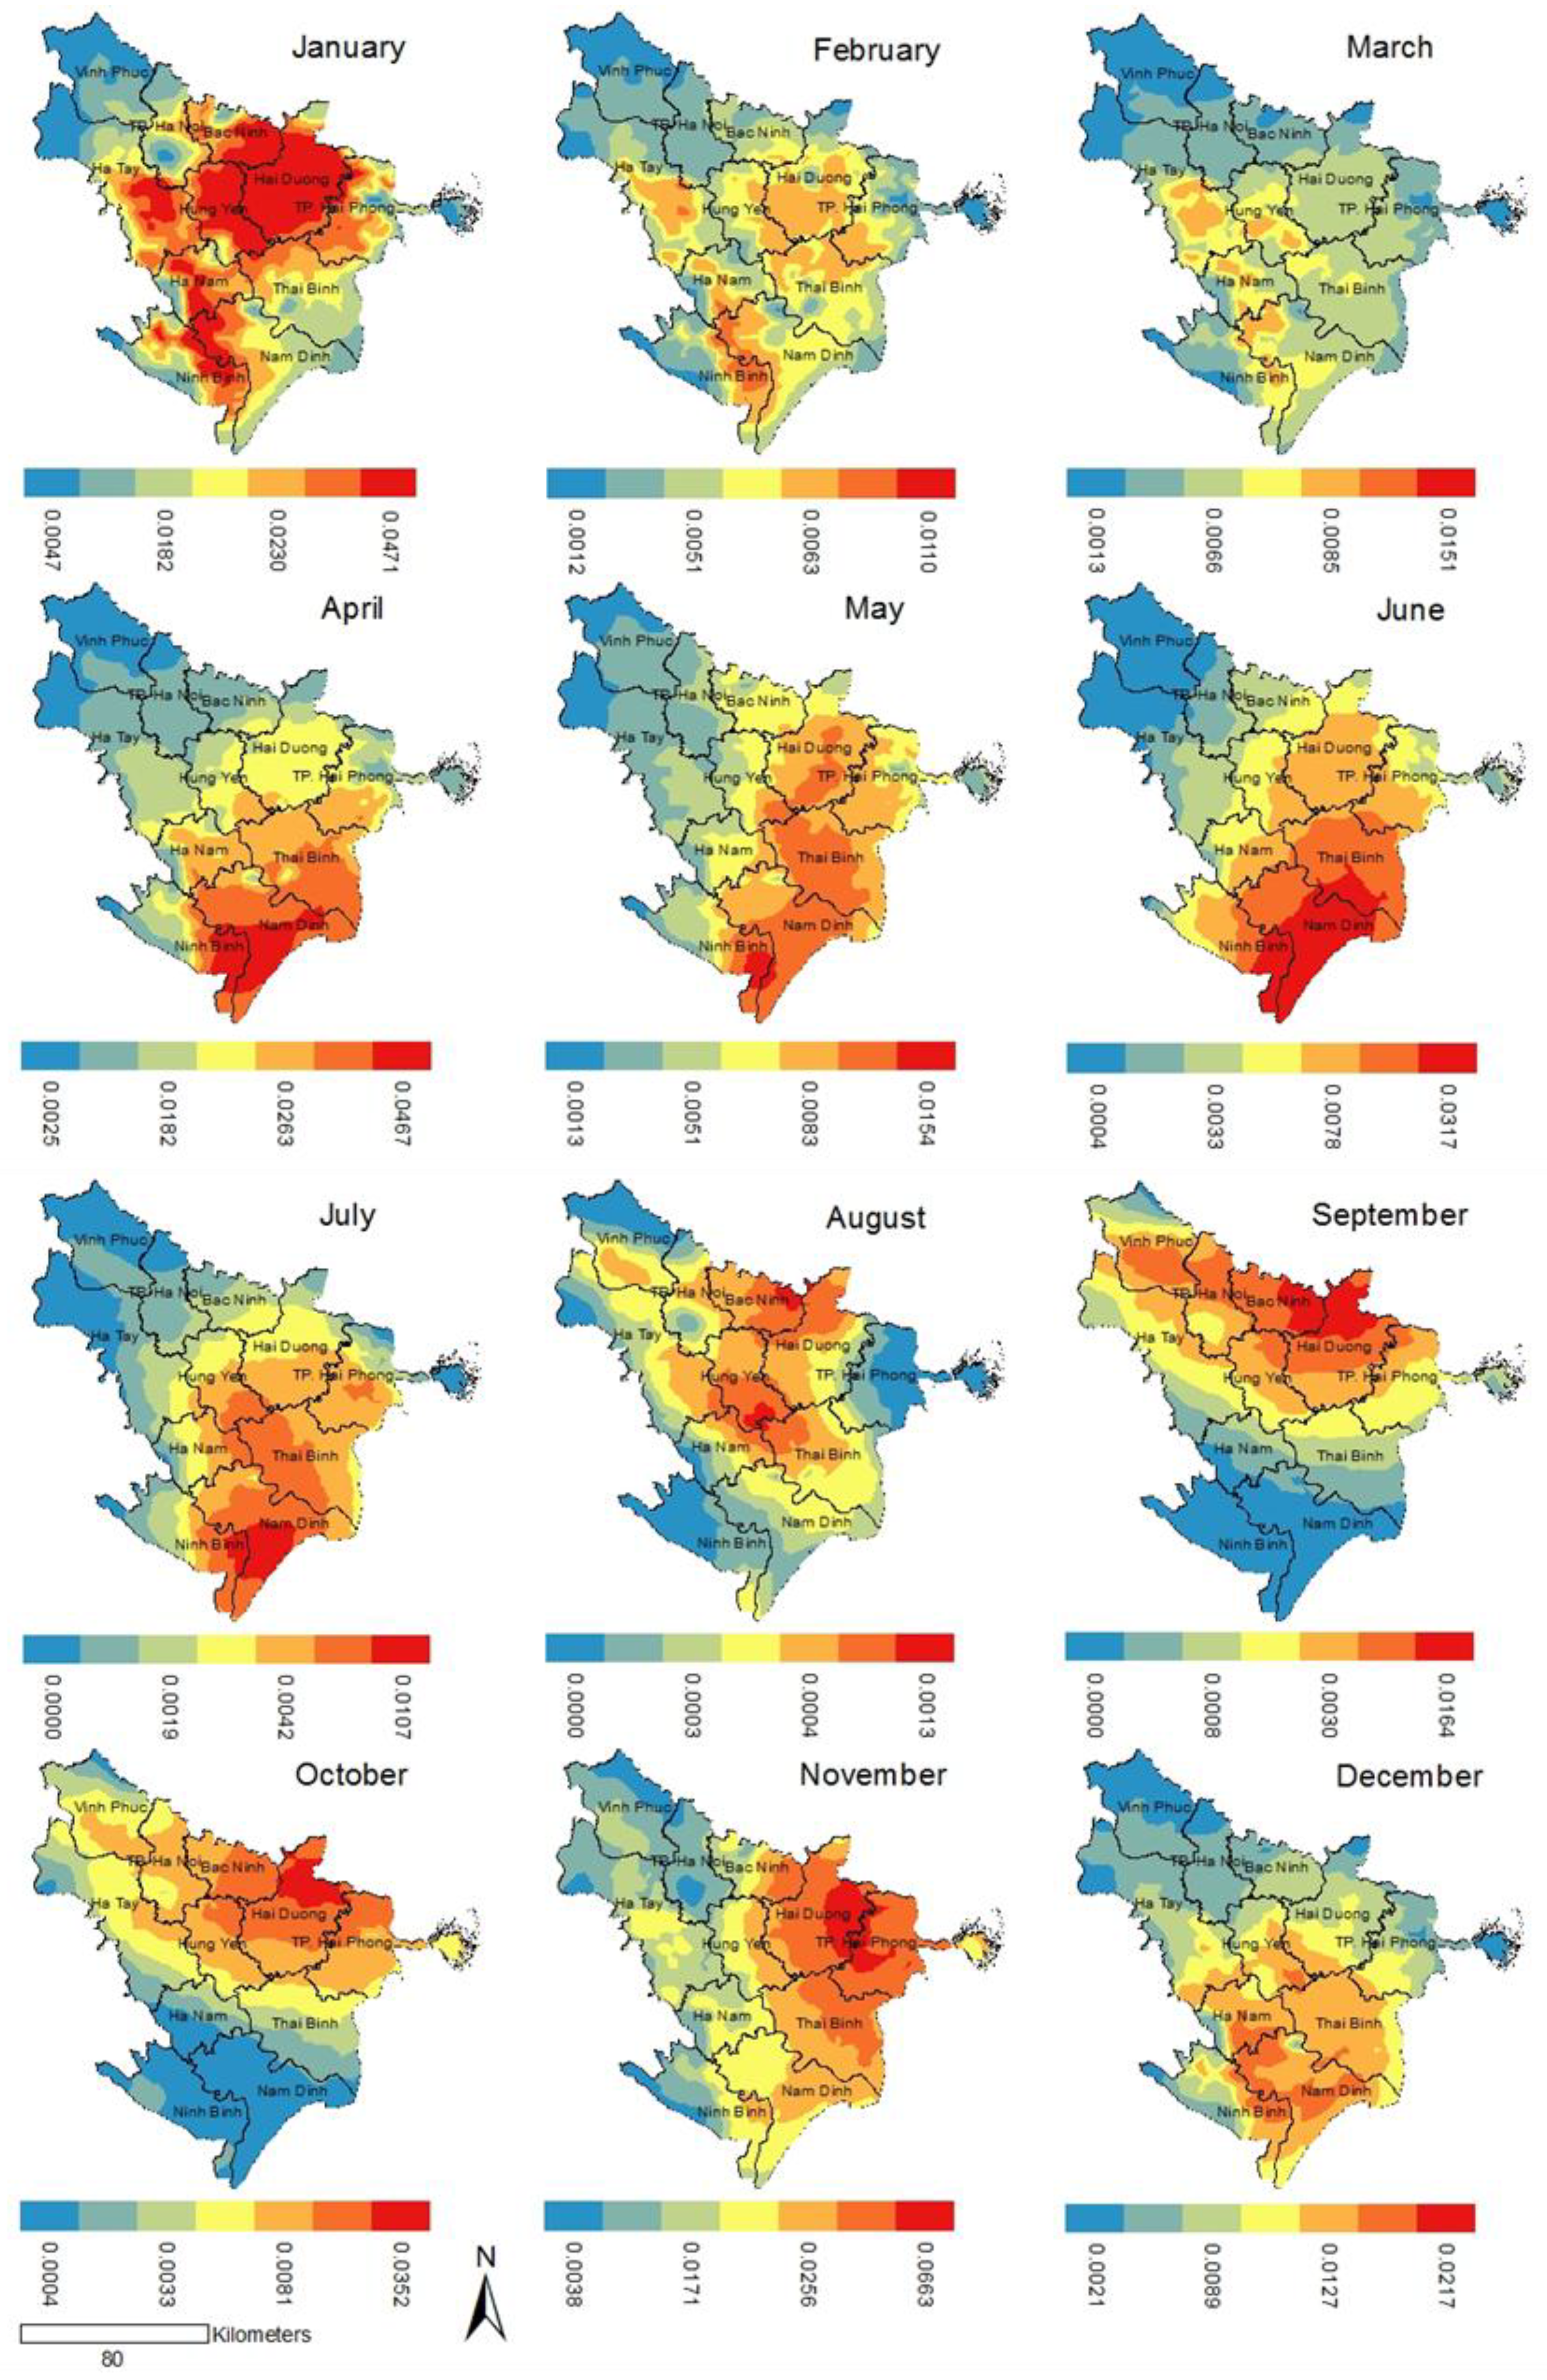
| Month | Mean | Std. Dev. | Min | Max |
|---|---|---|---|---|
| January | 0.0216 | 0.0066 | 0.0047 | 0.0471 |
| February | 0.0055 | 0.0016 | 0.0013 | 0.0110 |
| March | 0.0065 | 0.0020 | 0.0013 | 0.0151 |
| April | 0.0226 | 0.0096 | 0.0026 | 0.0467 |
| May | 0.0073 | 0.0032 | 0.0013 | 0.0155 |
| June | 0.0089 | 0.0072 | 0.0005 | 0.0317 |
| July | 0.0037 | 0.0024 | 0.0000 | 0.0107 |
| August | 0.0004 | 0.0002 | 0.0000 | 0.0013 |
| September | 0.0030 | 0.0029 | 0.0001 | 0.0164 |
| October | 0.0078 | 0.0059 | 0.0005 | 0.0352 |
| November | 0.0254 | 0.0115 | 0.0038 | 0.0663 |
| December | 0.0106 | 0.0038 | 0.0021 | 0.0217 |
| Year average | 0.0102 | 0.0098 | 0.000012 | 0.0663 |

3.2. Discussion


4. Conclusions
Acknowledgments
Conflicts of Interest
References
- Si, Y.; Wang, T.; Skidmore, A.K.; de Boer, W.F.; Li, L.; Prins, H.H. Environmental Factors Influencing the Spread of the Highly Pathogenic Avian Influenza H5N1 Virus in Wild Birds in Europe. Ecol. Soc. 2010, 15, p. 26. Available online: http://www.ecologyandsociety.org/vol15/iss3/art26/ (accessed on 25 September 2011).
- Wilcox, B.A.; Gubler, D.J. Disease ecology and the global emergence of zoonotic pathogens. Environ. Health Prev. Med. 2005, 10, 263–272. [Google Scholar] [CrossRef]
- Wilcox, B.A.; Colwell, R.R. Emerging and reemerging infectious diseases: Biocomplexity as an interdisciplinary paradigm. EcoHealth 2005, 2, 244–257. [Google Scholar] [CrossRef]
- Pfeiffer, D.U.; Minh, P.Q.; Martin, V.; Epprecht, M.; Otte, M.J. An analysis of the spatial and temporal patterns of highly pathogenic avian influenza occurrence in Vietnam using national surveillance data. Vet. J. 2007, 174, 302–309. [Google Scholar]
- Desvaux, S.; Grosbois, V.; Pham, T.T.H.; Fenwick, S.; Tollis, S.; Pham, N.H.; Tran, A.; Roger, F. Risk factors of highly pathogenic avian influenza H5N1 occurrence at the village and farm levels in the red river delta region in Vietnam. Transbound Emerg. Dis. 2011, 58, 492–502. [Google Scholar]
- Gilbert, M.; Xiao, X.; Pfeiffer, D.U.; Epprecht, M.; Boles, S.; Czarnecki, C.; Chaitaweesub, P.; Kalpravidh, W.; Minh, P.Q.; Otte, M.J. Mapping H5N1 highly pathogenic avian influenza risk in Southeast Asia. Proc. Natl. Acad. Sci. USA 2008, 105, 4769–4774. [Google Scholar]
- Paul, M.; Tavornpanich, S.; Abrial, D.; Gasqui, P.; Charras-Garrido, M.; Thanapongtharm, W.; Xiao, X.; Gilbert, M.; Roger, F.; Ducrot, C. Anthropogenic factors and the risk of highly pathogenic avian influenza H5N1: Prospects from a spatial-based model. Vet. Res. 2010, 41. [Google Scholar] [CrossRef]
- Edan, M.; Bourgeois, N. Review of Free-Range Duck Farming Systems in Northern Vietnam and Assessment of Their Implication in the Spreading of the Highly Pathogenic (H5N1) Strain of Avian Influenza (HPAI); Agronomes et Vétérinair es sans Frontières: Lyon, France, 2006. [Google Scholar]
- Gilbert, M.; Slingenbergh, J.; Xiao, X. Climate change and avian influenza. Rev. Sci. Tech. Int. Off. Epizoot. 2008, 27, 459–466. [Google Scholar]
- Fang, L.-Q.; de Vlas, S.J.; Liang, S.; Looman, C.W.; Gong, P.; Xu, B.; Yan, L.; Yang, H.; Richardus, J.H.; Cao, W.-C. Environmental factors contributing to the spread of H5N1 avian influenza in mainland China. PLoS One 2008, 3. [Google Scholar] [CrossRef]
- Minh, P.Q.; Morris, R.S.; Schauer, B.; Stevenson, M.; Benschop, J.; Nam, H.V.; Jackson, R. Spatio-temporal epidemiology of highly pathogenic avian influenza outbreaks in the two deltas of Vietnam during 2003–2007. Prev. Vet. Med. 2009, 89, 16–24. [Google Scholar]
- World Bank. The Avian Influenza Emergency Recovery Project; Implementation Completion and Results Report; World Bank: Washington, DC, USA, 2007. [Google Scholar]
- Peyre, M.; Desvaux, S.; Phan Dang, T.; Rossi, V.; Renard, J.F.; Vu Dinh, T.; Roger, F. Financial Evaluation of Vaccination Strategies against HPAI. A Modeling Approach. In Proceedings of AI Research to Policy International Workshop, FAO, Hanoi, Vietnam, 16–18 June 2008.
- Phan, D.T.; Dusquesne, B.; Lebailly, P.; Vu, D.T. Diversification and epidemic risks of poultry production systems in Hanoi suburb. J. Sci. Dev. 2010, 8, 203–215. [Google Scholar]
- Center for Agricultural Policy (CAP). Policy Analysis of HPAI Strategy Including Analysis of Collaboration and Partnership between Public and Private Sectors: Gathering Evidence for a Transitional Strategy (GETS) for HPAI H5N1 Vaccination in Vietnam; Report OSRO/VIE/801/USA; CAP: Hanoi, Vietnam, 2011. [Google Scholar]
- World Organisation for Animal Health (OIE). Update on Highly Pathogenic Avian Influenza in Animals; Follow-up Report No. 77, 1828/TY-DT, OIE Ref: 12349; OIE: Paris, France, 2012. [Google Scholar]
- Earls, J.; Dixon, B. Spatial Interpolation of Rainfall Data Using ArcGIS: A Comparative Study. In Proceedings of the Environmental Systems Research Institute (ESRI) User Conference, San Diego, CA, USA, 18–22 June 2007.
- Le, T.; Rambo, A. Bright Peaks, Dark Valleys: A Comparative Analysis of Environmental and Social Conditions and Development Trends in Five Communities in Vietnam’s Northern Mountain Region; The National Political Publishing House: Hanoi, Vietnam, 2001. [Google Scholar]
- SRTM Data Search. Available online: http://srtm.csi.cgiar.org/SELECTION/inputCoord.asp (accessed on 28 December 2010).
- Verbeek, M. A Guide to Modern Econometrics; John Wiley & Sons: Chichester, UK, 2008. [Google Scholar]
- Akaike, H. A new look at the statistical model identification. IEEE Trans. Autom. Control 1974, 19, 716–723. [Google Scholar]
- Webster, R.; Oliver, M.A. Geostatistics for Environmental Scientists; Wiley: Chichester, UK, 2007. [Google Scholar]
- Goovaerts, P. Geostatistical approaches for incorporating elevation into the spatial interpolation of rainfall. J. Hydrol. 2000, 228, 113–129. [Google Scholar]
- Biggeri, A.; Dreassi, E.; Catelan, D.; Rinaldi, L.; Lagazio, C.; Cringoli, G. Disease mapping in veterinary epidemiology: A Bayesian geostatistical approach. Stat. Methods Med. Res. 2006, 15, 337–352. [Google Scholar]
- Diggle, P.J.; Ribeiro, P.J., Jr. Bayesian inference in Gaussian model-based geostatistics. Geogr. Environ. Model. 2002, 6, 129–146. [Google Scholar]
- Krivoruchko, K. Spatial Statistical Data Analysis for GIS Users; Esri Press: Redlands, CA, USA, 2011. [Google Scholar]
- Harrell, F. Comparisons of Strategies for Validating Binary Logistic Regression Models, Technical Report; Division of Biostatistics and Epidemiology, Virginia University: Charlottesville, VA, USA, 1998. [Google Scholar]
© 2013 by the authors; licensee MDPI, Basel, Switzerland. This article is an open access article distributed under the terms and conditions of the Creative Commons Attribution license (http://creativecommons.org/licenses/by/3.0/).
Share and Cite
Tran, C.C.; Yost, R.S.; Yanagida, J.F.; Saksena, S.; Fox, J.; Sultana, N. Spatio-Temporal Occurrence Modeling of Highly Pathogenic Avian Influenza Subtype H5N1: A Case Study in the Red River Delta, Vietnam. ISPRS Int. J. Geo-Inf. 2013, 2, 1106-1121. https://0-doi-org.brum.beds.ac.uk/10.3390/ijgi2041106
Tran CC, Yost RS, Yanagida JF, Saksena S, Fox J, Sultana N. Spatio-Temporal Occurrence Modeling of Highly Pathogenic Avian Influenza Subtype H5N1: A Case Study in the Red River Delta, Vietnam. ISPRS International Journal of Geo-Information. 2013; 2(4):1106-1121. https://0-doi-org.brum.beds.ac.uk/10.3390/ijgi2041106
Chicago/Turabian StyleTran, Chinh C., Russell S. Yost, John F. Yanagida, Sumeet Saksena, Jefferson Fox, and Nargis Sultana. 2013. "Spatio-Temporal Occurrence Modeling of Highly Pathogenic Avian Influenza Subtype H5N1: A Case Study in the Red River Delta, Vietnam" ISPRS International Journal of Geo-Information 2, no. 4: 1106-1121. https://0-doi-org.brum.beds.ac.uk/10.3390/ijgi2041106