Article

Ecological Network Construction Based on Minimum Cumulative Resistance for the City of Nanjing, China

School of Environment and Spatial Informatics, China University of Mining and Technology, Xuzhou 221116, China
*
Author to whom correspondence should be addressed.
ISPRS Int. J. Geo-Inf. 2015, 4(4), 2045-2060; https://0-doi-org.brum.beds.ac.uk/10.3390/ijgi4042045
Submission received: 19 July 2015 / Revised: 10 September 2015 / Accepted: 7 October 2015 / Published: 13 October 2015
(This article belongs to the Special Issue Bridging the Gap between Geospatial Theory and Technology)

Abstract

:
With economic growth and the improvement of the urbanization level, human activities have constantly interfered with landscape patterns, resulting in serious threats to regional ecological security. Therefore, it is of great significance to study the evolution and optimization of the landscape patterns. Based on three TM images from 1990, 2000, and 2010, and selected landscape pattern indexes, the changes in the landscape pattern of Nanjing in the past twenty years were studied based on landscape ecology theory using Remote Sensing (RS) and a Geographical Information System (GIS). The ecological network was built on the basis of extracted ecological nodes and the minimum cumulative resistance. The results show that changes in the landscape pattern of the city of Nanjing were notable. Class-level indexes indicate that the farmland landscape area decreased and the degree of patch fragmentation increased. The construction land area increased, and it tended to show dispersed distribution. The proportion of forest land increased and the shape of patches became more complex. The proportion of water firstly showed a decrease, followed by an increase, and the shape of the water became more regular. Landscape-level indexes indicate that biological diversity and the degree of fragmentation increased. Spatial heterogeneity of the natural landscape increased, and the patch shape of each landscape type developed similarly. The results also call for stepping-stones to enhance the connectivity and optimization of the ecological network, which will help improve ecological services and improve the landscape pattern of the city.

Graphical Abstract

1. Introduction

Landscape patterns refer to the spatial structure and characteristics of landscape components, namely the spatial configuration of landscape patches that differ in size and shape [1,2]. They are formed by natural and human factors. As the most densely-distributed area in terms of population, energy, materials, and information, cities with urbanized development are ecosystems that suffer from severe human disturbance [3], and the landscape patterns of cities are also undergoing profound changes. In recent years, many experts and scholars have conducted research on landscape pattern changes in various areas, including cities [4,5,6,7,8]. Most of the research is based on multi-temporal, remote-sensing data sources and uses the landscape pattern index method to measure the change characteristics of the landscape in a given area through a classification-based interpretation of remote sensing images [9,10,11].
An ecological node is defined as a place that is distributed in a spatial ecosystem with a high service function value; it is a landscape component that connects the adjacent ecological source and plays the key role of the regional ecological flow [12]. An urban ecological corridor is a linear or zonal landscape component that is based on a natural or artificial corridor mainly by virescence. It is the information channel connecting landscape elements, which has the dual function of connector and barrier. Ecological nodes and ecological corridors are connected with each other to form a network system, which is an ecological network. The concept of an ecological network was first proposed during the era of park planning in the late 19th century. Early thought about ecological network construction can be seen in the Boston Park System of Olmsted [13]. In the 1990s, the application range of the ecological network concept became broader, with the research scale expanding from “site” to “local”, then to “region”. The construction of an ecological network realizes the movement of material, energy, and information in the ecosystem and the migration of species [14,15]. In addition, as a strategic measure, ecological network construction has been valued highly by planners and land managers, and it is widely accepted and recognized all over the world [16,17]. The USA and Canada put the theory of ecological networks into practice and developed region-scale ecological network planning [18,19]. Chinese scholars mostly learned about earlier foreign theories and examples of ecological network construction and used geographic information system (GIS) techniques and the theory of ecological network construction to help build cities. Their studies have focused on urban green-land system planning [20,21], applications of GIS in ecological network construction [22,23,24,25,26,27], the analysis and evaluation of the structure of urban ecological networks [28], and studies on the ecological network planning model [29]. There are some practical applications of urban ecological network construction in China. For example, Yang used the landscape pattern principle to determine the potential landscape ecological security network in Guangzhou City, and contacted the ecological space planning [30]. In the ecological network planning of Xiamen City, Wang abstracted the green patch and urban ecological corridor as node and link, respectively, by using the network analysis method to analyze the topological relationship between the nodes and links, and finally selected the network model with highest degree of connection as the best ecological network design [31].
This paper presents a study on the landscape pattern changes in the City of Nanjing and the construction of its ecological network using Remote Sensing (RS)/Geographical Information System (GIS) techniques. The aim of this study was to enhance the relationship between the landscape elements and connectivity of the city’s complete ecosystem and to promote the ecological service functioning of the urban landscape systems. Both the scientific basis and practical decision support are discussed.

2. Study Area and Methods
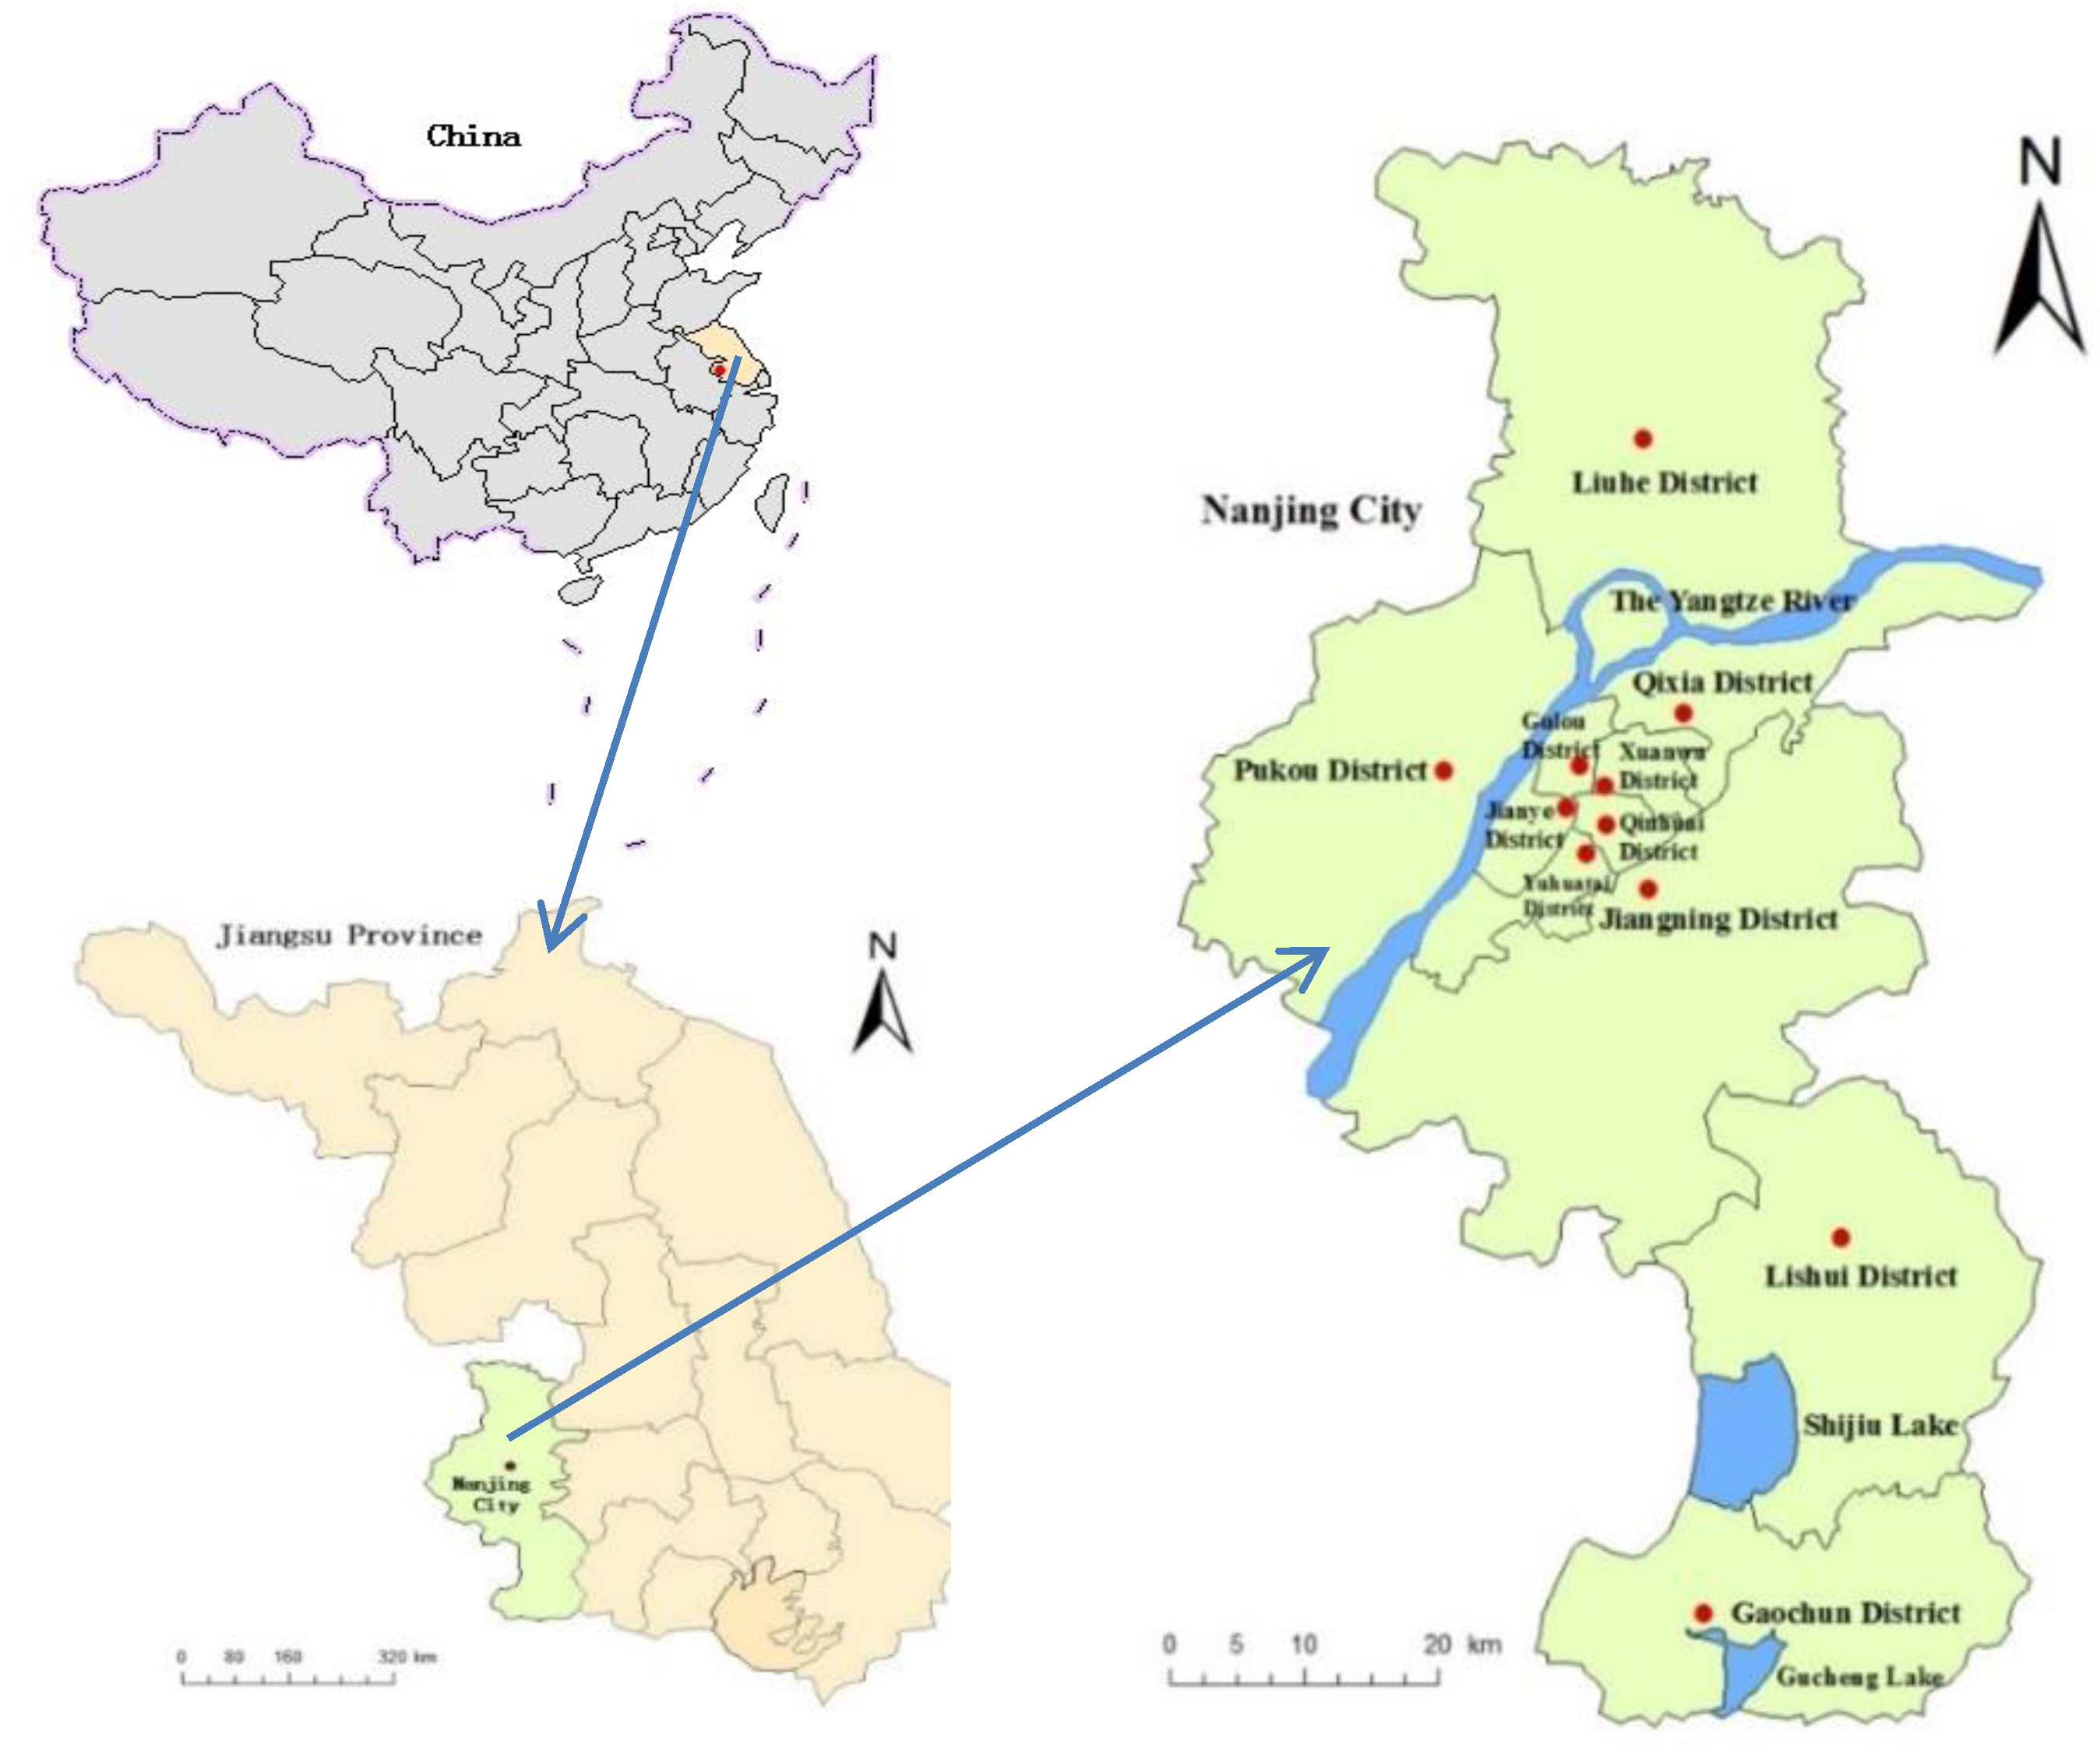
2.1. Study Area

Nanjing is a city in China that lies in the central region of the middle and lower Yangtze River and the southwestern part of Jiangsu province. It is a hub city in the western part of the Yangtze River Delta and one of four central cities in the Yangtze River basin. The main rivers in Nanjing City are the Yangtze River and Qinhuai River, as well as the Chunli River and Tianshengqiao River in the south, and the Chu River in the north. Nanjing belongs to the Ningzhenyang region, where low mountains account for 3.5% of the total land area, hilly areas account for 4.3%, hillock areas account for 53%, and low-lying land, river and lack account for 39.2%. Nanjing is surrounded by water and mountains, and the hilly areas are widely distributed. The administrative districts of Nanjing include Gulou District, Xuanwu District, Jianye District, Qinhuai District, Qixia District, Yuhua District, Pukou District, Jiangning District, Liuhe District, Lishui District, and Gaochun District. There are eleven administrative districts, as illustrated in Figure 1.
Figure 1. Location and administrative districts of Nanjing in Jiangsu Province, China.
Ijgi 04 02045 g001

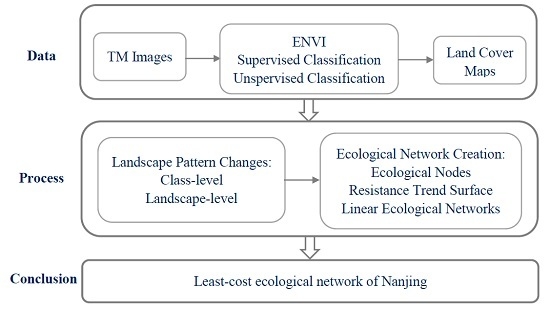
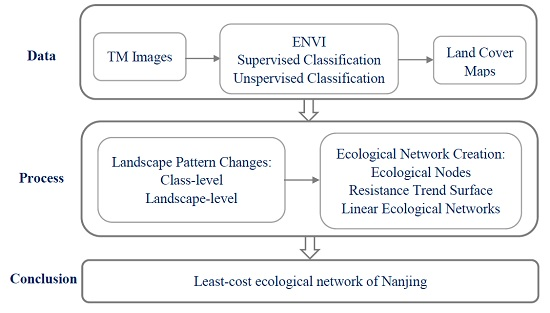
2.2. Data Acquisition and Processing

The three TM images from 1990, 2000, and 2010 were obtained from the Center for Earth Observation and the Digital Earth Chinese Academy of Sciences and were used as the basis for landscape classification. (The center is a subordinate unit of the Chinese Academy of Sciences and is organized based on the Chinese Academy remote sensing satellite ground station and the Chinese Academy aviation remote sensing center and digital earth laboratory. The Center for Earth Observation primarily conducts high-quality operations and data services for the government, industries, and firms in the field of aerospace and aviation). The row-column number of the image track is P122 R38. The three images have approximately 10% cloud coverage, contain six bands (data acquired in 1–5 and 7 bands from the visible to near-infrared) and have a spatial resolution of 30 m. The methods for system radiation correction and geometric correction are based on a ground control point, and terrain correction was used to process the original images. WGS_1984_UTM_Zone_50N was selected as the projected coordinate system. According to the Chinese Land Use Classification System (General Administration of Quality Supervision, Inspection, and Quarantine of the PRC and Standardization Administration of the PRC [32]) and the characteristics of land use status in Nanjing, the four land-cover classes are farmland, construction land, forestland, and water. The images were classified using both supervised and unsupervised classification methods with the help of ENVI software. Figure 2 shows a land cover map from 1990 to 2010 in Nanjing. As shown in Figure 2, from 1990 to 2000, the area of farmland was the largest, while the areas of water, forestland, and construction land were relatively small and dispersed; the area of Nanjing city proper increased, and the construction land areas in the rural and suburban parts tended to decrease. These changes were related to the rural integration and new rural construction of Nanjing. From 2000 to 2010, the areas of water and construction land clearly increased, especially the area of construction land. The fragmentation degree of the Nanjing landscape in 2010 was significantly greater than in 1990 and 2000. According to the Nanjing master urban plan (1991–2010), the government planned to build a historical and cultural city protection zone and scenic tourist area with “mountains, water, city and forest” as the main areas in the city proper and area along the Yangtze River.

2.3. Selection and Calculation of the Landscape Pattern Indexes

The classified remote images were converted into grid data of 30 m × 30 m, and the landscape pattern indexes were calculated using Fragstats 3.3 software to analyze the changes to the landscape patterns in the City of Nanjing during its urbanization process. Fragstats 3.3 is a landscape index calculation software developed by the School of Forest Science at Oregon State University in the USA, in which complicated landscape pattern index calculations can be produced using a simple computer program [33]. Landscape pattern indexes that are less correlated were selected at both the class and landscape levels. The class-level indexes are PLAND, AREA_MN, PD, LSI, and AI; the specific ecological meanings and calculation equations of the class-level indexes are shown in Table 1. The landscape-level indexes are SHDI, SHAPE_AM, FRAC_AM, SI, and SHEI; the specific ecological meanings and calculation equations of the landscape-level indexes are shown in Table 2 [34,35,36]. A GIS spatial attribute database was constructed using ArcGIS.
Figure 2. Land cover map from 1990 to 2010 in Nanjing: (a) 1990; (b) 2000; (c) 2010.
Ijgi 04 02045 g002
Table 1. Specific ecological meanings and calculation of class-level indexes.
Class-Level IndexesEcological MeaningCalculation Equation
PLANDReflecting the situation of landscape grouping( PLAND = P i = a i j A   ( a i j   represents the area of patch ij ; A represents total area of the landscape)
AREA_MNReflecting the aggregation or fragmentation degree of the landscape patches AREA _ MN = A N (A represents total area of the landscape; N represents the number of the whole patches)
PDReflecting the spatial heterogeneity of the landscape PD = n A (n represents the number of patches; A represents total area of the landscape)
LSIReflecting the variability of the landscape patches LSI = E 4 A (E represents the total length of all patch boundaries in the landscape; A represents total area of the landscape)
AIDescribing the agglomeration degree of different components in the landscape AI = [ g i i m a x g i i ] (100) ( g i i represents the number of adjacent patches in the corresponding landscape types)

2.4. Construction of the Ecological Network

Firstly, ecological nodes in Nanjing were selected as ecological points, including forest parks, scenic areas, and wetlands. Secondly, the resistance value of a landscape type, which refers to the effect of one landscape type on the ecological flow rate, can be determined based on experience and expert investigation. Landscape resistance refers to the impact of the landscape on the ecological flow rate and the creation of the landscape resistance surface using ArcGIS according to the landscape resistance values. Thirdly, the least cost gradient data based on the minimum cumulative resistance (MCR, which is the cumulative distance from a certain landscape unit with the resistance value linked to the ecological source) and the cost distance function in ArcGIS is calculated. The cost distance function is an algorithm of the grid data, moving from the center to the periphery of the eight units. As shown in Equation (1), the cumulative cost that any N i moves to four vertically-adjacent units N i   +   1 is half of the total cost coefficient moving from   N i to   N i   +   1 ; and as shown in Equation (2), the cumulative cost that any N i moves to four diagonally-adjacent units N i   +   1 is the product of half of the total cost coefficient moving from   N i to   N i   +   1 and the square root of 2.
N i   +   1   =   N i   +   ( r i   +   r i   +   1 ) / 2
N i   +   1   =   N i   +   2   ×   ( r i   +   r i   +   1 ) / 2
In the equations, N i and r i represent the cumulative cost and the cost coefficient of unit i, respectively; N i   +   1 and r i   +   1 represent the cumulative cost and the cost coefficient of moving to unit i + 1.
Table 2. Specific ecological meanings and calculation of the landscape-level indexes.
Landscape-level IndexesEcological MeaningCalculation Equation
SHDIInvestigating the diversity of the landscape pattern SHDI = ( P i l n P i ) ( P i represents the ratio that a certain type of patch accounts for in the whole landscape)
SHAPE_AMReflecting the complexity of the shape of the patches SHAPE _ AM = 0.25 P i j a i j ( P i j represents the perimeter of the patch ij; a i j represents the area of the patch ij)
FRAC-AMReflecting the complexity degree of the shape of average patches in the landscape FRAC _ AM = 2 ln ( P i j / 4 ) l n a i j ( P i j represents the perimeter of the patch ij; a i j represents the area of the patch ij)
SIReflecting the complexity of the landscape space structure SI = P i j 4 A i j ( P i j represents the perimeter of the patch ij; A i j represents the area of the patch ij)
SHEIReflecting the uneven distribution degree of area for each patch in the landscape SHEI = P k l o g 2 P k l o g 2 n ( P k   represents the ratio that the area of patch k accounts for in the whole landscape; n represents the total number of patch types in the landscape)
Finally, the direction and route of least cost is determined and the least-cost ecological network is extracted by setting several threshold values of the cost network.

3. Results

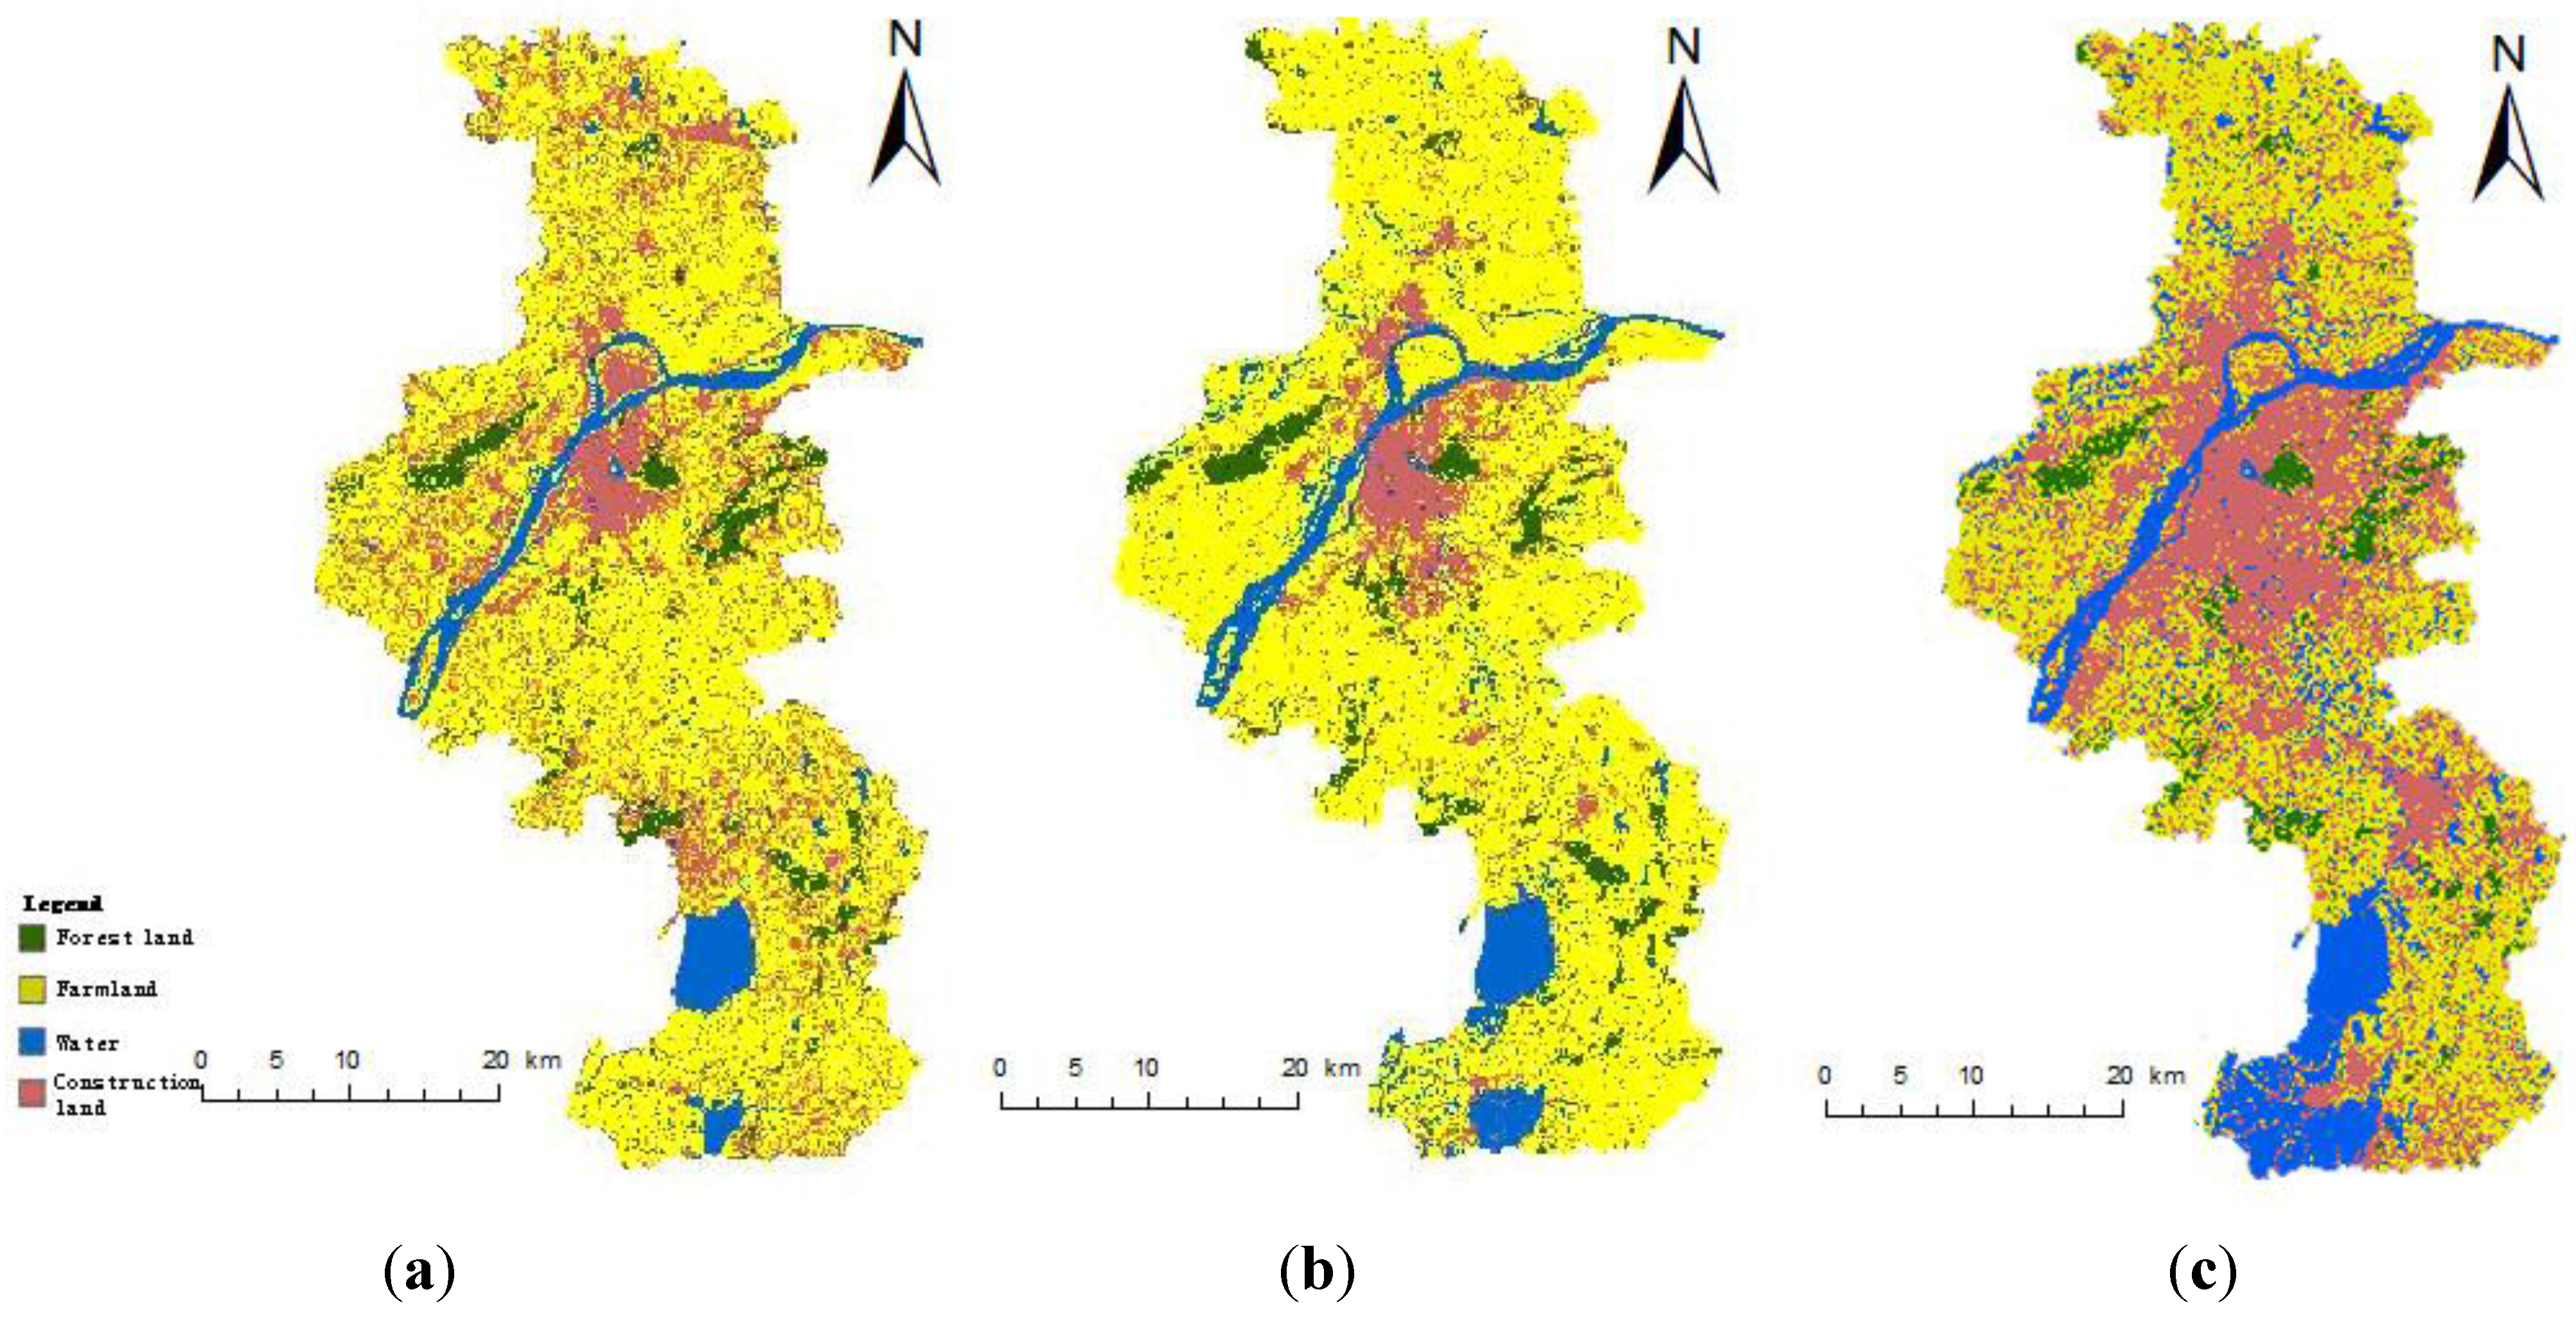
3.1. Analysis on the Characteristics of the Landscape Pattern Change

3.1.1. Class-Level

The change characteristics of the landscape types are shown in Table 3.
Table 3. Class-level indexes from 1990 to 2010.
Land Cover TypesYearPLANDAREA_MNPDLSIAI
Farmland199067.19263.010.2582.6292.51
200065.95220.420.3073.1293.42
201054.58214.730.8187.4691.32
Water199011.6319.560.9166.7579.57
20008.4921.030.6350.8080.70
201011.0922.420.3445.2586.93
Forest19907.1514.910.3746.0587.48
20008.4915.320.4050.9487.27
20108.6916.550.9066.1983.56
Construction land199014.048.601.63104.1686.78
200015.9310.291.55104.7688.09
201025.6520.380.9090.2790.13
The variation in the characteristics of PLAND: PLAND reflects the components of the landscape. As shown in Table 1, the proportion of farmland type—mostly composed of natural landscape and managerial landscape—decreased from 67.19% to 54.58%. The proportion of construction land, mainly artificial landscape, increased from 14.04% to 25.65%. The proportion of water area decreased by 3.14% from 1990 to 2000 because of the large-area pond seine culture in the 1990s and the expansion of the city. In 2010, the proportion of water area reached 11.09%; this change was correlated with the construction of urban wetland parks and large-area aquaculture activities in Gaochun District. The proportion of forest and construction land both increased. The increased proportion of forestland reflected a move by the Nanjing government toward the construction of natural reserves, scenic areas, and forest parks. The expansion of construction land was the inevitable outcome of urbanization.
The variation in the characteristics of the AREA_MN: The AREA_MN index represents the degree of aggregation or fragmentation of the landscape patches. We can see from the contemporaneous data that the AREA_MN of farmland showed the highest index value, which means that farmland had a dispersed distribution. The indexes for the other three types of landscape were all at low levels, which indicate that the patches were smaller in size and saw a dispersed distribution. From 1990 to 2010, the AREA_MN value of the farmland in Nanjing decreased by 48.28 ha. This shows that the farmland landscape was separated by artificial landscapes and that the degree of fragmentation became deeper. As noted in the master urban plan of Nanjing (1991–2010), the government planned to increase the ecological land area and, thus, the AREA_MN of water and forest increased. The AREA_MN value of construction land increased from 8.6 ha to 20.38 ha over 20 years. This change of 11.78 ha also indicates a widely dispersed distribution of construction land patches.
The variation in the characteristics of PD: PD is defined as the number of patches per unit area; the more that PD increases, the greater the heterogeneity and fragmentation become. The PD of farmland and forestland increased by 0.56 and 0.53 over the past 20 years, respectively, while the PD of water and construction land decreased by 0.57 and 0.73. The results show the increased fragmentation of farmland and forestland and a trend of these lands being converted to small-scattered patches. The anti-risk ability of the eco-function land declined. Water and forestland became small aggregate patches. This can be seen in the classified remote sensing images in Figure 2.
The variation in the characteristics of LSI: LSI reflects the heterogeneity of the landscape patches. Compared with the two other landscape types, the LSI values of construction land and farmland are the highest and the second highest, respectively. The patch shape of the two types was more complex than the shape of the other land types. The LSI of farmland saw an initial decreasing trend followed by an increase. The index decreased by 9.5, which was caused by agricultural land consolidation and the planting of green belts during the first 10 years (1990–2000). In the subsequent 10 years (2000–2010), the index increased by 14.34 due to the separation of farmland with artificial landscapes, which resulted in many patches bearing more complex shapes. The water LSI reduced gradually and the shape of water became more regular. The forestland LSI saw a constant increase, with a more complex shape. The LSI of construction land showed a slight increase from 1990 to 2000, possibly because the Urban Planning Division in Nanjing claimed that development of the city proper should be coordinated with the surrounding towns. Under the guidance of the Urban Planning group, patches of construction land saw a dispersed expansion. Since 2000, the LSI of construction land has decreased sharply from 104.76 to 90.27. The possible reason for this decrease was that the government made local rectifications with the Urban Planning group of Nanjing in 2000: the urban structure of the city proper and the 12 surrounding towns in the Nanjing Metropolitan Area were adapted to the structure of city proper-new city-new urban area. Patches of construction land were combined, and the shape tended to be regular.
The variation in the characteristics of AI: AI is the degree of aggregation of the landscape patches of the different types. From 1990 to 2010, the AI of farmland was 92.51, 93.42, and 91.32, showing a rising-and-falling trend. This trend reflects agricultural development in the 1990s and the later construction encroachment into farmlands up to 2010. The forestland AI fell from 87.48 in 1990 to 83.56 in 2010; this change was due to deforestation by humans. The constantly increasing AI of water and construction land indicated that patches of water and construction land aggregated gradually and tended to distribute like crumbs. This situation was caused by creating planned water conservancy land and extending construction land.

3.1.2. Landscape-Level

The changes at the landscape level are shown in Table 4.
SHDI reflects the complexity and heterogeneity of land use in the paper. The change of SHDI was not notable from 1990 to 2000, during which the index increased only by 0.135 from 2000 to 2010. The index increase of 0.135 from 2000 to 2010 meant that the diversity of the whole landscape increased, the number of dispersed patches became bigger, and spatial heterogeneity was increased because the scattered urban land has broken up the landscape.
SHAPE_AM and FRAC_AM exhibit a decreasing trend, which shows that the shape of the overall city landscape became more regular. The shape of these four landscape patch types became similar. Aggravated disturbance by humans (planning adjustment for land use) was consistent with the result of the analysis.
SPLIT increased from 5.13 to 10.08, which explains the natural landscape fragmentation caused by human landscape disturbance. Landscape fragmentation led to single patch area decreases, and the fragmentation of the territory and loss of connectivity has become a worldwide problem [37,38,39,40].
SHEI had not changed significantly between 1990 and 2000. By 2010, however, the SHEI value showed an improvement, indicating that major landscape types no longer played a dominant role, the average patch area became similar and the patches tended to have a uniform distribution.
Table 4. Landscape-level indexes from 1990 to 2010.
YearSHDISHAPE_AMFRAC_AMSPLITSHEI
19901.0134.231.295.130.73
2000127.801.285.990.72
20101.13522.481.2710.080.82

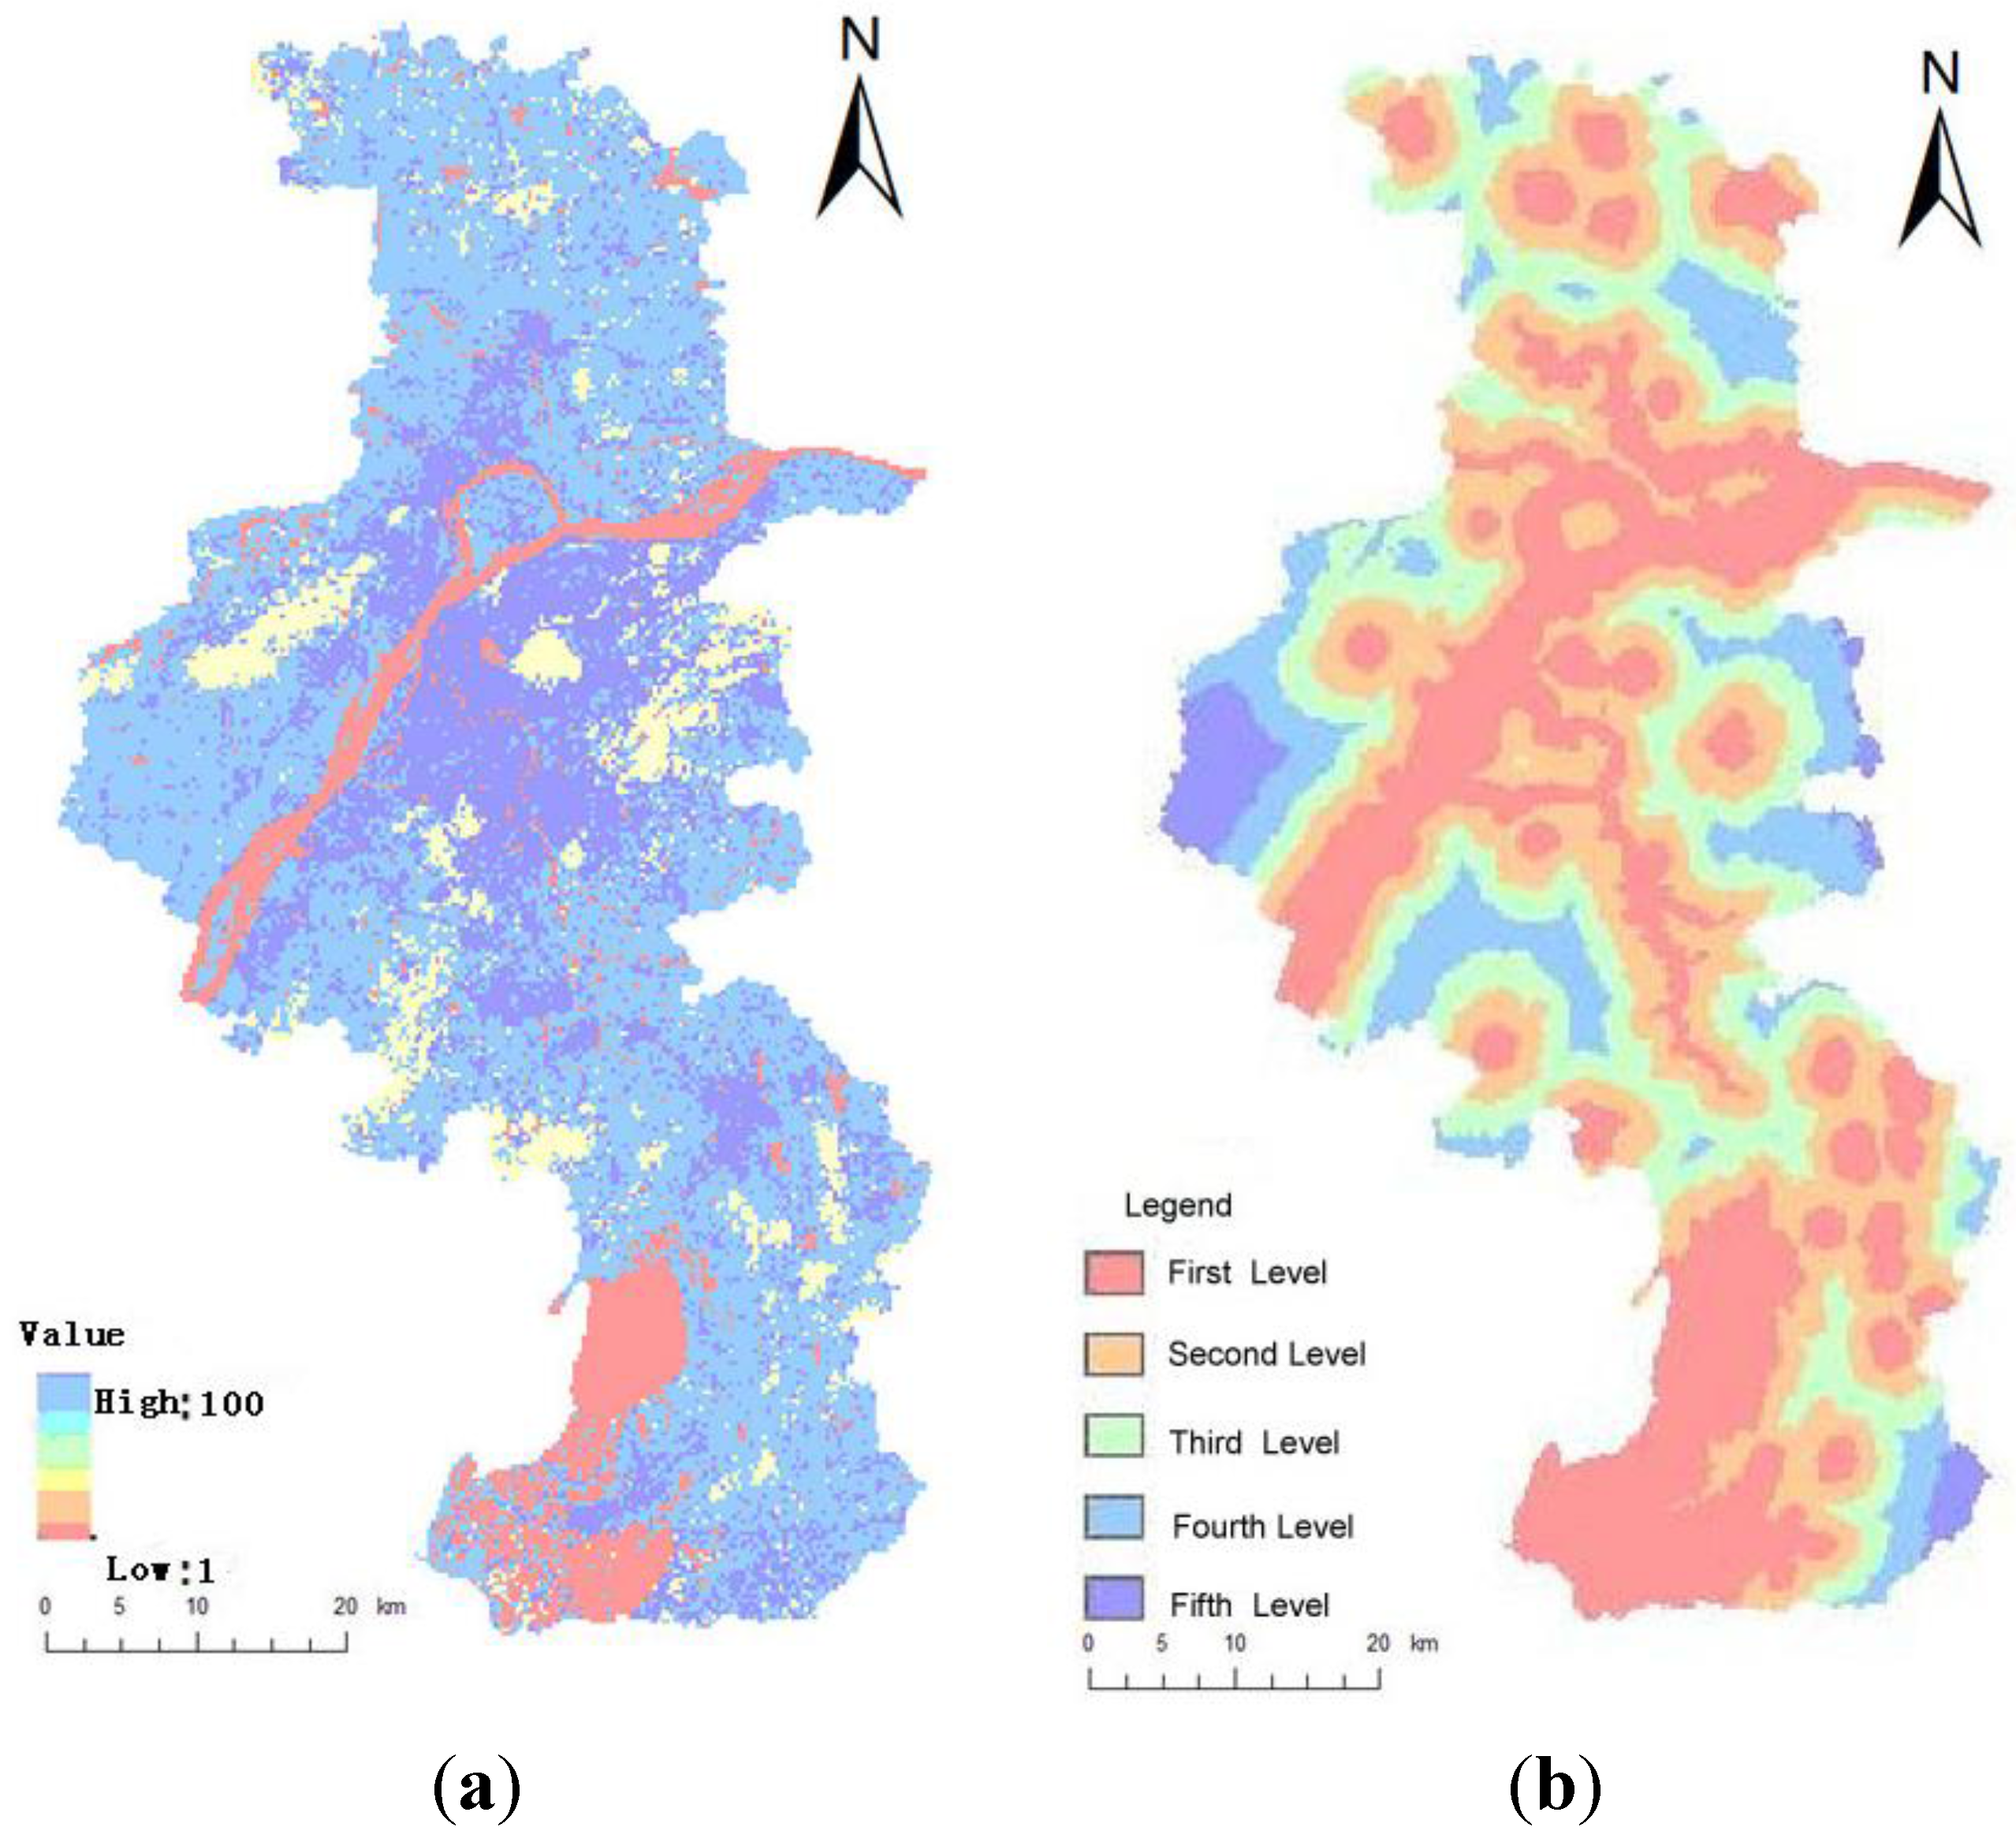
3.2. Creation of the Ecological Network

3.2.1. Extraction of Ecological Nodes

Ecological nodes are the convergence points of materials, energy, and services [41]. In urban and rural areas, ecological nodes include green landscapes, which consist of city green areas, farmland, garden land, forestland, other agricultural land, and blue landscape that includes rivers, lakes, reservoirs, and wetlands.
On the basis of the Ecological Red Line Area Protection Plan of Jiangsu Province, which was developed by the Jiangsu government in 2013 [42], this study selected scenic areas, forest parks, and large water source regions as ecological nodes from the list of ecological Red Line areas in 2010 in Nanjing (see Table 5). Furthermore, these selected ecological nodes were abstracted as ecological points (see Figure 3).
Table 5. Ecological nodes in 2010 of Nanjing.
TypeNameLocationFunction
Forest parkPurple Mountain Forest ParkJiangning DistrictBiodiversity, natural and human landscape protection
Laoshan Forest ParkPukou DistrictBiodiversity, natural and human landscape protection
Fangshan Forest ParkLiuhe DistrictWater source conservation Natural and human landscape protection
Pingshan Forest ParkLiuhe DistrictNatural and human landscape protection
Wuxiang Temple Forest ParkLishui DistrictBiodiversity, natural and human landscape protection
Dajingshan Forest ParkGaochun DistrictWater source and soil conservation
Scenic areaDragon Mountain Scenic AreaPukou DistrictNatural and human landscape protection
Mufu Mountain Scenic AreaXiaguan DistrictNatural and human landscape protection
Lingyan Hill Scenic AreaLiuhe DistrictGeo-conservation Biodiversity protection
Qixia MountainScenic AreaQixia DistrictBiodiversity, natural and human landscape protection
Niushou Mountain Forest ParkYuhuatai DistrictNatural and human landscape protection
Tang Hill National Geo-parkJiangning DistrictGeological relic protection
Nanshan Scenic AreaJiangning DistrictBiodiversity, natural and human landscape protection
Mao Mountain Residual BranchLishui District
Gaochun District
Biodiversity protection Water source conservation
Youzi Mountain Scenic AreaGaochun DistrictBiodiversity, natural and human landscape protection
WetlandQiqiaoweng Wetland ParkQinhuai DistrictWetland ecosystem maintenance
Xuanwu Lake Wetland ParkXuanwu DistrictWetland ecosystem maintenance
Gucheng Lake Natural ReserveGaochun DistrictWater and aquatic resources
Shijiu LakeLishui District Gaochun DistrictNatural and human landscape protection
Wetland by Yangtze riverXinsheng island, Xinji island, Zaisheng islandWetland ecosystem maintenance
Shanhu ReservoirLiuhe DistrictIrrigated agriculture
Daquan ReservoirLiuhe DistrictIrrigated agriculture
Zheshantou ReservoirJingqiao TownIrrigated agriculture
Yaojia ReservoirJingqiao TownIrrigated agriculture
Wolong Mountain ReservoirLishui DistrictIrrigated agriculture
Zhongshan ReservoirLishui DistrictIrrigated agriculture Water source and water quality protection
Fangbian ReservoirLishui DistrictIrrigated agriculture Water source and water quality protection
Hewangba ReservoirLiuhe DistrictIrrigated agriculture
Zhaocun ReservoirJiangning DistrictIrrigated agriculture
Yanziji Water SourceNorthcity water plantWater source and water quality
Baguazhou Water SourceYuangu water plantWater source and water quality
Jiangpu & Pukou Water SourceJiangpu water plantWater source and water quality
Baguazhou Spare Water SourceJiangning DistrictWater source and water quality
Jiajiang Water SourceJiangning DistrictWater source and water quality

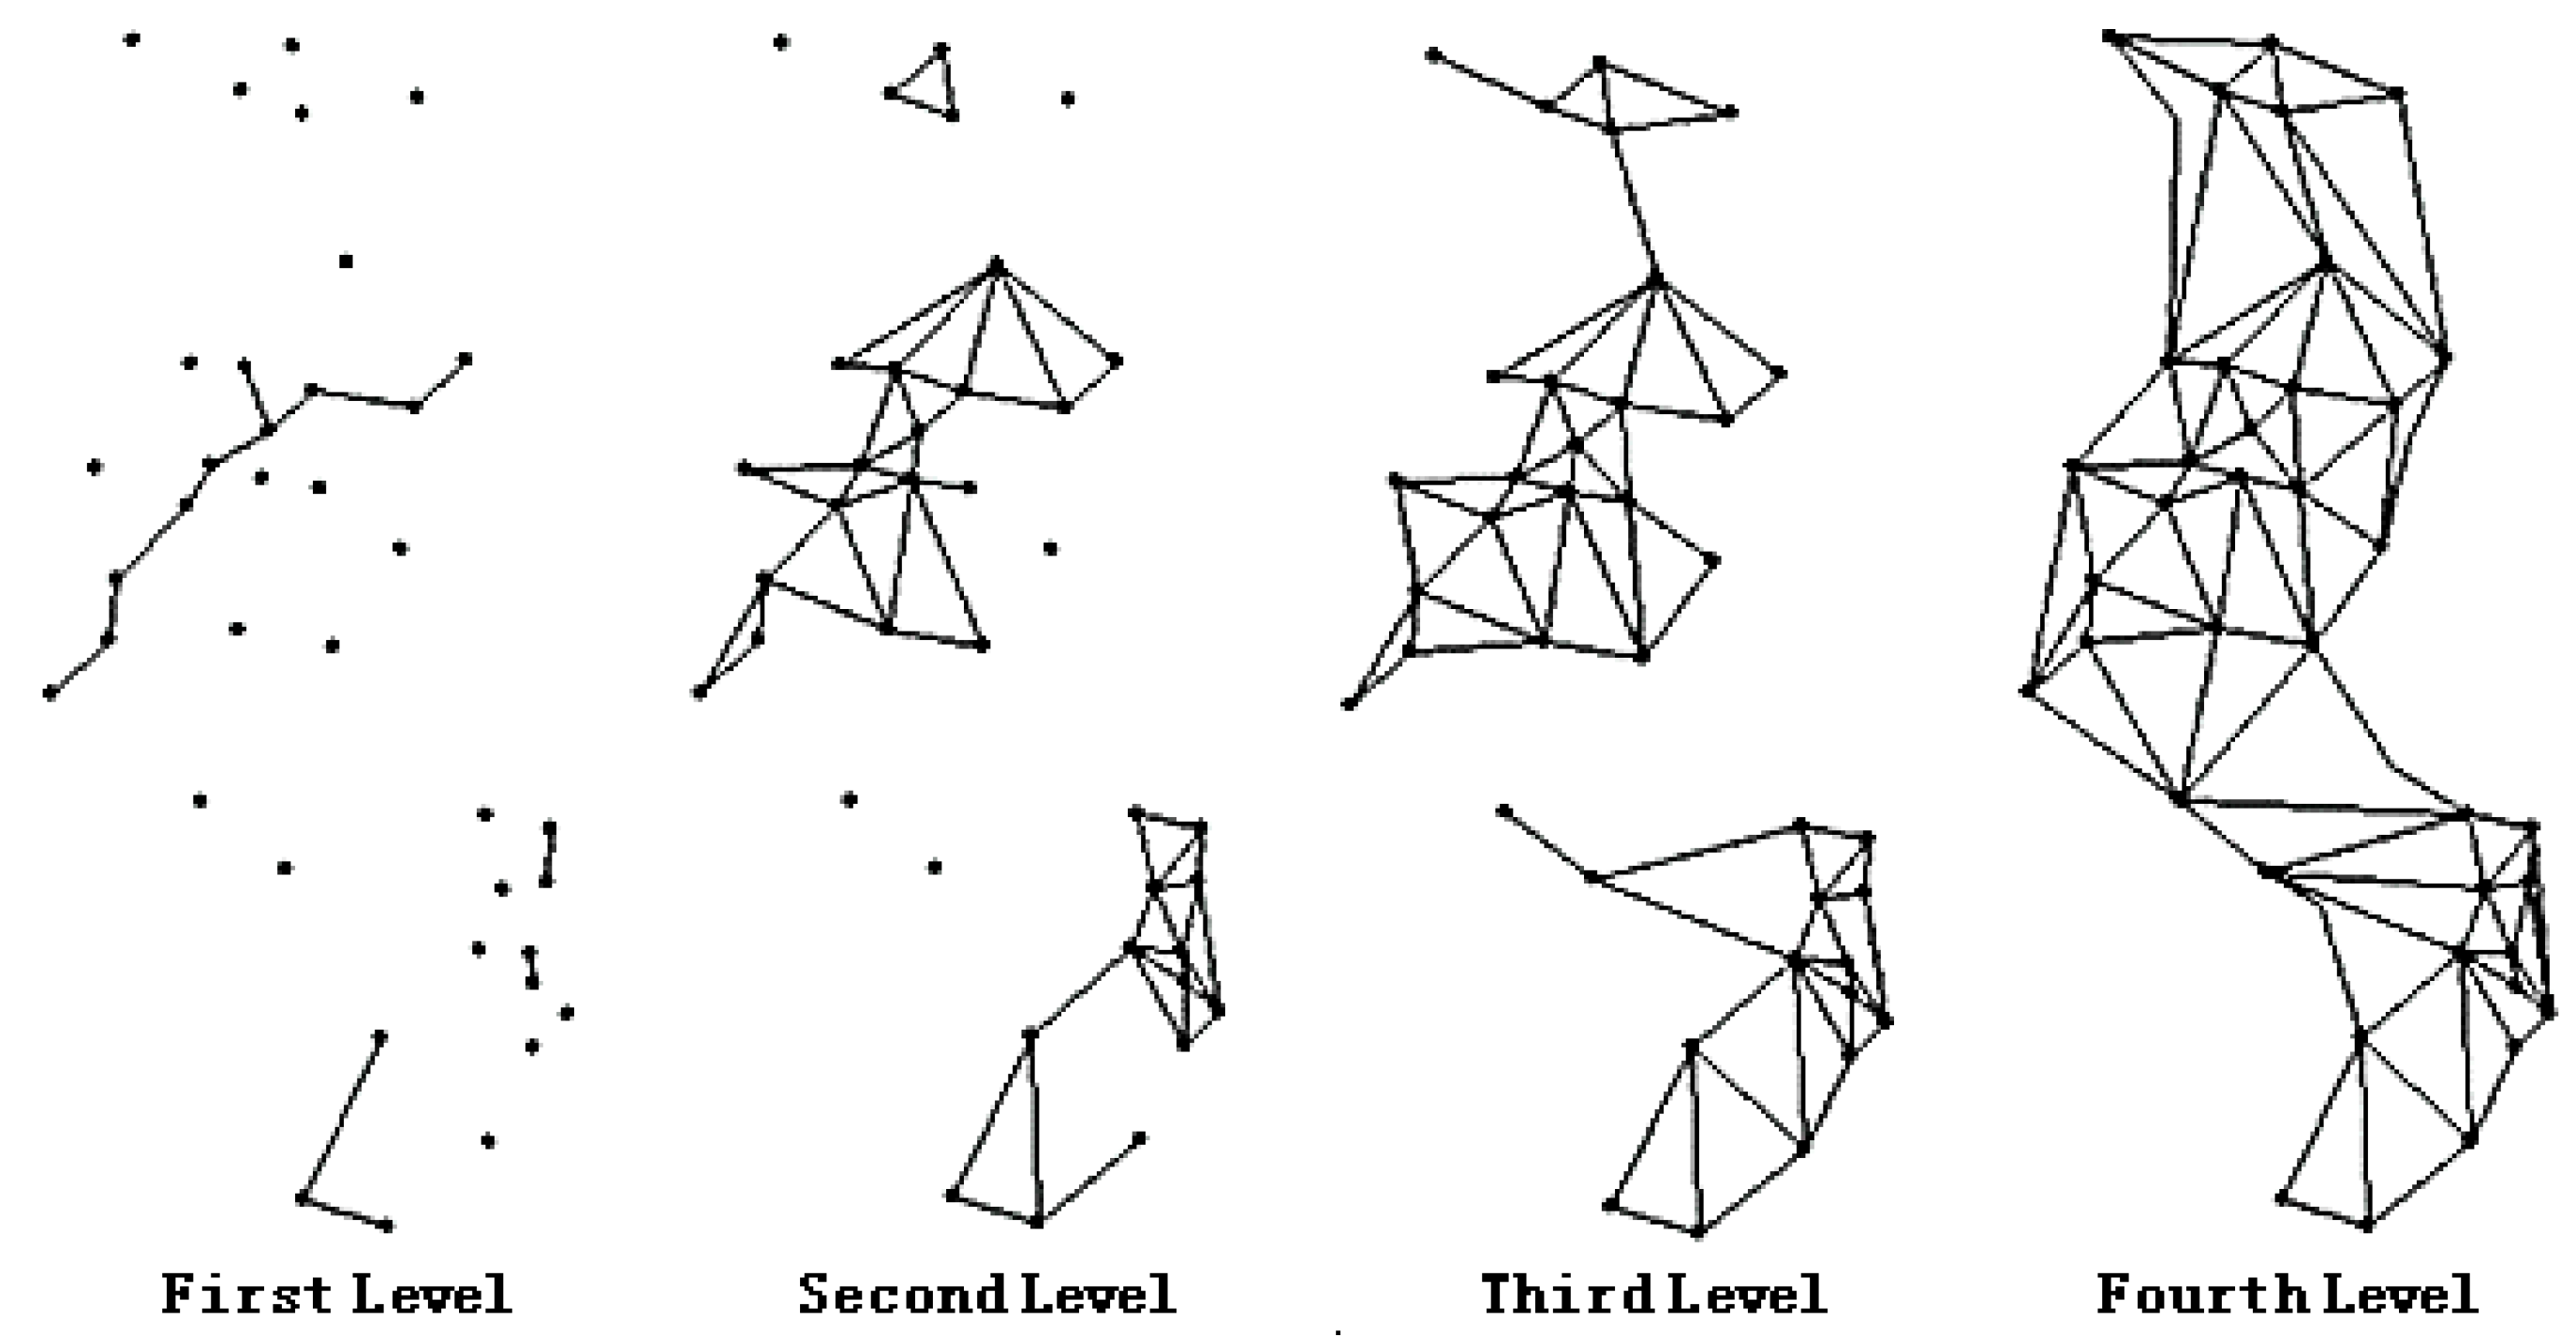
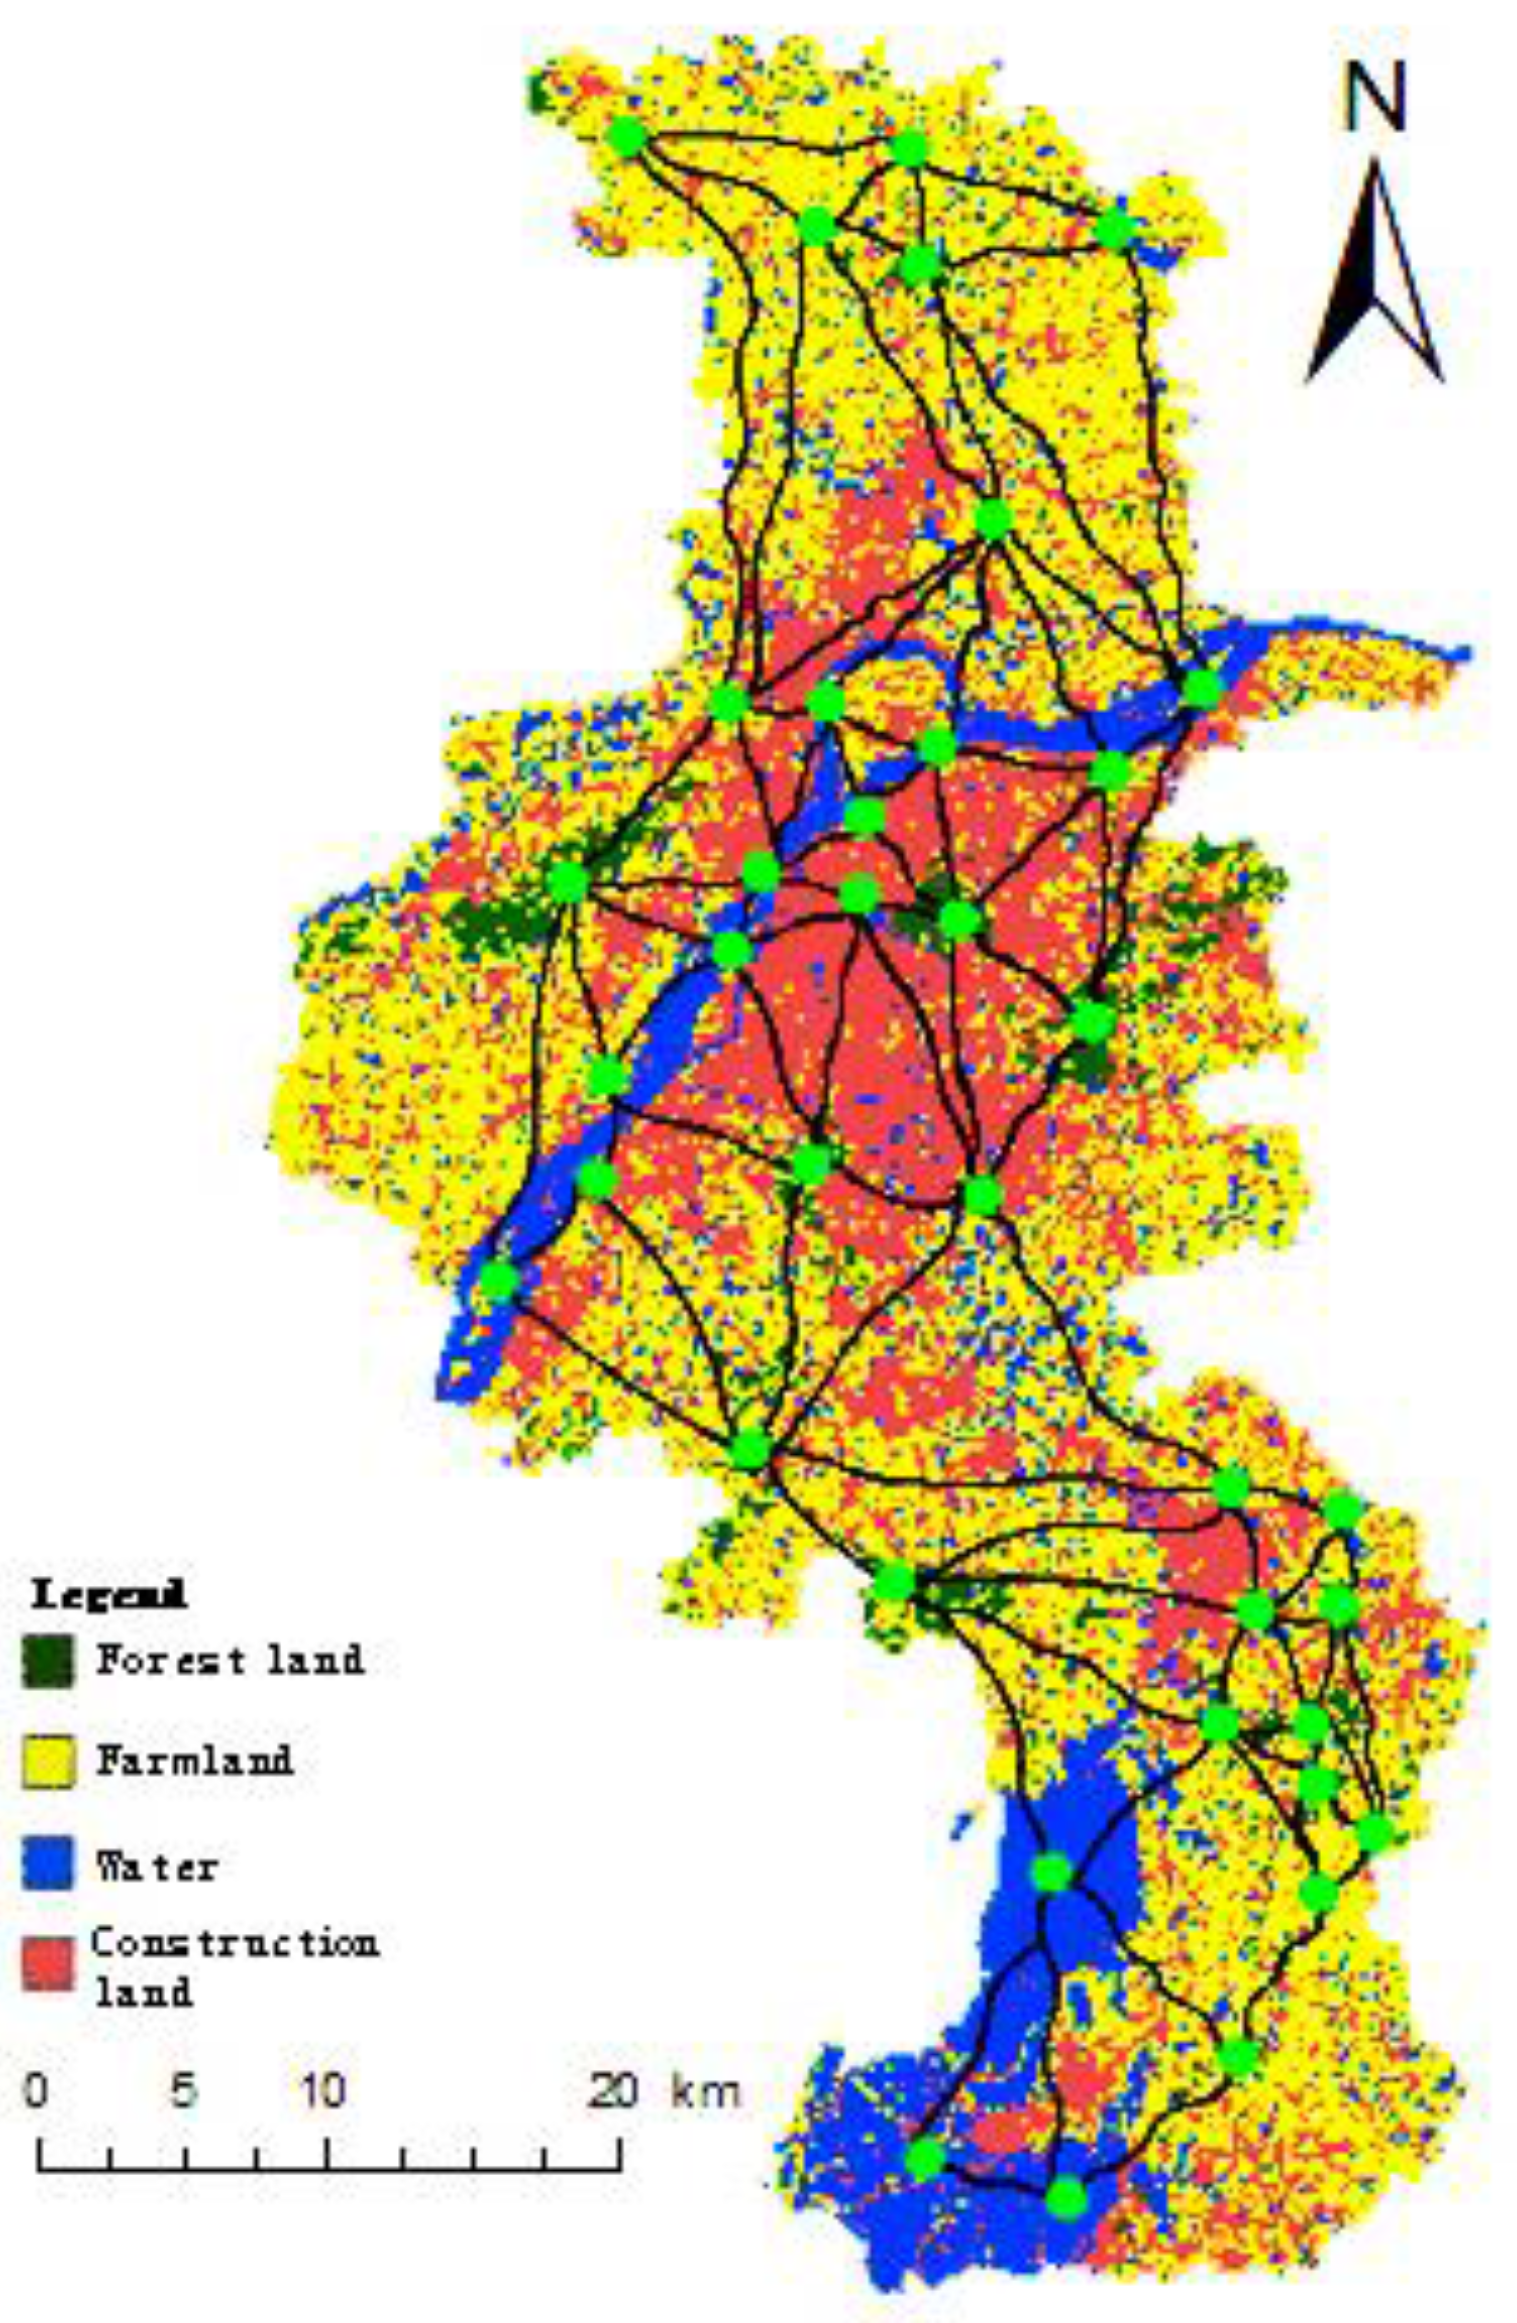
3.2.2. Ecological Network Construction

Construction of resistance and resistance trend surface: According to the influence of the landscape units on landscape migration and expert evaluation [43], the landscape units are classified by resistance and allocated the corresponding resistance parameters, which results in the landscape resistance surface with the help of GIS. The specific steps of the resistance surface construction are as follows: firstly, setting the resistance values of water and construction land, where the resistance values of all water and all construction are 1 and 100, respectively; secondly, setting the resistance values of forest land and farmland based on their own proportional values of ecological service; finally, forming the landscape resistance surface of Nanjing with the help of the surface diffusion technology in GIS (see Figure 4a) [44,45]. Using the selected points as targets and the landscape resistance surface for resistance costs, the least ecological function gradient cost data were calculated based on MCR with GIS techniques. The gradient cost data were then classified to generate a cost trend surface according to five levels of degree (see Figure 4b). The different levels represent the different degrees of landscape resistance: Level 1 represents the lowest degree of landscape resistance, which allows for the easiest ecological function flow, while Level 5 represents the highest degree of landscape resistance, which means that the ecological function flow is the most difficult.
Figure 3. Distribution of ecological nodes of 2010 in Nanjing.
Ijgi 04 02045 g003
Establishment of four-level linear ecological networks: Based on branch networks and ecological function points, four-level linear ecological networks were constructed in the resistance trend surface, as shown in Figure 5.
It can be concluded from Figure 5 that linear ecological networks at the first and second level have isolated source points. The ecological function flows between source points cannot circulate integrally. Linear ecological networks at the third level are capable of connecting all ecological nodes, but they cannot meet the demand for the development integration of ecological networks and some branch networks that existed in remote rural areas. The linear ecological networks at the fourth level provide the highest coverage rate and are capable of connecting all ecological nodes that showed strong connectivity and form a circular ecological network covering the entire area. Moreover, a wider migration space of ecological function flow was provided.
Figure 4. (a) Landscape resistance surface of Nanjing; and (b) landscape resistance trend surface of Nanjing.
Ijgi 04 02045 g004
Figure 5. Representation of four-level linear ecological networks.
Ijgi 04 02045 g005
Construction of the least-cost network: Considering the advantages of the linear ecological network at the fourth level (as stated in the section above), the linear ecological network was analyzed to determine the optimal path. Using MCR from ArcGIS and selecting the direction and path of least cost, the least-cost ecological function network was extracted (see Figure 6).
Figure 6. Least-cost ecological network of Nanjing.
Ijgi 04 02045 g006

4. Conclusions

The effects of the urbanization process on the landscape of the city of Nanjing from 1990 to 2010 were studied using RS, GIS, and the landscape index method. Moreover, an ecological network was generated according to landscape characteristics and MCR. The conclusions were as follows.
(1) The landscape suffered from human disturbance, and natural patches became separated by artificial patches. Landscape fragmentation led to the decrease of farmland patches and the expansion of construction land. SHDI, SPLIT, and SHEI tended to increase, while SHAPE_AM and FRAC_AM decreased, and the shape of the entire landscape became regular.
(2) Laying stepping stones (ecological nodes) between source points and establishing ecological corridors can strengthen landscape connectivity, optimize ecological network structures, and improve ecological services.
In future landscape optimization processes, ecological networks should be built. Moreover, destructive landscapes require rebuilding, wetland parks should be built and protected, and protective green areas need to be planted on both sides of roads and rivers in Nanjing. Confirming inhibitory development scope, such as understanding natural reserves, and scenic areas to avoid damaging the ecological function of the landscape, is necessary. Biological planning should be emphasized to protect internal species and maintain biomass; it is necessary to protect important water sources and reconstruct landscape areas that demonstrate reciprocal inhibition. Finally, MCR theories and methods are expected to be applied in other areas.

Acknowledgments

This work has been funded by the National Science Foundation of China (No.51374208) and the University Advantage Discipline Construction Project in Jiangsu province (No.SZBF2011-6-B53). We want to thank the Jiangsu Key Laboratory of Resources and Environmental Information Engineering at China University of Mining and Technology for its support. Also, we want to thank Songnian Li at Ryerson University, for his guidance and modification of the article.

Author Contributions

Author contributions: Jihong Dong constructed the structure of the article, and wrote the first draft of the manuscript. Wenting Dai was mainly responsible for data and relevant information collection, and finished the initial version of the manuscript. Guoquan Shao completed the images and data processing. Jiren Xu carried out the model validation. All co-authors participated in the field survey, contributed by reviewing the manuscript, and improving the discussion and interpretation of the results.

Conflicts of Interest

The authors declare no conflict of interest.

References

  1. Fu, B.J. Theory and Application of Landscape Ecology; Science Press: Beijing, China, 2001. [Google Scholar]
  2. Forman, R.T.T.; Godron, M. Landscape Ecology; John Wiley and Sons: New York, NY, USA, 1986. [Google Scholar]
  3. Chen, L.D.; Sun, R.H.; Liu, H.L. Eco-environmental effects of urban landscape pattern changes: Progresses, problems and perspectives. Acta Ecol. Sin. 2013, 33, 1042–1050. [Google Scholar] [CrossRef]
  4. Guo, L.; Du, S.H.; Xue, D.Y. Spatio-temporal variation of landscape patterns during rapid urbanization in Guangzhou city. Acta Sci. Nat. Univ. Pekin. 2009, 45, 129–135. [Google Scholar]
  5. Xu, J.X.; Li, G.; Qu, J.F. Changes of land use and landscape pattern in Hongze Lake basin. Resour. Environ. Yangtze Basin 2011, 20, 1214–1215. [Google Scholar]
  6. Chen, X.L.; Chen, S.J.; Du, P.J. A study of the landscape pattern change of Longyan City based on multi-temporal remote sensing images. Remote Sens. L. Res. 2012, 2, 135–136. [Google Scholar]
  7. Sun, F.Y.; Liu, M.; Hu, Y.M. A comprehensive analysis of landscape pattern dynamic change based on multi-methods: A case study of Tieling city, Liaoning province of northeast China. Chin. J. Ecol. 2013, 32, 2167–2168. [Google Scholar]
  8. Yu, Q.Z.; Zhang, Z.L.; Gao, B. Study on the changes of landscape pattern in Nansihu wetland based on RS and frags tats. Forest Res. Manag. 2013, 1, 111–112. [Google Scholar]
  9. Chen, A.L.; Sun, R.H.; Chen, L.D. Applicability of traditional landscape metrics in evaluating urban heat island effect. Chin. J. Appl. Ecol. 2012, 23, 2077–2086. [Google Scholar]
  10. Liu, X.P.; Li, X.; Chen, Y.M.; Qin, Y.; Li, S.Y.; Chen, M.H. Landscape expansion index and its applications to quantitative analysis of urban expansion. Acta Geogr. Sin. 2009, 64, 1430–1438. [Google Scholar]
  11. Huang, S.Q.; Chen, Y.; Zhang, R.Z.; Wu, W.; Wei, C. Spatial correlation analysis of land fragmentation and agriculture development based on landscape indexes. Agr. Res. Arid Area. 2015, 33, 238–244. [Google Scholar]
  12. Wu, N.T.; Yue, D.P.; Zhang, Y.C.; Cao, R.; Shang, S. Identification and analysis of ecological nodes of urban and suburban areas based on 3S technology. Environ. Sci. Tech. 2014, 37, 184–189. [Google Scholar]
  13. Liu, J.; Pu, W.R. Planning and Design of City Greenland System; Chinese Construction Industry Press: Beijing, China, 2004. [Google Scholar]
  14. Fu, B.J.; Chen, L.D.; Ma, K.P.; Wang, Y.L. Principle and Application of Landscape Ecology; Science Press: Beijing, China, 2001. [Google Scholar]
  15. Jongman, R.H.G. Nature conservation planning in Europe: Developing ecological networks. Landsc. Urban Plan. 1995, 32, 169–183. [Google Scholar] [CrossRef]
  16. Jongman, R.H.G.; Pungetti, G. Ecological Networks and Greenways: Concept, Design, Implementation; Cambridge University Press: Cambridge, UK, 2004. [Google Scholar]
  17. Liu, B.Y.; Wang, P. Green ecological network planning development and China research frontier. Chin. Gard. 2010, 26, 1–5. [Google Scholar]
  18. Liu, B.Y.; Yu, C. Greenway networks planning of USA and its apocalypse to us. Chin. Gard. 2001, 6, 77–81. [Google Scholar]
  19. Government of Toronto, Canada. Urban Planning and Development Services of Toronto, Canada. Garrison Creek Linkage Plan; 1998; (Unpublished work). [Google Scholar]
  20. Huang, Y.; Chen, H.; Huang, Z.J. Construction of urban green space ecosystem by using corridor networks: A case study in west urban area of Dongying city, Shandong province. Chin. J. Appl. Ecol. 2006, 17, 1683–1687. [Google Scholar]
  21. Kong, F.H.; Yin, H.W. Developing green space ecological networks in Jinan city. Acta Ecol. Sin. 2008, 28, 1712–1718. [Google Scholar]
  22. Adriaensen, F.; Chardon, J.P.; Blust, G.D. The application of “least-cost” modeling as a functional landscape model. Landsc. Urban Plan. 2003, 64, 233–247. [Google Scholar] [CrossRef]
  23. Zhang, X.F.; Wang, Y.L.; Li, G.C. Landscape functions network construction and application in watershed scale: A case study on Taiwan Wuxi watershed. Acta Geogr. Sin. 2005, 60, 974–980. [Google Scholar]
  24. Liu, J.; Yang, W. A GIS-based landscape pattern optimization approach for Lake Dianchi watershed. J. Nat. Resour. 2012, 27, 802–805. [Google Scholar]
  25. Li, J.H.; Liu, X.H. Research of the nature reserve zonation based on the least-cost distance model. J. Nat. Resour. 2006, 21, 217–224. [Google Scholar]
  26. Guo, H.B.; Huang, Y.X.; Ye, G.F. A study on the evaluation and optimization of urban ecological function network in Xiamen. J. Nat. Resour. 2010, 25, 75–76. [Google Scholar]
  27. Liu, C.L. Landscape Ecology Spatial Pattern Change and Optimization Measures in Nanjing. Master’s Thesis, Nanjing Agricultural University, Nanjing, China, 2006. [Google Scholar]
  28. Liu, J.J.; Li, J.D.; Liu, H. GIS-based ecological corridor of Shenyang landscape. J. Shenyang Agr. Univ. 2012, 43, 279–283. [Google Scholar]
  29. Wang, Y.C.; Liu, Y.L. Researches on spatial model application of urban landscape eco-network planning. Resour. Environ. Yangtze Basin 2009, 18, 819–824. [Google Scholar]
  30. Yang, Z.F.; He, M.C. Urban Ecological Sustainable Development Planning; Science Press: Beijing, China, 2004. [Google Scholar]
  31. Wang, H.Z.; Zhang, L.Q. A GIS, landscape pattern and network analysis based planning of ecological networks for Xiamen Island. Acta Phytoecol. Sin. 2005, 29, 144–152. [Google Scholar]
  32. General Administration of Quality Supervision, Inspection and Quarantine of the PRC, Standardization Administration of the PRC. Classification of Land Use Present Situation; Chinese Standardization Press: Beijing, China, 2007.
  33. Yang, Z.H. Landscape pattern analysis of Hainan natural meadow in China based on Fragstats and thematic mapper. J. Landsc. Res. 2012, 4, 13–14. [Google Scholar]
  34. Zheng, X.Q.; Fu, M.C. Spatial Analysis Techniques and Application of Landscape Pattern; Science Press: Beijing, China, 2010. [Google Scholar]
  35. McGarigal, K.; Marks, B. FRAGSTATS: Spatial Pattern Analysis Program for Quantifying Landscape Structure; Oregon State University: Corvallis, OR, USA, 1994. [Google Scholar]
  36. Chen, W.B.; Xiao, D.N.; Li, X.Z. Classification, application and creation of landscape indices. Chin. J. Appl. Ecol. 2002, 13, 121–125. [Google Scholar]
  37. Parcerisas, L.; Marull, J.; Pino, J.; Tello, E.; Coll, F.; Basnou, C. Land use changes, landscape ecology and their socioeconomic driving forces in the Spanish Mediterranean coast (El Maresme County, 1850–2005). J. Environ. Sci. Policy 2012, 23, 120–132. [Google Scholar] [CrossRef]
  38. Bhatt, G.D.; Kushwaha, S.P.S.; Nandy, S.; Bargali, K.; Nagar, P.S.; Tadvi, D.M. Analysis of fragmentation and disturbance regimes in South Gujarat forests, India. Trop. Ecol. 2015, 56, 275–288. [Google Scholar]
  39. Girvetz, E.H.; Thorne, J.H.; Berry, A.M.; Jaeger, J.A.G. Integration of landscape fragmentation analysis into regional planning: A statement multi-scale case study from California, USA. Landsc. Urban. Plan. 2008, 86, 205–218. [Google Scholar] [CrossRef]
  40. Fahrig, L. Effects of habitat fragmentation on biodiversity. Annu. Rev. Ecol. Evol. Syst. 2003, 34, 487–515. [Google Scholar] [CrossRef]
  41. Chen, L.D.; Fu, B.J.; Zhao, W.W. Source-sink landscape theory and its ecological significance. Acta Ecol. Sin. 2006, 26, 1444–1449. [Google Scholar] [CrossRef]
  42. People’s Government of Jiangsu Province. Protection Planning of Ecological Red-Line Areas of Jiangsu Province. Available online: http://www.jiangsu.gov.cn/jsgov/tj/bgt/201309/t20130923_400467.html (accessed on 30 August 2013).
  43. Jiao, S.; Li, Z.M.; Gao, Q.; Zhou, K.; Wei, C.Y.; He, S.Y. The application of landscape connectivity theory in urban ecology suitability assessment and optimization. Geogr. Res. 2013, 32, 720–730. [Google Scholar]
  44. Ying, F.N.; Wang, X.L. Ecological landscape planning of the Four-Lake Basin based on accumulative minimum resistance model. J. Huazhong Agr. Univ. 2010, 29, 231–235. [Google Scholar]
  45. Liu, X.F.; Shu, J.M.; Zhang, L.B. Research on applying minimal cumulative resistance model in urban land ecological suitability assessment: As an example of Xianmen City. Acta Ecol. Sin. 2010, 30, 421–428. [Google Scholar]

