1. Introduction
Recent developments in volunteered geographic information (VGI) projects, such as OpenStreetMap, have led to an increasing trend to use the data in various applications. As the major concern of crowdsourced data, the quality of OSM data has been addressed by several previous studies. Neis compared OSM data in Germany to the TomTom Multinet dataset and showed that OSM data have a rather high completeness regarding total road length [
1]. Haklay analyzed both the positional accuracy and completeness of OSM data in the United Kingdom using Ordnance Surveydatasets and reported that the data in London have a spatial error of about 6 m with a rather complete coverage for urban areas [
2]. Girres extended the research in France by using BD TOPOlarge-scale referential datasets and got similar results [
3]. Forghani and Delavar analyzed the consistency of OSM data with reference data in Tehran and confirmed fairly good data quality [
4]. Though the reported data quality is highly heterogeneous, these cases have proven that VGI data can achieve good quality, which ensures their usability in various applications. Parker
et al. found that VGI data have some advantages over professional geographic information (PGI) when geographic features are dynamic in nature [
5] and suggested that VGI can effectively enhance PGI, especially on the aspect of currency [
6]. Some commercial companies, such as Foursquare, switched to OSM as their map provider [
7], and a wide range of applications, like OpenRouteService, were built on the OSM data [
8]. The quality and value of OSM data are quite counter-intuitive in contrast to the community mainly consisting of amateurs, especially if we recall that traditional geographic data production is a highly disciplined work with only professional participants.
The cooperative mechanisms can partly explain the situation, including “citizen science” and “patch work” [
9,
10,
11], the Linus law in the VGI context [
12] and social collaborations between contributors [
13]. However, the characteristics of individual contributors, such as expertise [
14], education and income [
15], still significantly matter [
11]. This leads to a natural question: Do most contributions actually come from amateurs? To address this question, we should first keep in mind that contributions in OSM are very unequal, with a minority of all contributors named major contributors accounting for nearly all contributions [
1,
16,
17]. Wikipedia has a similar phenomenon, where most edits are made by a small number of very active users. Moreover, it is suggested that these users are professionals and play critical roles to ensure the quality of Wikipedia articles [
18,
19]. Are major contributors in OSM also professionals, despite that the community mainly consists of amateurs?
In this paper, we introduce a behavior-based approach to assess the expertise of major contributors, aiming to infer whether they are professionals or amateurs. Indicators are grouped on three themes of practice, skill and motivation to depict several behaviors, which are then combined to judge whether each of the major contributors is a professional. The remaining sections are structured as follows:
Section 2 discusses related work and illustrates the necessity of our work.
Section 3 describes the rationale behind our approach, introduces the indicators to describe behaviors and how the behaviors are combined to infer expertise.
Section 4 chooses Germany, France and the United Kingdom to perform case studies and discusses the results.
Section 5 concludes this paper and discusses future directions.
2. Related Work
Research on OSM contributor behaviors has been taken for various purposes. Early research mostly focused on characterizing the whole community and suggested that OSM was contributed to collaboratively by amateurs or inexperienced users [
12,
20], while later work paid more attention to the heterogeneity in the community [
21]. Neis and Zipf divided OSM contributors into four classes and reported that the “senior mappers” have various different attributes [
22]. Mooney and Corcoran found that strong co-editing behaviors exist between top mappers in London [
13]. Barron
et al. integrated user profiles and behaviors into an intrinsic quality assessment framework for OSM and provided a brief description of the underlying rationale [
23]. Bégin
et al. characterized major contributors by feature type preferences and mapping area selections in order to assess data completeness in OSM [
24]. Bordogna
et al. proposed a linguistic decision making approach to assess VGI data quality using both extrinsic and intrinsic quality indicators and suggested that auto-evaluation of confidence from volunteers can help address their reliability [
25]. Budhathoki and Haythornthwaite identified serious mappers by examining the number of nodes contributed, the longevity of contributions and the number of contributed days. Moreover, they investigated the motivations and characteristics of OSM contributions using questionnaires and reported that more than half of the respondents have related educational background [
26].
Although existing methods and results effectively addressed their own research goals, we cannot directly use them to judge whether OSM data come from professionals or amateurs. Most previous research either performs analysis on the whole community or on the “senior mappers” selected by the hard breaks of contributions. Characteristics of major contributors could easily be concealed due to their small population. Moreover, most research only proposed population statistics for each aspect separately, while how these attributes coexist for individuals is still unclear. The existing indicators are also insufficient for a robust inference of expertise. Most research only discussed expertise on the aspect of practice,
i.e., the longevity and the amount of contributions, which are not entirely reliable on their own [
27]. Questionnaire-based methods are free from these problems and should be very reliable, but the sample sizes are usually small and suffer from potential bias.
3. Methods
In this section, we discuss the relationship between expertise and behaviors, and establish a conceptual framework to judge whether contributors are professionals. After that, we introduce indicators grouped around three themes: practice, skill and motivation. In the end, behaviors depicted by the indicators are aggregated to decide whether a major contributor is professional.
3.1. Professionals and Amateurs
A small percentage of contributors named major contributors make most contributions in the OSM project. In this paper, we define major contributors as top contributors accounting for over 90% of contributions in total. How many contributors are selected is determined by the total number of contributors and how unequal the contributions are. This approach ensures that analyzed contributors can explain where most OSM data come from well, while avoiding distractions caused by inactive users. This approach is also more robust against variances between different countries.
Concisely measuring the expertise of OSM contributors is hard due to a lack of supplementary information. In this paper, we only divide the level of expertise into two classes: professional and amateur, where amateur equals non-professional. Many definitions of professional and amateur exist, mainly belonging to two branches: unskilled/skilled and unpaid/paid [
19]. In the literature of VGI or Web 2.0 research, professionals are normally defined as skilled and highly disciplined [
28] or even having deep understandings of related theories [
29], while amateurs often lack knowledge or skills and work with leisure attitudes [
19,
30]. In this paper, professionals are those who have rich practices as a solid background in the past, have decent skills to get things done at the moment and have serious attitudes to ensure self-improvements in the future.
VGI contributors constantly improve their skills during cooperative work, so that an amateur may become a professional after years of participating. In this paper, we call a user professional if he or she is a professional at the end of the research period.
3.2. Behaviors and Expertise
Different levels of expertise may result in different behaviors. However, behaviors can be influenced by many factors and can seldom “measure” expertise reversely. Given that
E represents a major contributor being a professional and
B represents a behavior
b being presented, if
b is observed for a major contributor, we can calculate the probability that he or she is a professional using the definition of conditional probability:
Additionally, the probability that a professional user does have the behavior
b is:
Ideally, it should be that
and
as much as possible, so we can get both high precision and high recall [
31], and the behavior
b is in fact a good measure of expertise.
,
and
are all unknown in our case, making it impossible to select behaviors based on these equations directly. Fortunately, there are some possible guidelines to ensure credibility. According to Bayes’ theorem [
32], the precision:
It is obvious that if and , we can get a high precision. If we select behaviors that should be rarely seen in amateurs, but are not comparatively rare among all major contributors, we can be highly confident that contributors with the behavior b are professionals.
Using several related behaviors may also increase precision. Consider another equation based on Bayes’ theorem:
The precision using two behaviors becomes:
If and , then . That means, if the two behaviors describe different characteristics, but tend to coexist in professionals, we can get better precision by using b and together. On the other hand, the recall becomes 1 if every professional contributor has the behavior b. However, a single behavior can hardly achieve that. A solution is to observe several behaviors to complement each other, so that .
Inferring expertise based on behaviors always involves some “guessing”, but the results should be credible if we follow the following guidelines to select indicators:
- (1)
Choose behaviors that should be rare among amateurs, but are relatively common among all major contributors. This is the most critical requirement.
- (2)
Choose multiple behaviors, so that each behavior describes different things, but they tend to coexist in professionals.
- (3)
Choose multiple behaviors, so that all behaviors can cover most professionals, that is a professional contributor should more or less have these behaviors.
3.3. Indicating Expertise on Themes
We use changeset data as our major data source to investigate contributor behaviors. A changeset includes all contributions in a single transaction, with metadata to describe the details of the transaction. The key information used in this paper includes date and time, number of changes and software [
33]. OpenStreetMap Wiki can be a possible complement, but accounts in OSM Wiki are not associated with accounts in OSM [
34], so we do not use them. We introduce indicators to describe behaviors based on the collected information. Certain values of indicators may represent certain behaviors, which may in turn be evidence for high expertise.
We use three groups of indicators on the themes of practice, skill and motivation, which are consistent with our definition of professional in
Section 3.1. Practice indicates how much efforts a user devotes to the OSM project. Skill represents how well a contributor can achieve his or her goal when contributing data. Motivation explains why a contributor contributes to OSM and how strong his or her willingness is. Constant practice on a single topic is an important characteristic that distinguishes experts from novices. Skills, such as the ability to handle domain-specific complex tools, can be strong signs that a user is both familiar with domain-specific concepts and productive on data creation tasks. Strong motivations decide whether participants always do their best to contribute better data and improve themselves continuously. The three themes should cover most behaviors of professionals according to our definition. It is also noteworthy that the three themes are not orthogonal. More practice generally makes for better skills. Stronger motivations lead to more practice. Better skills will trigger more self-confidence and more effective self-expressions, which can also be an important motivation to have VGI practice [
26].
3.3.1. Practice
Due to the anonymity of OSM contributions, it is nearly impossible to know the background of contributors. That means we can hardly distinguish a professor in geography from an amateur who knows nearly nothing about geography if they both make few edits. However, some contributors put a huge amount of time into the project, which solely can distinguish them from amateurs in VGI data collecting. We consider the following indicators:
- (1)
Number of contributing days: Large values suggest that a user constantly devotes his or her time into the data creation practice, which seldom happens for amateurs. Moreover, even if a contributor lacks some skills at first, he or she is quite unlikely to still be an amateur after the amount of training.
- (2)
The time range between the first contribution and the last one: A long range means that a contributor is at least aware of the project for a long time, so that he or she may have a better understanding of how the project develops. This also suggests that his or her main work or interest may reside in geography-related fields. Very long ranges, such as 3 years, rarely happen for amateurs.
- (3)
Number of contributing weeks: The first indicator has bias on contributing habits, for a user may learn more if he or she makes 100 edits in one day than 50 edits in 3 days. This indicator can help catch this kind of miss and increase recall. More contributing weeks can also represent that a user constantly renews the knowledge about this project. A large number of weeks can hardly happen for amateurs, similar to the case of contributing days.
The first two indicators are highly intuitive and have appeared in previous research [
26]. For all indicators, we get a value for each contributor. We then calculate median and median absolute deviation for each indicator and draw box plots to further depict the distributions. Median-based statistics are chosen, because we do not know the nature of the underlying distributions, and there may be some outliers due to the existence of imports and automatic edits. Robust statistics can better handle these situations.
3.3.2. Skill
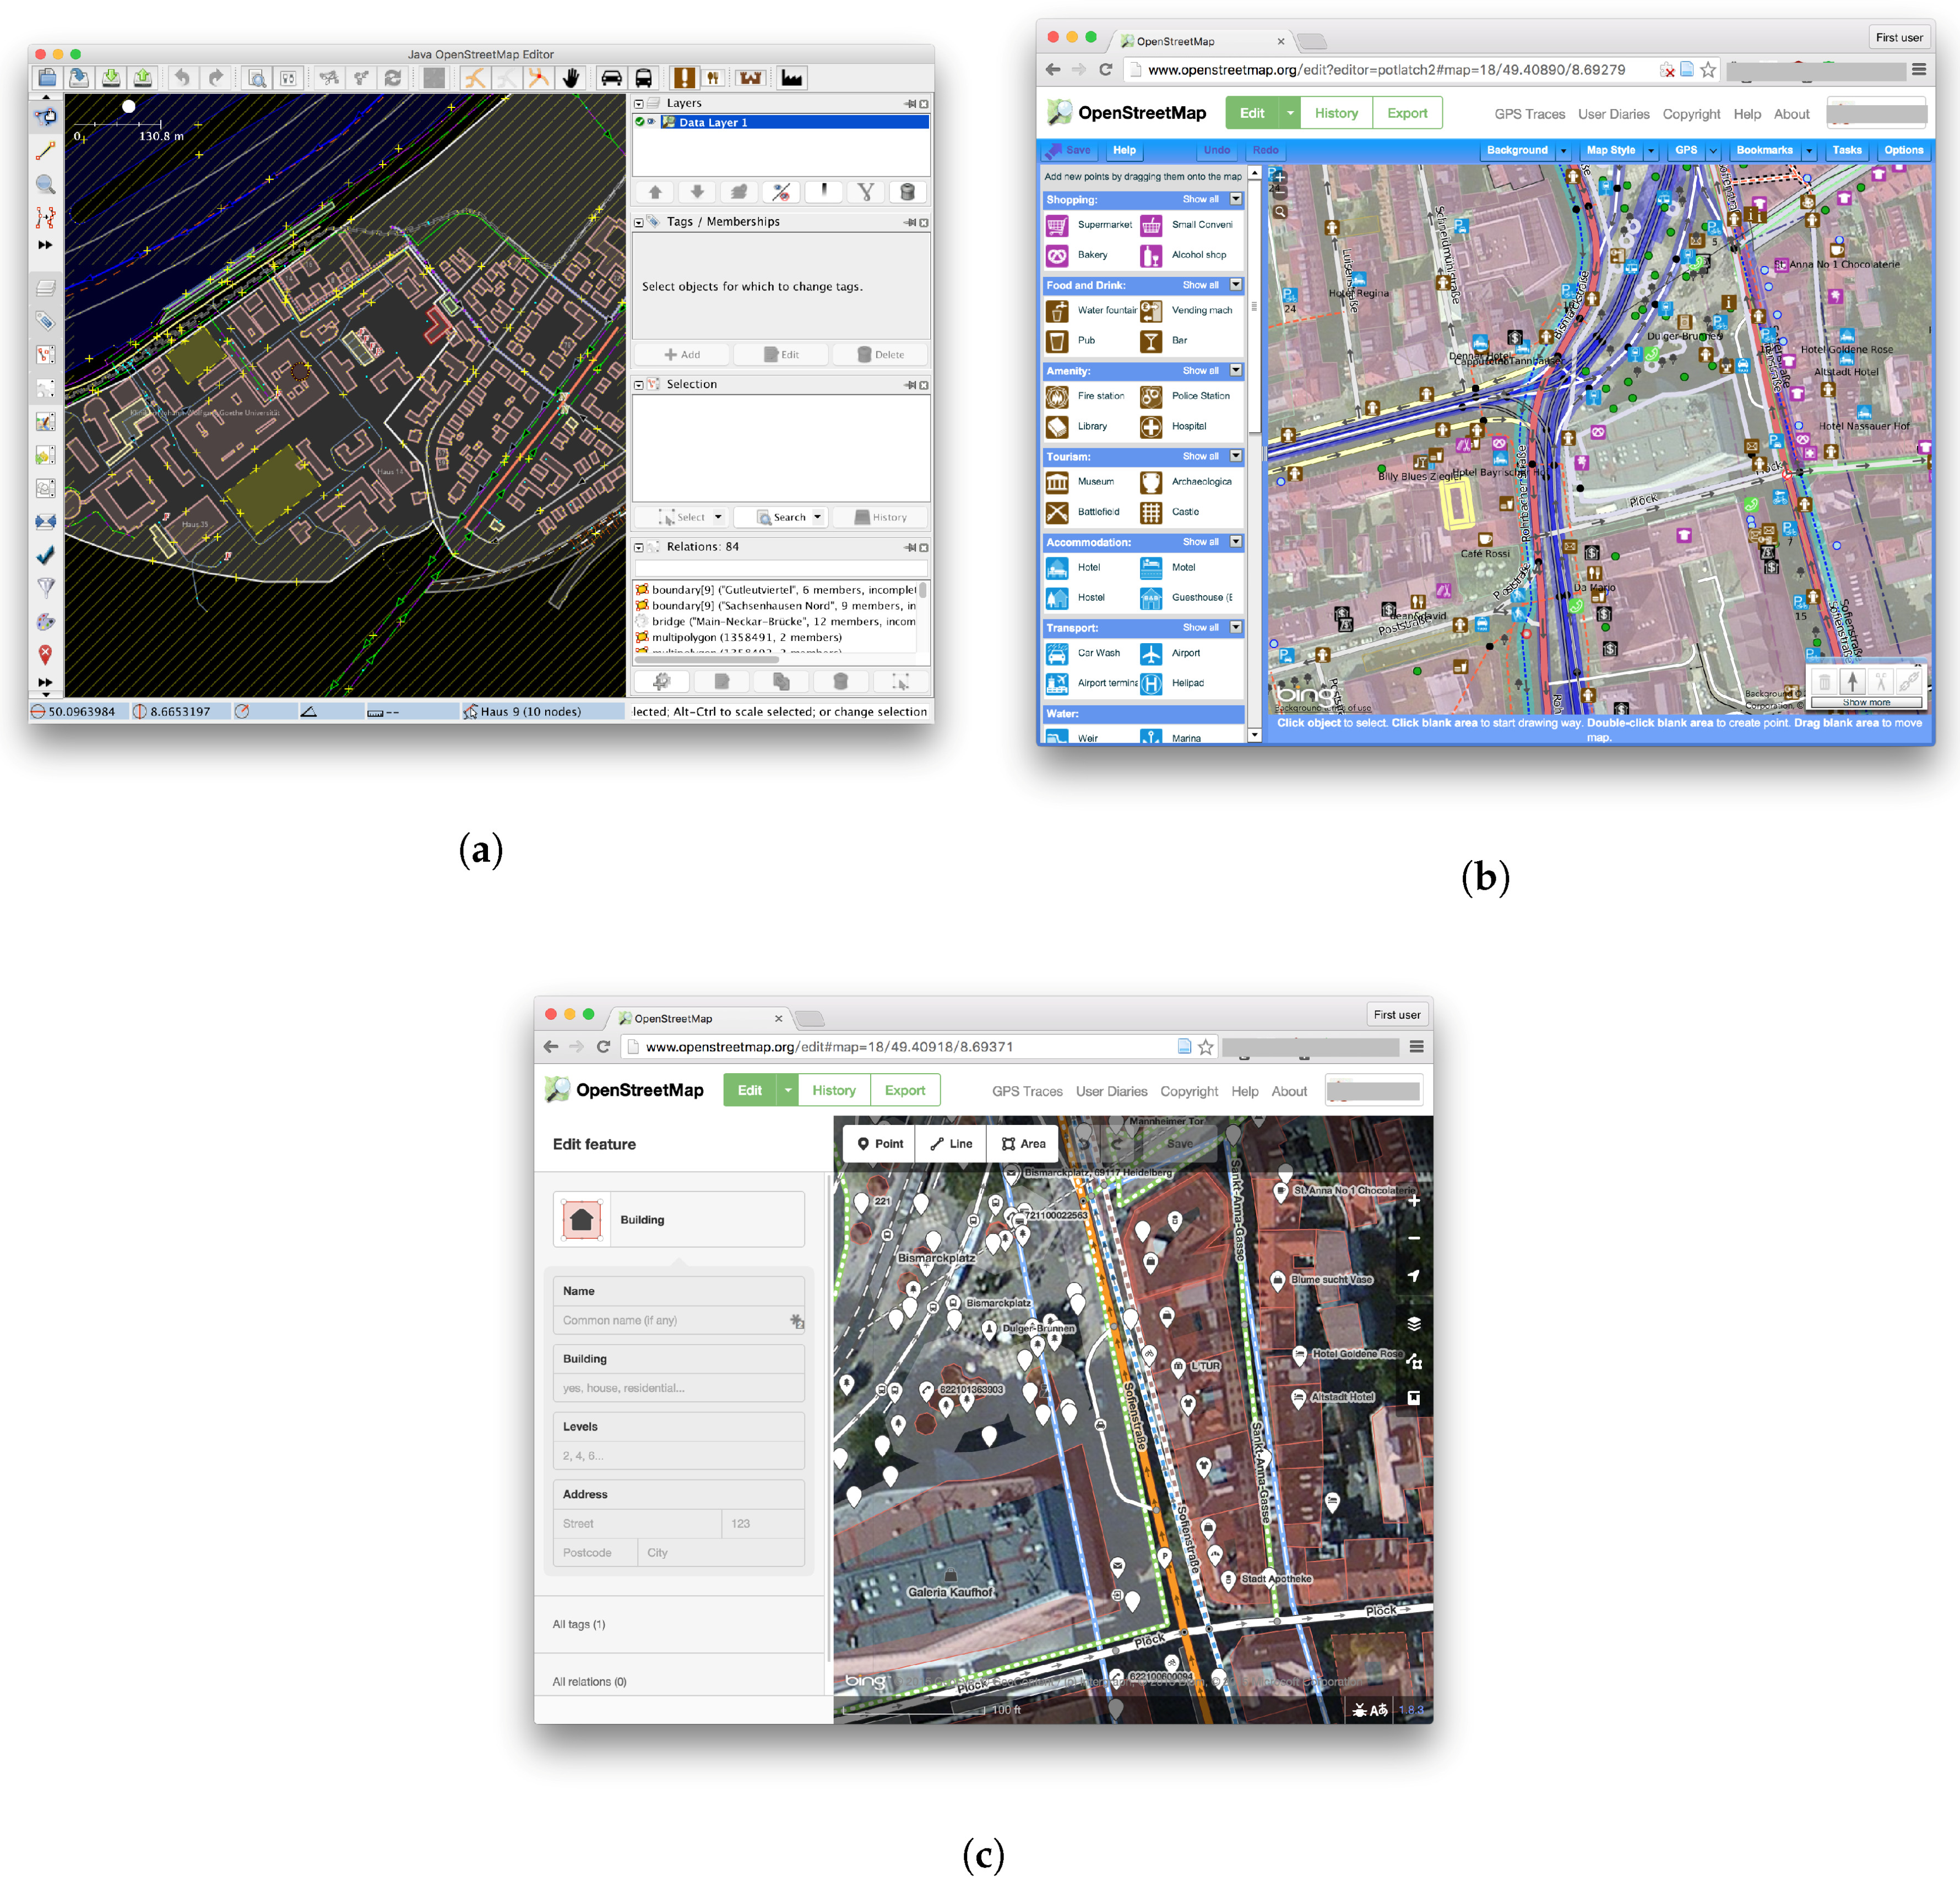
We will mainly focus on the skill to use complex tools and the ability to use various tools. There are plenty of tools that are available for contributing OSM data, among which JOSM, Potlatch and iD are typical tools requiring different levels of expertise. As one can see, this does not mean that contributors using iD are less professional than those who use JOSM. However, amateurs seldom choose hard, but powerful tools due to the limitation of skills and the complexity of tasks.
JOSM (
Figure 1a) is a desktop application written in Java. It has the fullest set of functionalities among all tools and, thus, is capable of all kinds of OSM work from quick error fixes to massive editing and uploading. Due to its capability to load offline data, it can further be complemented by other advanced tools. However, the power is somewhat at the expense of accessibility. Firstly, users have to download the package and install and configure JVM if not already before actually contributing. These extra steps hinder computer novices from using it in the first place. Secondly, the large union of functionalities brings in many components with many domain-specific terms, which require effort to learn or even preliminary knowledge in the field of geography.
Potlatch (
Figure 1b) is a web-based application written in Flash. It also has a load of functionalities, but lacks some advanced features, such as batch uploading due to the limitation of the platform. It requires Flash to be pre-installed, though this is already the case in many circumstances. Users do not need to download the software. The power and the easiness of use of this application are both on the intermediate level.
iD (
Figure 1c) is the newest editor among the three, taking advantage of plugin-free web technologies in recent years. With iD, a user can only perform basic edits, such as tracing satellite images to create features, or adding and editing tags. However, the interface is very intuitive and easy to use even for novices. It is also the most accessible among the three. Contributors just visit the page, login in from any computer with a web browser and start to work immediately.
We calculate the following indicators in this section:
- (1)
The major software used: Here, “major software” is the software used to create most changes. Using JOSM, Potlatch or iD as the major tool requires a high, medium and low level of skill, respectively. It is very unlikely that an amateur uses JOSM as the major editor to create many data. However, professionals may also choose Potlatch or even iD as the major editor due to various factors, such as contributing types, personal preference and working environments. This problem may reduce recall, but can be complemented by other indicators.
- (2)
Use JOSM in the first month of our research period: This indicates contributors’ skills without the amount of practice illustrated in the “Practice” section. Users who use JOSM from the start should be more likely professionals or even come from related background. Amateurs hardly behave like that.
- (3)
Whether a secondary software is used: We only calculate editors accounting for more than 30 changesets or over 1000 changes. We believe that this amount of usage cannot happen accidentally. Using a secondary software suggests that a user has a good command of several tools and contributes flexibly in different contexts. Amateurs with insufficient skills and motivations can hardly achieve that. We also calculate whether a tertiary software is used for reference.
3.3.3. Motivation
It is rather hard to know the exact motivations without interviews or questionnaires. We focus on the strength of motivations and whether the users contribute for work or leisure. The results are thus limited, but still provide strong evidence for expertise. Some indicators described before also provide evidence for strong motivations, such as the number of contributing days and the number of contributing weeks. We add two indicators that are specifically meaningful to motivation.
- (1)
The longest successive days to contribute or contributing streaks: Not breaking the chain is hard, so this indicator represents how devoted a contributor is and how much enthusiasm he or she has. Especially, a chain longer than a week means that the person contributes every day regardless of whether it is a weekday or a weekend, which is an important sign that the contributor has great enthusiasm for OSM.
- (2)
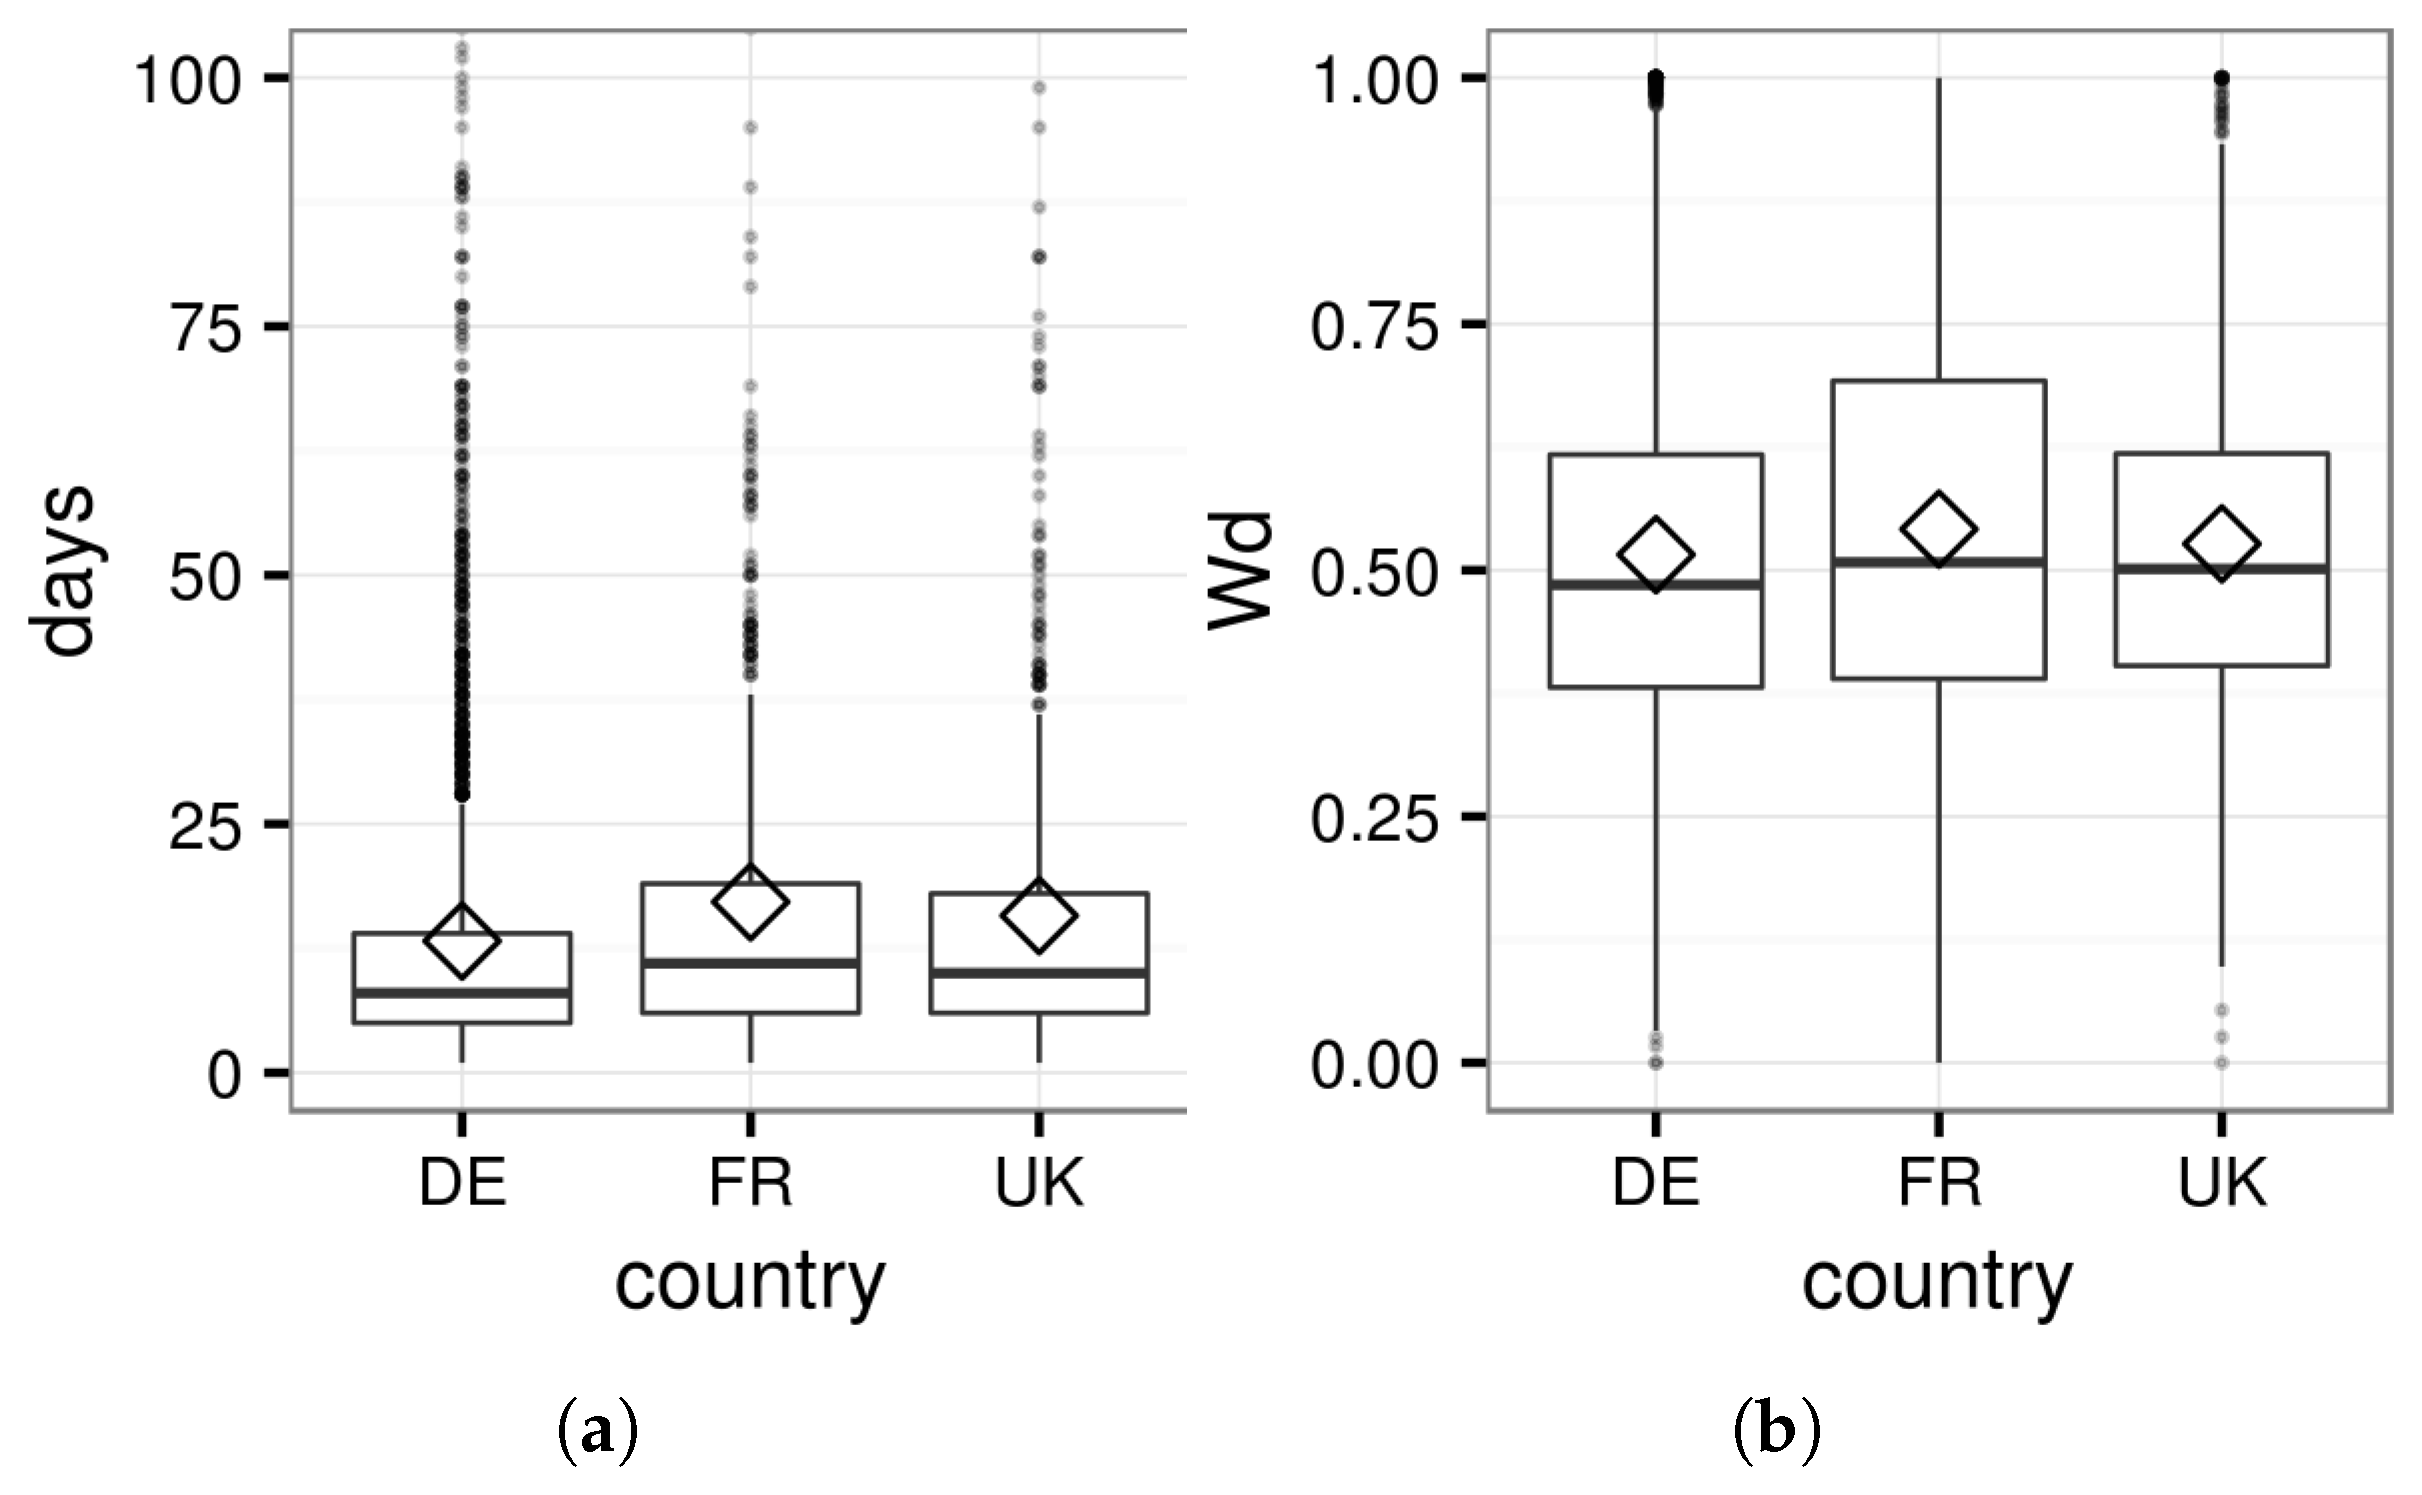
The productivity in weekdays versus weekends: Normally, contributors of VGI are described as driven by interest, so the productivity per day should be significantly biased to weekends. If a user contributes equally on weekdays and weekends or even becomes more productive on weekdays, it is very unlikely that he or she only has leisure motivations. This kind of contributor may even make a living from OSM contributions. To limit the value to a finite range, we use a proxy value , where is contributions per day on weekdays and is contributions per day on weekends. It is obvious that means that the productivity on weekdays and weekends is equal, while larger values suggest relatively higher productivity on weekdays.
We use robust statistics for these indicators, as well.
3.4. Depicting Expertise of Individuals
Each indicator mentioned before can describe how the population of major contributors behave on a certain aspect. However, only after verifying how the behaviors coexist in a contributor can we decide whether the individual is a professional. To examine how each individual behaves, we first set thresholds to convert discrete values to dichotomous values. After that, all indicators produce true/false values, and each represents a behavior, as shown in
Table 1.
The thresholds are values that we believe amateurs can hardly achieve. Manual thresholds are error prone at times, but the inferential strength here will not drop much, as we follow the guidelines in
Section 3.2. We can then calculate how these behaviors exist in each individual contributor. More behaviors do not mean higher expertise, and contributors who represent none of these behaviors are not necessarily amateurs. However, representing more of these behaviors increase our confidence that a contributor is a professional.
4. Case Study
This section presents the case study for three countries: Germany, France and the United Kingdom. We calculate indicators on the three themes of practice, skill and motivation for all three countries. Based on these statistics, we provide discussions on whether the major contributors are professionals.
4.1. Selecting Major Contributors
We choose Germany, France and the United Kingdom as our research areas because: (1) OSM develops very well in these places, with a sufficient volume of data for statistical significance; (2) according to previous research, data quality in these areas is very good, comparable or even better than commercial data on some aspects [
1,
12,
13]; (3) there are less imports or automatic edits in these areas, so we can roughly regard all contributors as individuals making intellectual efforts.
Changeset data are downloaded from PlanetOSM [
35]. Only data from the beginning of 2010 to the end of 2014 are used, because the metadata of changesets before 2010 are incomplete, and we use data in entire years to avoid seasonal bias. We then extract changesets within Germany, France and the United Kingdom. Based on these data, we select major contributors by the following procedures:
- (1)
Calculate total contributions for every contributor in each year.
- (2)
For every year, find top contributors: in that year, their contributions in total should just exceed 90% of all contributions.
- (3)
Union sets of top contributors in each year: the results are major contributors in that area.
Here, we calculate top contributors for each year, rather than selecting top contributors of all time. We avoid comparing contributors in different years since the importance of one contribution may change along with the development of the OSM project. For every contributor, we find all of his or her contributions in our research period globally. The reason for using all contributions rather than only contributions in the research areas is that we are interested in the characteristics of individuals, rather than their characteristics presented in certain areas.
As shown in
Table 2, we select 5.02% out of 85,433 contributors in Germany (DE), 2.33% out of 32,686 contributors in France (FR) and 3.36% out of 23,439 contributors in the United Kingdom (U.K.). It is obvious that OSM contributions in France have the highest inequality, followed by the United Kingdom. Germany has the lowest contribution inequality, but the contributions there are still very unequal.
The maximum values of contributions in France and the United Kingdom are significantly lower than that in Germany, while the minimum values of contributions range from 2.6 thousand in Germany to 21 thousand in France. The median and MADin France are nearly ten-times those in Germany and five-times those in the United Kingdom.
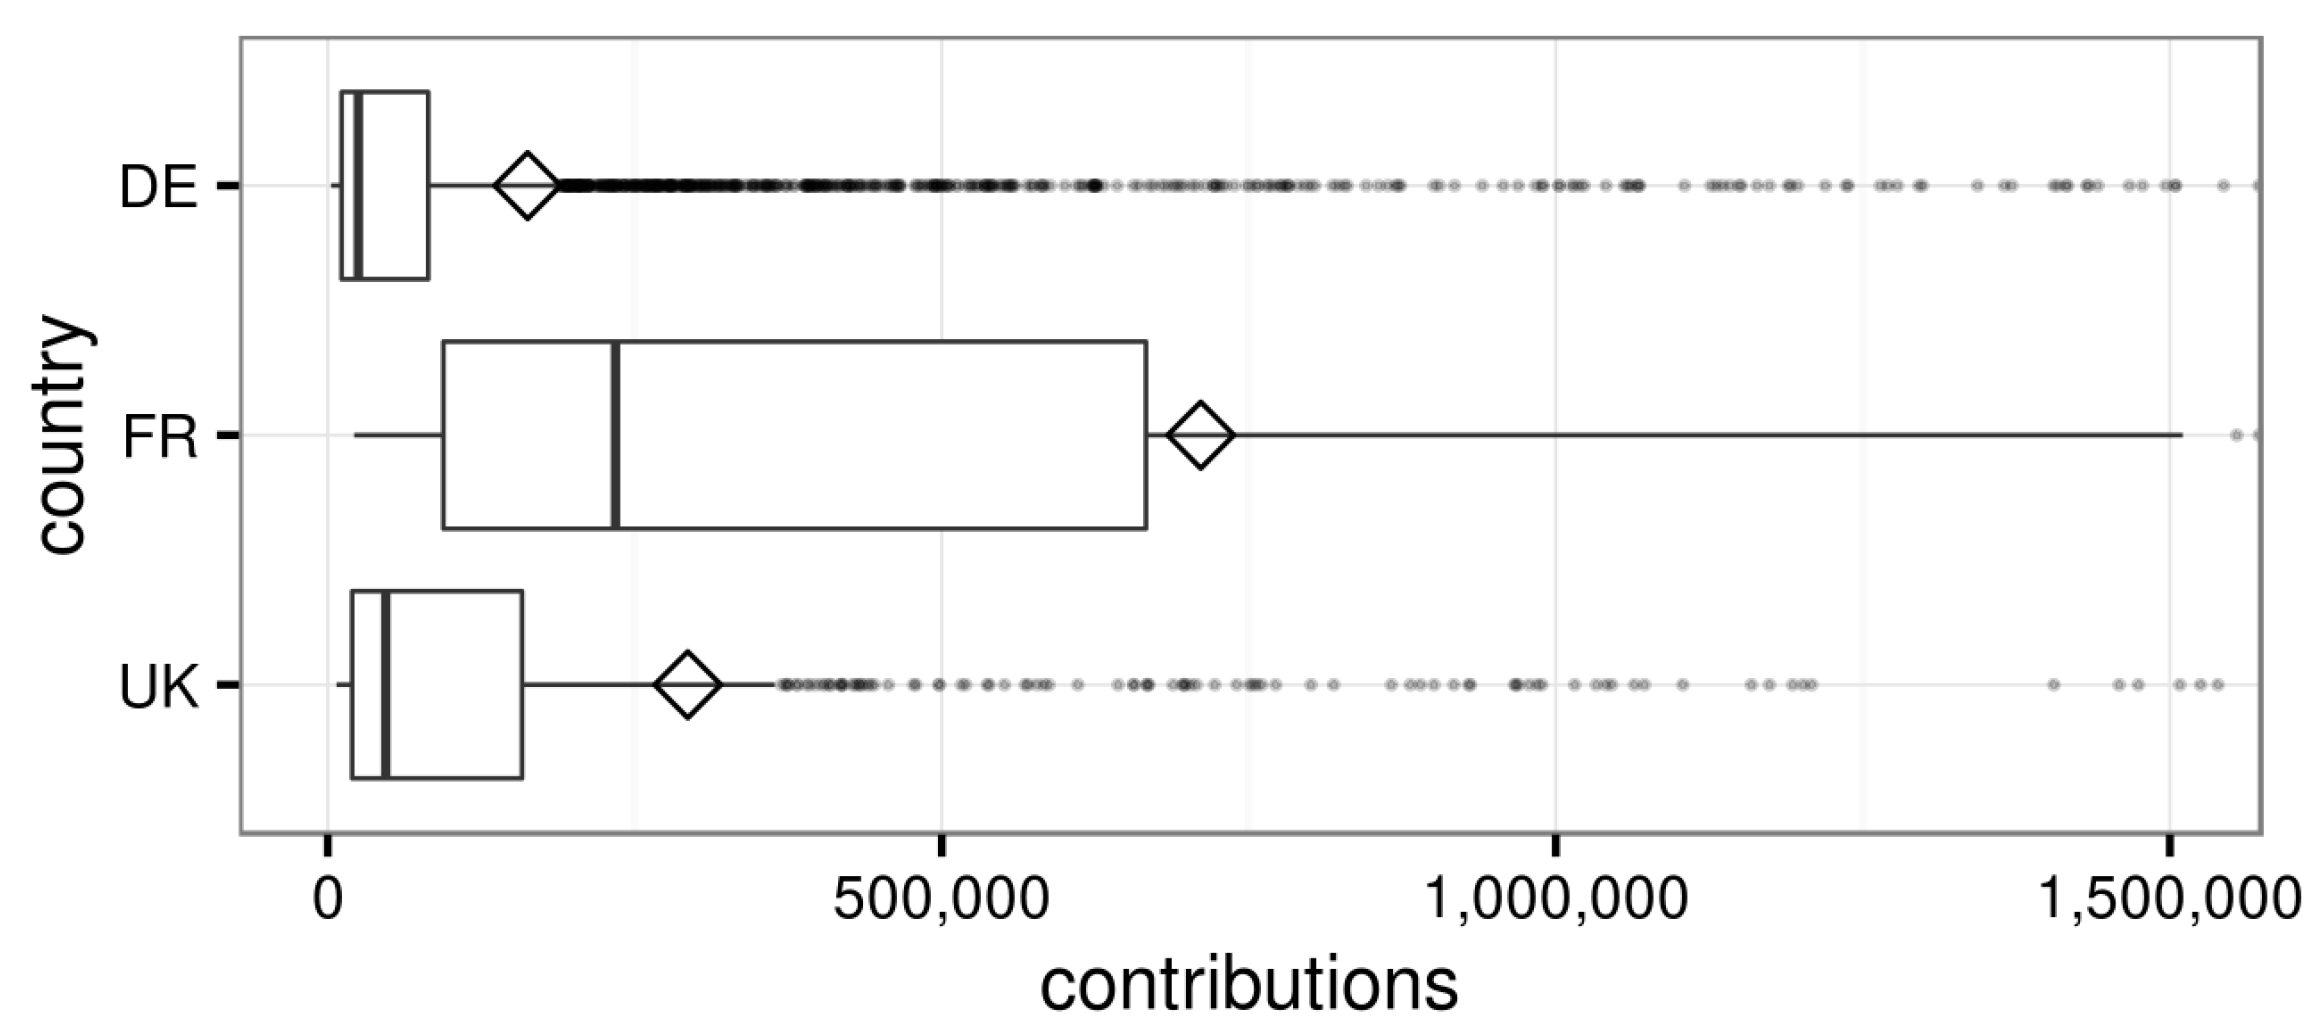
Figure 2 further illustrates the distributions of contributions. The distributions are so skewed that we have to limit the axis to 1,500,000 contributions to clearly visualize the boxes. The highly unbalanced sizes of the two box parts reveal the skewness. The mean values outside the boxes and many outliers suggest that the distributions are hardly normal, and robust statistics should be more appropriate. We can confirm that France has larger quantiles and variance, which may be the result of higher contribution inequality. In general, the productivity of major contributors in the three countries varies greatly.
4.2. Indicators on Themes
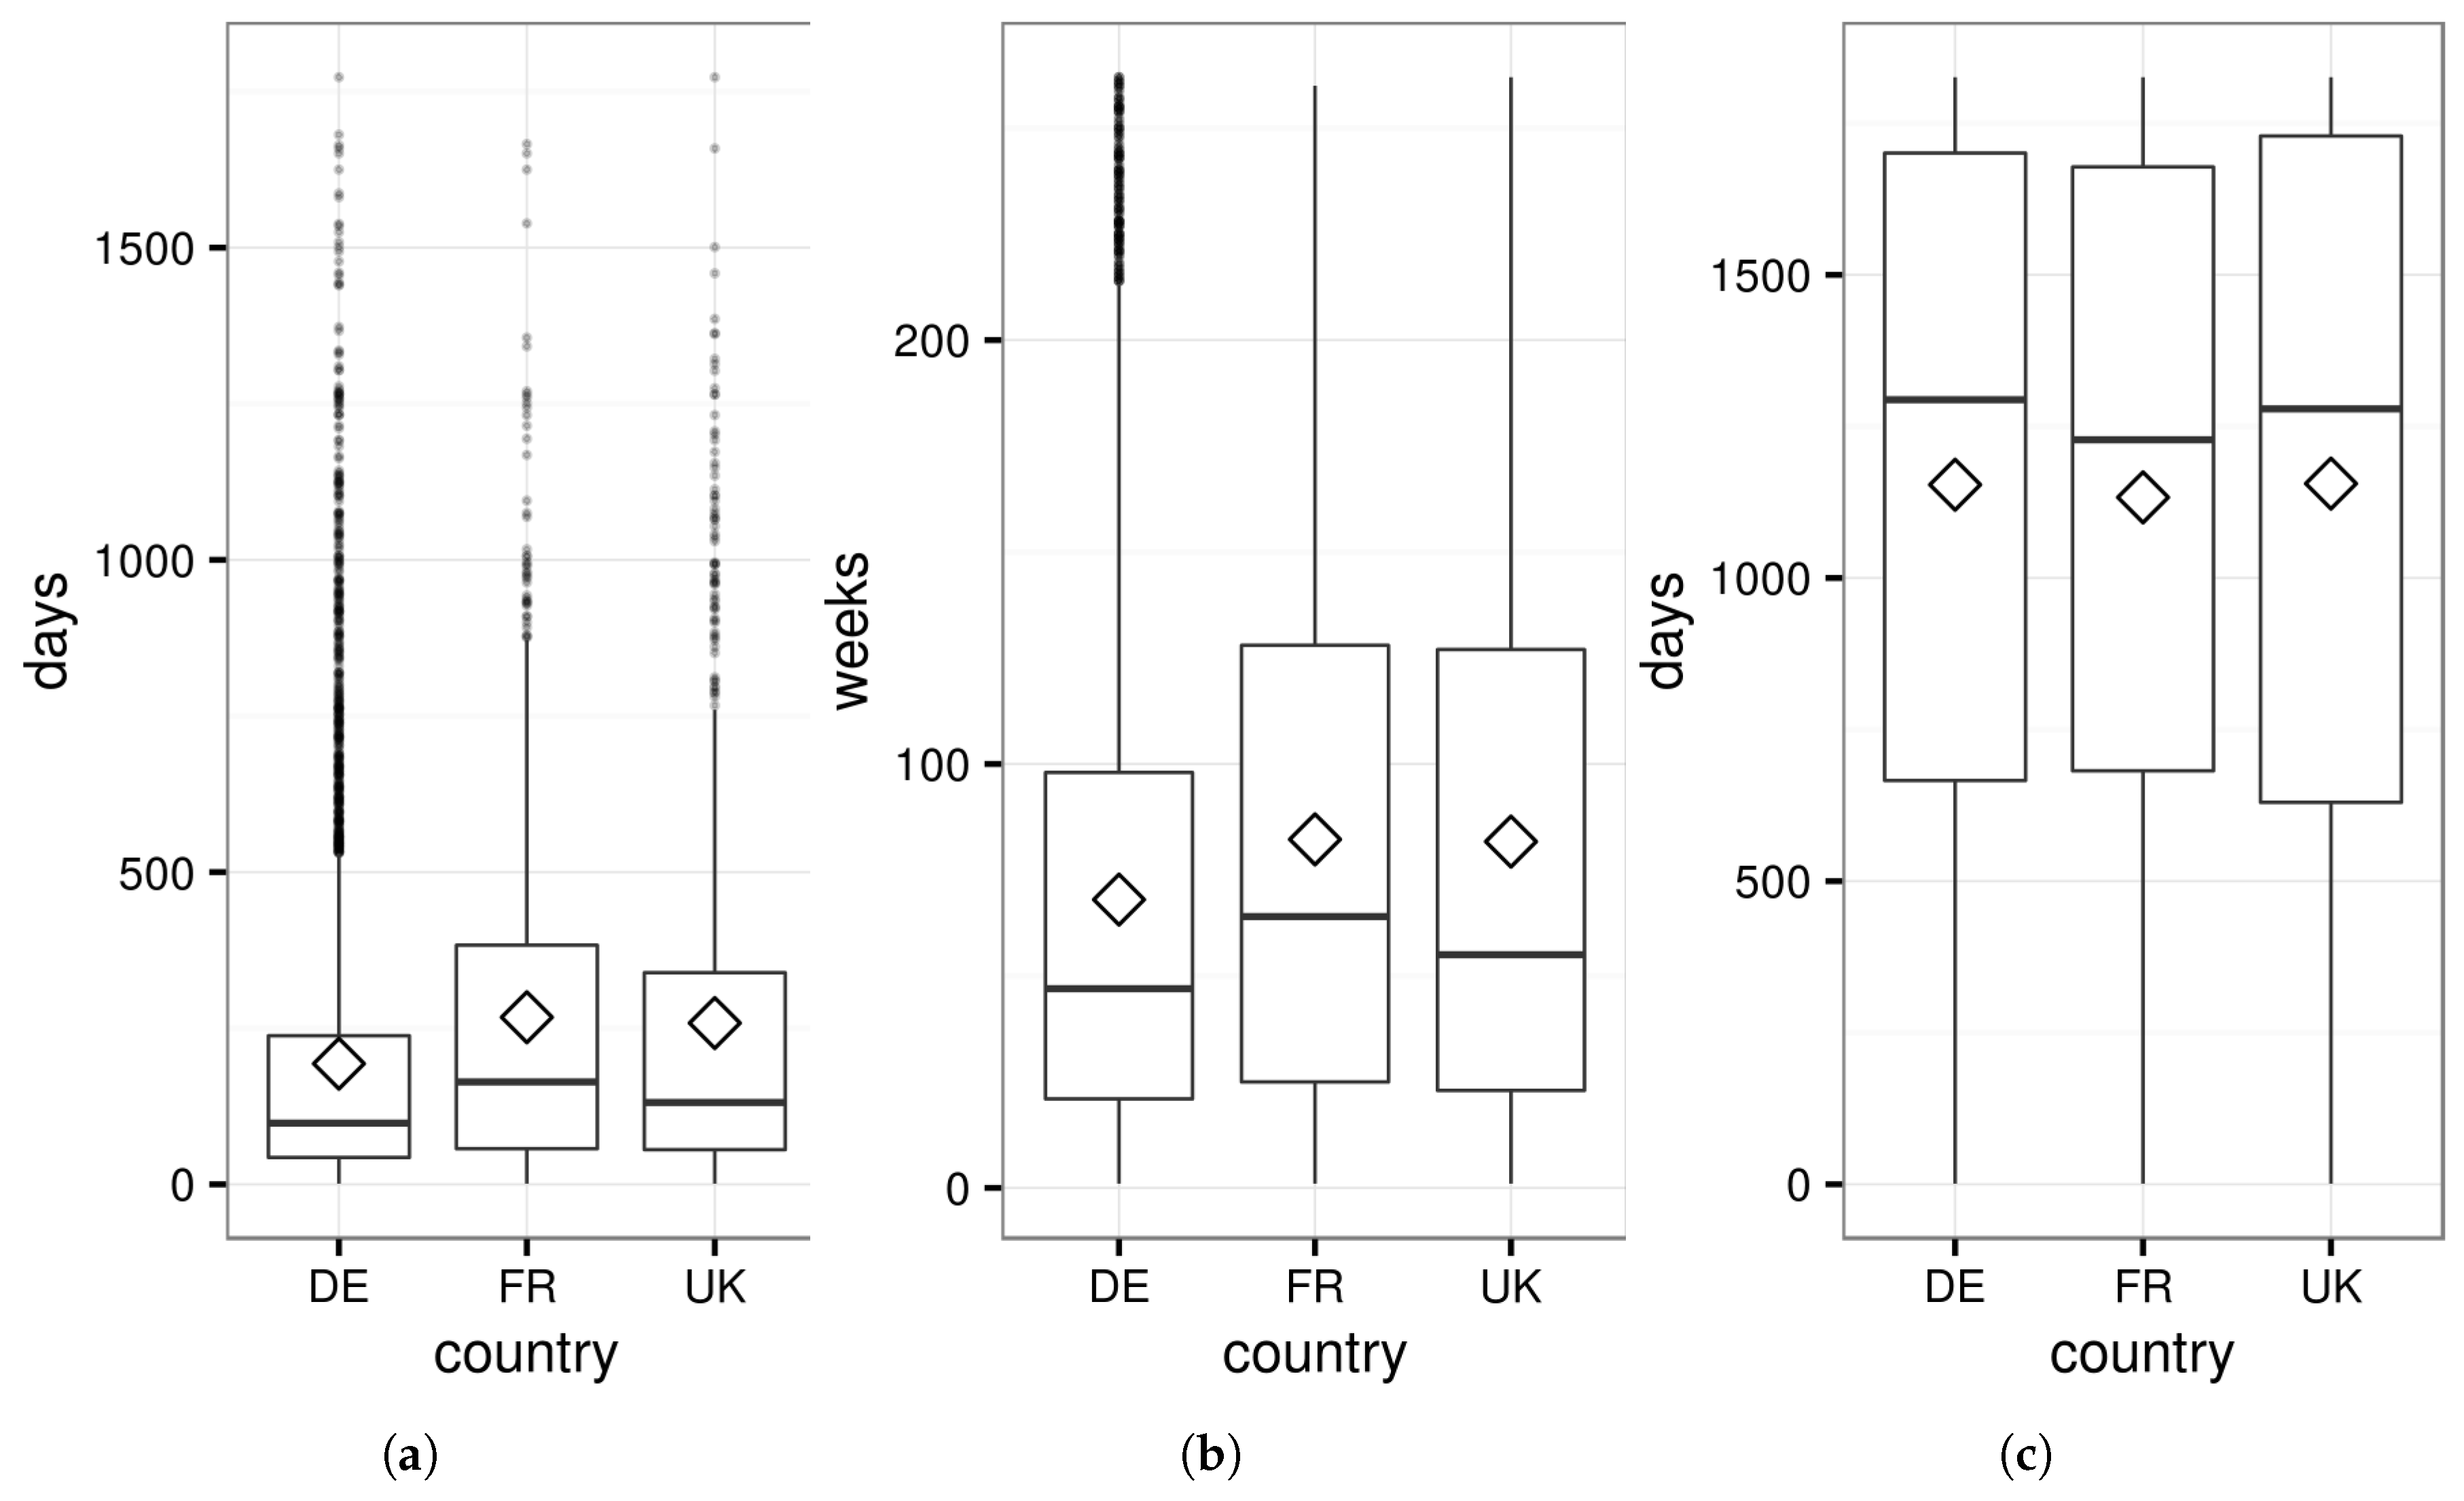
Table 3 shows that the contributing days expand for over three years on average, which means that the contributors should be interested in geography for a rather long time or even make their careers in related fields. At the same time, they spend on the project 98–164 days and 47–64 weeks on average. This amount of training is solely sufficient to distinguish them from amateurs or normal citizens. All indicators have very impressive maximum values and huge MAD, which suggest that huge variances exist, even among major contributors.
Figure 3 shows that the contributing days and weeks are rather skewed with many top outliers, but the time ranges between first and last contributions are quite balanced. This interesting finding suggests that contributing longevity has no linear relationship between actual contributing days and weeks.
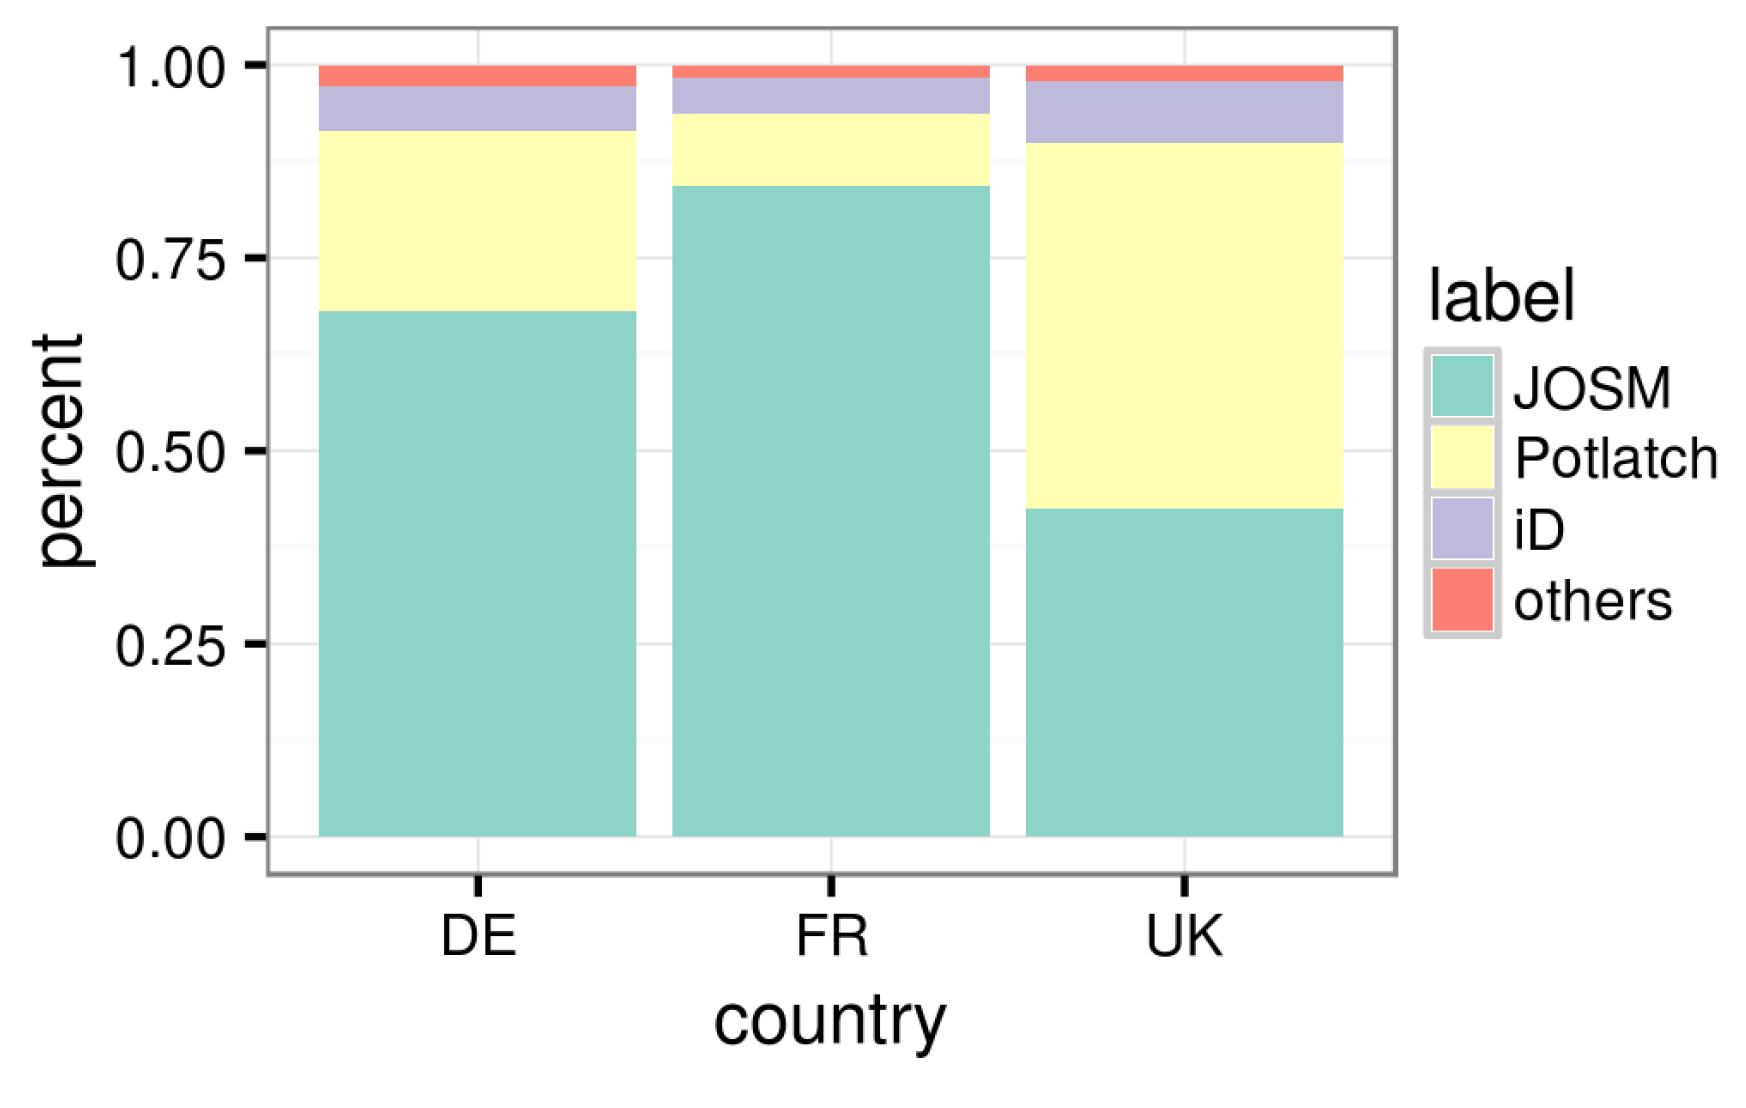
As shown in
Figure 4 and
Table 4, most of the major contributors in Germany and France use JOSM as their major editing tool, which is the most powerful and skill-demanding tool. The ratio is lower in the United Kingdom, but also over 40%. Over one third of the contributors in Germany and the United Kingdom and half of the contributors in France use a secondary tool. The ratios to use a tertiary tool are much lower, but still significant. Many contributors use JOSM as their major editor in the first contributing month during our research period, which suggests that they are already quite skillful at the very beginning. Our indicators for practice may thus even be underestimating.
For the motivation part,
Table 5 shows that half of the contributors have contributing streaks over one week. A chain longer than one week suggests that a contributor works every day in a whole week, regardless of weekday or weekend, which is solid evidence of serious motivation. The distributions of longest streaks are skewed, with many contributors achieving very long streaks.
Figure 5a again has to limit the axis to 0–50 to see the details of the quantiles. Most of the contributors do not become significantly more productive on weekends, as shown in
Figure 5b, which is partly compatible with the population statistics [
22]. This phenomenon suggests that their motivations can hardly be just leisure, but may rather be a mix of great enthusiasm, sense of responsibility and even careers.
We calculate behaviors based on the indicators. The percentages of the contributors to represent each behavior are illustrated in
Figure 6. Behaviors on the theme of practice occur more in general, while each country has unique features.
Figure 7 illustrates the numbers of the behaviors represented by each contributor. The results clearly show that most contributors represent several of these behaviors. Half of the contributors represent five behaviors out of eight, while over 75% of contributors represent three or four behaviors.
Table 6 further suggests that almost all contributors represent at least one of the behaviors.
Table 6 also suggests that those who represent all behaviors are also rare, which confirms the necessity to use several behaviors together.
4.3. Discussion
The descriptive statistics show that the major contributors make very small percentages of the population. Therefore, descriptions on the whole community can hardly reveal their characteristics. The productivity varies greatly among different areas, so that splitting the community by universal hard breaks of contributions may be less effective. The huge variances and the highly skewed distributions within a single country alert that simple population statistics may bring severe bias.
Most of the contributors have long contributing histories, plenty of contributing days and/or many contributing weeks. These efforts of practice bring rich experiences to VGI data production and imply decent abilities and serious motivations. JOSM is the most popular editor among major contributors in Germany and France and is also extensively used in the United Kingdom. This is even the case in the first month of our research period. Many the contributors have ability and are willing to use secondary tools. Streaks longer than one week commonly exist among the contributors. Nearly half of the contributors create data equally on weekdays and weekends. These phenomena are hardly understandable under leisure motivations. The distributions of the values for each indicator suggest that the major contributors can hardly be a population of amateurs.
Individual statistics show that half of the contributors represent five or more of these behaviors. Only a quarter of them have less than three, and it is very rare that a major contributor has none of these behaviors. In contrast to the rarity of these behaviors for amateurs, their common coexistence on these contributors greatly increases our confidence that most of the major contributors are not amateurs, but professionals. Most OSM data in Germany, France and the United Kingdom actually come from professionals.
Among the three countries, France gets the highest scores for the indicators on all three themes. Major contributors in France represent slightly higher numbers of the behaviors, which may be due to higher contribution inequality. The United Kingdom shows some exceptions, such as JOSM usage, which illustrates the complexity of contributor behaviors in OSM. The values of indicators are not measures of expertise, but rather measures for the confidence that a contributor is professional. For example, though more contributors use JOSM as the major editor, major contributors in France are not necessarily more skillful than those in the United Kingdom. The same applies to the numbers of behaviors. A contributor representing all of the behaviors is not necessarily more professional than another who has none of the behaviors. However, we can be much more confident that the former is a professional VGI contributor, while the expertise of the latter is inconclusive.
Our results are consistent with some reports in the literature, but also reveal different phenomena, since the major contributors are a minority in the population, even compared to “senior mappers”. According to Neis and Zipf, only a very small percentage of contributors in the entire population make contributions per day, week, month and year, representing low contributing days and weeks from most individuals [
22], which are very different from the case of the major contributors. The total contributions in each weekday do not differ much, especially for the group of “senior mappers” [
22], which is consistent with our findings. The slightly higher contributions on Sunday are not observed in our case. Budhathoki and Haythornthwaite selected only 15.5% “serious mappers” from the survey respondents regarding contributions, contributing days and longevity [
26], while most of the major contributors get high scores for these criteria. The “serious mappers” have rather serious motivations, often with monetary or career concerns [
26], which confirms our findings.
5. Conclusions
In this paper, we investigate the contributing behaviors of major contributors in OSM, in order to evaluate whether they are professionals. The indicators on three themes of practice, skill and motivation in Germany, France and the United Kingdom show distributions that can hardly appear to a group of amateurs. Most of the contributors represent several behaviors that amateurs rarely have. The major contributors in the three countries should be confidently regarded as professionals instead of amateurs. Although the community mainly consists of a large number of amateurs, OSM may be mainly contributed by a group of people who follow the project for a long time, have enormous experience in creating geographic data, are fluent in advanced tools and/or have good command of several different tools. These people persistently contribute to OSM in a rather serious manner and can concentrate on tasks to keep creating geographic data. It should be unsurprising that these people can produce high quality data.
Three features distinguish our work from previous efforts. Firstly, we focus on major contributors, so our results can illustrate whether most OSM data come from professionals well. Secondly, we deliberately discuss expertise and use various guidelines to ensure inferential strength. Finally, though some classical indicators, such as total contributions and longevity, are still used in our work, we introduce more innovative indicators to depict expertise from various aspects.
Our approach provides a possible way to examine the expertise of contributors when direct knowledge of individuals is not available, which usually is the case due to the anonymity of OSM users. The indicators introduced in this paper can also be useful for intrinsic OSM data quality analysis [
23]. Data created by professional contributors should be more trusty and can be used as references to infer the quality of other data.
The major limitation of our work is that we only use behaviors to infer the characteristics of contributors. Although the results should be rather persuasive, it would be better if we could get some direct individual information in the same context to verify our results. Questionnaires or online surveys may be the most probable way to achieve that.
A direct extension of our study is to check how the behaviors we used actually interrelate with each other to further understand the relationship between expertise and contributing behaviors. Another possible improvement of our research is to analyze data created by these contributors to infer their expertise with the quality of their outputs and the semantics of their behaviors [
36]. Quality analysis against referential data and intrinsic quality indicators can both be helpful.


