Article

A Labeling Model Based on the Region of Movability for Point-Feature Label Placement

1
School of Resource and Environmental Sciences, Wuhan University, 129 Luoyu Rd., Wuhan 430079, China
2
Geo Spatial Information Science Collaborative Innovation Center of Wuhan University, 129 Luoyu Rd., Wuhan 430079, China
3
The Key Laboratory for Geographical Information Systems, Ministry of Education, Wuhan 430079, China
*
Author to whom correspondence should be addressed.
ISPRS Int. J. Geo-Inf. 2016, 5(9), 159; https://0-doi-org.brum.beds.ac.uk/10.3390/ijgi5090159
Submission received: 14 April 2016 / Revised: 22 August 2016 / Accepted: 24 August 2016 / Published: 1 September 2016

Abstract

:
Automatic point-feature label placement (PFLP) is a fundamental task for map visualization. As the dominant solutions to the PFLP problem, fixed-position and slider models have been widely studied in previous research. However, the candidate labels generated with these models are set to certain fixed positions or a specified track line for sliding. Thus, the whole surrounding space of a point feature is not sufficiently used for labeling. Hence, this paper proposes a novel label model based on the region of movability, which comes from plane collision detection theory. The model defines a complete conflict-free search space for label placement. On the premise of no conflict with the point, line, and area features, the proposed model utilizes the surrounding zone of the point feature to generate candidate label positions. By combining with heuristic search method, the model achieves high-quality label placement. In addition, the flexibility of the proposed model enables placing arbitrarily shaped labels.

1. Introduction

Labeling graphical objects is an important issue in several fields, including cartography, geographic information systems, and information visualization. To preserve the quality of the visual representation, a label should not overlap with other labels or features [1]. Accordingly, two sub-problems, label number maximization and label size maximization, are defined [2]. Typically, non-overlapping labeling is classified as NP-hard [3,4,5]. The label placement is usually divided into three tasks: labeling points, labeling lines, and labeling areas. Because labeling points is a more fundamental problem, point-feature label placement (PFLP) has been extensively studied in recent years [6,7,8,9].
The PFLP requires a labeling model that defines candidate label positions, which directly affects the implementation and quality of label algorithms. Two main models have been proposed in the literature (see Figure 1): (i) the fixed-position model, where each point has a set of fixed label candidates [10]; and (ii) the slider model, where the label can slide continuously in one or more directions, under the constraint that its boundary touches the corresponding point [11]. These models provide formalization for the labeling problem such that it can be solved computationally.
Most previous work on map labeling concentrates on the fixed-position model, the most popular of which is the four-position model [10,12]. With the finite label candidates for each point, PFLP can be defined as a combinatorial optimization problem: assigning labels to candidate positions so that all points are labeled without label-label or label-feature overlap. Accordingly, a wide variety of combinatorial optimization approaches can be applied to solve the problem, such as greedy, gradient descent, simulated annealing, integer programming, genetic algorithms, and tabu search [3,13,14,15,16]. Mauri et al. [17] proposed a 0–1 integer linear programming model combined with a Lagrangean decomposition and relaxation for the PFLP. Alvim et al. [18] proposed a new point-feature labeling algorithm based on the POPMUSIC (Partial Optimization Metaheuristic under Special Intensification Conditions) frame. Rabello et al. [8] presented a clustering search metaheuristic as a new alternative method to solve the point labeling problem.
For those labeling algorithms based on the fixed-position model, the framework for searching for an approximate global optimal solution is feasible. With a specific objective function, the conflict-free label number, cartographic preference, and some other label quality factors can be considered to obtain a comprehensive, optimal result [3,19]. Nevertheless, the fixed-position model has some drawbacks for labeling. Because the fixed potential label positions lack flexibility, when considering the conflicts with point, line, and area features, the labeling result is greatly affected by this limitation. Thus, among all of the existing studies based on the fixed-position model, mostly only-point labeling experiments have been conducted. In practical map labeling, however, if the crucial information of a point, line or area is overlapped, the entire visualization is worthless [20]. Furthermore, the fixed candidate positions cannot cover the whole surrounding potential space for labeling. Then, the optimal conflict-free label may be missed because it is probably not contained in the fixed-position set.
More natural than the fixed-position model are the slider models, which allow a continuous movement of a label around its point feature [11,21,22]. Hirsch [23] defines repelling forces for overlapping labels and uses the translation vectors iteratively to reposition the labels. Doddi [24] presents a labeling model that allows each label to rotate around the point feature with the objective of maximizing the label size. Another popular slider model is defined by van Kreveld et al. [11], namely, the one-, two-, and four-slider model (shown in Figure 1). The following studies that apply the sliding strategy are mostly based on this model. Strijk et al. [25] extends the model to practical map labeling, which concerns line overlap, area overlap and variable label height. Poon et al. [26] propose an approximation algorithm for weighted point label placement with the slider model. Schwartges et al. [9] present an effective heuristic labeling algorithm with sliding labels for interactive maps.
The slider model drops the restriction that a label can only be placed at finite candidate positions. Especially when dealing with the point, line, and area contexts, a conflict-free solution is more likely to be obtained. However, limitations remain. Because the sliding of a label is restricted to a specified track line, the whole potential labeling space besides the line is not utilized. Further, the framework of the slider model is more applicable to label number maximization. For the optimization of the label quality, which synthesizes all of the important quality criteria (such as label association, aesthetics, and priority [27,28]), the combinatorial optimization strategy, which is widely used by the fixed-position model, is preferred. Moreover, because the slider model is mostly applied to axis-parallel rectangular labeling, an exploration of non-textual, arbitrarily shaped label placement has not been performed. However, most information visualization techniques use non-textual visual attributes to represent information [20].
Against this background, this paper proposes a novel point-feature label model extending the advantages of both the fixed-position model and the slider model. Based on the ‘region of movability’ from collision detection theory [29], the model allows a feasible generation of candidate label regions and focuses on the discrete solution space for combinatorial optimization, similar to the fixed-position model. Additionally, labels that have an arbitrary shape can also be managed. The labeling process consists of three major steps: (1) obtain a continuous, conflict-free space by computing the label movability region, then discretely generate a set of outstanding candidate label positions from this search space; (2) quantitatively evaluate the label quality for each candidate label position in the set; and (3) assign labels to the corresponding candidate positions with the approximations and heuristics search methods to maximize the total labeling quality. Because each step can be implemented using various approaches, a flexible framework is presented for solving the PFLP problem.
This paper is structured as follows. In Section 2, a detailed description about the region of movability and the labeling processes is provided. Labeling experiments of the proposed model for different cases are given in Section 3. Finally, the study presents a discussion of the results and a summary of the conclusions.

2. Methodology

Collision detection, which includes possible collisions, the region of movability, and the initial collision location issues, is widely studied in graphics, simulation, robot-motion planning, and virtual reality technology [30,31]. Essentially, the placement of labels without overlapping other point, line, and area visual features belongs to the category of collision avoidance in planar collision detection. In this paper, according to the principle of the region of movability, the conflict-free potential space is obtained as the basis for the further point-feature label placement concerning various background features.

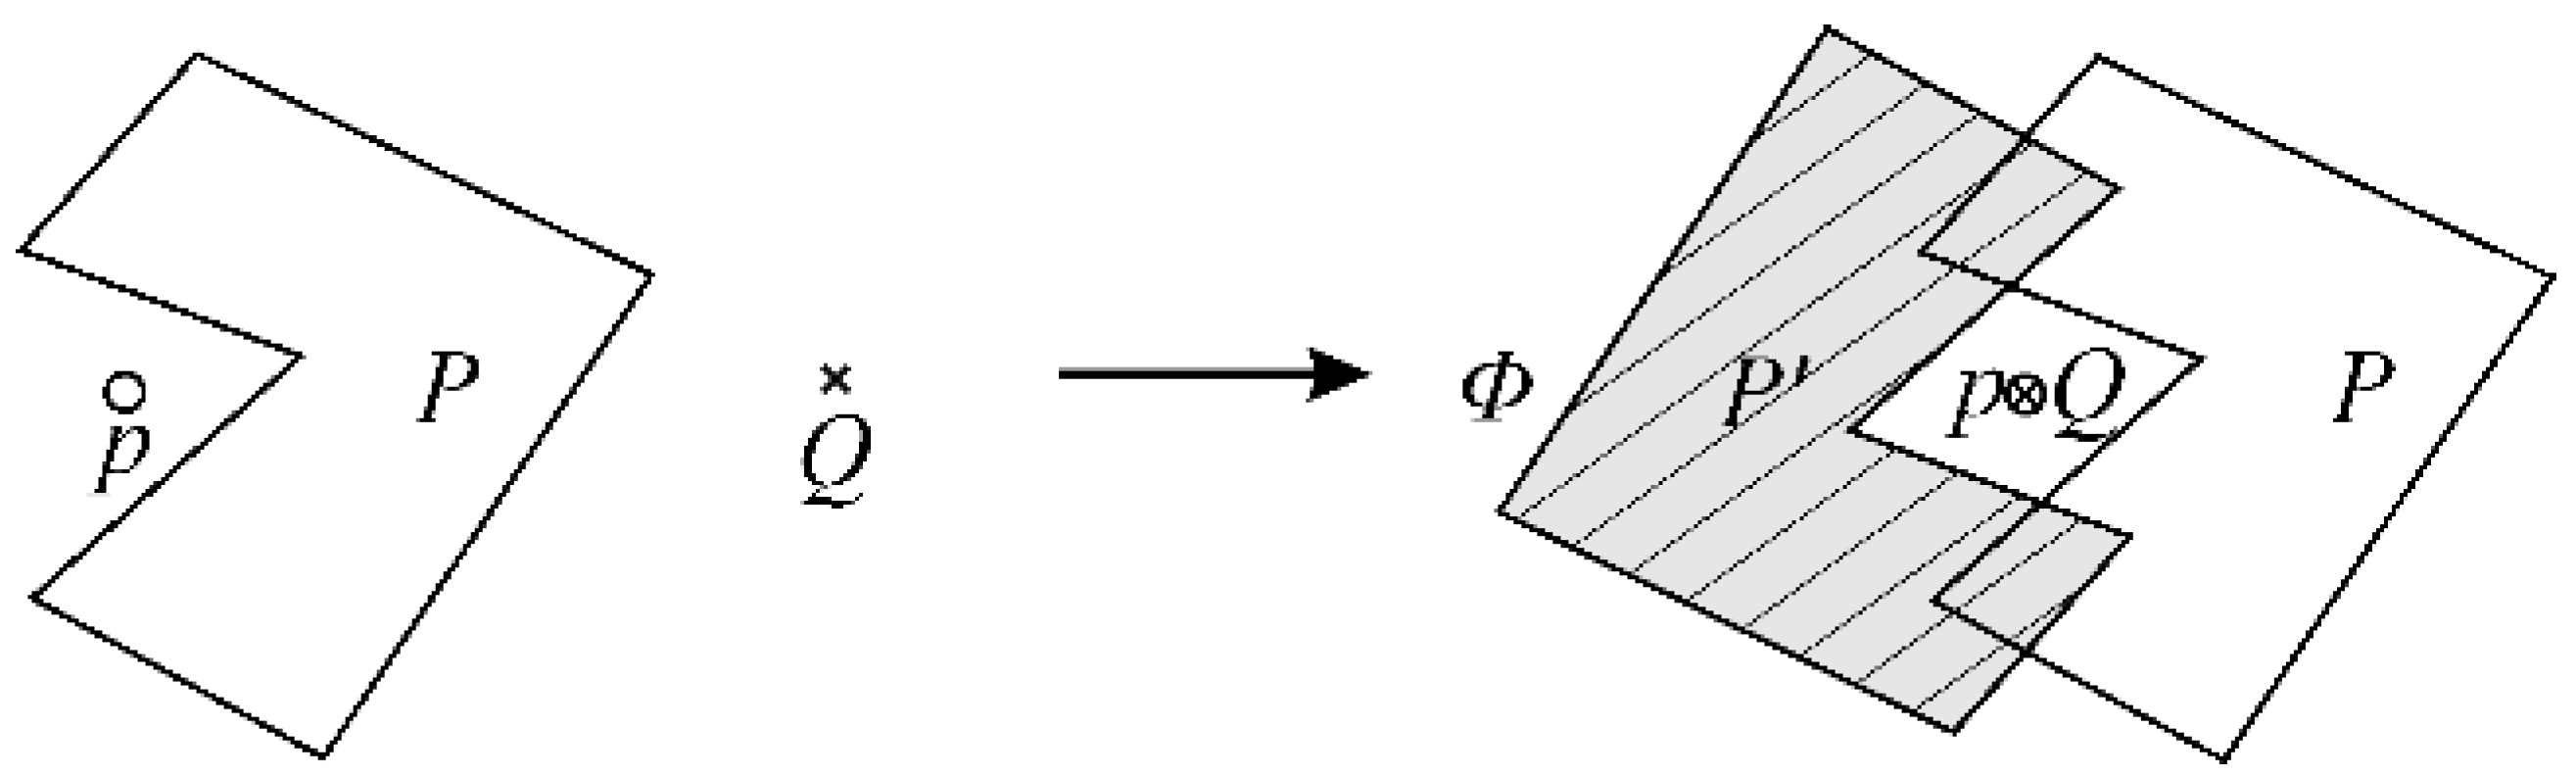
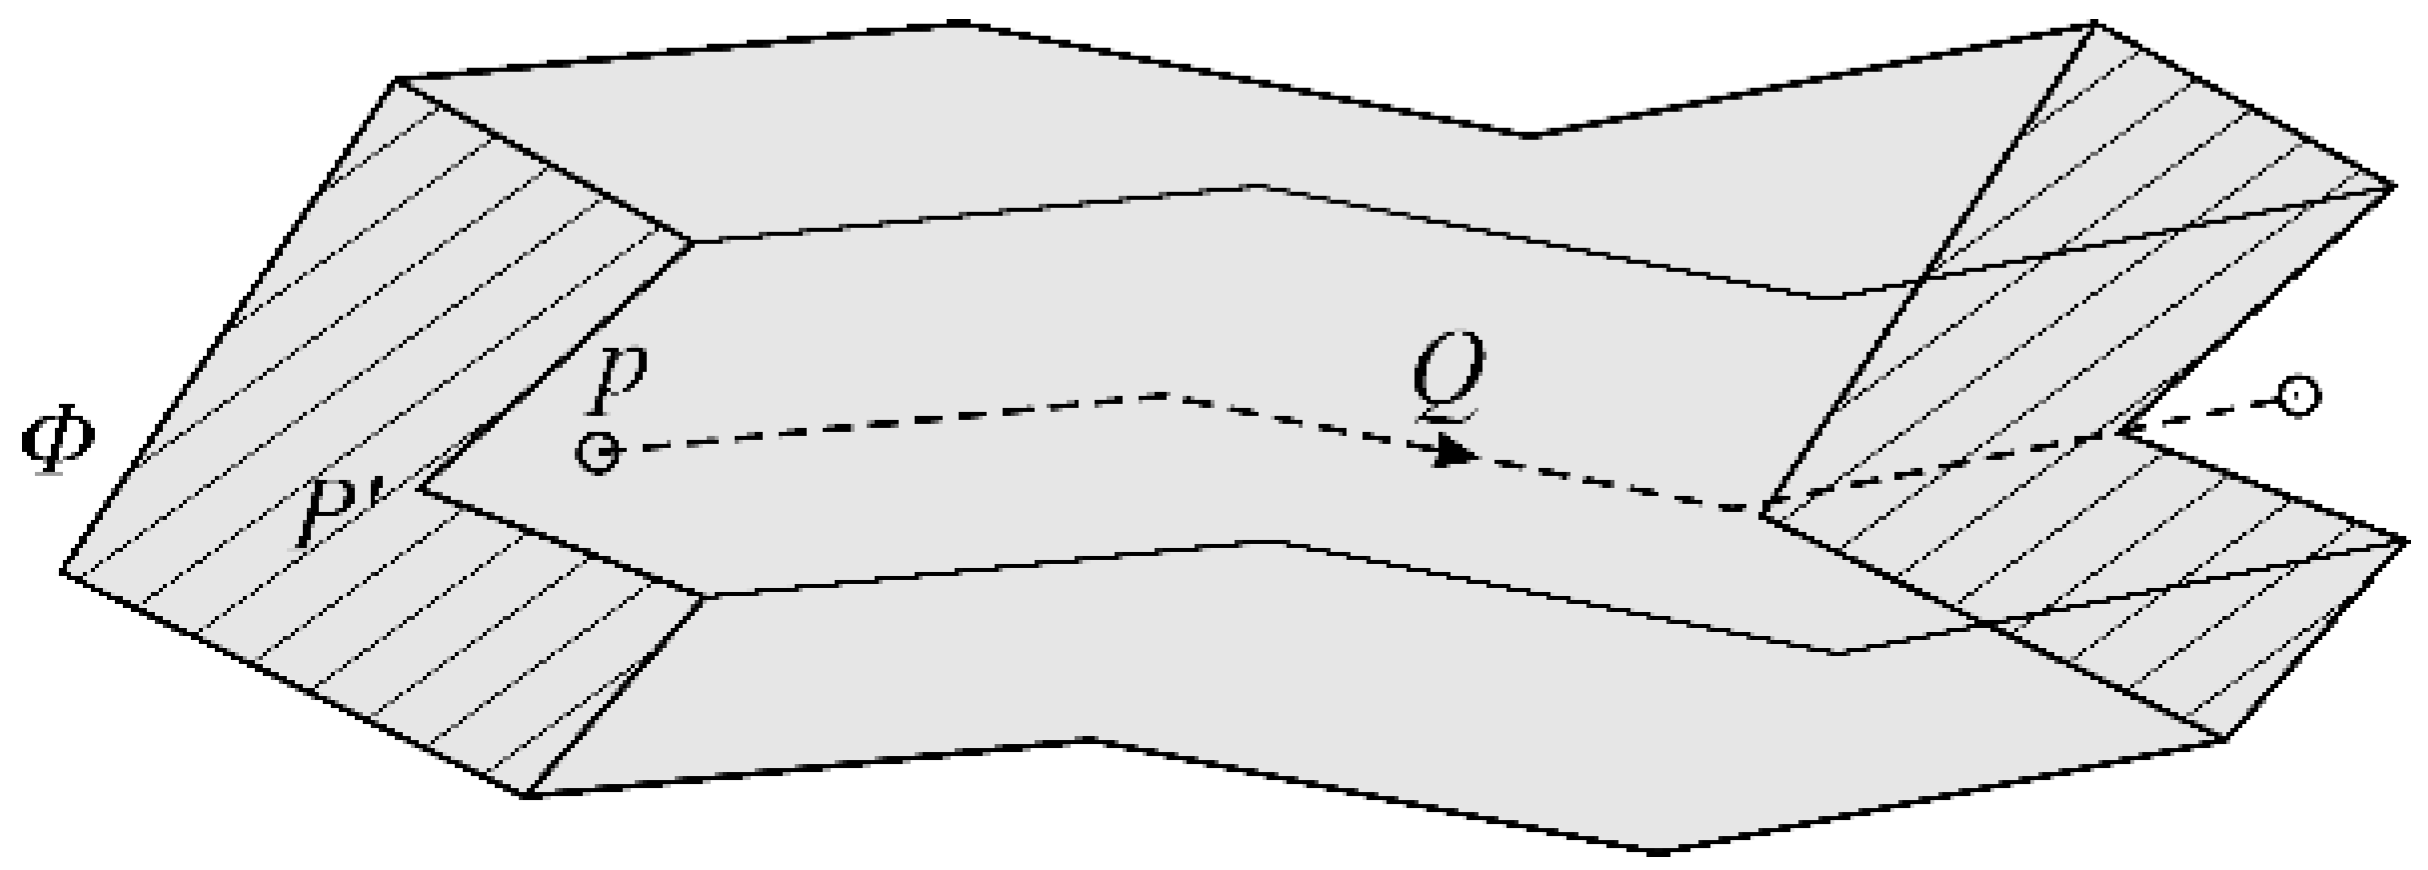
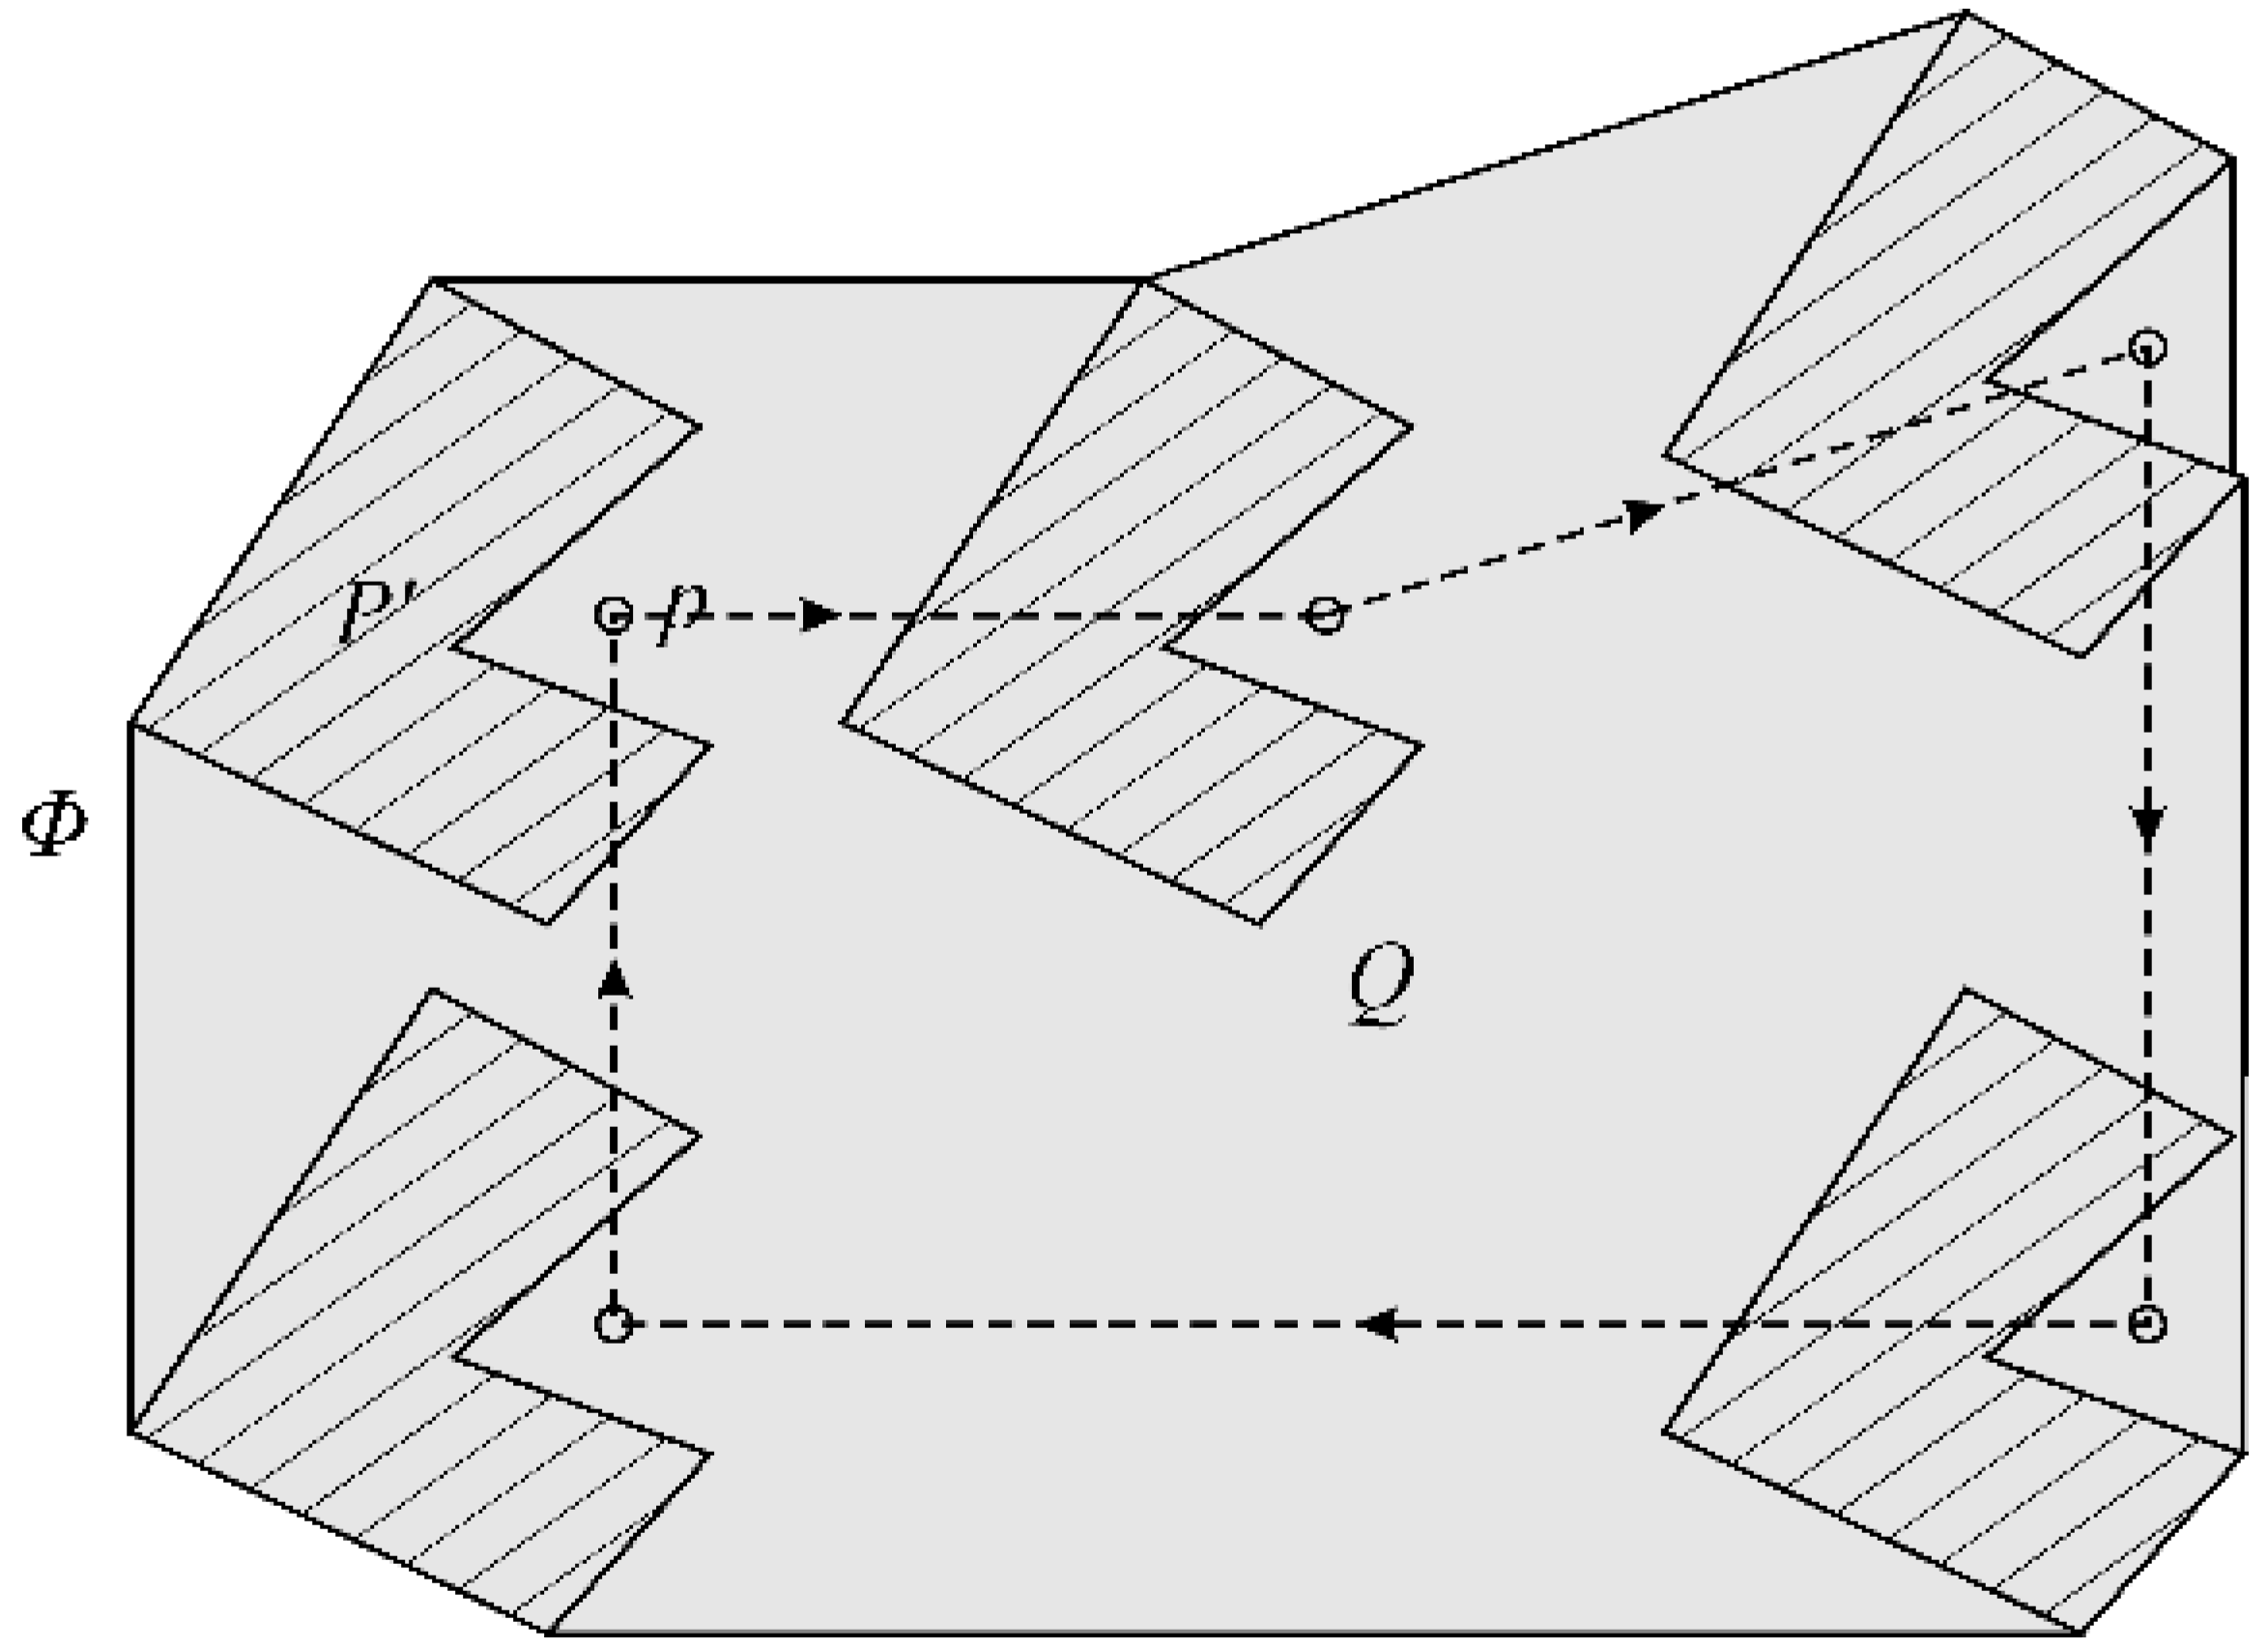
2.1. Region of Movability

The region of movability [29,32] in plane collision detection refers to the moving range for an object on the plane for rigid-body displacement on the premise of avoiding collisions with background obstacles. When applied to the label placement problem, the label itself is the ‘object on the plane’, whereas the various features of the map are the ‘background obstacles’. Thus, the region of movability defines a conflict-free space for labeling. This paper proposes an effective strategy based on mathematical morphology and boundary combinations to obtain this region.
Region of movability problem. Let P = (p0, p1, ..., pm−1) be a polygon (p as its anchor point) in the plane, and Q = (q0, q1, ..., qn−1) be the background polygon (line or point). Then, in what region can the polygon P move arbitrarily without colliding with Q?
To solve this problem, we first consider the simplified case, where the background object Q is a point, and then extend it to the full complexity concerning the line and polygon obstacles. The region of movability for polygon P with respect to the simple point Q is determined in Lemma 1.
Lemma 1. 
Let P be a polygon in the plane and Q be the background point. P undergoes rigid-body displacement from its anchor point p. Then, when p is located at point Q, the complementary set of polygon P′, which is central and symmetric with polygon P about the point p, is the movability region of P, represented by Φ(p, P, Qpoint) (see Figure 2).
As shown in Figure 2, if anchor point p of polygon P is located in the shaded region P′, then P will necessarily collide with point Q. In contrast, if p is located in Φ(p, P, Qpoint), the complementary set of P′, then P will be conflict-free. Thus, Lemma 1 describes only the movability region for the point background object. When extended to line or polygon obstacles, the following further processing should be performed.
Lemma 2. 
Let P be a polygon in the plane and Q be the background line. P undergoes rigid-body displacement from its anchor point p. P′ is the central symmetric polygon with P about point p. Then, when anchor point p moves along with line Q, the whole region that P′ has passed is known as the trace of P′, and its complementary set is the region of movability for P, represented by Φ(p, P, Qline) (see Figure 3).
Lemma 2 describes the generation of the movability region with a line obstacle, and is an extension of Lemma 1. The basic idea is to consider the line as a set of points, which converts the movability region problem with the line obstacle into a combination operation of movability regions with point obstacles described in Lemma 1. The case where the obstacle Q is a polygon can be handled in the same way. However, because the combination for the trace of P′ is not easy, the following theory and method are used to form a complete solution for the region of movability problem.
Definition 1 
(Minkowski addition [33]). Let P′ and Q be two arbitrary sets in Rd space. The resultant set S is obtained by positioning P′ at every point of Q, i.e., vectorially adding all of the points of P′ with those of Q. This process can be denoted as:
S = P Q = { b + t : b P , t Q }
where “⊕” stands for the Minkowski addition, which initially applies the mathematical morphology to the binary image expansion processing. When extended to vector graphics computation, the process is defined as the sum of the regions that P′ has passed from its anchor point p in all areas of the set Q (as shown in Figure 4). Ghosh et al. proposed a corresponding boundary addition theorem of polygons to obtain the result for Minkowski addition [33,34]. The computational result is shown in Figure 4.
From Lemmas 1 and 2 and Definition 1, a complete solution is presented for the region of movability problem with point, line or polygon obstacles in Inference 1. Thus, the conflict-free labeling space can be obtained based on it.
Inference 1. 
Let P be a polygon in the plane and Q be its background point, line, or polygon. P undergoes rigid-body displacement from its anchor point p, and P′ is the symmetric polygon of P with point p as the center. Then, Φ(p, P, Q), the region of movability for P, can be expressed as the complementary set of P′Q (as shown in Figure 4).

2.2. Label Placement Process

The region of movability provides a good basis for label placement. As mentioned before, our labeling strategy prefers to consider the PFLP as a problem of combinatorial optimization, which require two components to be defined: a discrete search space and an objective function [28]. Then, the problem can be solved using a variety of approximations and heuristics search approaches. Based on this strategy, the labeling process can be divided into three essentially independent phases [35]:
(1)
Generation of candidate positions: Given a point feature, obtain the conflict-free space (region of movability) for the label. Then, refine this continuous search space to a number of discrete candidate positions.
(2)
Evaluation of candidate positions: Given a label, compute the score that indicates its quality with respect to various evaluation factors.
(3)
Selection of label positions: Given a set of candidate label positions for each point feature, select one label position from each set to maximize the overall quality of the labeling, as measured in the evaluation phase.

2.2.1. Generation of Candidate Positions

In the first phase of label placement, the conflict-free search space for each label is produced. Then, a set of favorable candidate label positions are selected discretely based on this space. For the convenience of the elaboration, this process is described only for axis-parallel rectangular labeling because other arbitrarily shaped labels can be managed in a similar way.
More natural than the fixed-position model or slider model, the key point of our model is that the surrounding zone of a point feature is utilized for label placement. As seen from Figure 5, the search space of the three main labeling models is presented (defined by the location of the label’s midpoint). For the fixed-position model with eight candidates, the search space is shown in Figure 5a with eight points, and the rectangular line in Figure 5b represents the search space for the slider model. The search space of our model is depicted in Figure 5c with a rounded rectangle. Thus, for any label in this space, its distance to the point feature is less than the threshold value r, and does not overlap the point feature. The search spaces of the fixed-position model and slider model are contained by the search space of our model. The labeling result would benefit from the extended and complete search space.

(i) Candidate Search Space Generation

According to the basic definition and geometrical computation of the region of movability given in Section 2.1, the conflict-free search space for a rectangular label can be obtained. Specifically, the rectangular label textbox is regarded as the polygon P in Inference 1, and the midpoint of the textbox is selected as the anchor point p. Because the label textbox is symmetrical with point p, then P′ = P. The regions of “immovability” for the basic point, line and area feature are shown in Table 1.
Then, the conflict-free candidate search space of a point feature is generated by taking the complementary set of these immovability regions. The detailed flow diagram of this process is shown in Figure 6, in which (a) shows the schematic diagram of the point feature, label textbox size, and the whole surrounding search space for labeling (as already described in Figure 5c). Then, a label placement case is shown in (b), with the dot standing for the point feature to be labeled, whereas the other points, lines, and areas are adjacent obstacle features. The corresponding region of immovability is illustrated in (c), denoted by the shaded area. Finally, the whole conflict-free labeling space is obtained in (d), as shown by the gray zone within the dashed box. Only if the midpoint of the label is located in this zone is there no conflict with these background features.

(ii) Candidate Label Position Selection

The candidate label region provides a full collection of conflict-free space for label placement. In this step, the continuous search space is refined to a certain number, n, of candidate label positions. To select the n positions, the label location preference is considered, which comprises two major factors: the label-feature distance and label direction preference. To combine these factors, the research obtains all n nearest label positions from different directions in the candidate label region by choosing discrete points on the label textbox as the reference for distance computation. Then, the obtained n positions are selected as the candidate positions. As shown in Figure 7, the following detailed processes are employed:
(1)
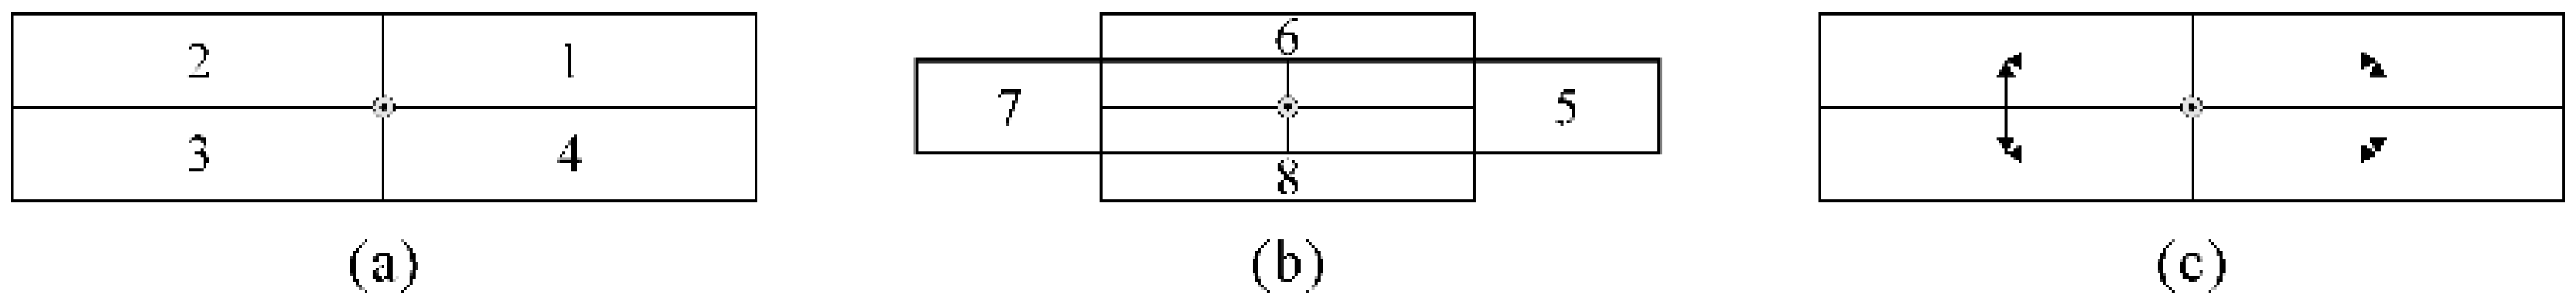
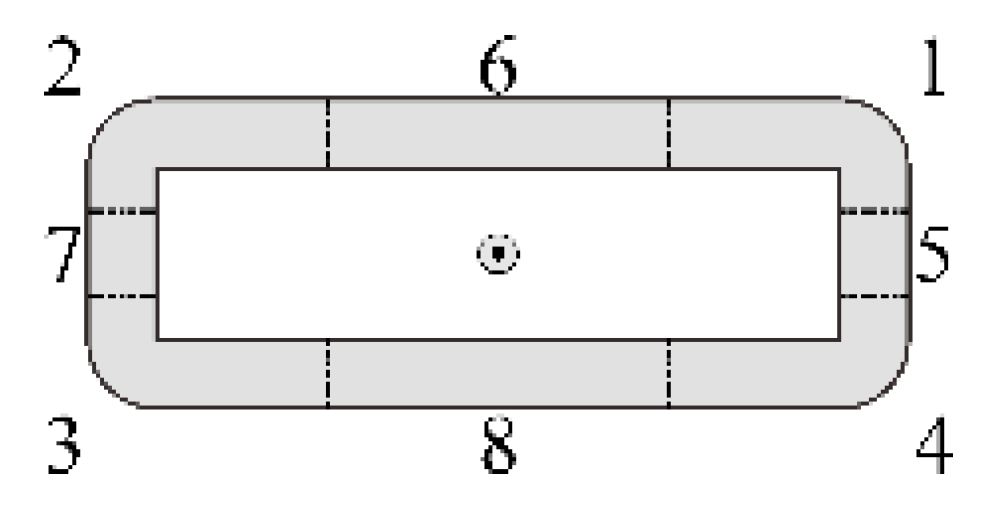
Equally divide the outline of the label textbox with the horizontal and vertical intervals of w and h to produce n discrete points as the reference points for distance computation, as shown in Figure 7a.
(2)
Choose point M as the reference point from n discrete points. Then, within the candidate label region, find the position from which the point M is nearest to the point feature to be a candidate label position, as shown in Figure 7b.
(3)
Repeat Step 2 to select all of the other reference points for the total n candidate label positions. (When the map features are too crowded, then the candidate positions fail to be generated because of the limited candidate label region; thus, the default positions in the fixed-position model are used.)
Because the fixed-position model with four candidates is commonly used in previous research for map labeling, as a comparison, when w and h are set equal to the width and height of the label textbox, the four candidates generated by our model are shown in Figure 8. The four reference points for the distance computation are depicted in Figure 8a. The generated four candidate label positions for the non-obstacle case and with-obstacle case are presented in Figure 8b,c (the obstacle lines and areas are indicated by the dotted lines in the figure). For the fixed-position model and slider model, the conflict-free candidates in Figure 8c would be missed.

2.2.2. Evaluation of the Candidate Positions

To compare various labeling solutions, a quantitative score is required to indicate the quality of labeling. The criteria of labeling quality have been studied by cartographers, most notably by Imhof and Yoeli [1,19,27]. Several basic factors are mostly concerned when labeling:
  • Conflict or overlap between labels and graphical features.
  • A priori preferences among a set of candidate label positions.
  • Association between a label and its corresponding feature.
Based on these label quality criteria, various objective functions are used for combinatorial optimization of labeling. The choice of objective function affects the aesthetics of the layout and the efficiency of the search. In this paper, the objective function is defined as:
i = 1 N ( w 1 P o s P r e f e r e n c e ( i ) + w 2 P o s C o n f l i c t ( i ) )
where N refers to the total point feature count, and i represents the label of the point feature i, as 1 ≤ iN. The functions PosPreference() and PosConflict() quantify the preference and the conflict factors of the label respectively, with w1 and w2 as the weights. If w1 = 0, then the preference of the label position is not considered.
As for the label position preference PosPreference(), an extension from the fixed-position model can be implemented [36], as shown in Figure 9, in which the candidate label position is assigned to eight sections with different preference ranks.
For the convenience of the description for the labeling result, only the number of conflict-free labels is considered in the next labeling experiments section. The preference is not taken in account, thus w1 = 0; accordingly, w2 = 1 and the PosConflict() is defined as follows. As a result, the objective function is set for the conflict-free label number maximization.
P o s C o n f l i c t ( i ) = { 1 if label   is conflict   free   with   other   labels   and   features 0 else .

2.2.3. Selection of Label Positions

With a set of generated candidate positions for each label and an overall objective function, selecting positions for all the labels to maximize the globally objective function is a combinatorial optimization problem. Although many different approximations and heuristics have been proposed for this problem, the method based on simulated annealing is preferred in this paper. As a high efficiency and flexible optimization method, simulated annealing is widely used to solve large optimization problems, including label placement [2,8,19,36,37]. The basic processes of simulated annealing are as follows [3]:
  • For each point feature, place its label randomly in any of the candidate positions.
  • Initialize the temperature T to a high initial value To.
  • Repeat the following steps until the temperature T falls below a given threshold value Tc:
    (a)
    Decrease the temperature T according to an annealing schedule.
    (b)
    Randomly pick a label and move it to a new randomly chosen candidate position.
    (c)
    Compute ΔE, the change of the objective function caused by moving the label.
    (d)
    If the new labeling is worse, undo the label repositioning with the probability P = 1.0 e Δ E / T .
The implementation of standard simulated annealing requires four components: initial configuration, objective function, configuration changes, and an annealing schedule [3]. And various parameters are used to control the annealing process, such as the initial temperature To, threshold temperature Tc, temperature cooling rate A, reposition times M for each annealing stage, and maximum accepted times K for an immediate temperature decrease. In our labeling process, these parameters are set similar to the values used in previous research [3,8]. The parameter values are shown in Table 2 (where N is the number of point features).
With the abovementioned three essentially independent phases described in Section 2.2, the whole procedure of the region of movability based point-feature labeling is as in Algorithm 1.
Algorithm 1 Region of movability based point-feature labeling
Input:
     U: the point features to be labeled (with corresponding label width and height)
     O: the point obstacles
     L: the line obstacles
     P: the polygon obstacles
Start:
(1)  repeat
(2)    Select a point u from U, and get its textbox polygon t according to the width and height
(3)    Calculate the original search space g for the point u according to t and label-feature distance threshold value r
(4)    Get the obstacles from O, L and P which occlude the labeling region g
(5)    Based on these obstacles, calculate the region of movability s for point u with Minkowski addition
(6)    Get the reference point set V of the textbox t
(7)      repeat
(8)        Select a reference point v from V
(9)        Find the candidate label position c within the region s, which makes the distance between reference point v and point u shortest
(10)       Add c to the candidate label position set Cu for point u
(11)     until the candidate label position is created for every reference point from V
(12)   Add Cu to the candidate label position sets C
(13) until the candidate label position set is created for every point in U
(14) initialize randomly choose label position from C for each point to initialize the labeling solution z
(15) repeat
(16)   Improve the solution z with simulated annealing process
(17) until the temperature for simulated annealing falls below a given threshold value
(18) Create the labeling result layer R according to the solution z
Output:
     R: the labeling result layer

3. Experiments

The described region of movability-based labeling model is implemented in C# and runs on a PC with an Intel Core i5 3.2 GHz CPU and 4 GBs of RAM. To verify the effectiveness of the proposed labeling model, some comparative experiments with the fixed-position model and slider model are conducted. For the slider model, the four-slider model [22] is applied in the experiments. As for the fixed-position model, the four-position model is used since it is the most popular labeling model in previous researches. The four-position model is also combined with simulated annealing with the same parameter values described in Section 2.2.3 for comparison.
Labeling experiments are performed for several typical datasets. The labeling datasets are divided into three groups: (i) labeling with only point features; (ii) labeling with point, line and area features; and (iii) placement of arbitrarily shaped labels. Detailed information about these instances is shown in Table 3. The corresponding labeling results are presented in the following section. For a better comparison of the labeling results, the removal of conflicting labels is not included in the labeling experiments.

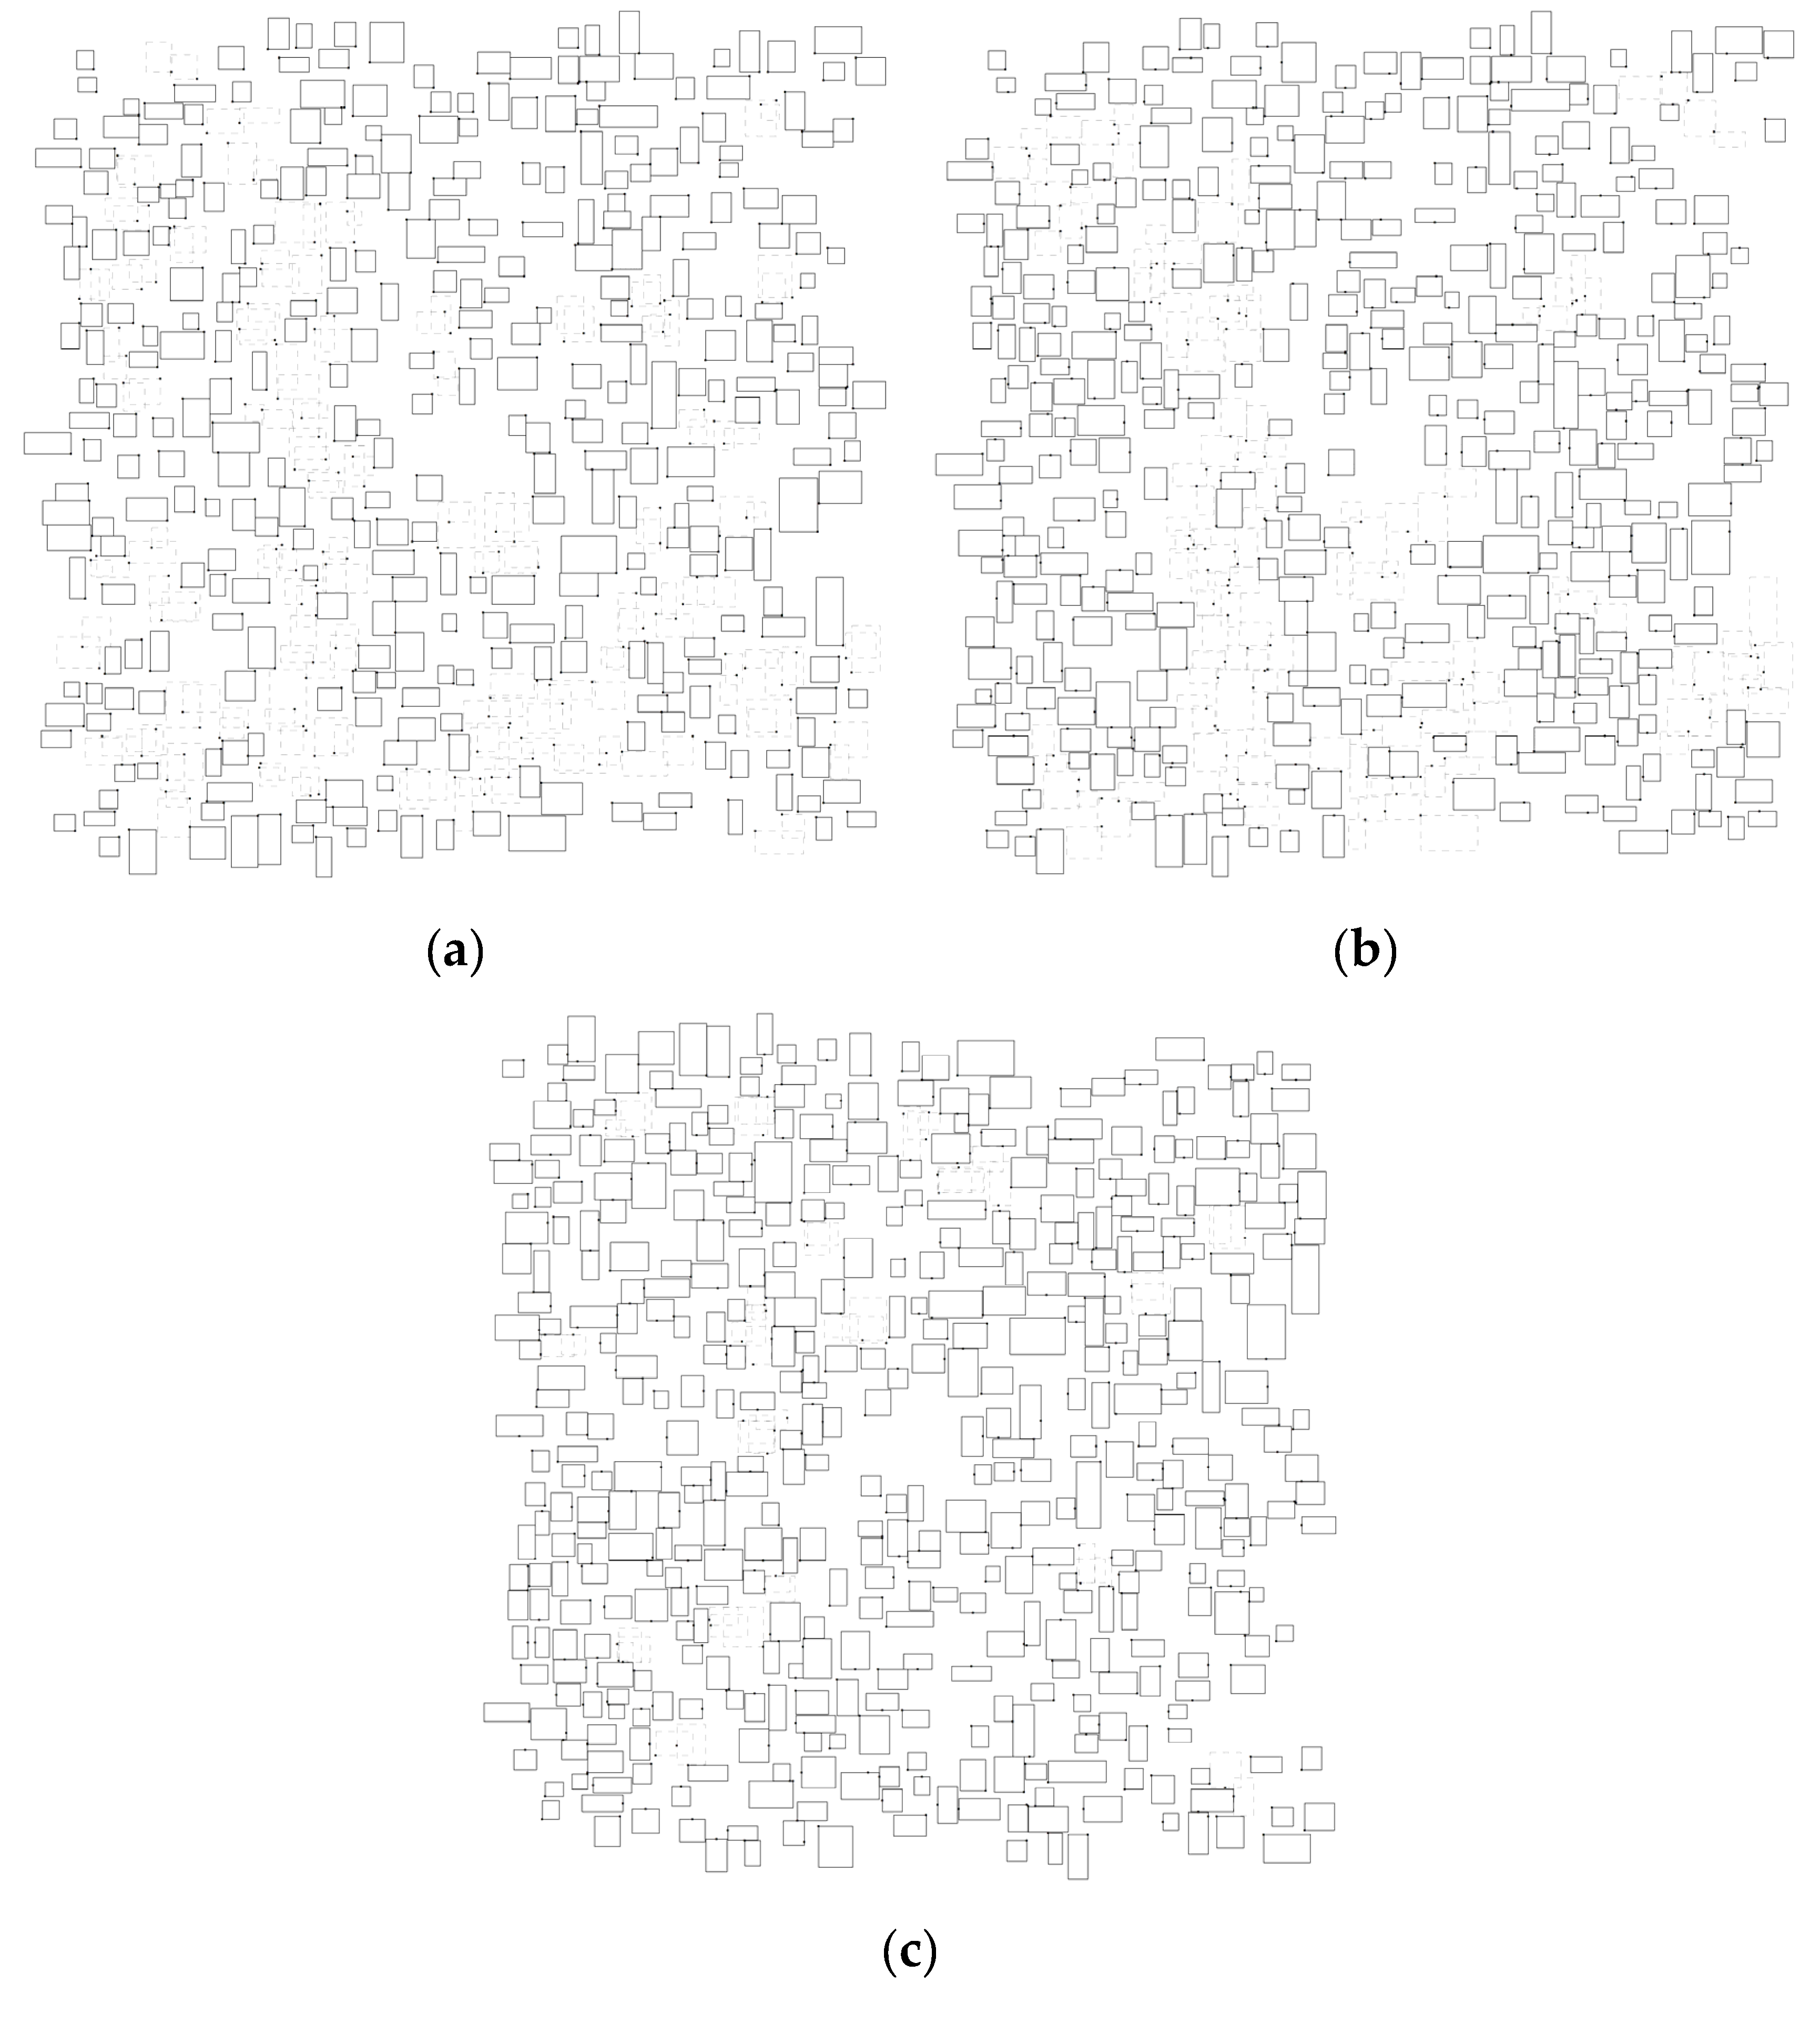
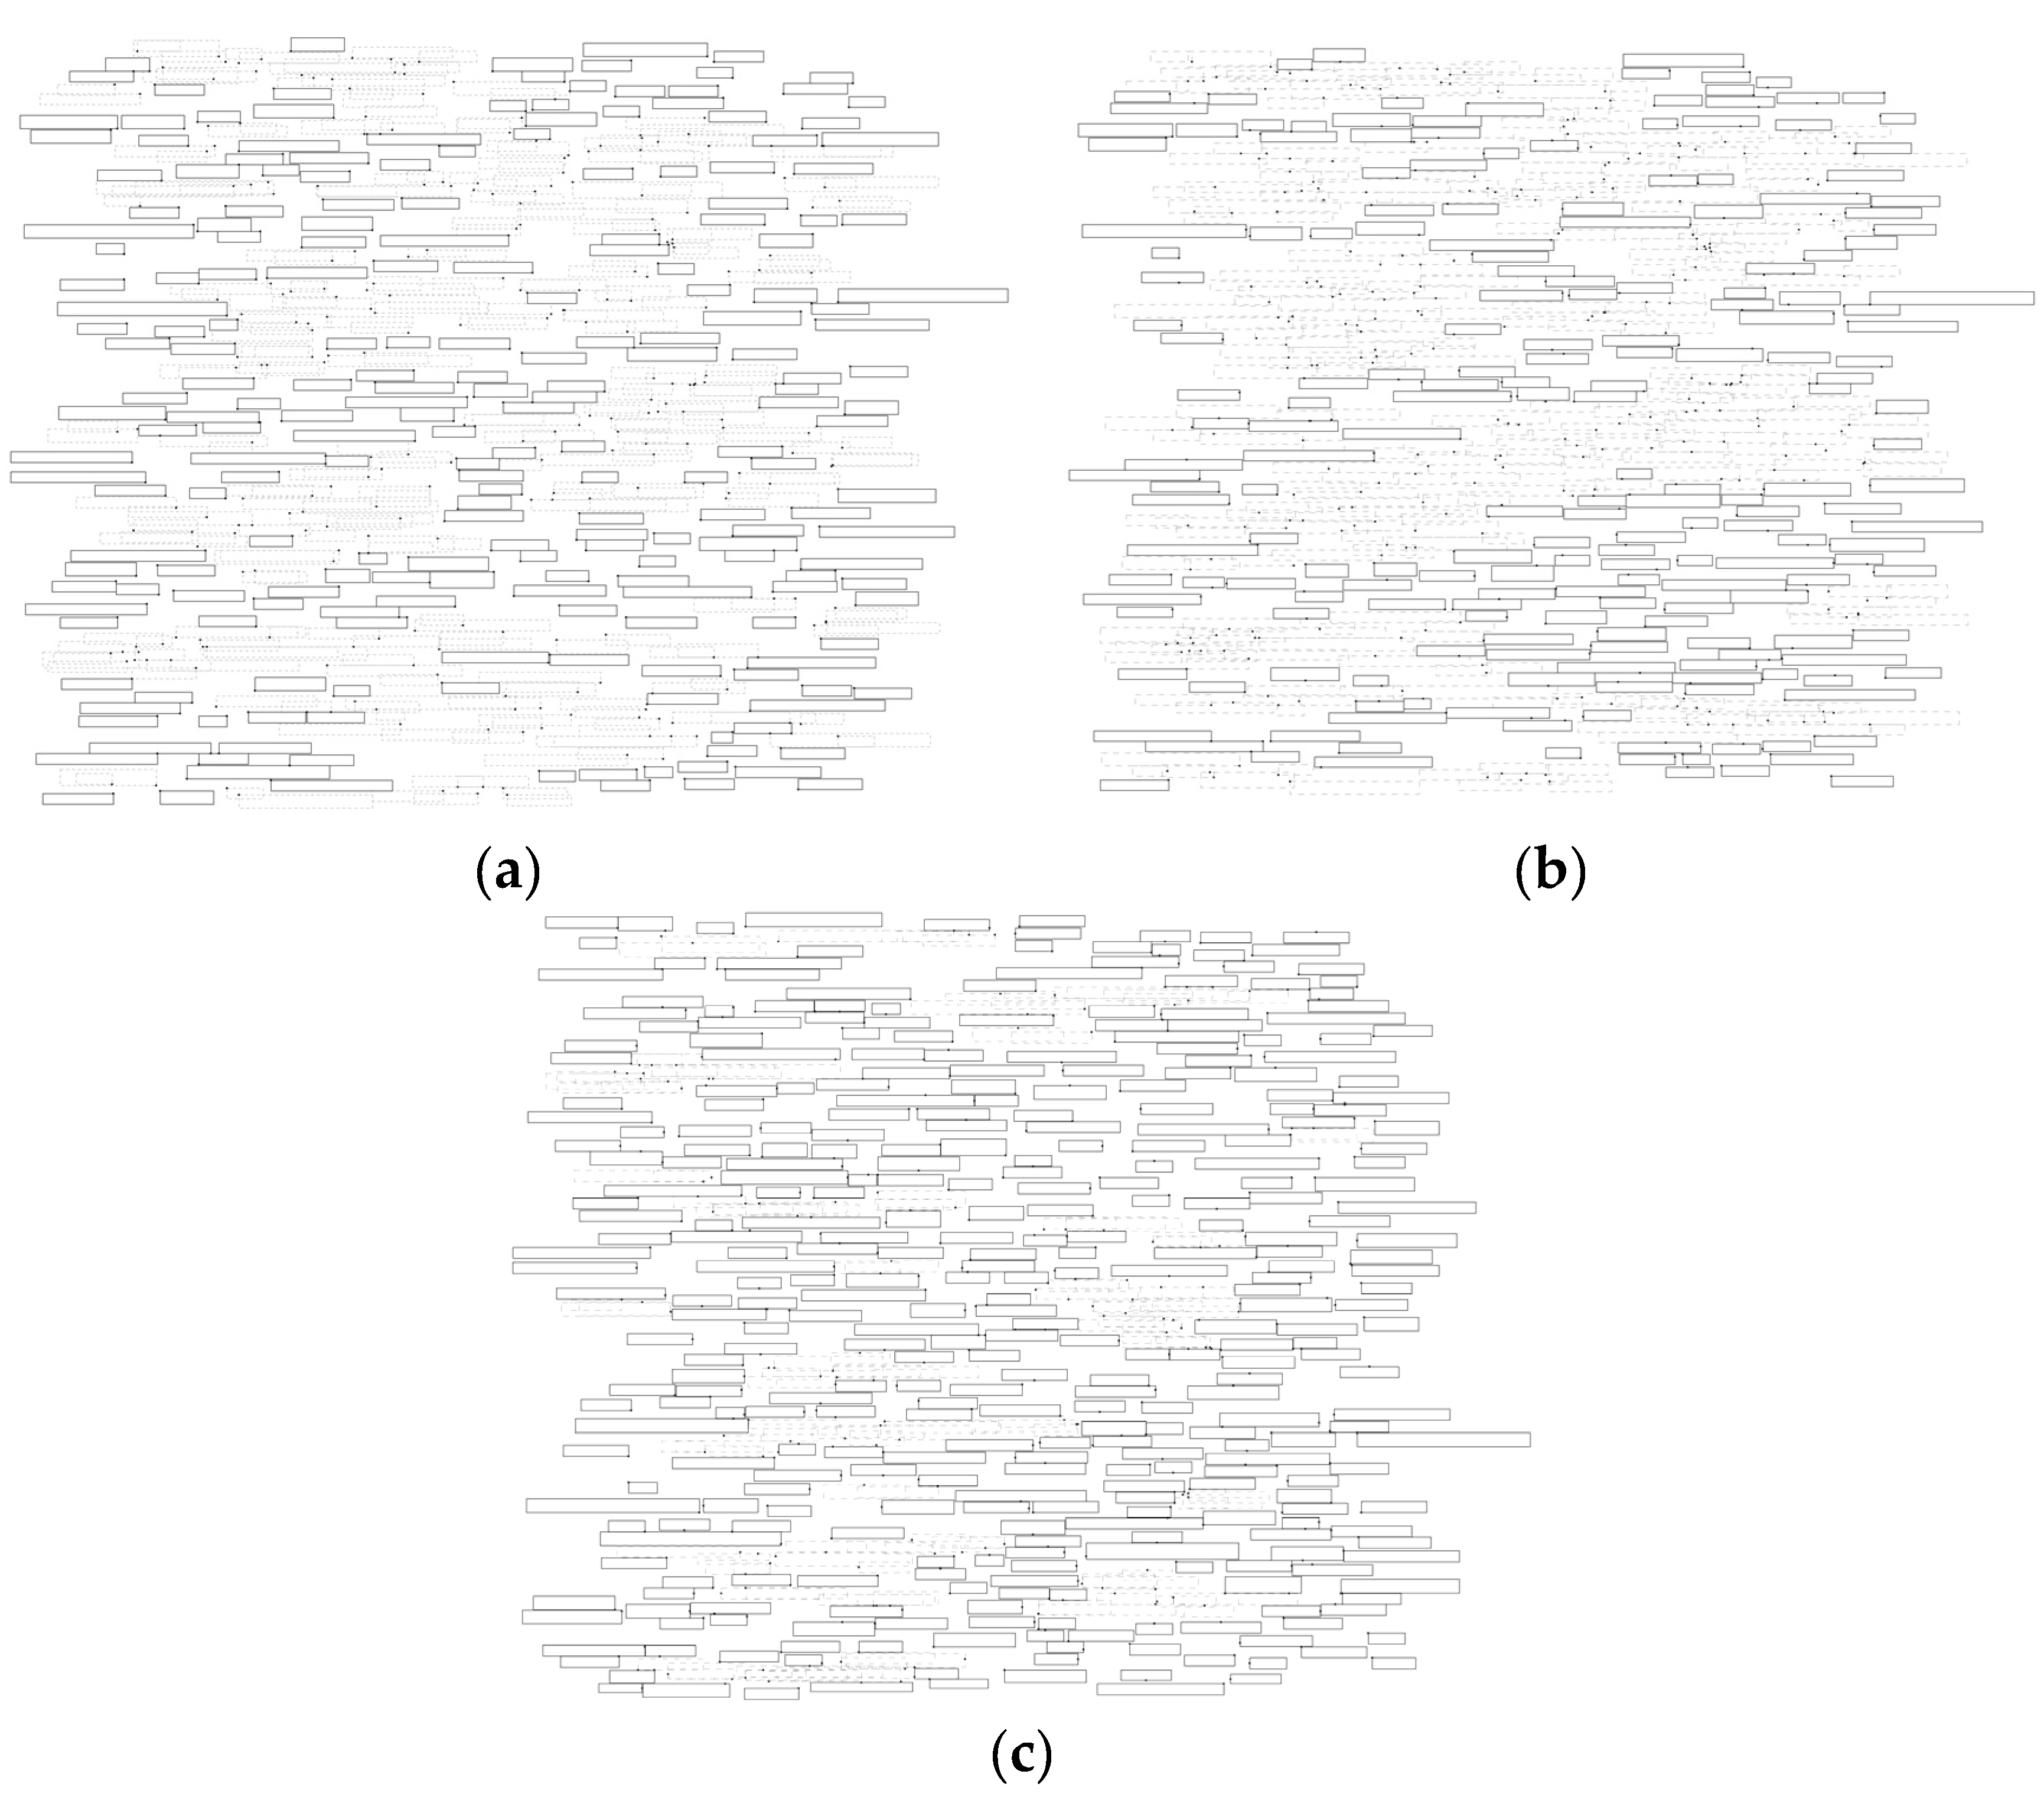
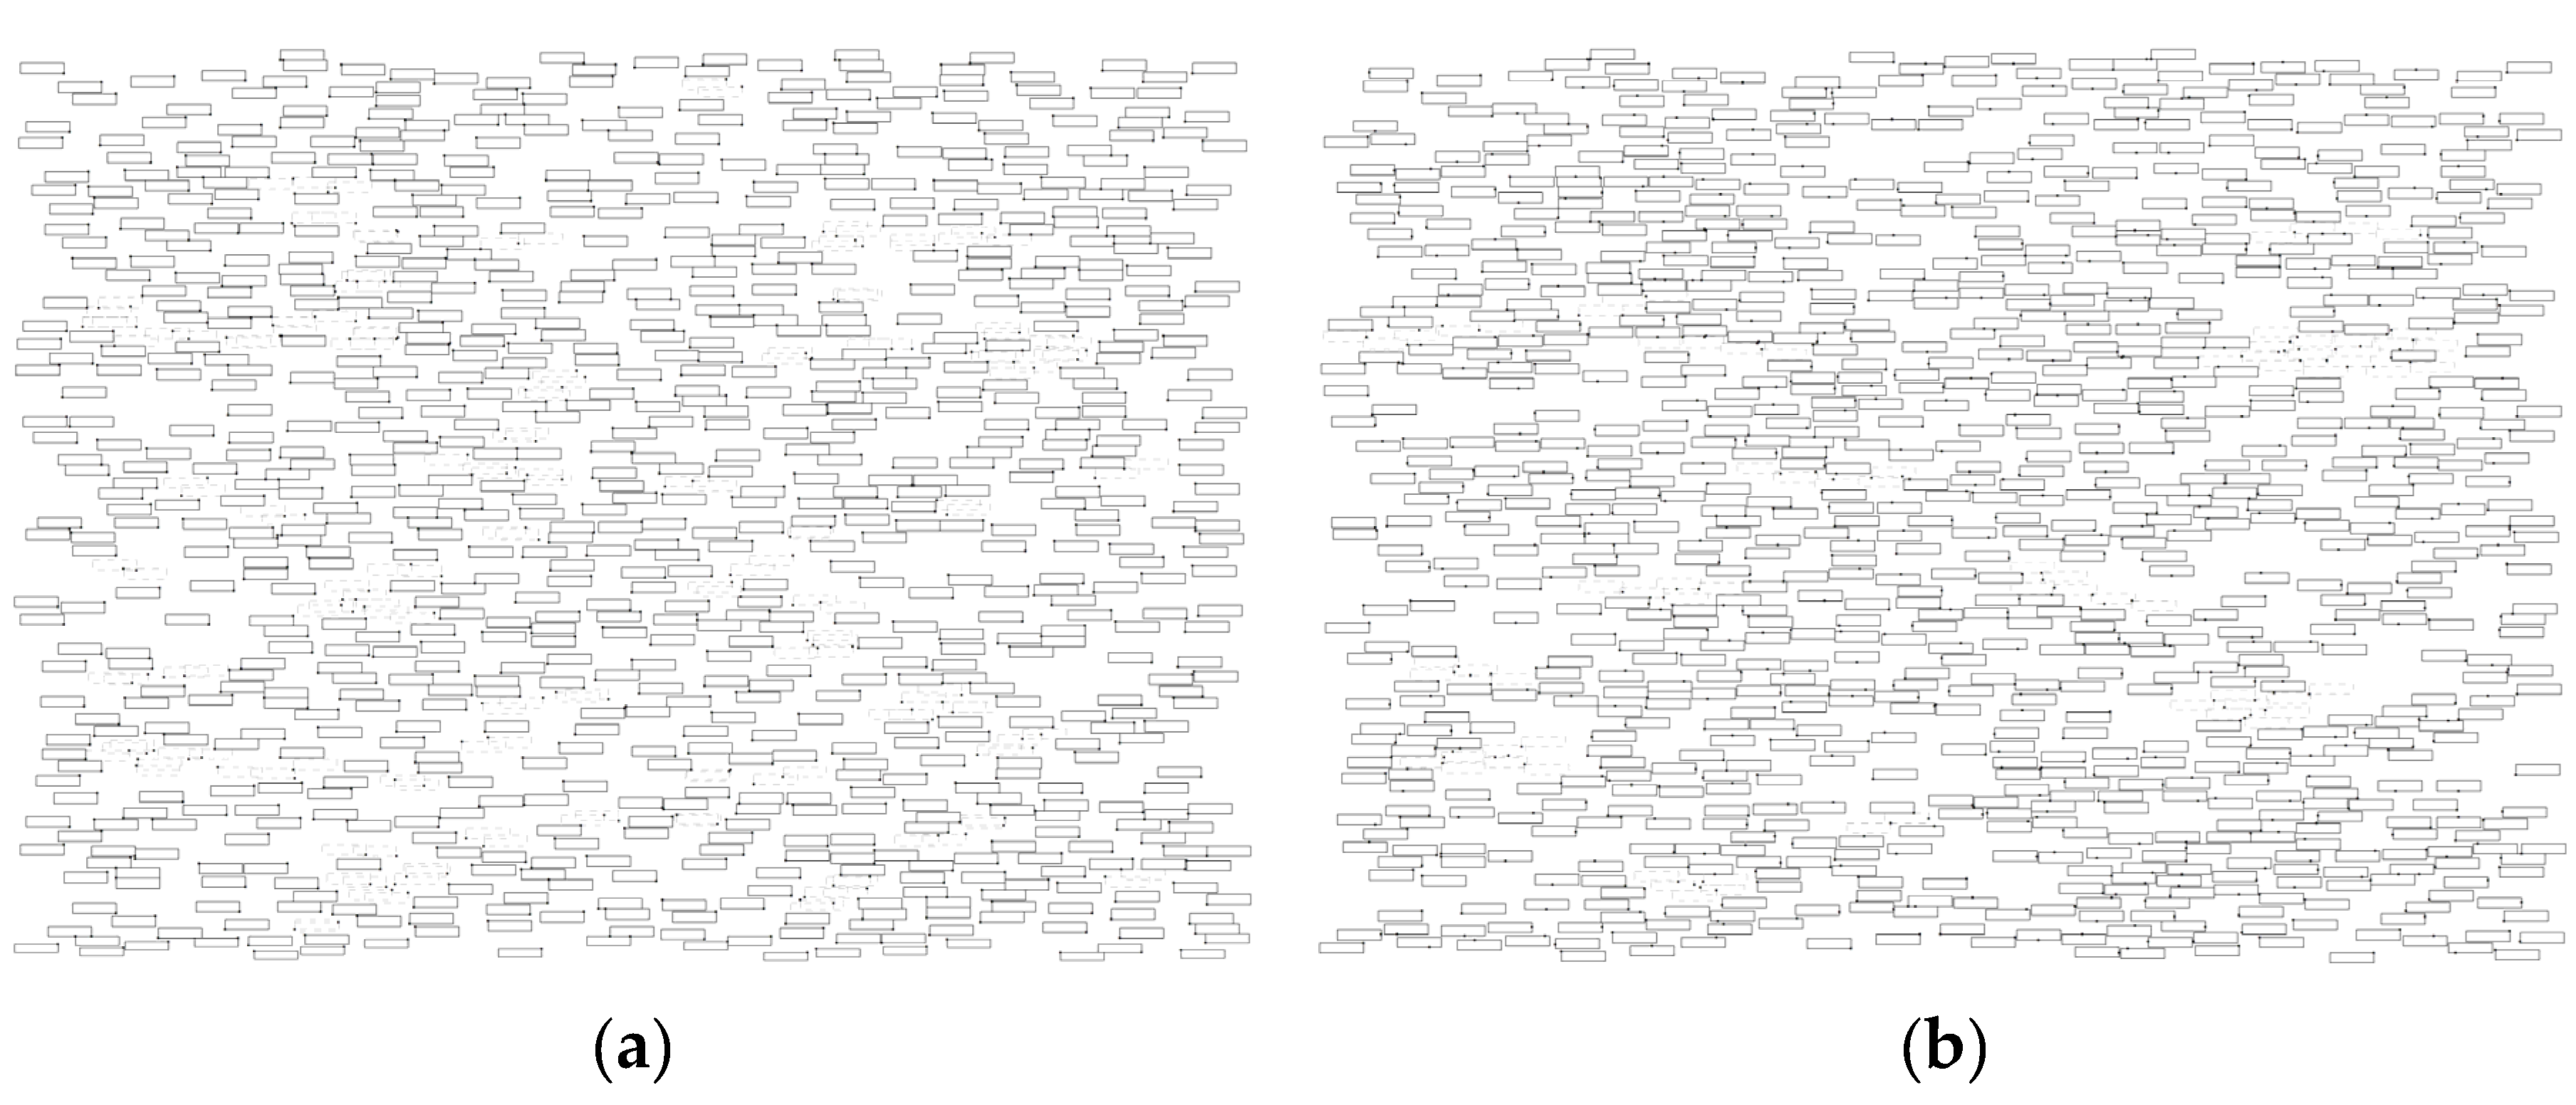
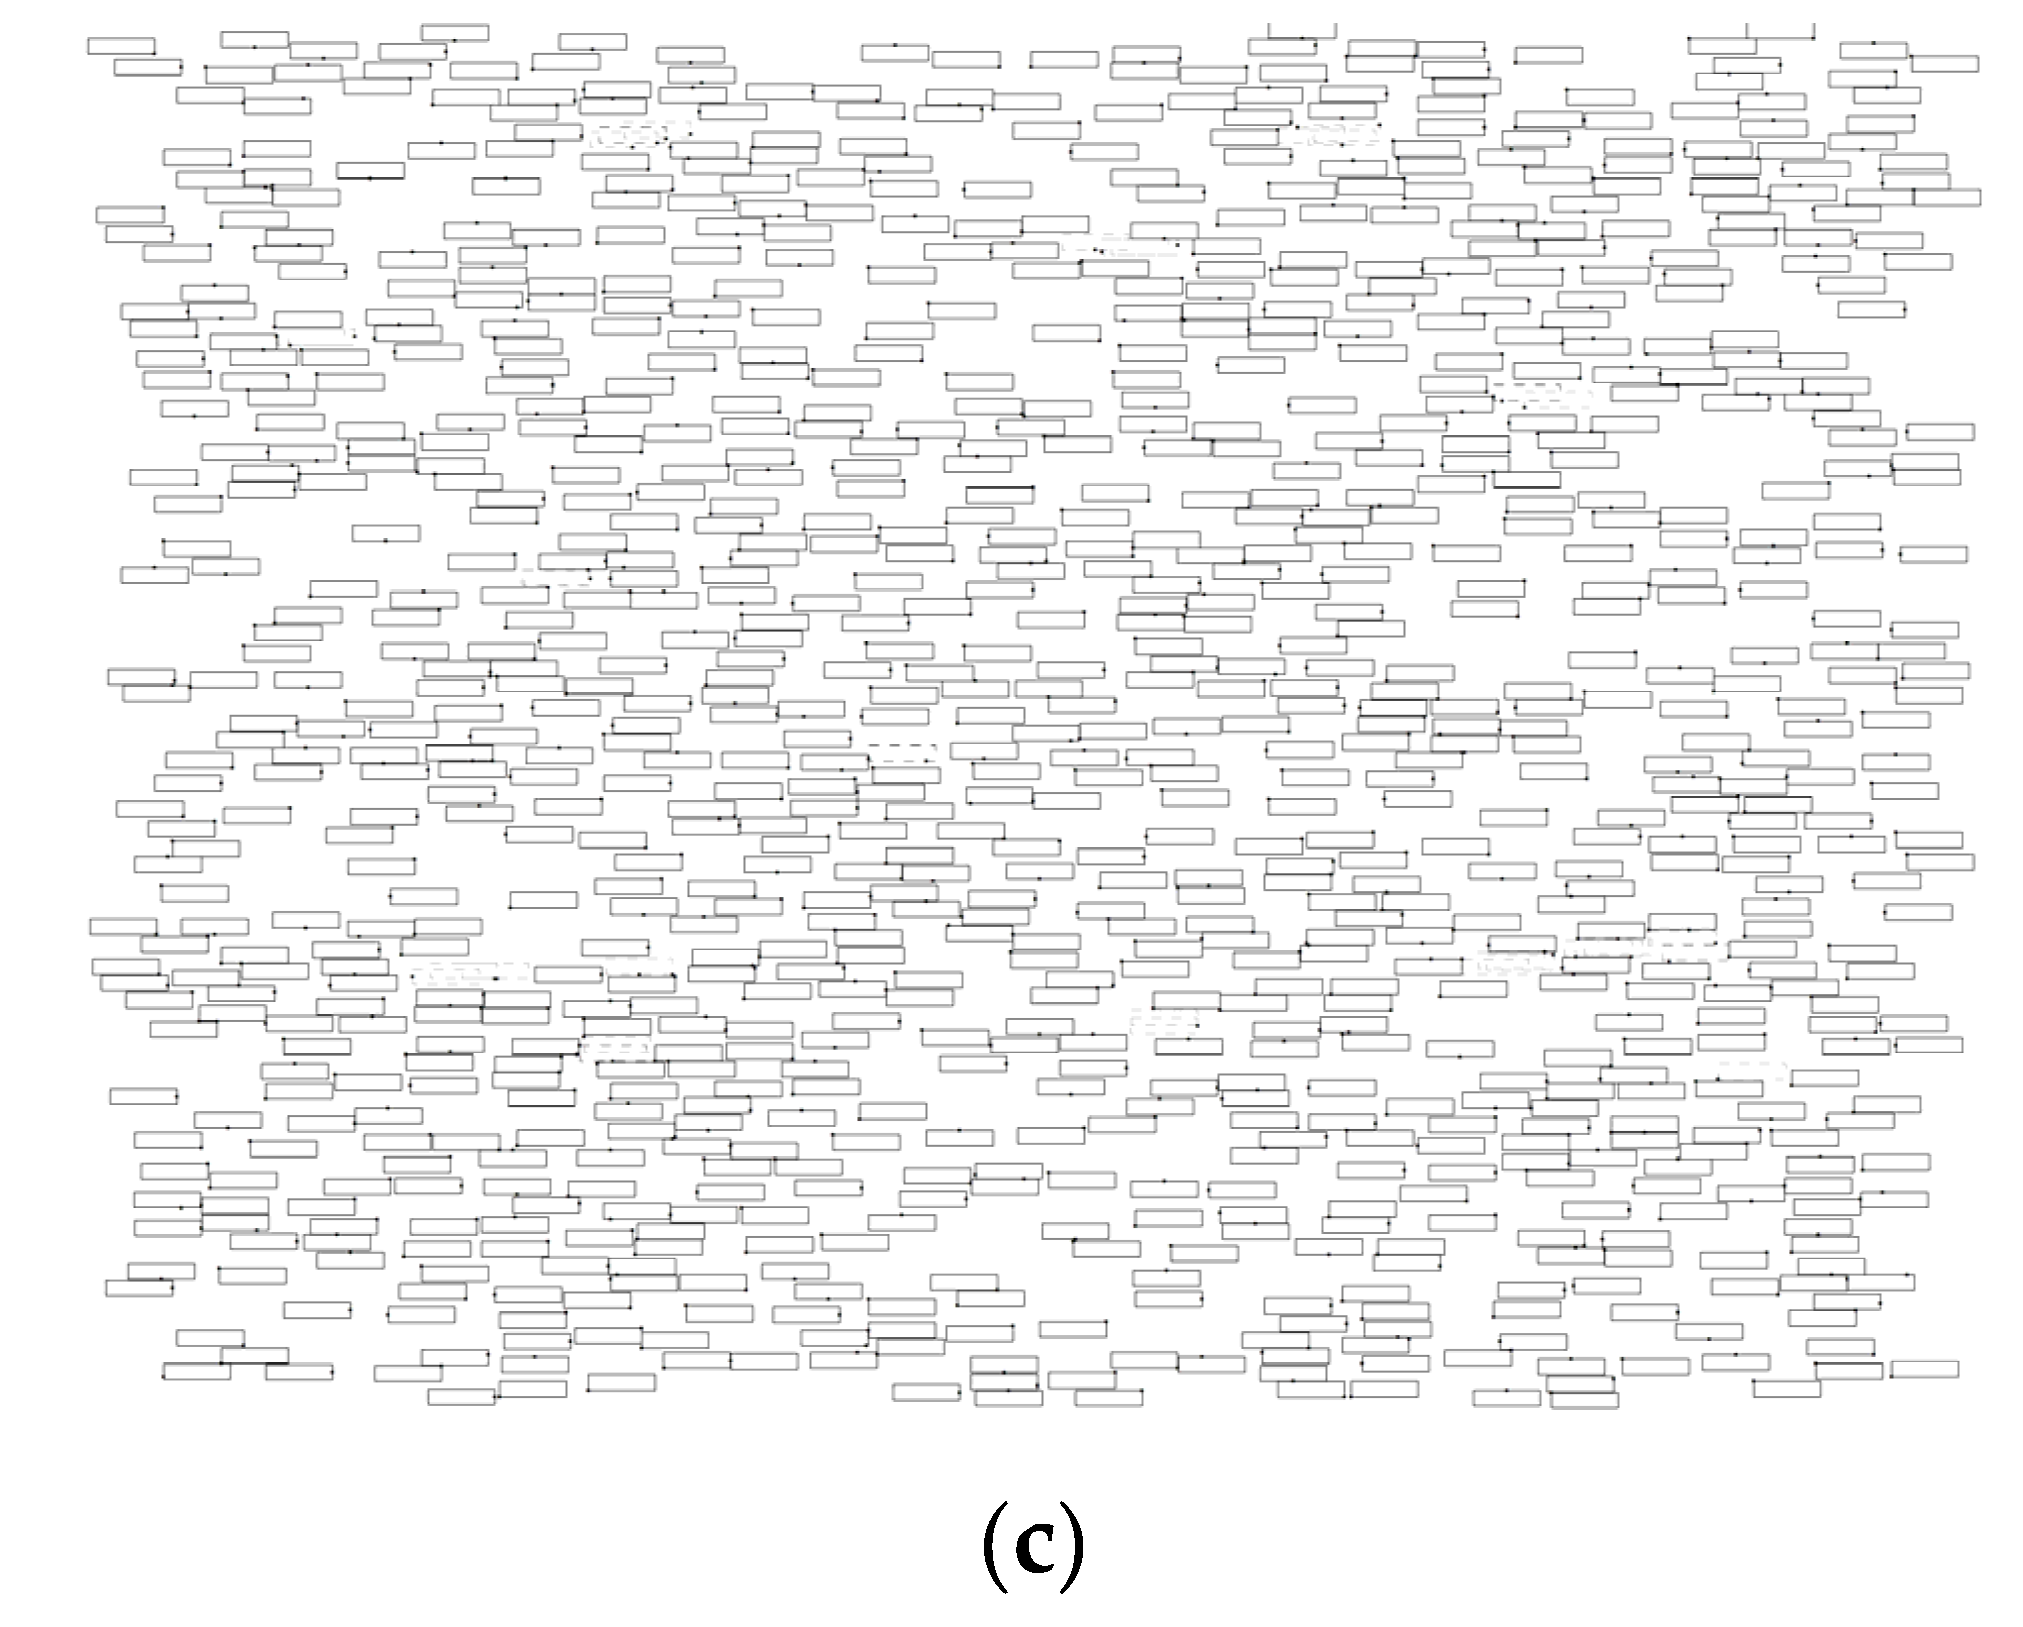
3.1. Labeling with Only Point Features

For most previous studies, labeling experiments that only concern the point features have been conducted. The datasets for labeling experiments with only point features are from previous representative research [2,38], namely, the RandomRect, RandomMap, and VariableDensity instances. And they are available at the labeling website [39]. The first instance in RandomRect, RandomMap, and VariableDensity with 500, 500, and 1000 points, respectively, are chosen for the labeling comparisons. The labeling results are presented in Figure 10, Figure 11 and Figure 12, and the conflicting labels are lighter in color and marked by dotted rectangles.
The RandomRect is formed by n points uniformly distributed in a square of size 25n × 25n, with the length of both edges independently created under normal distribution [2]. The labeling results for the chosen RandomRect instance are shown in Figure 10. For these three labeling models, the four-position model and the four-slider model generate 339 and 380 conflict-free labels. Our labeling model achieves a result with 450 conflict-free labels, with an improvement of 111 and 70 conflict-free labels compared with the former models, respectively.
The RandomMap is generated in a similar way as the RandomRect, but with more realistic label sizes to imitate a real map [2]. The corresponding labeling results for the chosen instance are depicted in Figure 11. As can be seen from this figure, there are 224 conflict-free labels produced by the four-position model, and 205 conflict-free labels by the four-slider model. For our model, the result achieves 358 conflict-free labels, with 134 and 153 more compared with the four-position model and four-slider model, respectively.
The VariableDensity is formed by the points distributed uniformly on a rectangle of size 792 × 612 with equal label size of 30 × 7 [2]. The labeling results for this instance are shown in Figure 12. The four-position model, four-slider model, and our model get 833, 925, and 960 conflict-free labels, respectively.
The labeling results and the running time for these three instances are given in Table 4. With only the point obstacles considered, the region of movability-based labeling model guarantees a better labeling result and achieves an efficient improvement compared with the former models. The four-slider model gets better results for the RandomRect and VariableDensity than the four-position model, as it takes advantage of a flexible sliding for a label. However, the result for the RandomMap with four-slider model is a little worse than the four-position model. That is because the RandomMap contains too high a density of points and labels, and does not leave much space for sliding. So, if the slider model gets little benefit from the sliding labels, the fixed-position model may get a better result with the combinatorial optimization strategy.
As the geometric computation is involved, our model runs longer than the four-position model and four-slider model. Nevertheless, the loss in efficiency is acceptable since the main concern of the proposed model is the labeling quality for the map production.

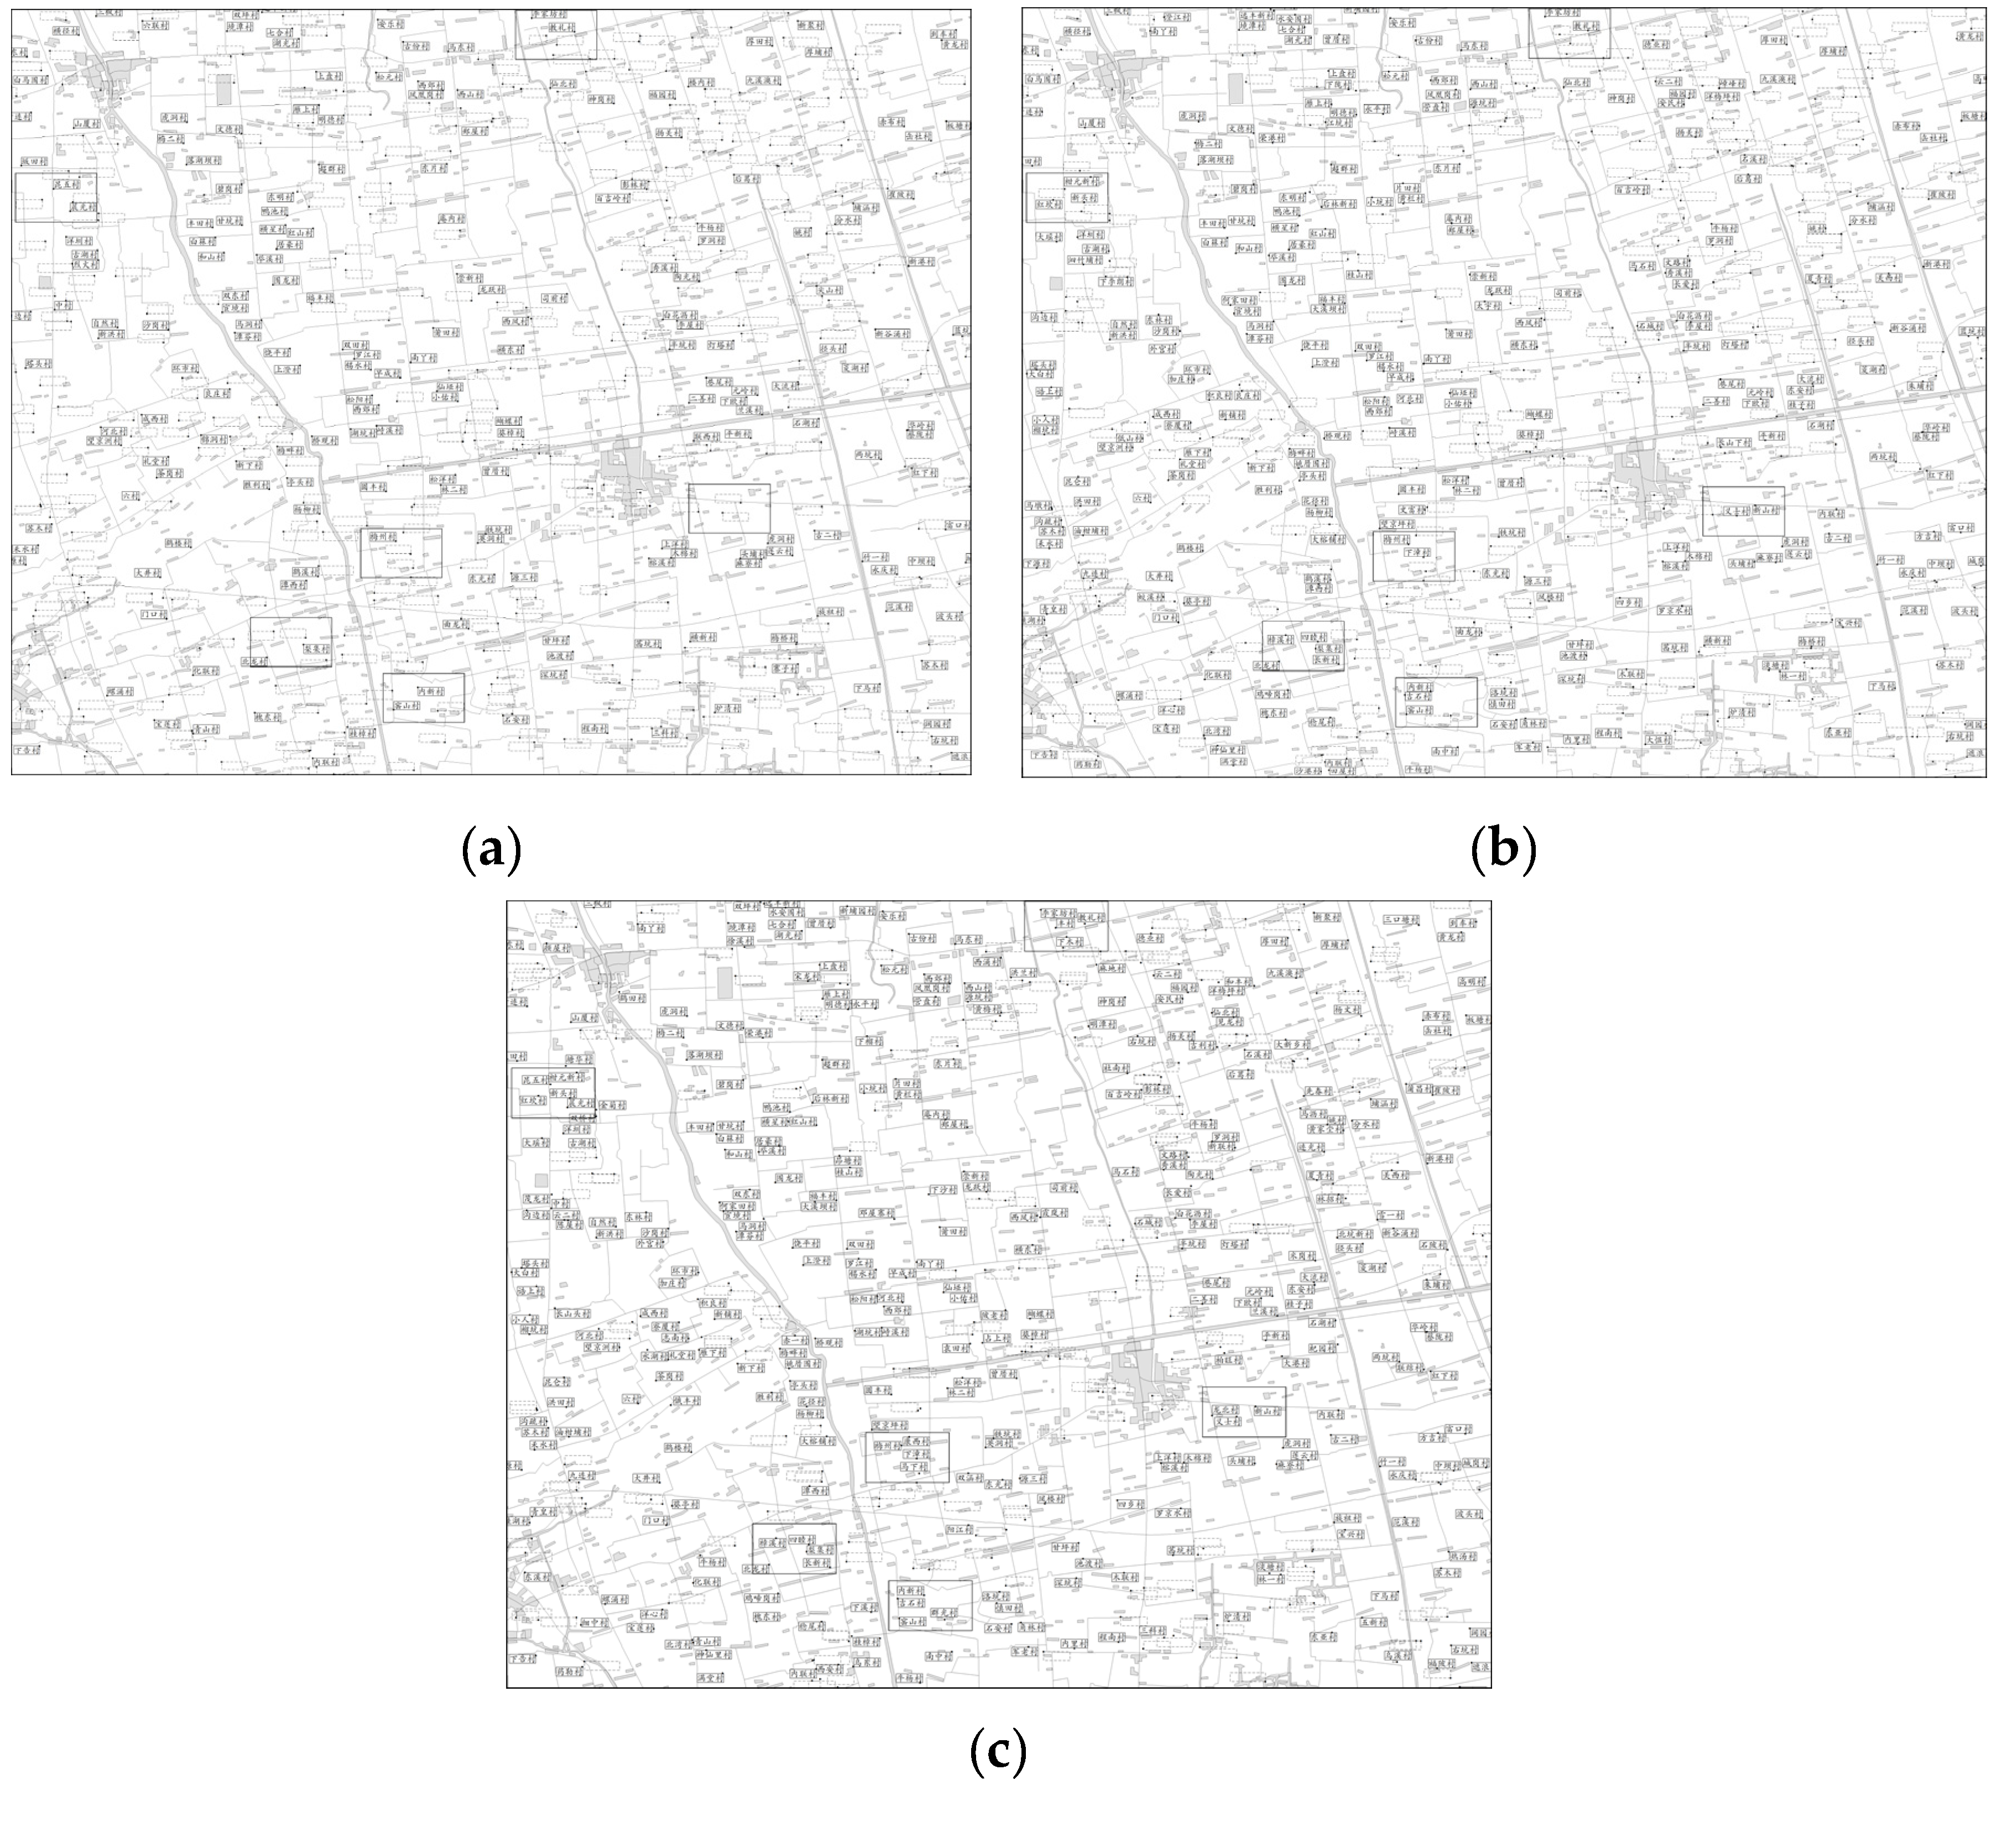
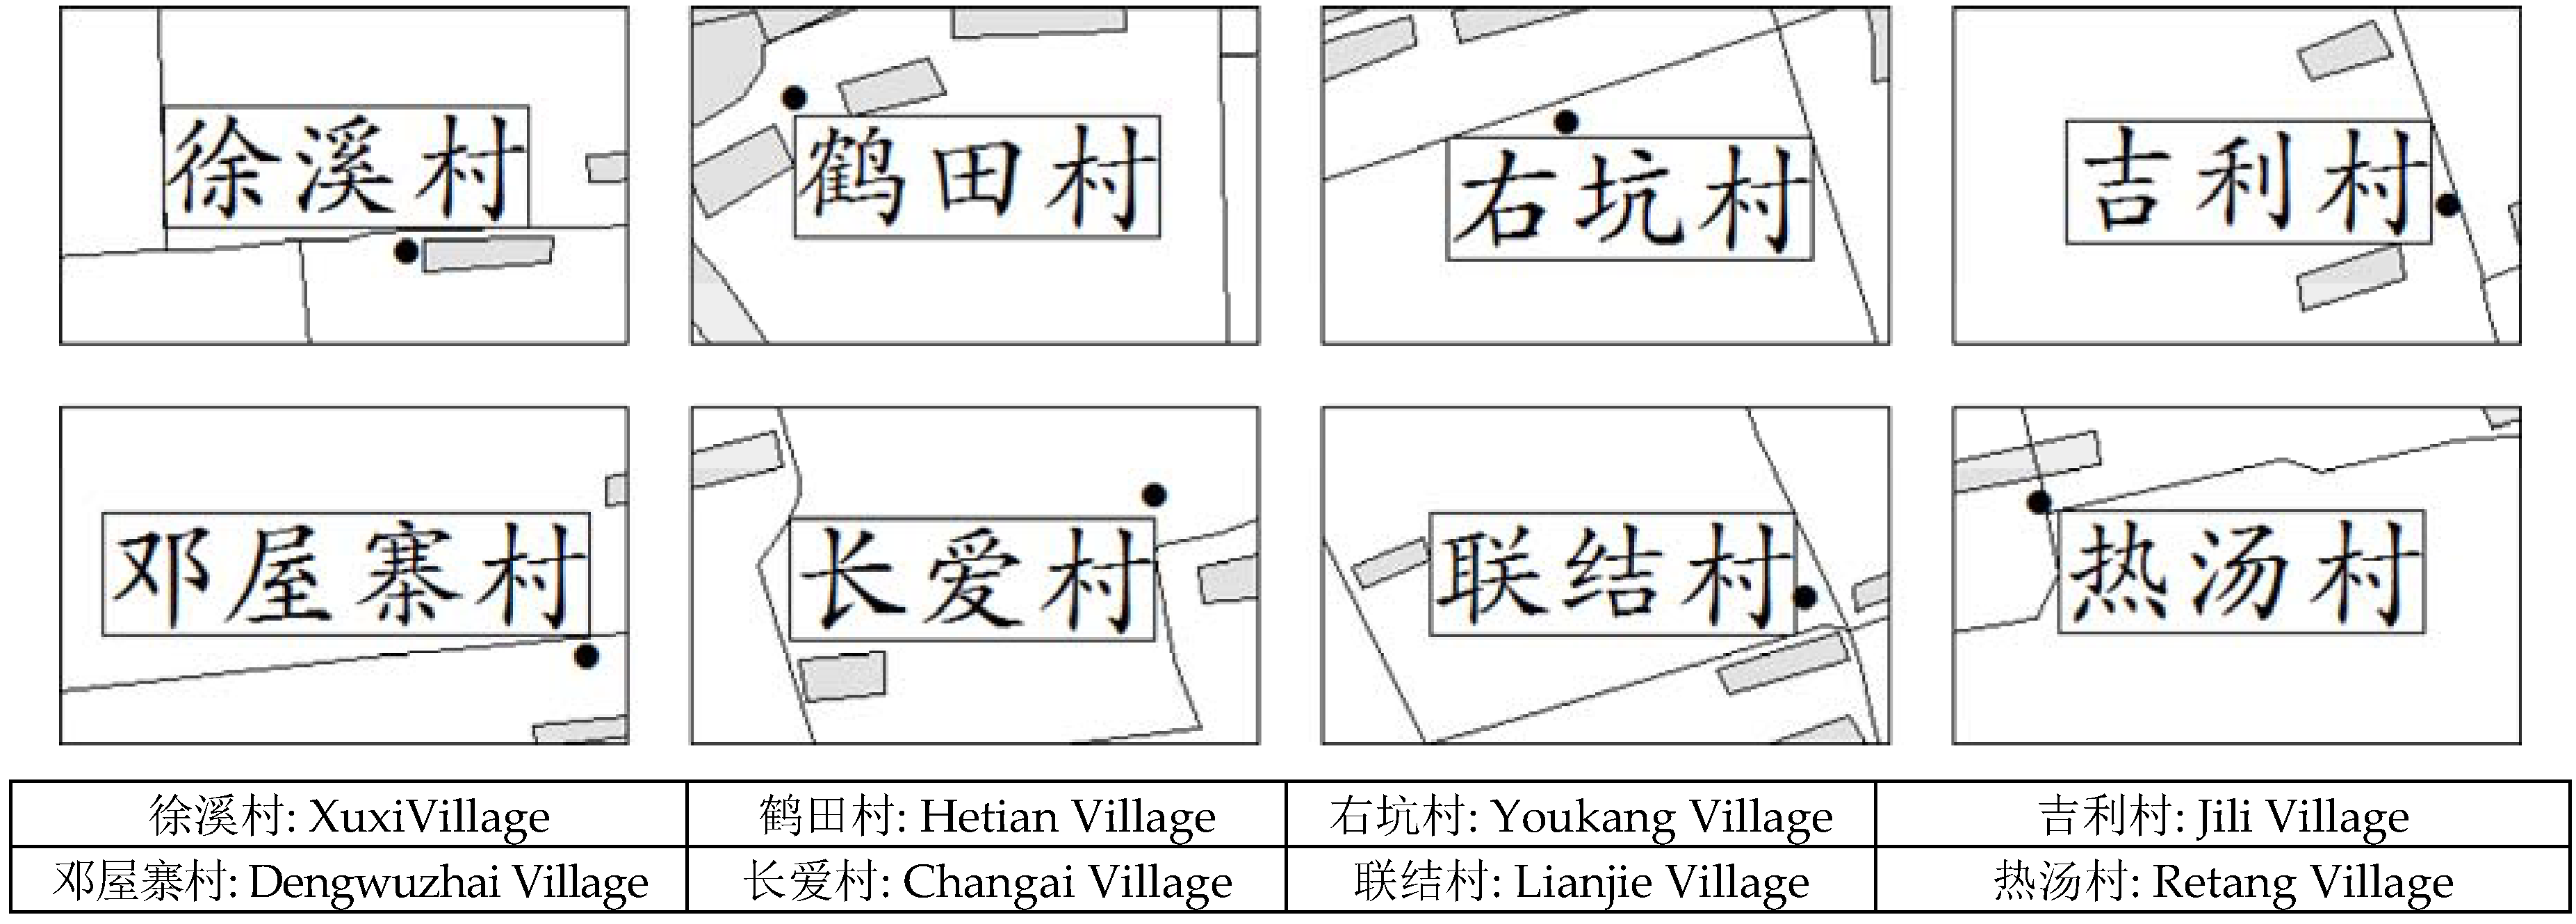
3.2. Labeling with Point, Line, and Area Features

The above labeling experiments assume that the point set to be labeled is free of context, thus no features other than the points and labels need to be shown. However, in practical map labeling, the crucial lines and areas are essential and should be conflict-free, too. Therefore, labeling a case with practical point, line, and area features is investigated. The dataset RoadResident is used for this experiment. It is formed of practical road lines, resident areas, and random generated points. The labeling results for this instance are presented in Figure 13. The conflicting labels are lighter in color and are marked by dotted rectangles, and the conflict-free labels are in Chinese and marked by the rectangles with solid lines.
On the premise of no conflict with points, lines, or areas, the four-position model and four-slider model get 209 and 290 conflict-free labels. And the proposed model achieves 351 conflict-free labels, which has 142 and 61 more labels than the former models. The corresponding detailed comparisons within the rectangular regions are depicted in Figure 14. As can be seen from this figure, the blank space of map is sufficiently utilized based on the region of movability, while for many points to be labeled, the candidates from the fixed-position model or the sliding tracks from the slider model are conflicting with the map context.
In addition, some representative labeling cases of the proposed model are illustrated in Figure 15, which are difficult to be managed by the fixed-position model and slider model, because the obtained labels are not at certain fixed positions or restricted to a sliding track line. Thus, based on the region of movability, a conflict-free label can be placed once there is a blank space in the surrounding zone of point feature.
Even with the region of movability-based model, there are still 207 labels conflicting because of the crowded obstacles. For most of these labels, there is not any space in the surrounding zone for labeling, therefore a conflict-free label position is impossible to be obtained. Some conflicting labeling cases with the proposed model are shown in Figure 16.

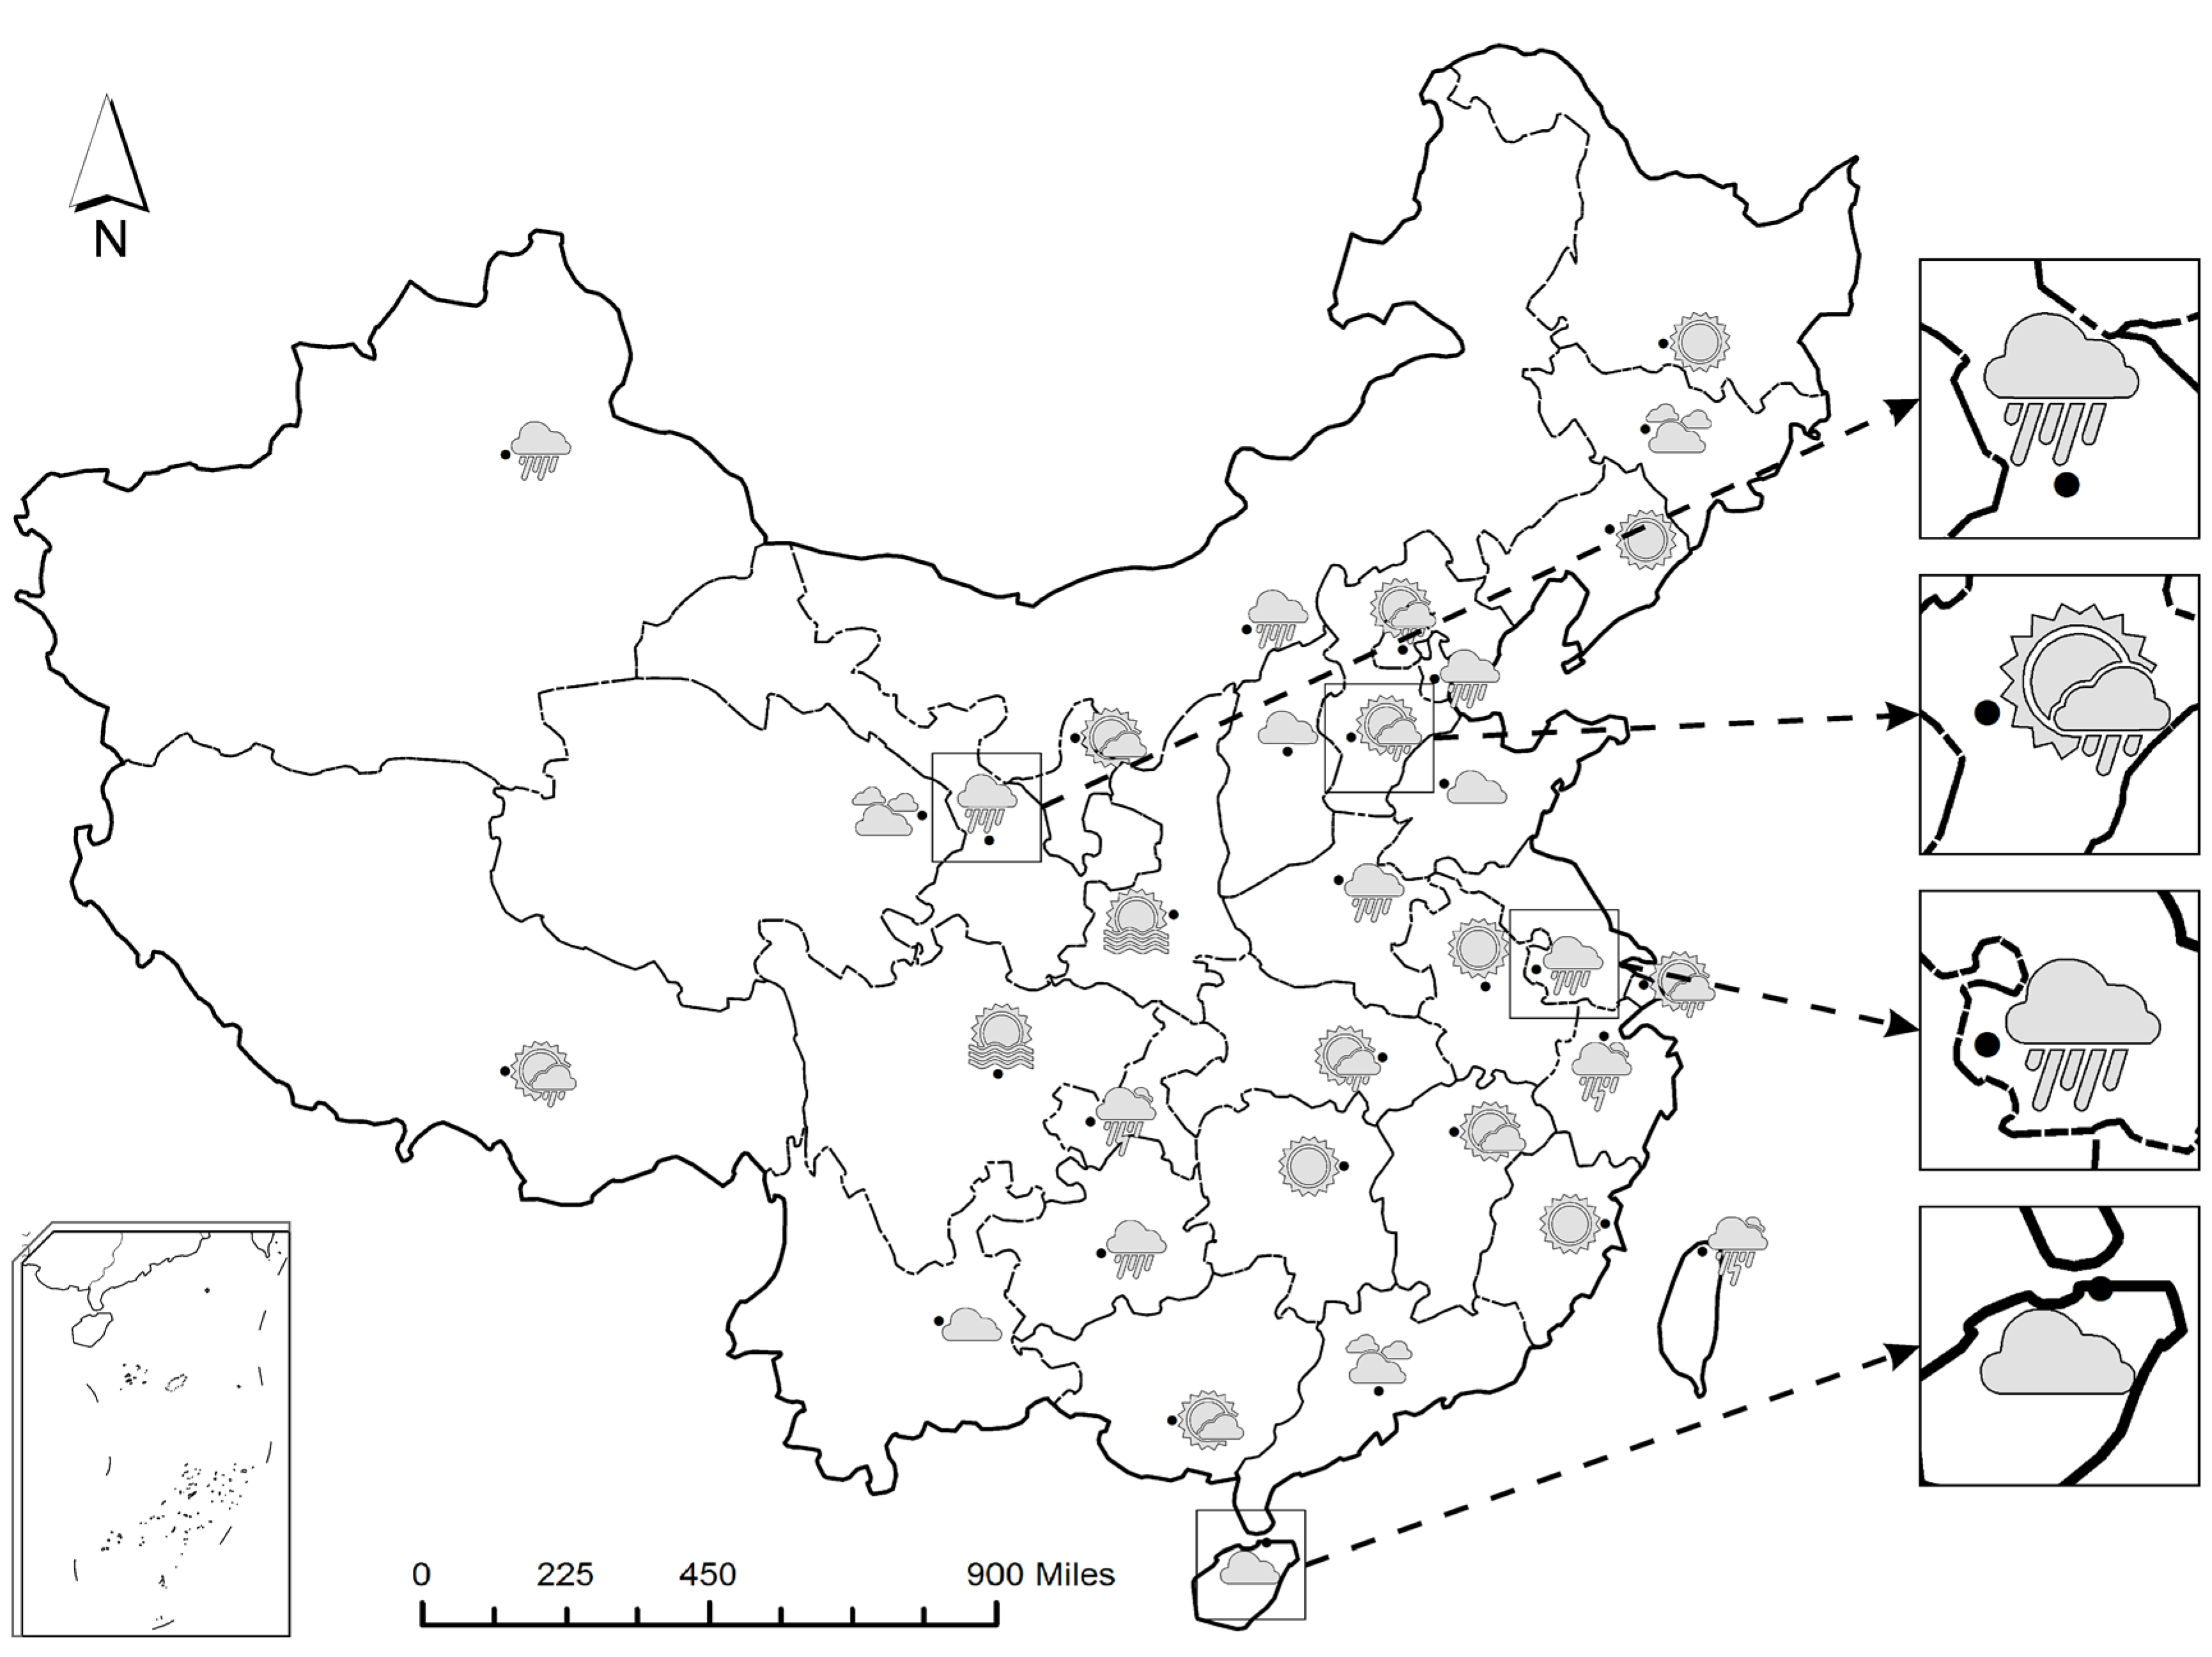
3.3. Placement of Arbitrarily Shaped Labels

So far, only rectangular shaped labeling has been discussed. The proposed model can be extended to place arbitrarily shaped labels. The WeatherMap instance is used in this labeling experiment, which shows the weather conditions of the provincial capitals in China. As seen from the labeling result in Figure 17, most of the arbitrarily shaped weather symbols are successfully assigned to points on the premise of being conflict-free with the map context features. Some of the labels in this figure cannot be easily handled with the fixed-position model or slider model.

4. Conclusions

The labeling model based on the region of movability provides a novel strategy for label placement. The model sufficiently utilizes the blank zone of the map and extends the search space, of which the candidate labels are at some fixed positions or sliding along a specified track. With this improvement, the labeling experiments demonstrate the good performance of the region of movability-based model. Especially when considering conflict-free with complicated context features, the proposed model successfully completes the placement of labels that are difficult to be dealt with in the fixed-position and slider models. Moreover, arbitrarily shaped labels can be handled under this strategy.
In this paper, only point-feature labeling is considered. Thus, an extension to line and area feature labeling may be conducted in further research. Even with the proposed model, the placement of conflict-free labels is sometimes impossible if the nearby labels or obstacle features are too crowded. Hence, a removal strategy for these labels without enough labeling space should be explored. The results provide several directions for future work.

Acknowledgments

This study is funded by the National Natural Science Fund of China (41271453), the Scientific and Technological Leading Talent Fund of National Administration of Surveying, mapping and geo-information (2014), and the Wuhan ‘Yellow Crane Excellence’ (Science and Technology) program (2014).

Author Contributions

This research was mainly performed and prepared by Lin Li and Hang Zhang. Lin Li and Hang Zhang contributed with ideas, conceived and designed the study. Haihong Zhu and Xi Kuai contributed to analyzing the experimental results. Wei Hu reviewed and edited the manuscript.

Conflicts of Interest

The authors declare no conflict of interest.

References

  1. Imhof, E. Positioning names on maps. Am. Cartogr. 1975, 2, 128–144. [Google Scholar] [CrossRef]
  2. Wagner, F.; Wolff, A. A combinatorial framework for map labeling. In Graph Drawing; Whitesides, S.H., Ed.; Springer: Berlin, Germany, 1998; pp. 316–331. [Google Scholar]
  3. Christensen, J.; Marks, J.; Shieber, S. An empirical study of algorithms for point-feature label placement. ACM Trans. Graph. 1995, 14, 203–232. [Google Scholar] [CrossRef]
  4. Iturriaga, C.; Lubiw, A. NP-Hardness of Some Map Labeling Problems; University of Waterloo: Waterloo, ON, Canada, 1997. [Google Scholar]
  5. Marks, J.; Shieber, S.M. The Computational Complexity of Cartographic Label Placement; Harvard University: Cambridge, MA, USA, 1991. [Google Scholar]
  6. Ribeiro, G.M.; Mauri, G.R.; Lorena, L.A.N. A lagrangean decomposition for the maximum independent set problem applied to map labeling. Oper. Res. 2011, 11, 229–243. [Google Scholar] [CrossRef]
  7. Gomes, S.P.; Ribeiro, G.M.; Lorena, L.A.N. Dispersion for the point-feature cartographic label placement problem. Expert Syst. Appl. 2013, 40, 5878–5883. [Google Scholar] [CrossRef]
  8. Rabello, R.L.; Mauri, G.R.; Ribeiro, G.M.; Lorena, L.A.N. A clustering search metaheuristic for the point-feature cartographic label placement problem. Eur. J. Oper. Res. 2014, 234, 802–808. [Google Scholar] [CrossRef]
  9. Schwartges, N.; Haunert, J.H.; Wolff, A.; Zwiebler, D. Point labeling with sliding labels in interactive maps. In Connecting a Digital Europe through Location and Place; Springer International Publishing: Cham, Switzerland, 2014; pp. 295–310. [Google Scholar]
  10. Do Nascimento, H.A.D.; Eades, P. User hints for map labeling. J. Vis. Lang. Comput. 2008, 19, 39–74. [Google Scholar] [CrossRef]
  11. Van Kreveld, M.; Strijk, T.; Wolff, A. Point labeling with sliding labels. Comput. Geom. Theory Appl. 1999, 13, 21–47. [Google Scholar] [CrossRef]
  12. Klau, G.W.; Mutzel, P. Optimal labeling of point features in rectangular labeling models. Math. Program. 2003, 94, 435–458. [Google Scholar] [CrossRef]
  13. Raidl, G.R. A genetic algorithm for labeling point features. In Proceedings of the International Conference on Imaging Science, Systems, and Technology, Las Vegas, NV, USA, July 1998; pp. 189–196.
  14. Yamamoto, M.; Camara, G.; Lorena, L.A.N. Tabu search heuristic for point-feature cartographic label placement. Geoinformatica 2002, 6, 77–90. [Google Scholar] [CrossRef]
  15. Cravo, G.L.; Ribeiro, G.M.; Nogueira Lorena, L.A. A greedy randomized adaptive search procedure for the point-feature cartographic label placement. Comput. Geosci. 2008, 34, 373–386. [Google Scholar] [CrossRef]
  16. Ribeiro, G.M.; Lorena, L.A.N. Lagrangean relaxation with clusters for point-feature cartographic label placement problems. Comput. Oper. Res. 2008, 35, 2129–2140. [Google Scholar] [CrossRef]
  17. Mauri, G.R.; Ribeiro, G.M.; Lorena, L.A.N. A new mathematical model and a lagrangean decomposition for the point-feature cartographic label placement problem. Comput. Oper. Res. 2010, 37, 2164–2172. [Google Scholar] [CrossRef]
  18. Alvim, A.C.F.; Taillard, E.D. Popmusic for the point feature label placement problem. Eur. J. Oper. Res. 2009, 192, 396–413. [Google Scholar] [CrossRef]
  19. Wagner, F.; Wolff, A.; Kapoor, V.; Strijk, T. Three rules suffice for good label placement. Algorithmica 2001, 30, 334–349. [Google Scholar] [CrossRef]
  20. Luboschik, M.; Schumann, H.; Cords, H. Particle-based labeling: Fast point-feature labeling without obscuring other visual features. IEEE Trans. Vis. Comput. Graph. 2008, 14, 1237–1244. [Google Scholar] [CrossRef] [PubMed]
  21. Kameda, T.; Imai, K. Map label placement for points and curves. IEICE Trans. Fundam. Electron. Commun. Comput. Sci. 2003, E86A, 835–840. [Google Scholar]
  22. Ebner, D.; Klau, G.W.; Weiskircher, R. Label number maximization in the slider model (extended abstract). In Graph Drawing; Springer: New York, NY, USA, 2004; pp. 144–154. [Google Scholar]
  23. Hirsch, S.A. An algorithm for automatic name placement around point data. Am. Cartogr. 1982, 9, 5–17. [Google Scholar] [CrossRef]
  24. Doddi, S.; Marathe, M.V.; Mirzaian, A.; Moret, B.M.; Zhou, B. Map labeling and its generalizations. In Proceedings of the 8th Annual ACM-SIAM Symposium on Discrete Algorithms (SODA’97), New Orleans, LA, USA, 13–23 December 1997; pp. 148–157.
  25. Strijk, T.; van Kreveld, M. Practical extensions of point labeling in the slider model. Geoinformatica 2002, 6, 181–197. [Google Scholar] [CrossRef]
  26. Poon, S.H.; Shin, C.S.; Strijk, T.; Uno, T.; Wolff, A. Labeling points with weights. Algorithmica 2004, 38, 341–362. [Google Scholar] [CrossRef]
  27. Yoeli, P. The logic of automated map lettering. Cartogr. J. 1972, 9, 99–108. [Google Scholar] [CrossRef]
  28. Rylov, M.A.; Reimer, A.W. Improving label placement quality by considering basemap detail with a raster-based approach. GeoInformatica 2014, 19, 463–486. [Google Scholar] [CrossRef]
  29. Sack, J.-R.; Toussaint, G.T. Translating polygons in the plane. In Stacs 85: 2nd Annual Symposium on Theoretical Aspects of Computer Science Saarbrücken, January 3–5, 1985; Mehlhorn, K., Ed.; Springer: Berlin, Germany, 1985; pp. 310–321. [Google Scholar]
  30. Lin, M.; Gottschalk, S. Collision detection between geometric models: A survey. In Proceedings of the IMA Conference on Mathematics of Surfaces, Birmingham, UK, 31 August–2 September 1998; pp. 602–608.
  31. Kockara, S.; Halic, T.; Iqbal, K.; Bayrak, C.; Rowe, R. Collision detection: A survey. In Proceedings of the IEEE International Conference on Systems, Man and Cybernetics, Montreal, QC, Canada, 7–10 October 2007; pp. 4046–4051.
  32. Sack, J.-R.; Toussaint, G.T. Separability of pairs of polygons through single translations. Robotica 1987, 5, 55–63. [Google Scholar] [CrossRef]
  33. Ghosh, P.K. A solution of polygon containment, spatial planning, and other related problems using minkowski operations. Comput. Vis. Graph. Image Process. 1990, 49, 1–35. [Google Scholar] [CrossRef]
  34. Ghosh, P.K. An algebra of polygons through the notion of negative shapes. CVGIP Image Underst. 1991, 54, 119–144. [Google Scholar] [CrossRef]
  35. Edmondson, S.; Christensen, J.; Marks, J.; Shieber, S.M. A general cartographic labeling algorithm. Cartogr. Int. J. Geogr. Inf. Geovis. 1996, 33, 13–24. [Google Scholar]
  36. Zhang, Q.; Harrie, L. Placing text and icon labels simultaneously: A real-time method. Cartogr. Geogr. Inf. Sci. 2006, 33, 53–64. [Google Scholar] [CrossRef]
  37. Zoraster, S. Practical results using simulated annealing for point feature label placement. Cartogr. Geogr. Inf. Syst. 1997, 24, 228–238. [Google Scholar] [CrossRef]
  38. Kapoor, V.; Kühl, D.; Wolff, A. A tutorial for designing flexible geometric algorithms. Algorithmica 2002, 33, 52–70. [Google Scholar] [CrossRef]
  39. Wolff, A. General Map Labeling. Available online: http://i11www.iti.uni-karlsruhe.de/~awolff/map-labeling/general/ (accessed on 27 August 2016).
Figure 1. (a) Four-position model; (b) 5–8 positions of the eight-position model; (c) four-slider model.
Ijgi 05 00159 g001
Figure 2. Region of movability for polygon P with point Q as the background feature.
Ijgi 05 00159 g002
Figure 3. Region of movability for polygon P with line Q as the background feature.
Ijgi 05 00159 g003
Figure 4. Schematic diagram of the Minkowski addition of polygons.
Ijgi 05 00159 g004
Figure 5. The search spaces schematic diagram of the three labeling models. (a) Fixed-position model with eight candidates; (b) four-slider model; (c) the proposed model.
Ijgi 05 00159 g005
Figure 6. The flow diagram of the candidate label region generation. (a) Point feature, label textbox, and search space; (b) a label placement case; (c) the generated region of immovability; (d) the conflict-free labeling space.
Ijgi 05 00159 g006
Figure 7. Schematic diagram of selecting the candidate label positions. (a) Reference points for distance computation; (b) generated candidate label position for reference point M.
Ijgi 05 00159 g007
Figure 8. Schematic diagram of the generated candidate label positions. (a) Four reference points; (b) the generated candidate label positions without obstacle; (c) the generated candidate label positions with line and area obstacles.
Ijgi 05 00159 g008
Figure 9. The extension from the label preference rank in the fixed-position model.
Ijgi 05 00159 g009
Figure 10. Labeling result for the RandomRect instance with 500 points. (a) Four-position model: 339 conflict-free labels; (b) four-slider model: 380 conflict-free labels; (c) the proposed model: 450 conflict-free labels.
Ijgi 05 00159 g010
Figure 11. Labeling result for the RandomMap instance with 500 points. (a) Four-position model: 224 conflict-free labels; (b) four-slider model: 205 conflict-free labels; (c) the proposed model: 358 conflict-free labels.
Ijgi 05 00159 g011
Figure 12. Labeling result for the VariableDensity instance with 1000 points. (a) Four-position model: 833 conflict-free labels; (b) four-slider model: 925 conflict-free labels; (c) the proposed model: 960 conflict-free labels.
Ijgi 05 00159 g012aIjgi 05 00159 g012b
Figure 13. Labeling result for the RoadResident instance with 558 points. And the Chinese words are the geographic names to be labeled with no conflict. (a) Four-position model: 209 conflict-free labels; (b) four-slider model: 290 conflict-free labels; (c) the proposed model: 351 conflict-free labels.
Ijgi 05 00159 g013
Figure 14. Detailed comparisons within the rectangular regions for the RoadResident instance. The Chinese words are the geographic names to be labeled with no conflict. (a) Four-position model; (b) four-slider model; (c) the proposed model.
Ijgi 05 00159 g014
Figure 15. Representative labeling cases for the RoadResident instance. And the Chinese words are the geographic names to be labeled with no conflict.
Ijgi 05 00159 g015
Figure 16. Conflicting labeling cases for the RoadResident instance.
Ijgi 05 00159 g016
Figure 17. The labeling of weather condition symbols for the provincial capitals in China. And some representative labeling cases are presented.
Ijgi 05 00159 g017
Table 1. Regions of “immovability” for the basic point, line, and area features.
TypeTextboxPointLineArea
Figure Ijgi 05 00159 i001 Ijgi 05 00159 i002 Ijgi 05 00159 i003 Ijgi 05 00159 i004
Table 2. Parameter values for the labeling experiments.
ParameterDefinitionValue
ToInitial temperature for simulated annealing20
TcThreshold temperature for simulated annealing0.01
ATemperature cooling rate for simulated annealing0.975
MReposition times for each annealing stage20 × N
KMaximum accepted times for an immediately annealing5 × N
Table 3. Information of the instances for labeling experiments.
InstanceLabeling TypeMap FeatureNumber of Points
RandomRectLabeling with pointPoint500
RandomMap500
VariableDensity1000
RoadResidentLabeling with point, line, and areaPoint, line, area558
WeatherMapPlacement of arbitrarily shaped labelsPoint, line, area32
Table 4. The labeling results and running time for the three models.
InstanceFour-Position ModelFour-Slider ModelThe Proposed Model
LabelsTime(s)LabelsTimes(s)LabelsTimes(s)
RandomRect3399.223805.2845017.35
RandomMap22411.932054.8135821.39
VariableDensity83316.919258.5596030.66

