Evaluating the Evacuation and Rescue Capabilities of Urban Open Space from a Land Use Perspective: A Case Study in Wuhan, China


Abstract
:1. Introduction
2. Materials
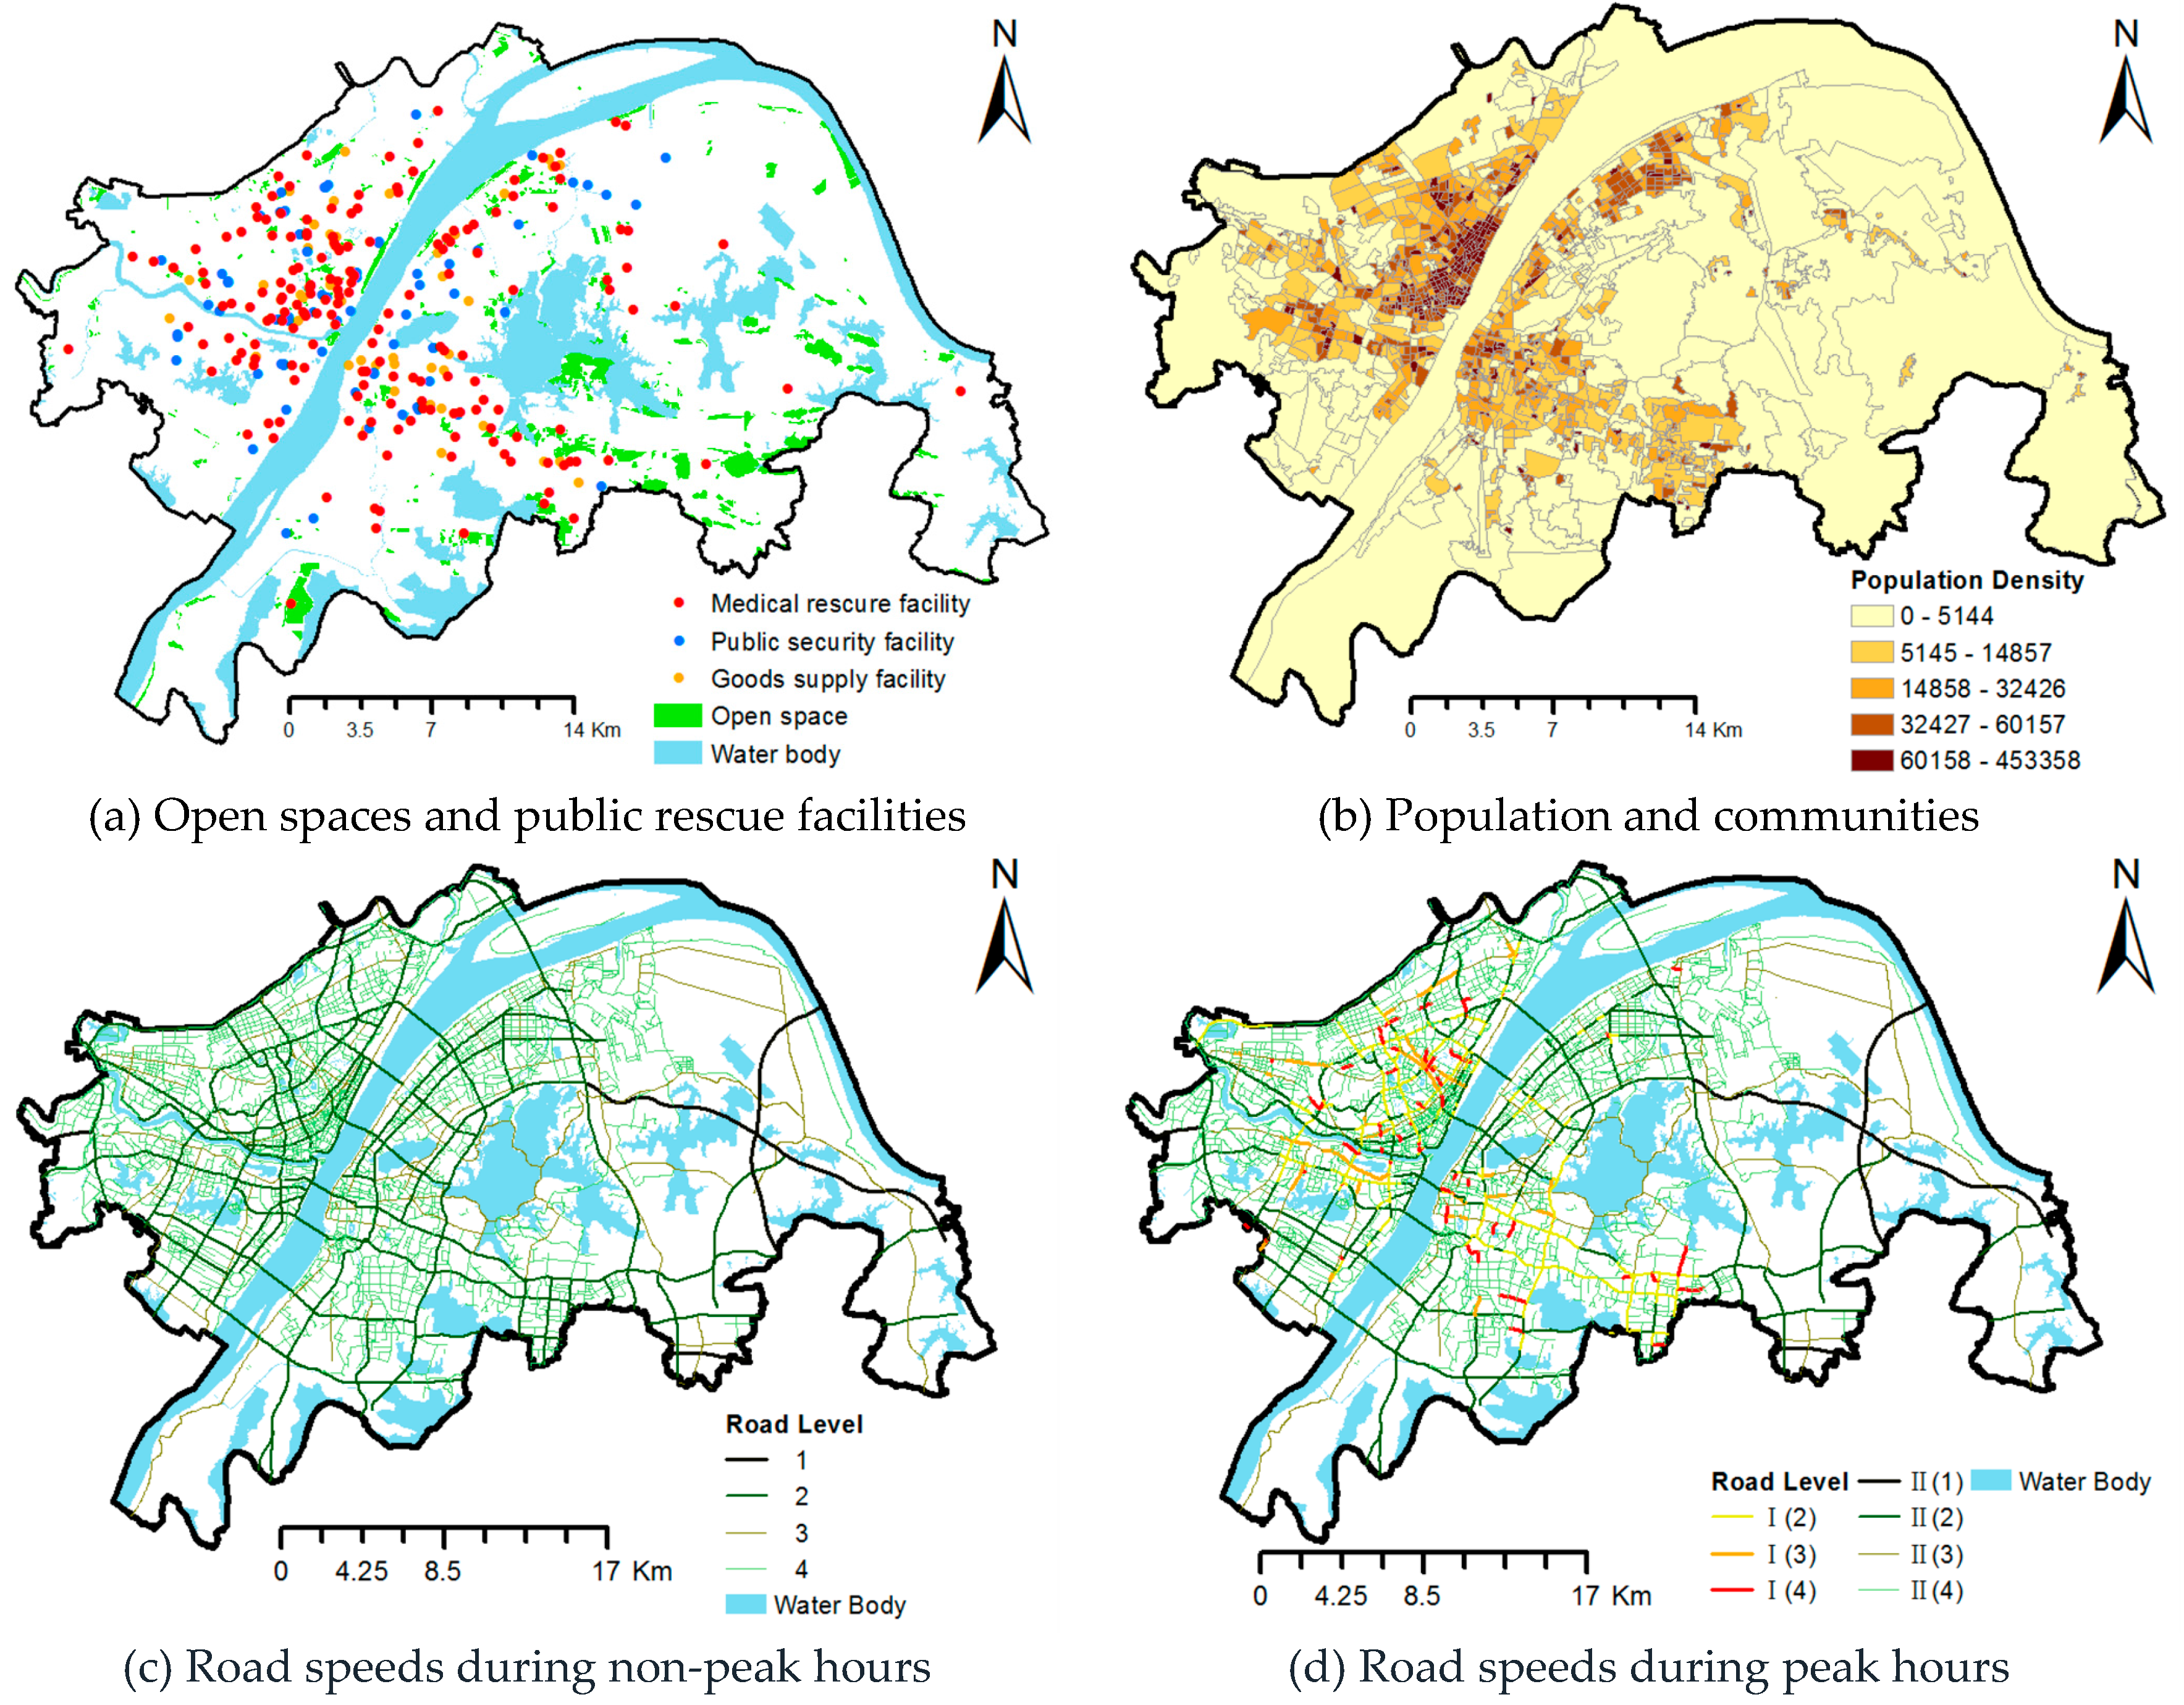
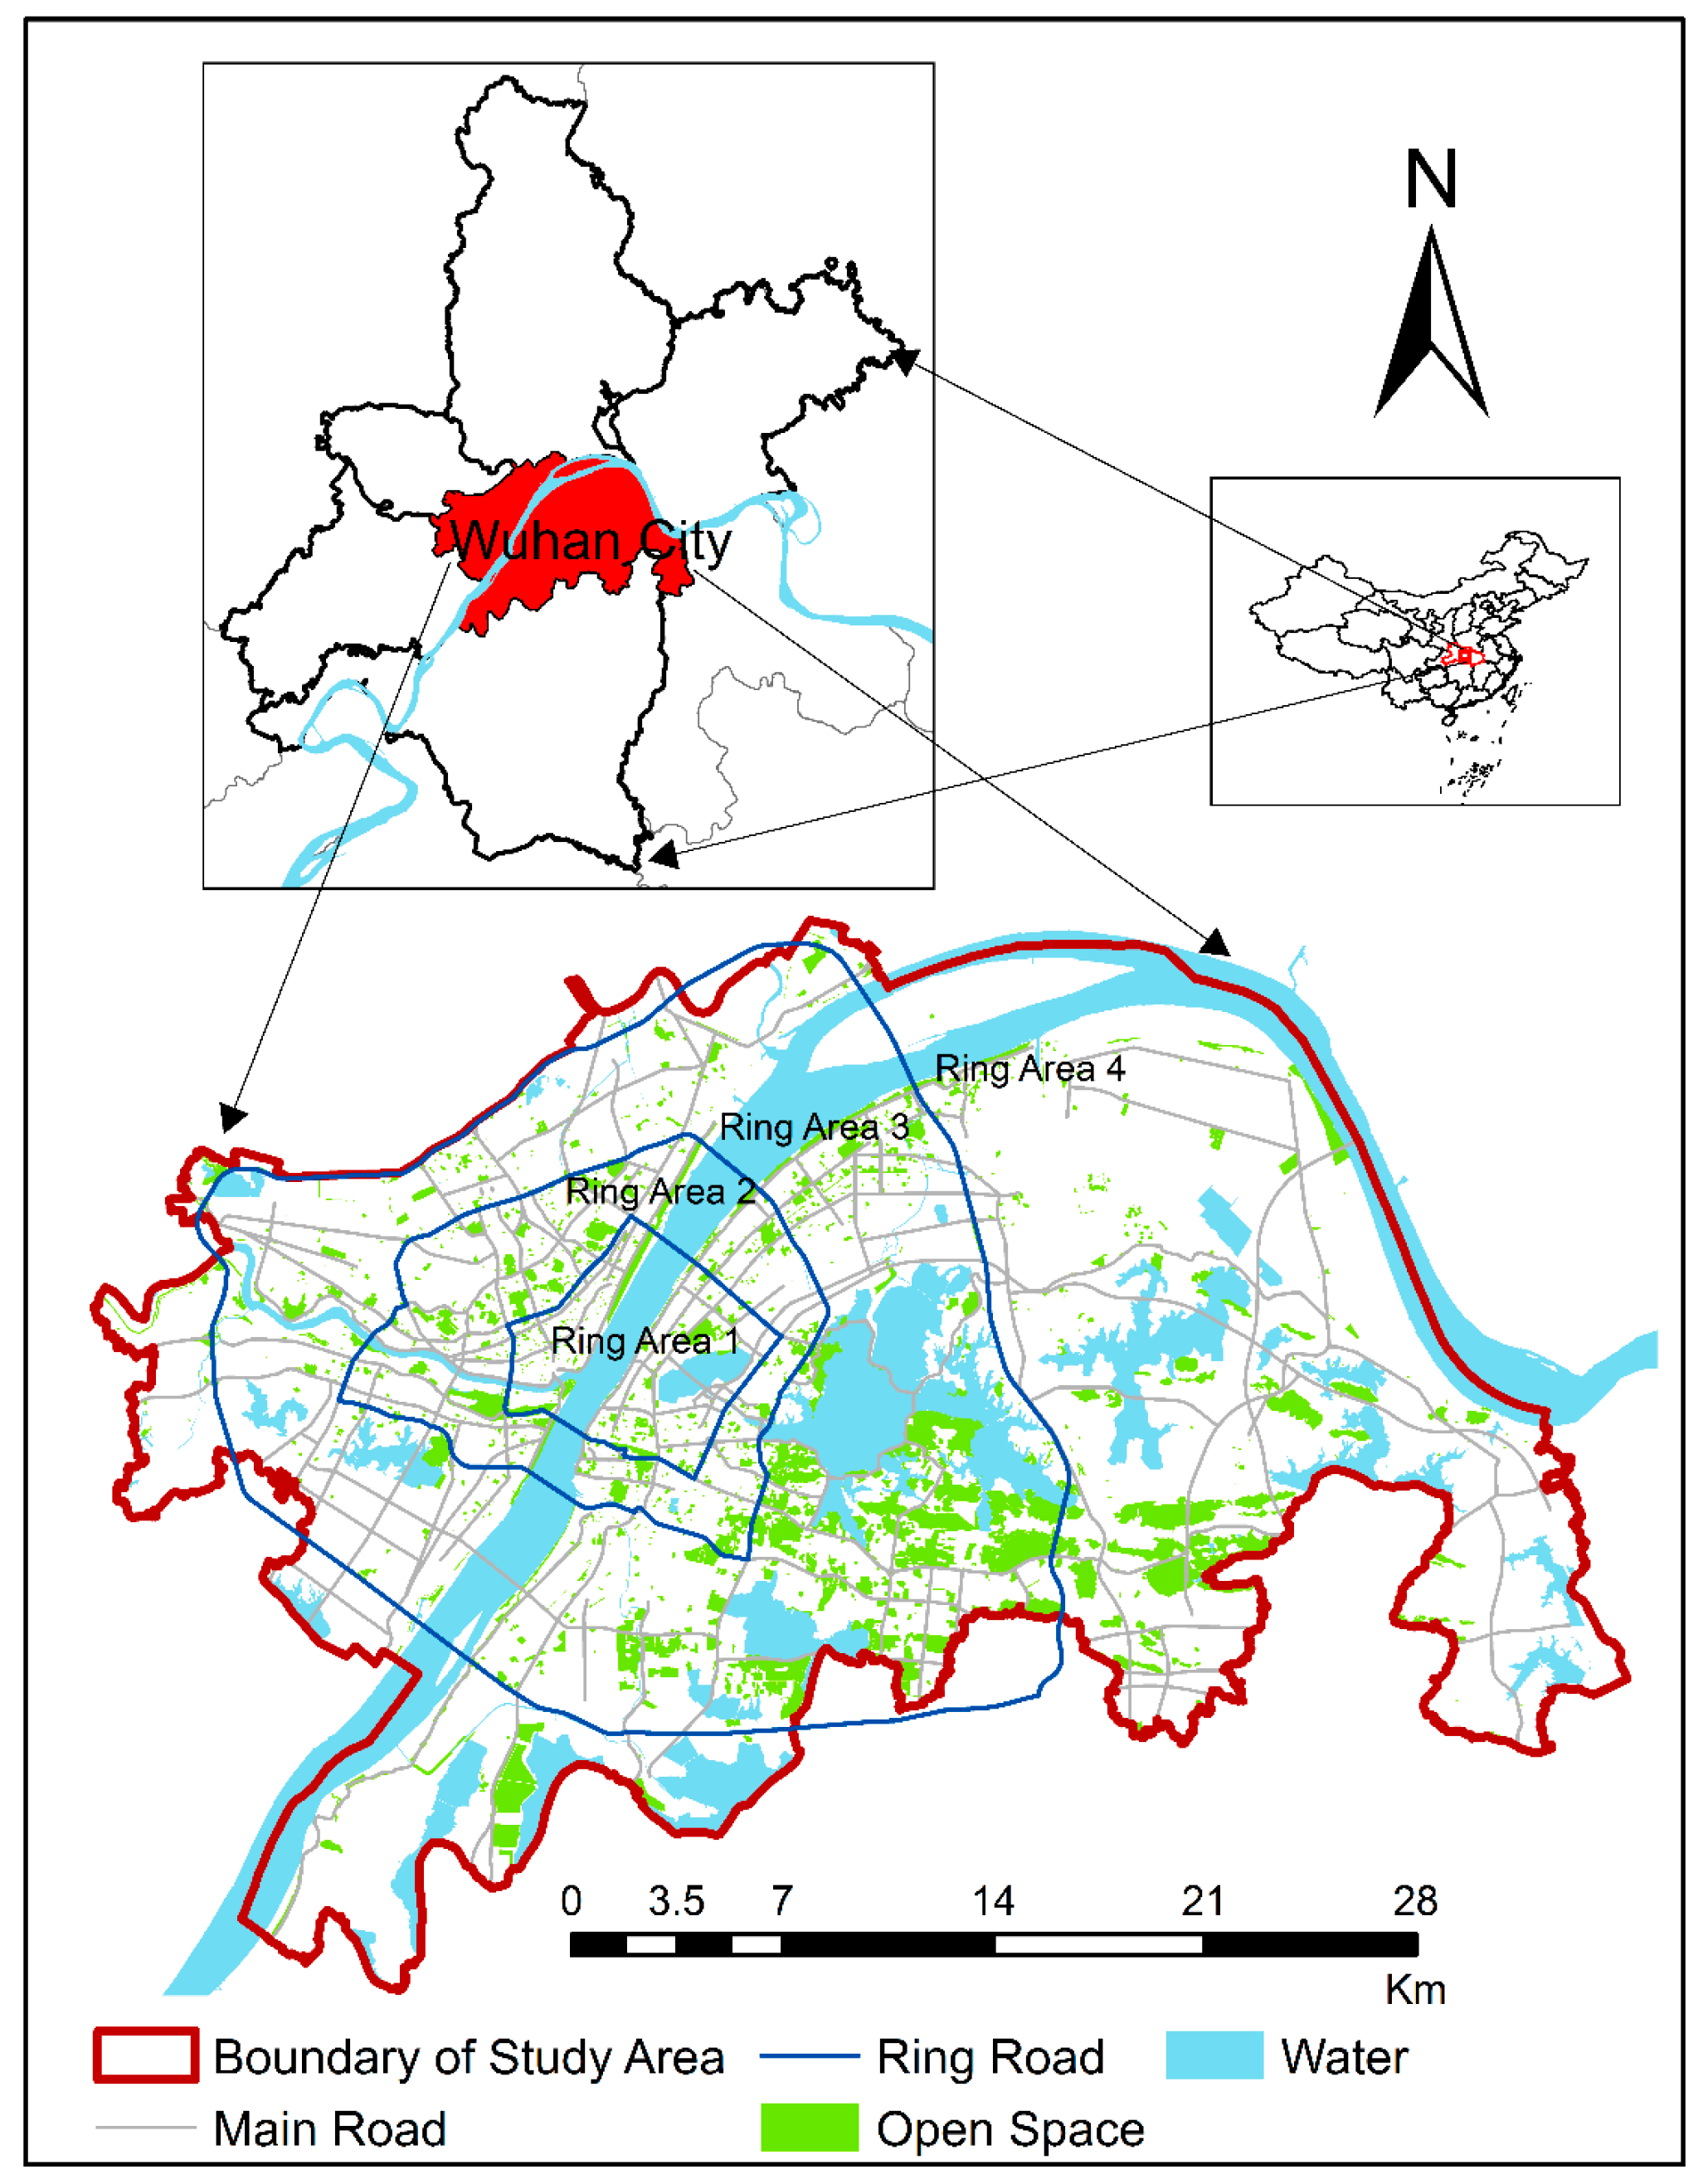
2.1. Study Area
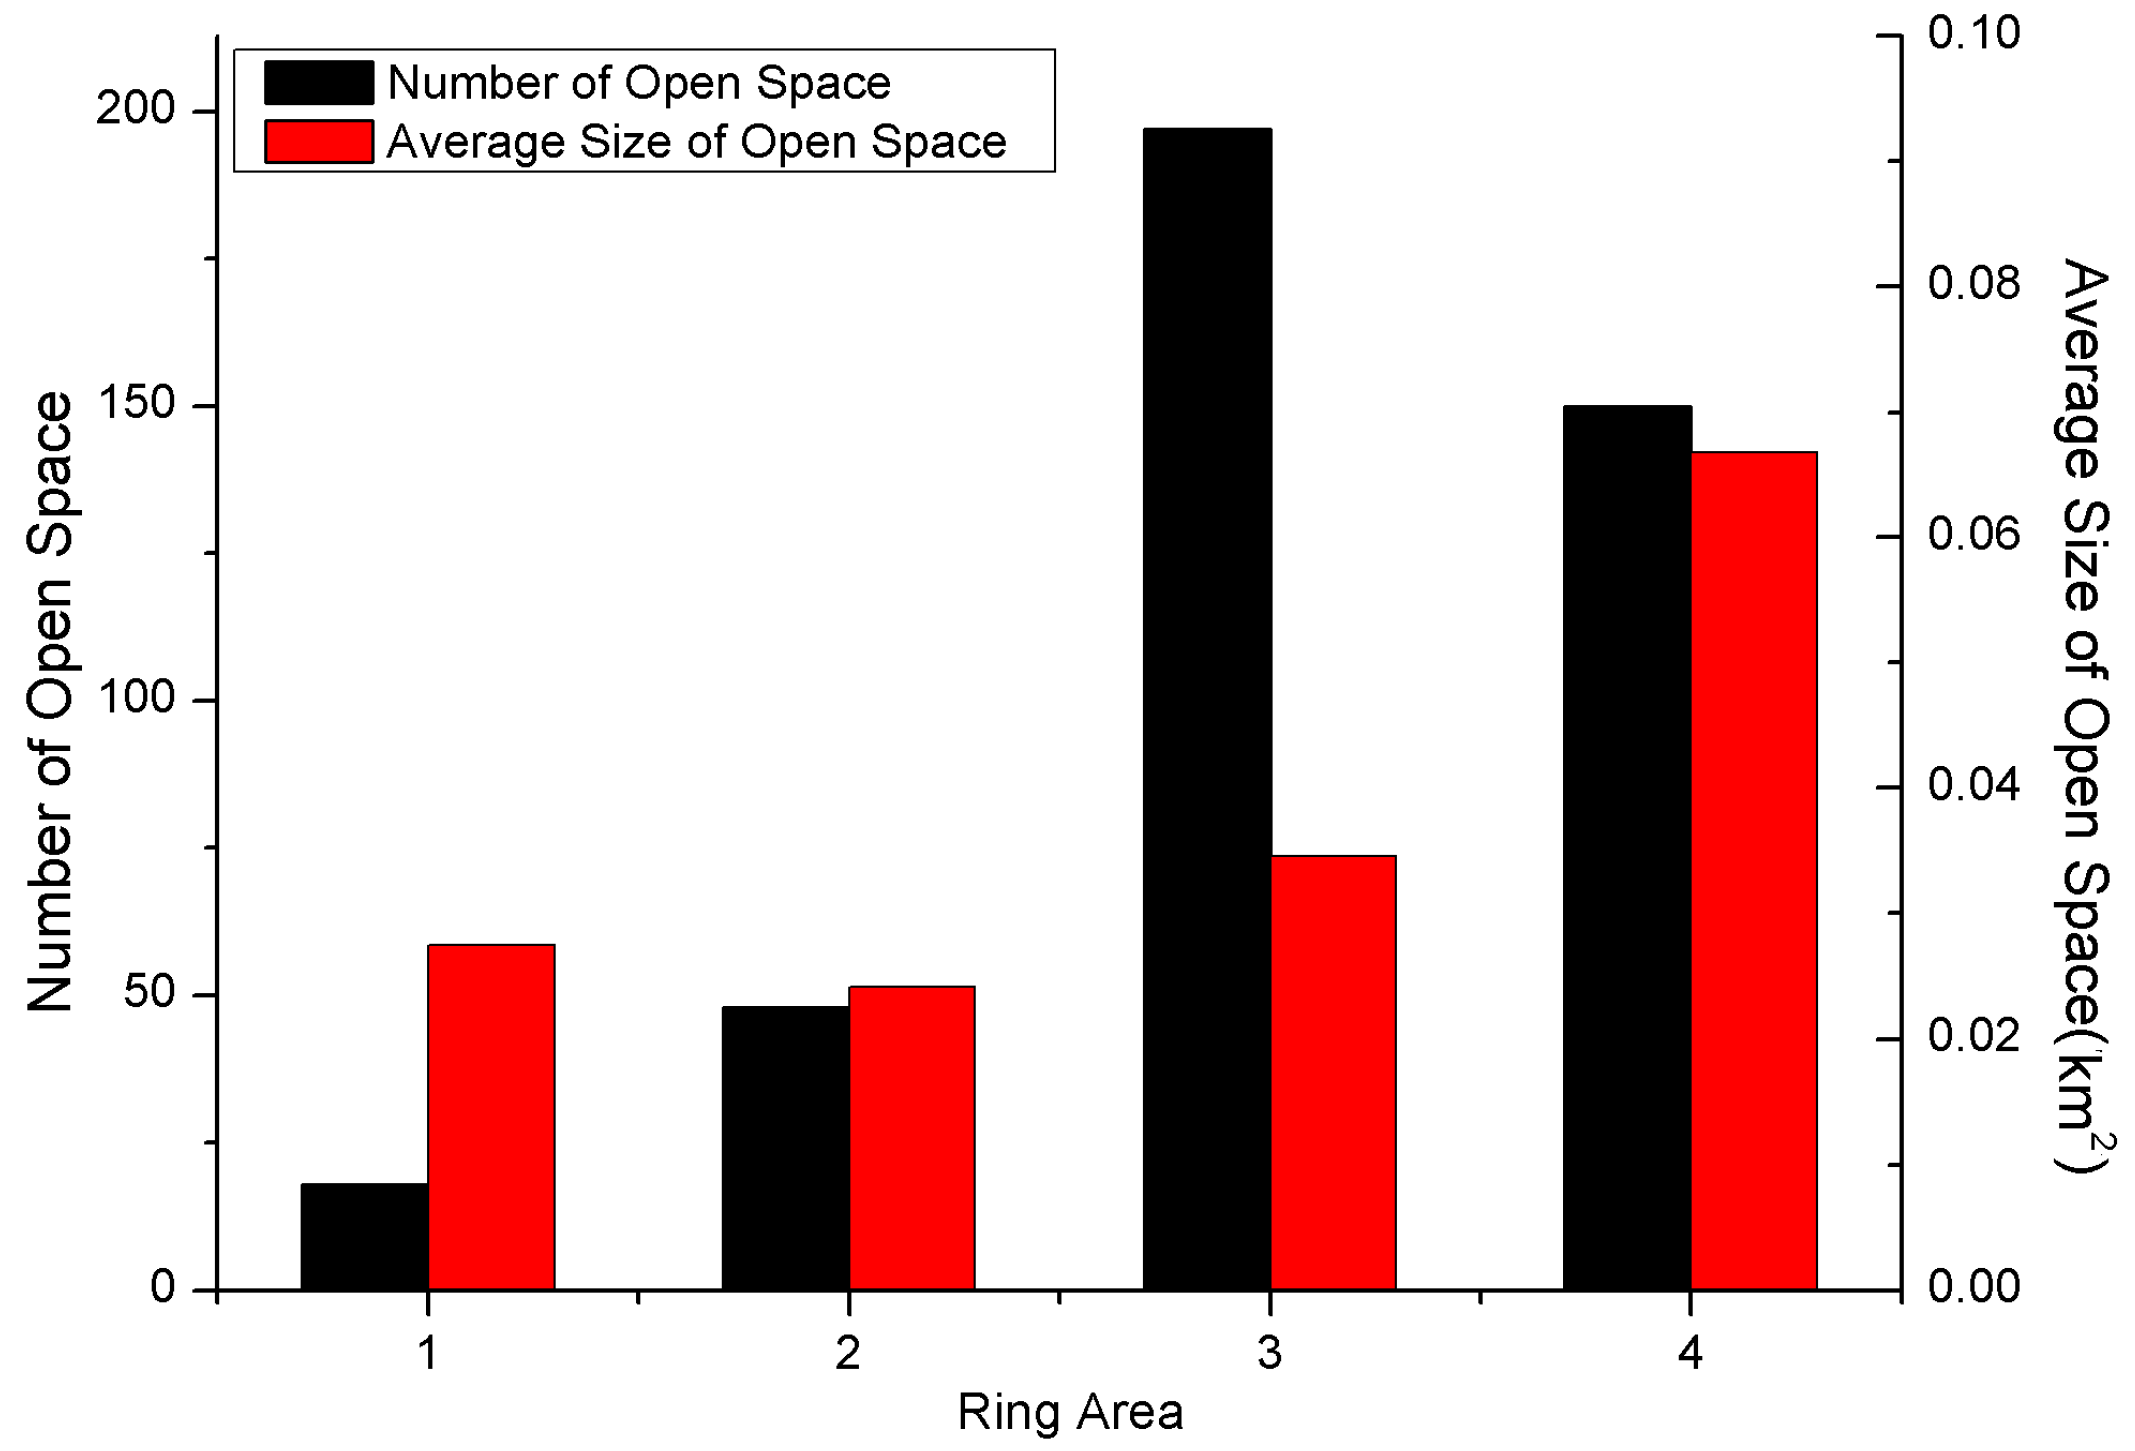
2.2. Data
- The total area of the open space should be larger than 1 km2.
- The effective area of the open space, that is, the area of the open space that excludes the land covered by buildings and large plants or other unsuitable areas for evacuees to live in and that is determined via field survey, should be larger than 2000 m2.
- The open space should not be a flood-prone area.
- The open space should not be in urban geological disaster areas.
- The internal slope of the open space should not be greater than 7°.
- The open space should have at least one road of more than 12 m in length.
- The shortest distance between open spaces and surrounding high-rise buildings should not be less than the buildings’ height(s).
- Refueling stations, gas facilities, and hazardous chemical enterprises should not be located within a 1 km range of the alternative plot.
3. Methods
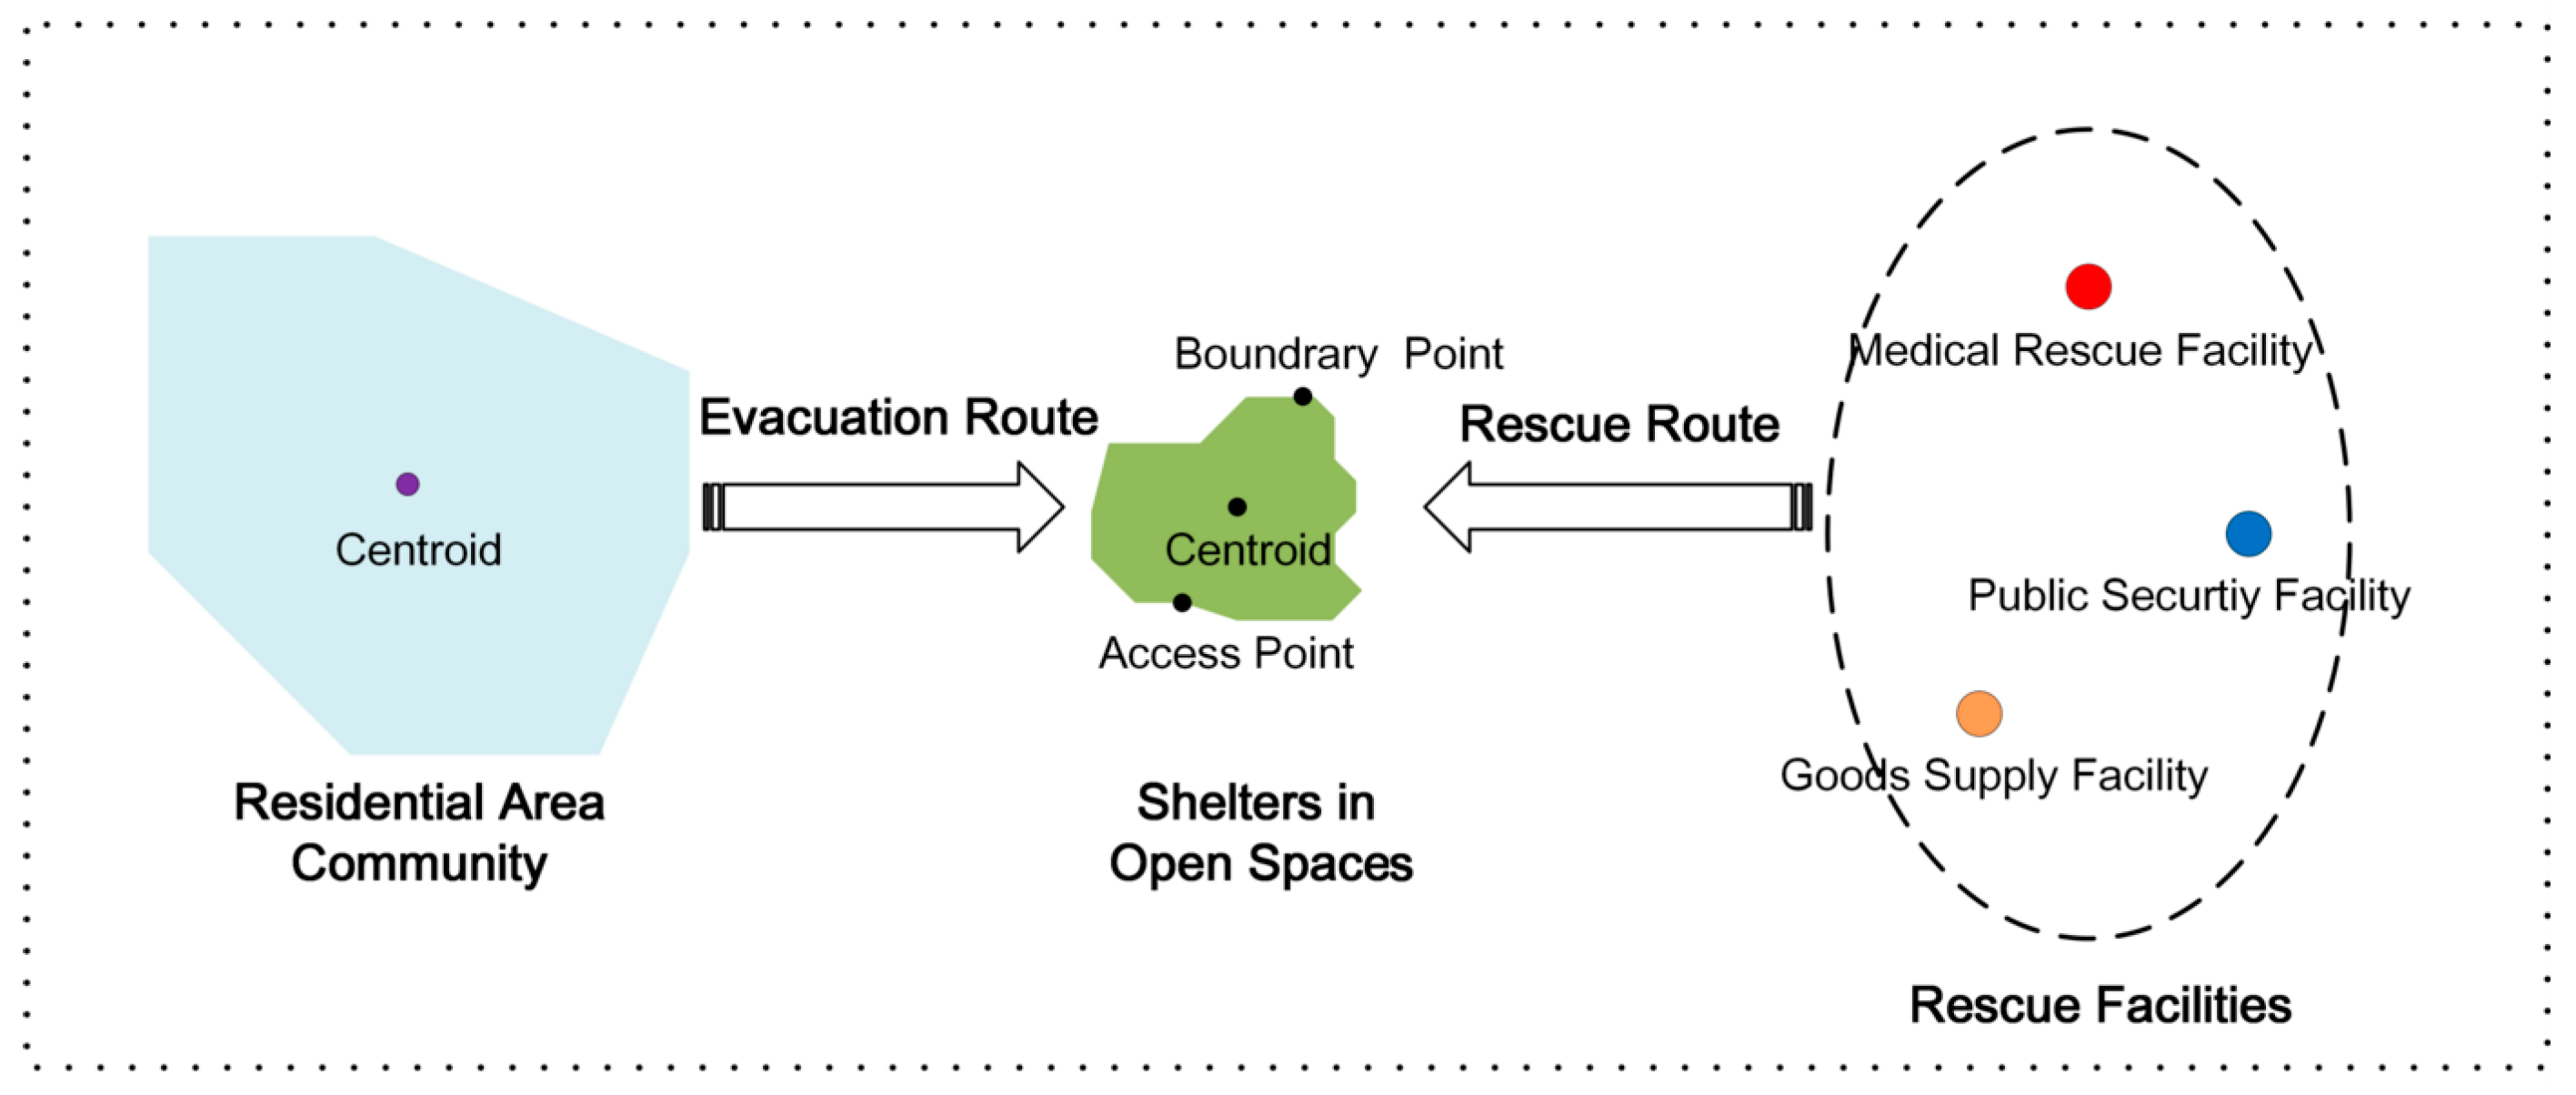
3.1. Dual-Scenario Network Analysis Model
3.2. Gravity Model Based on Evacuation and Rescue Flow Distribution
3.2.1. Formula of the Gravity Model
3.2.2. Evaluation Formula for Evacuation Traffic Flow
3.2.3. Evaluation Flow for Rescue Traffic Flow
3.2.4. SDI
4. Results
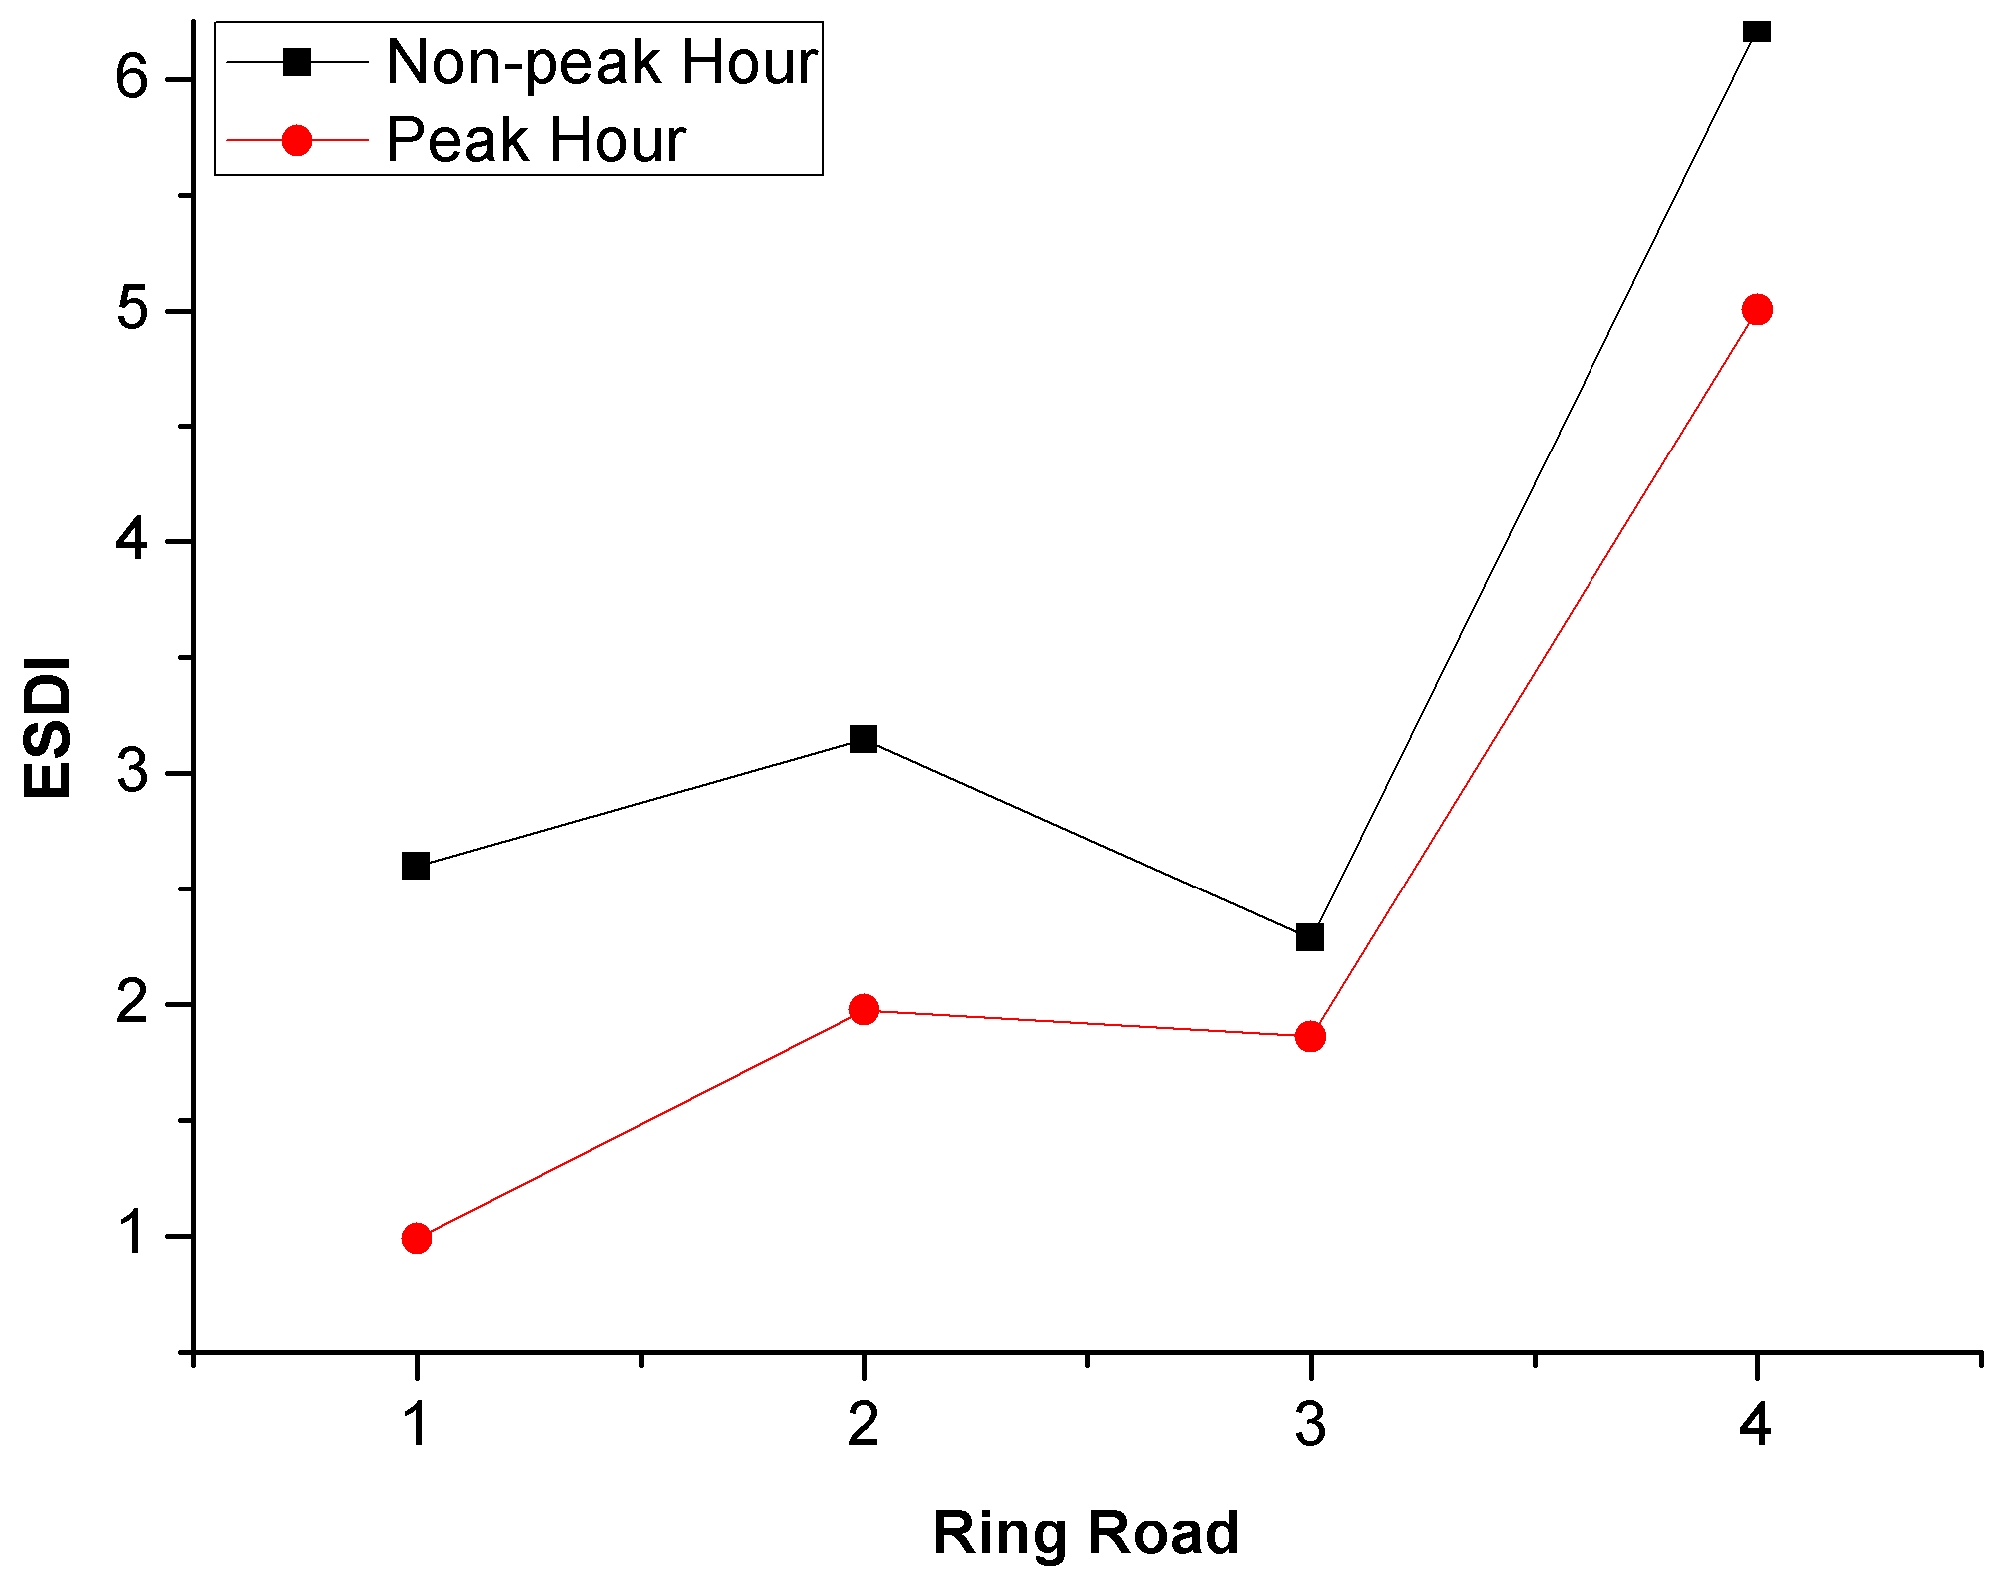
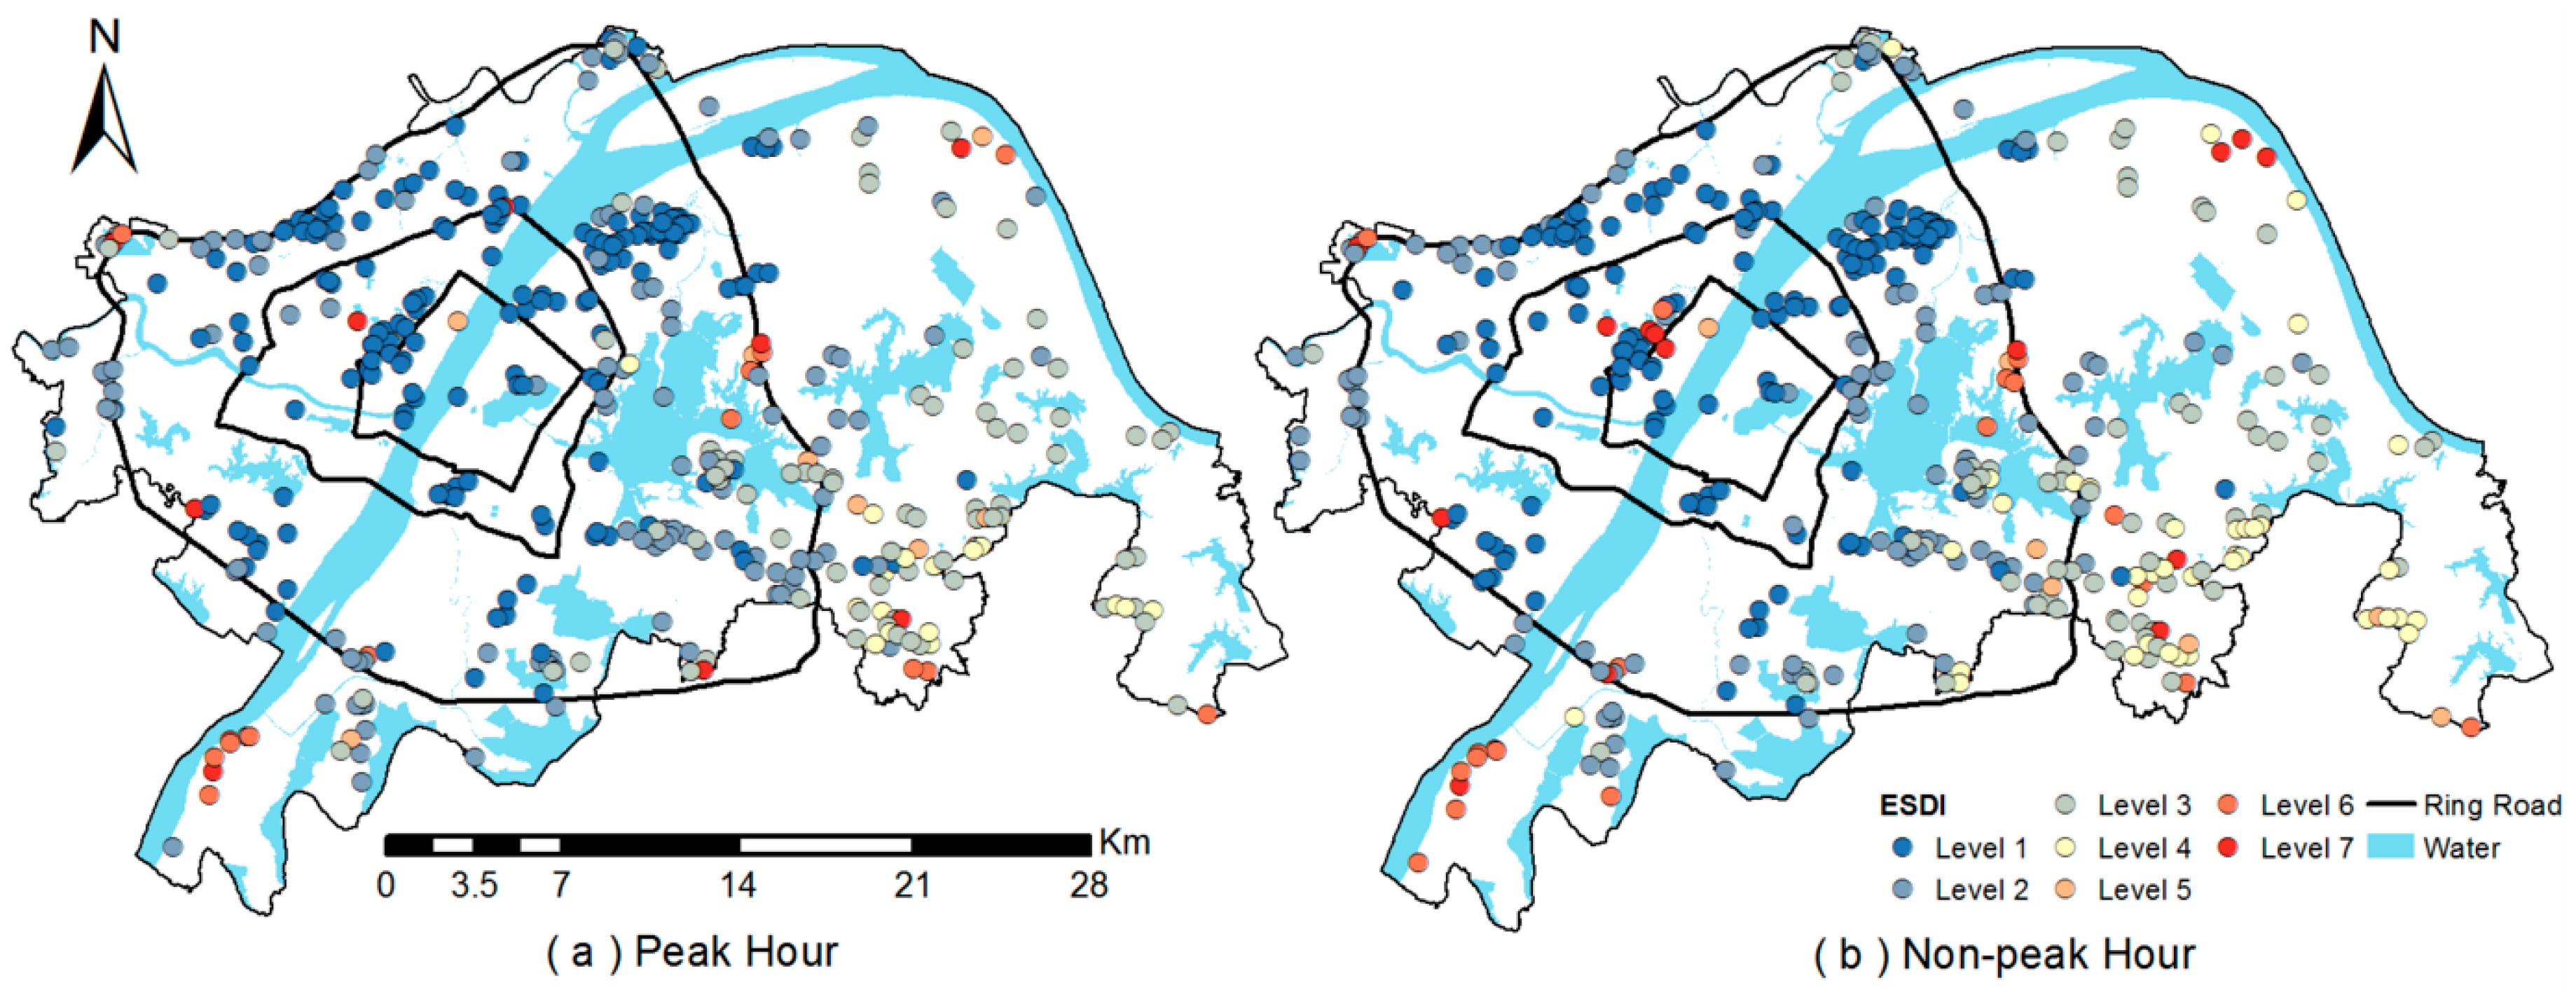
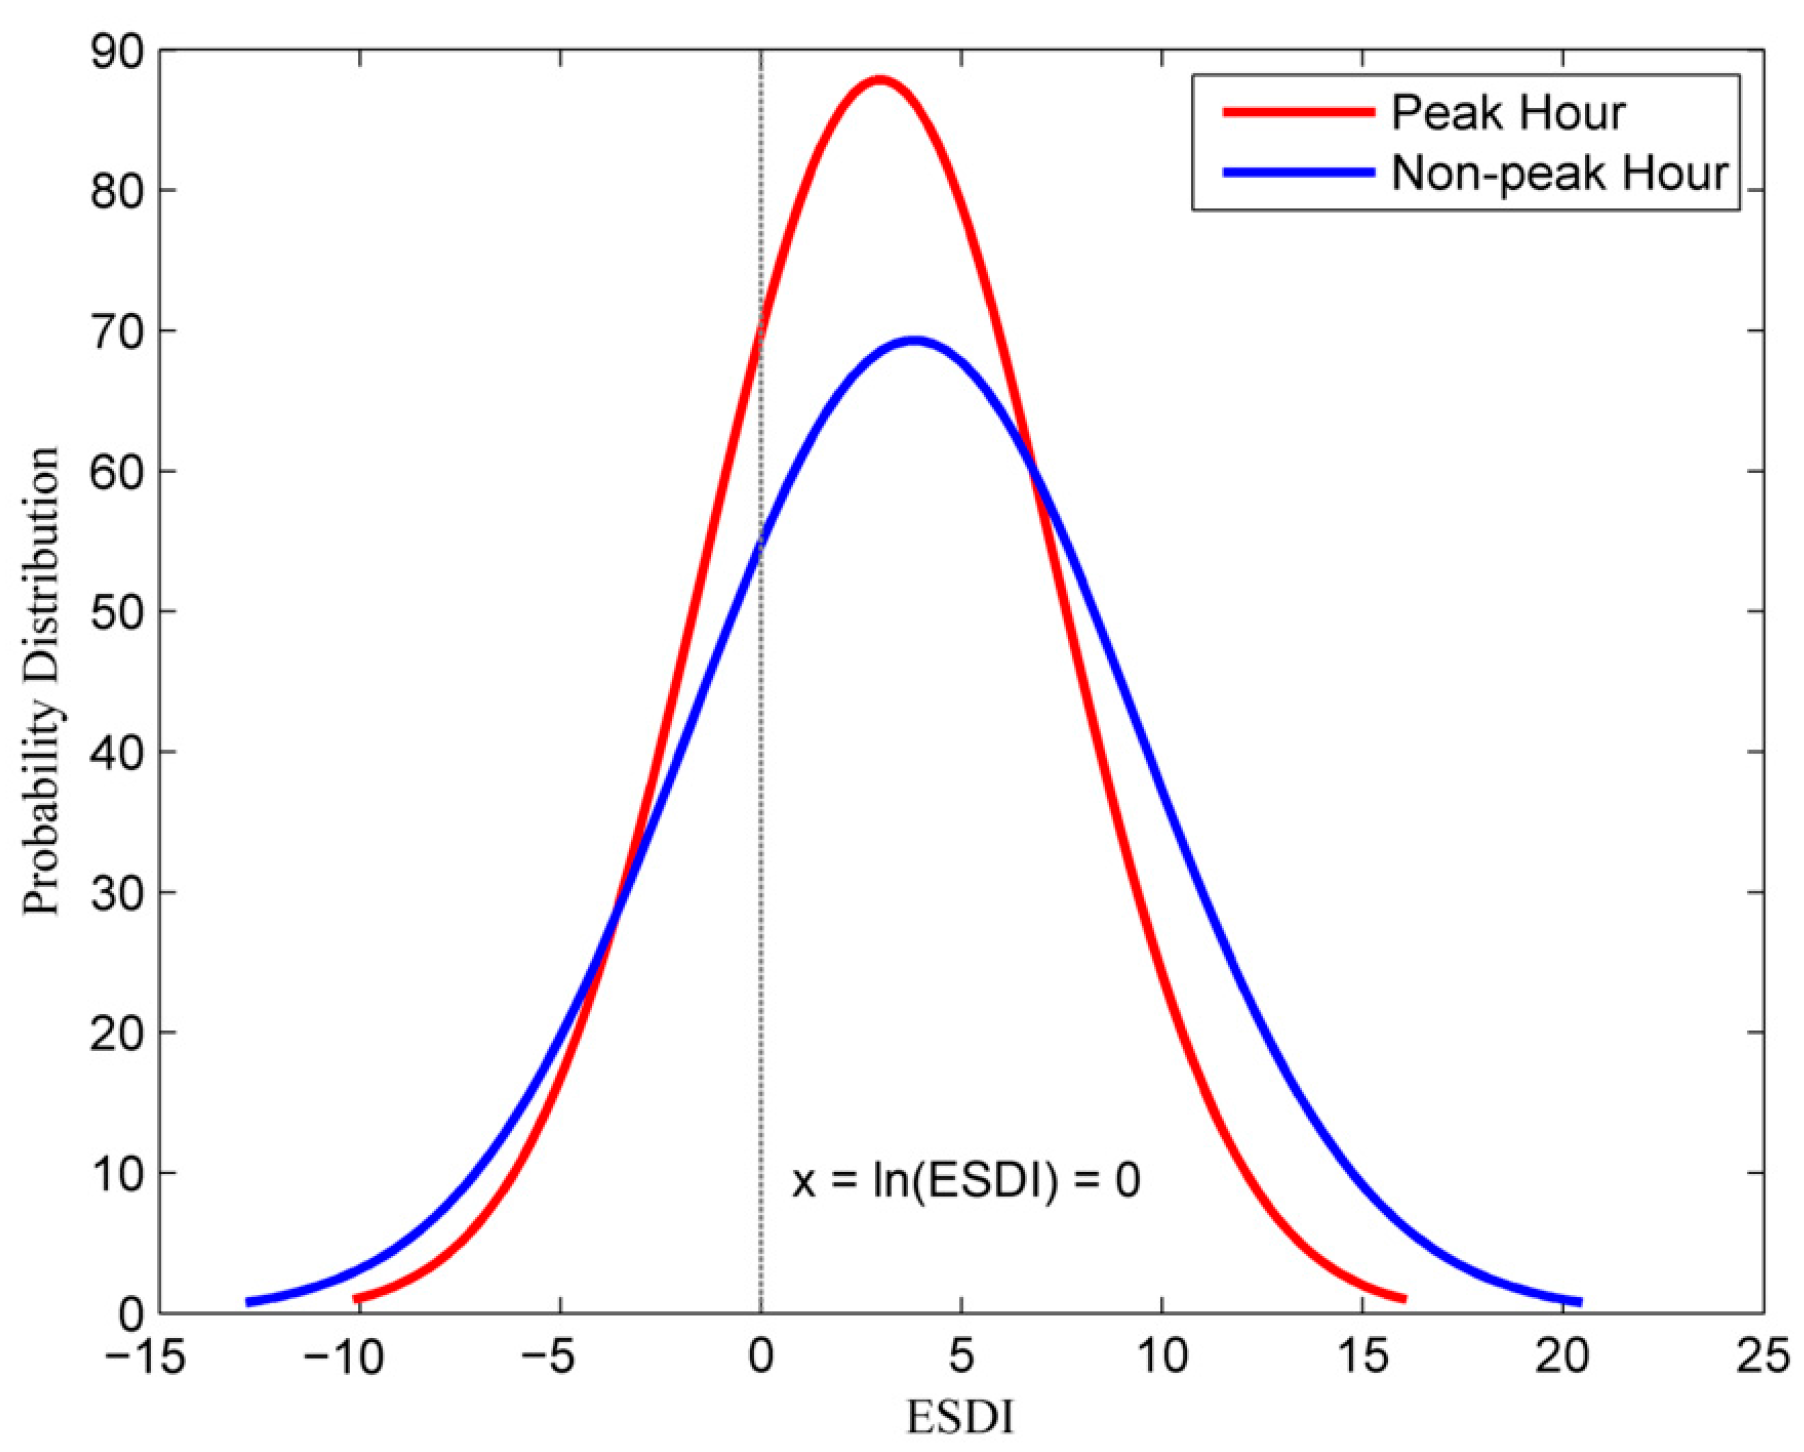
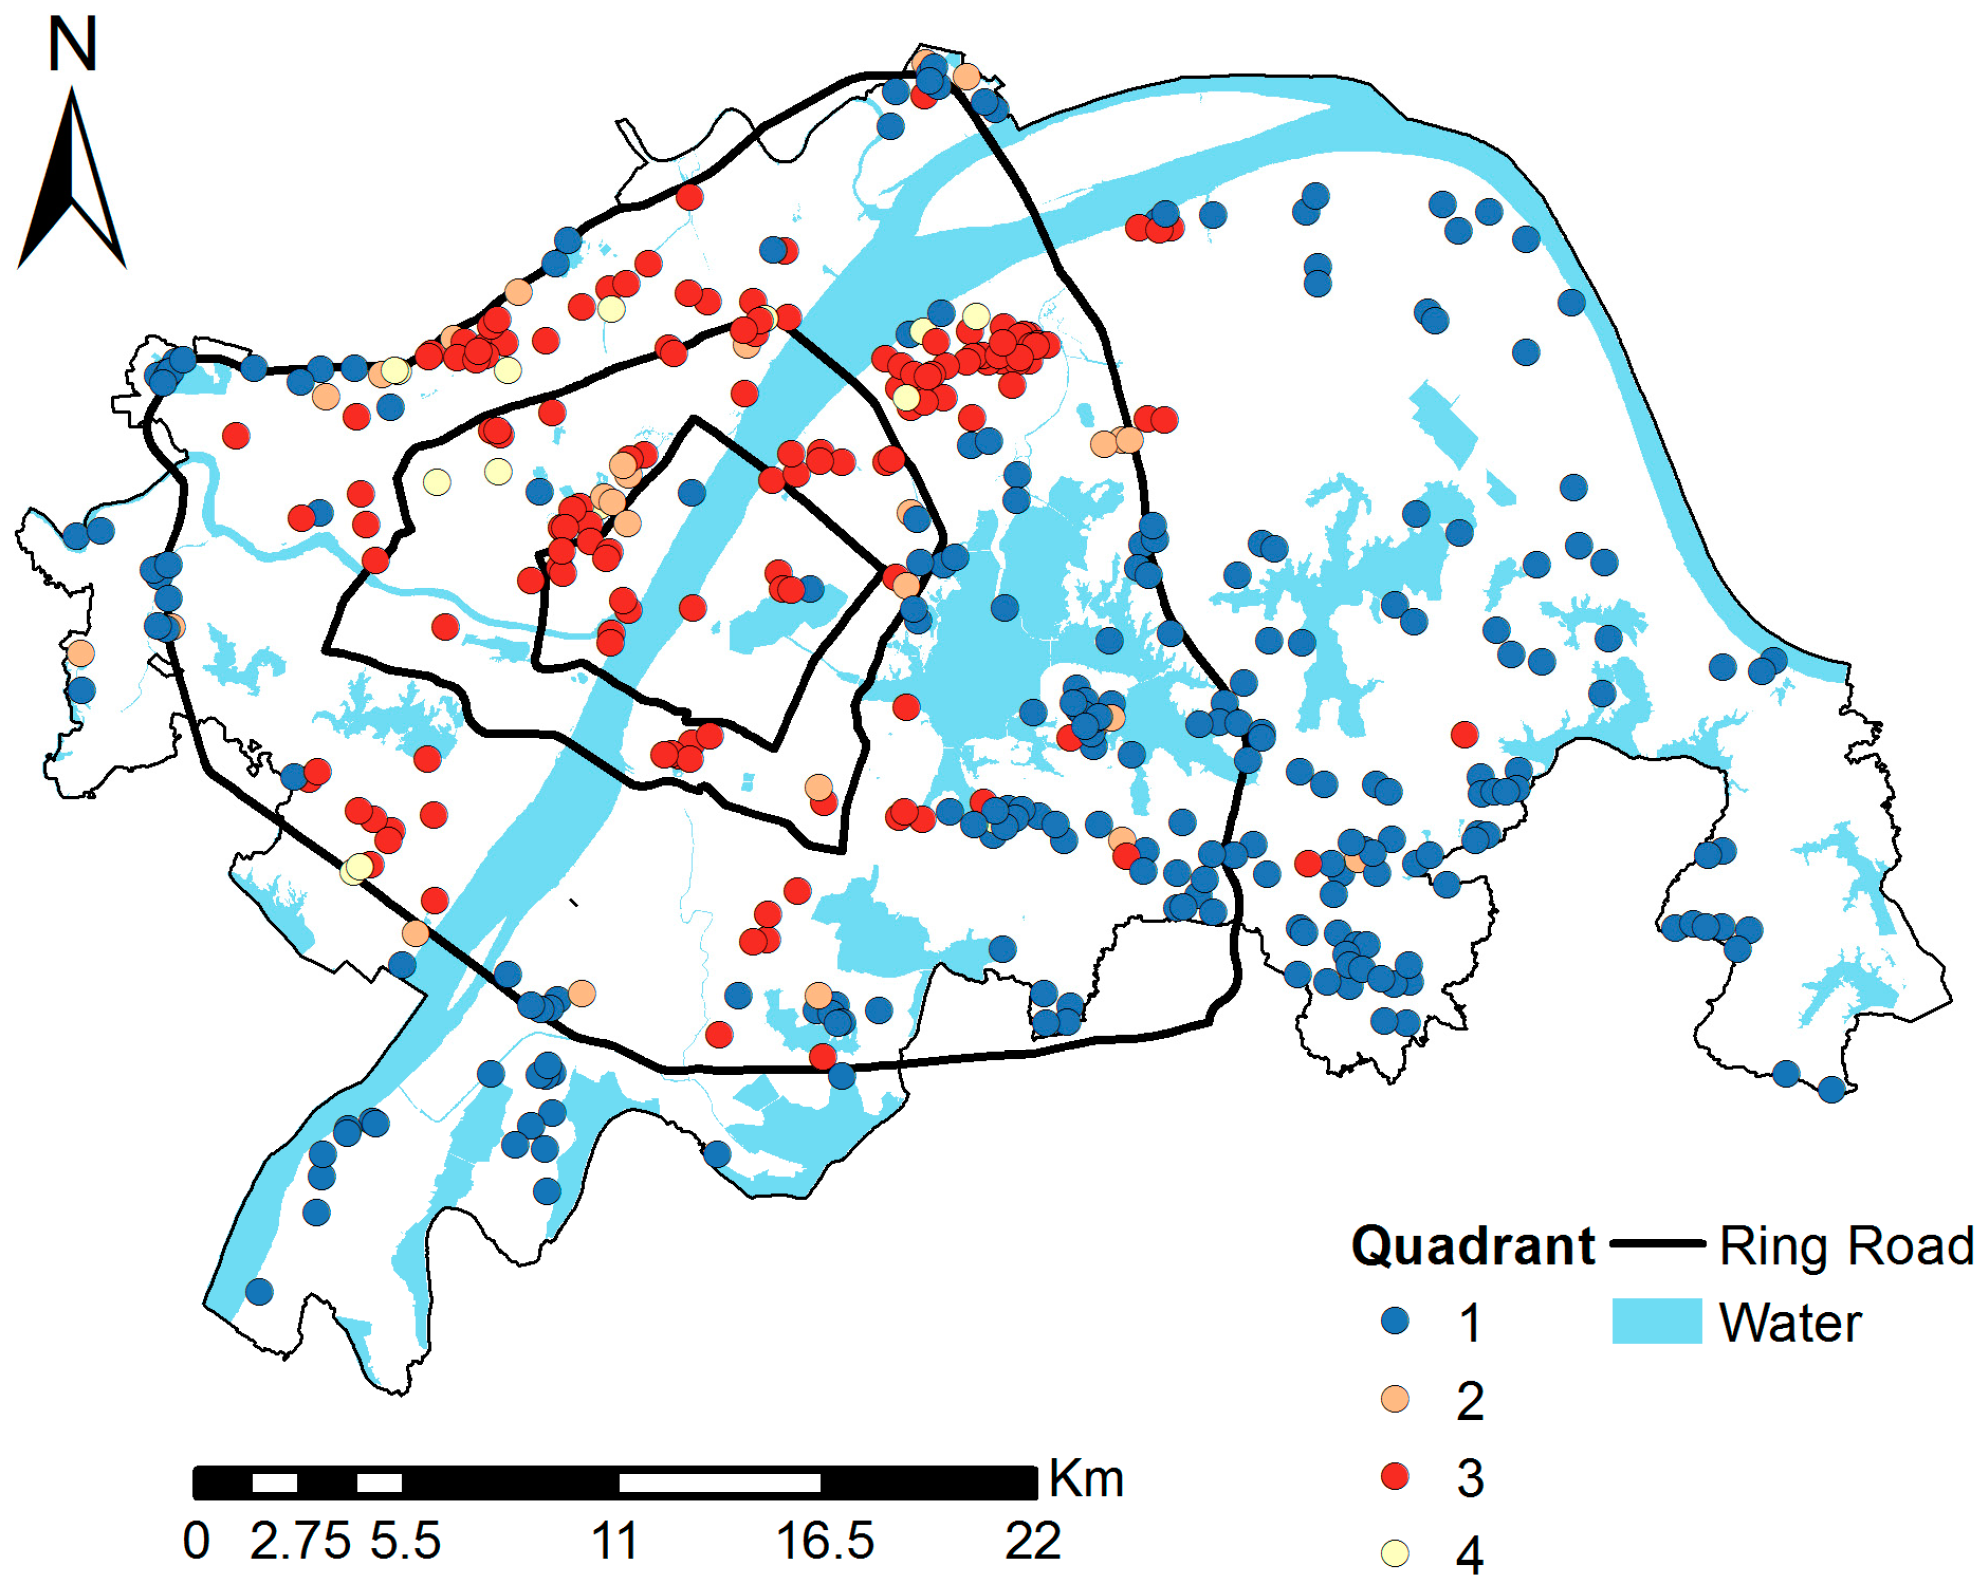
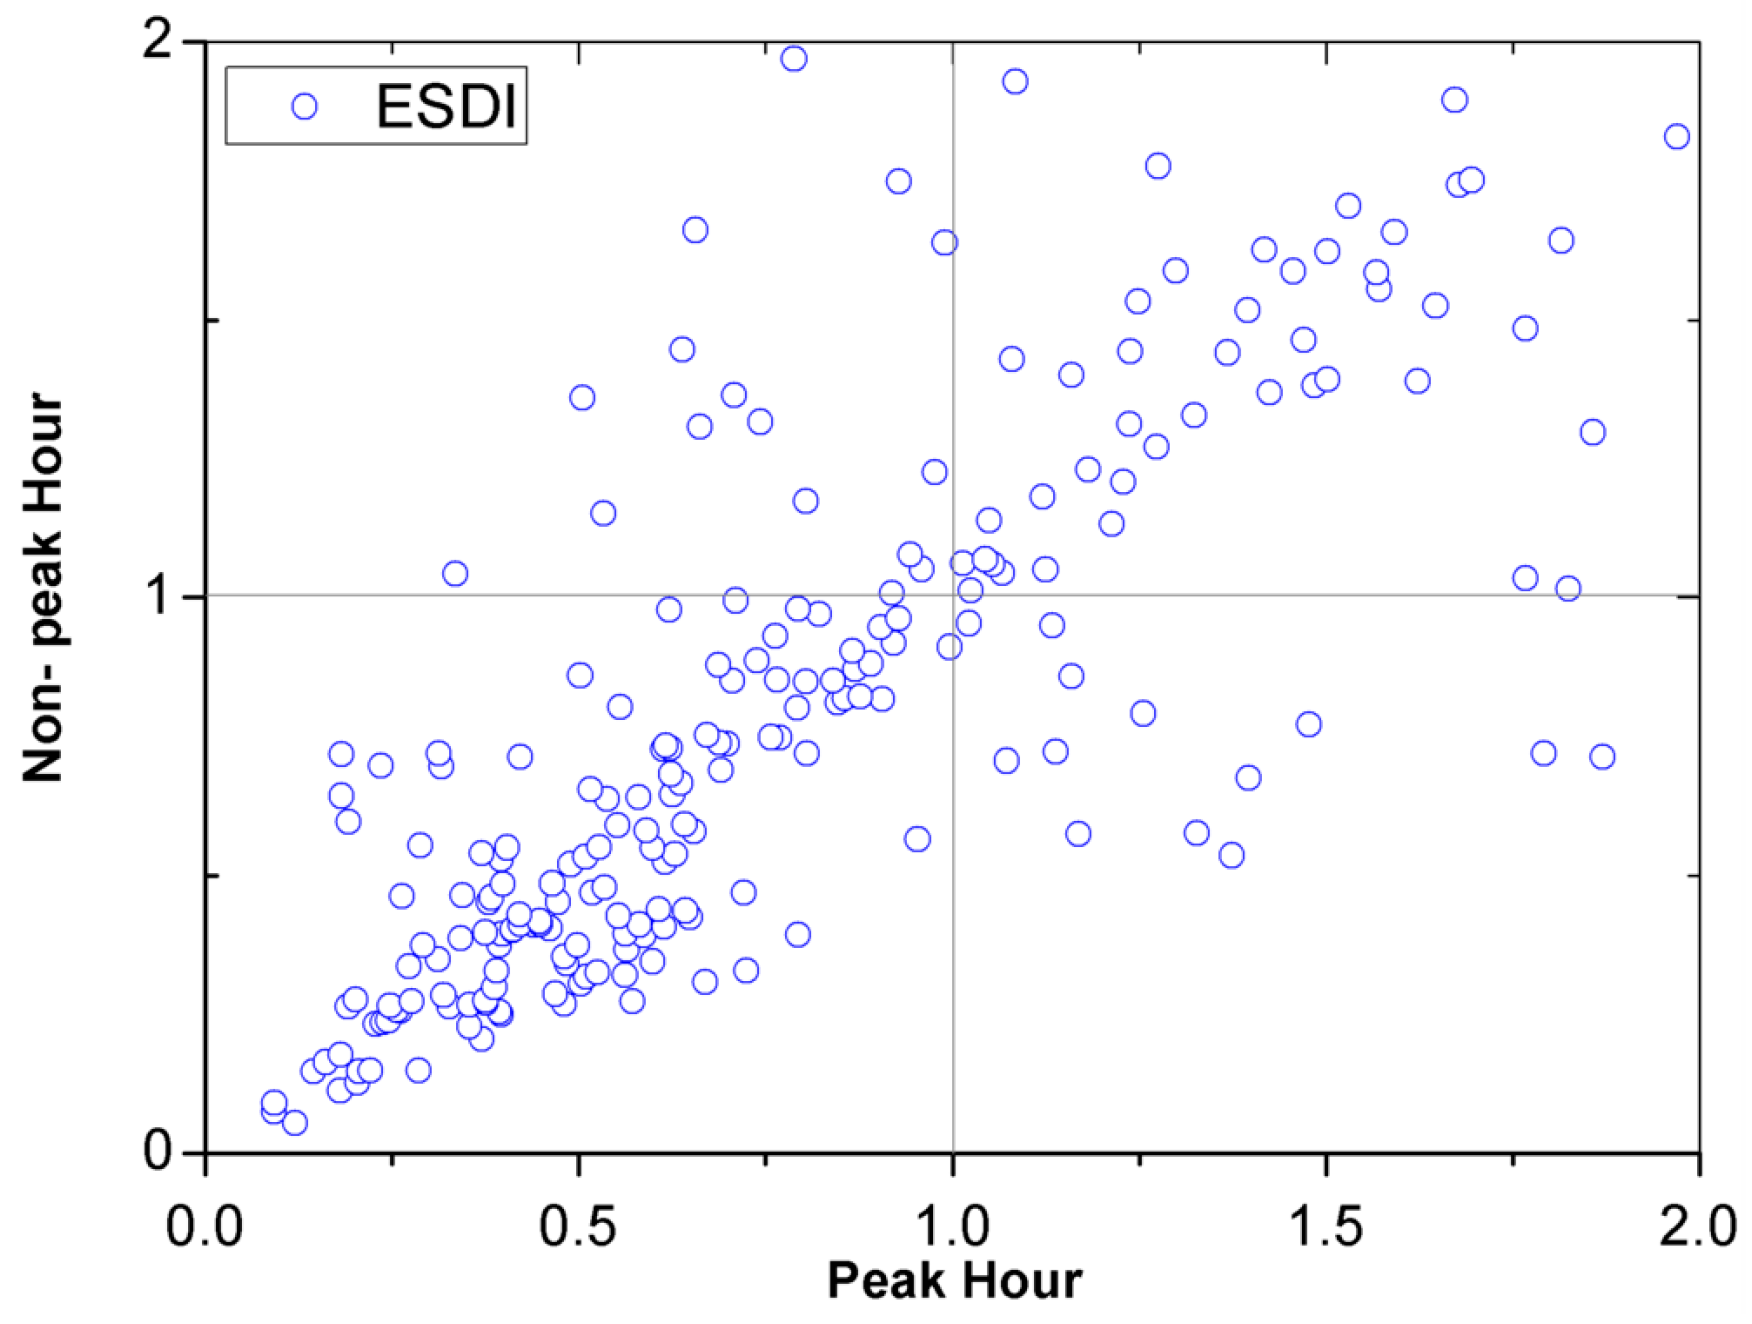
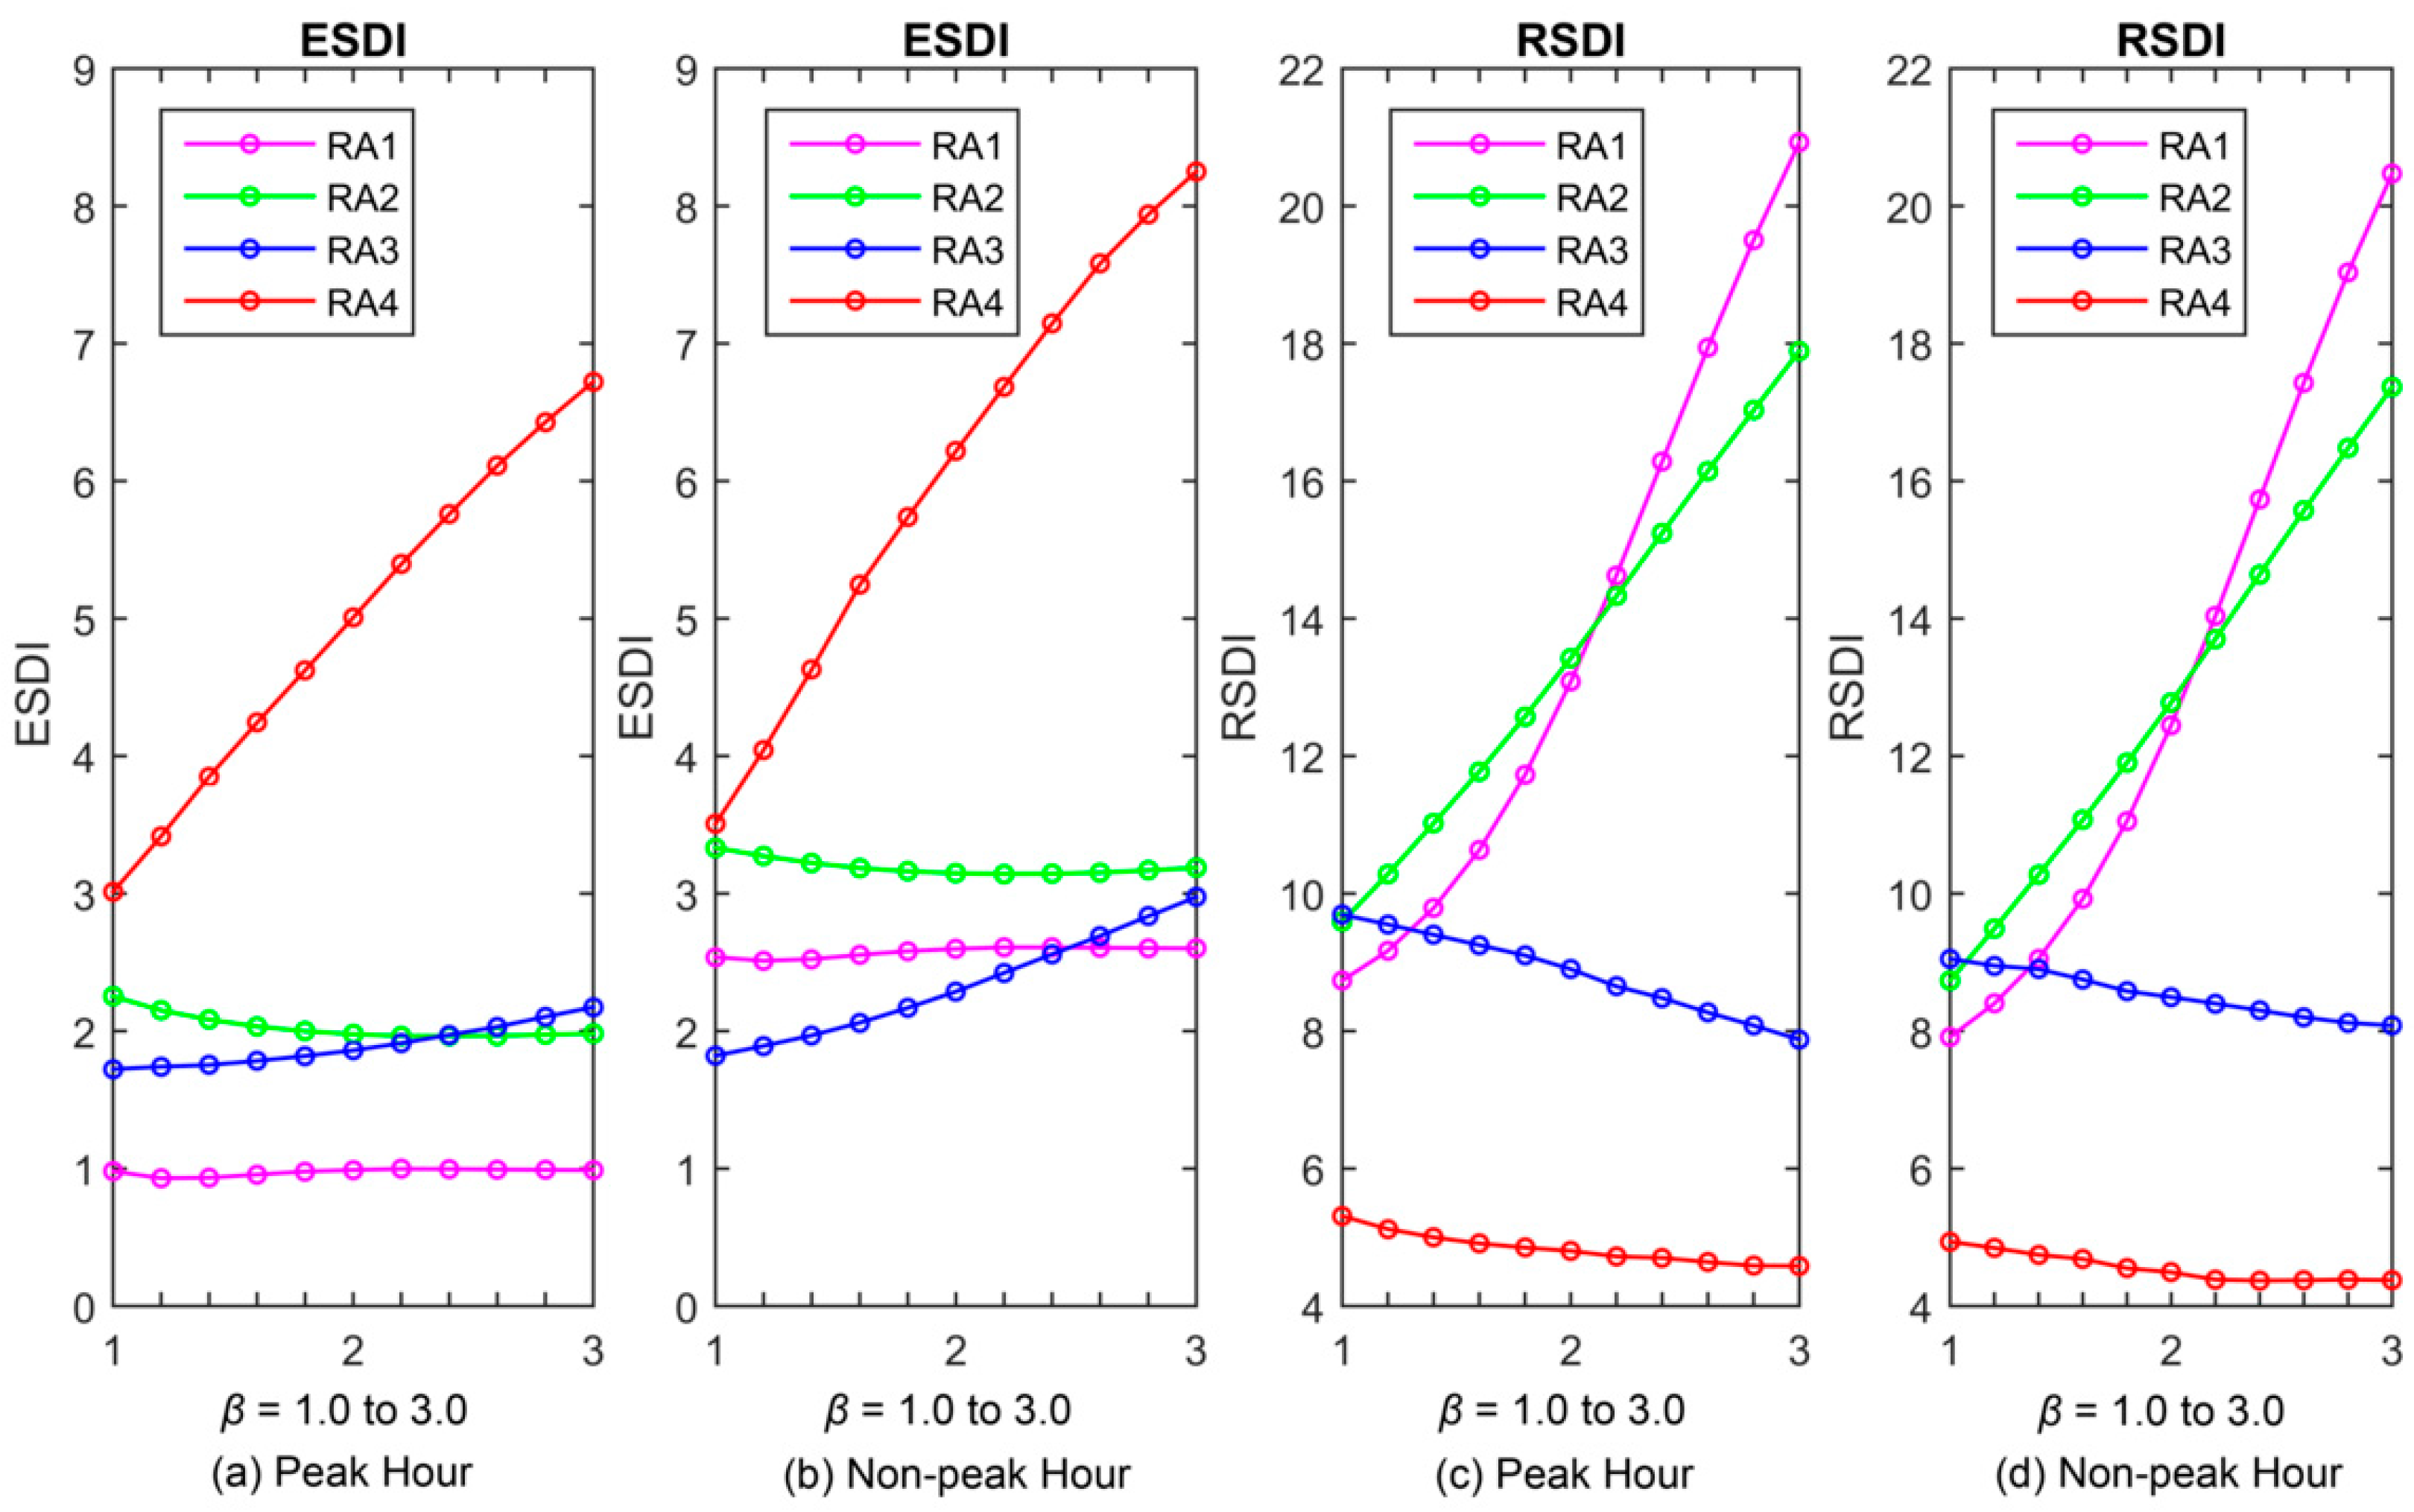
4.1. ESDI
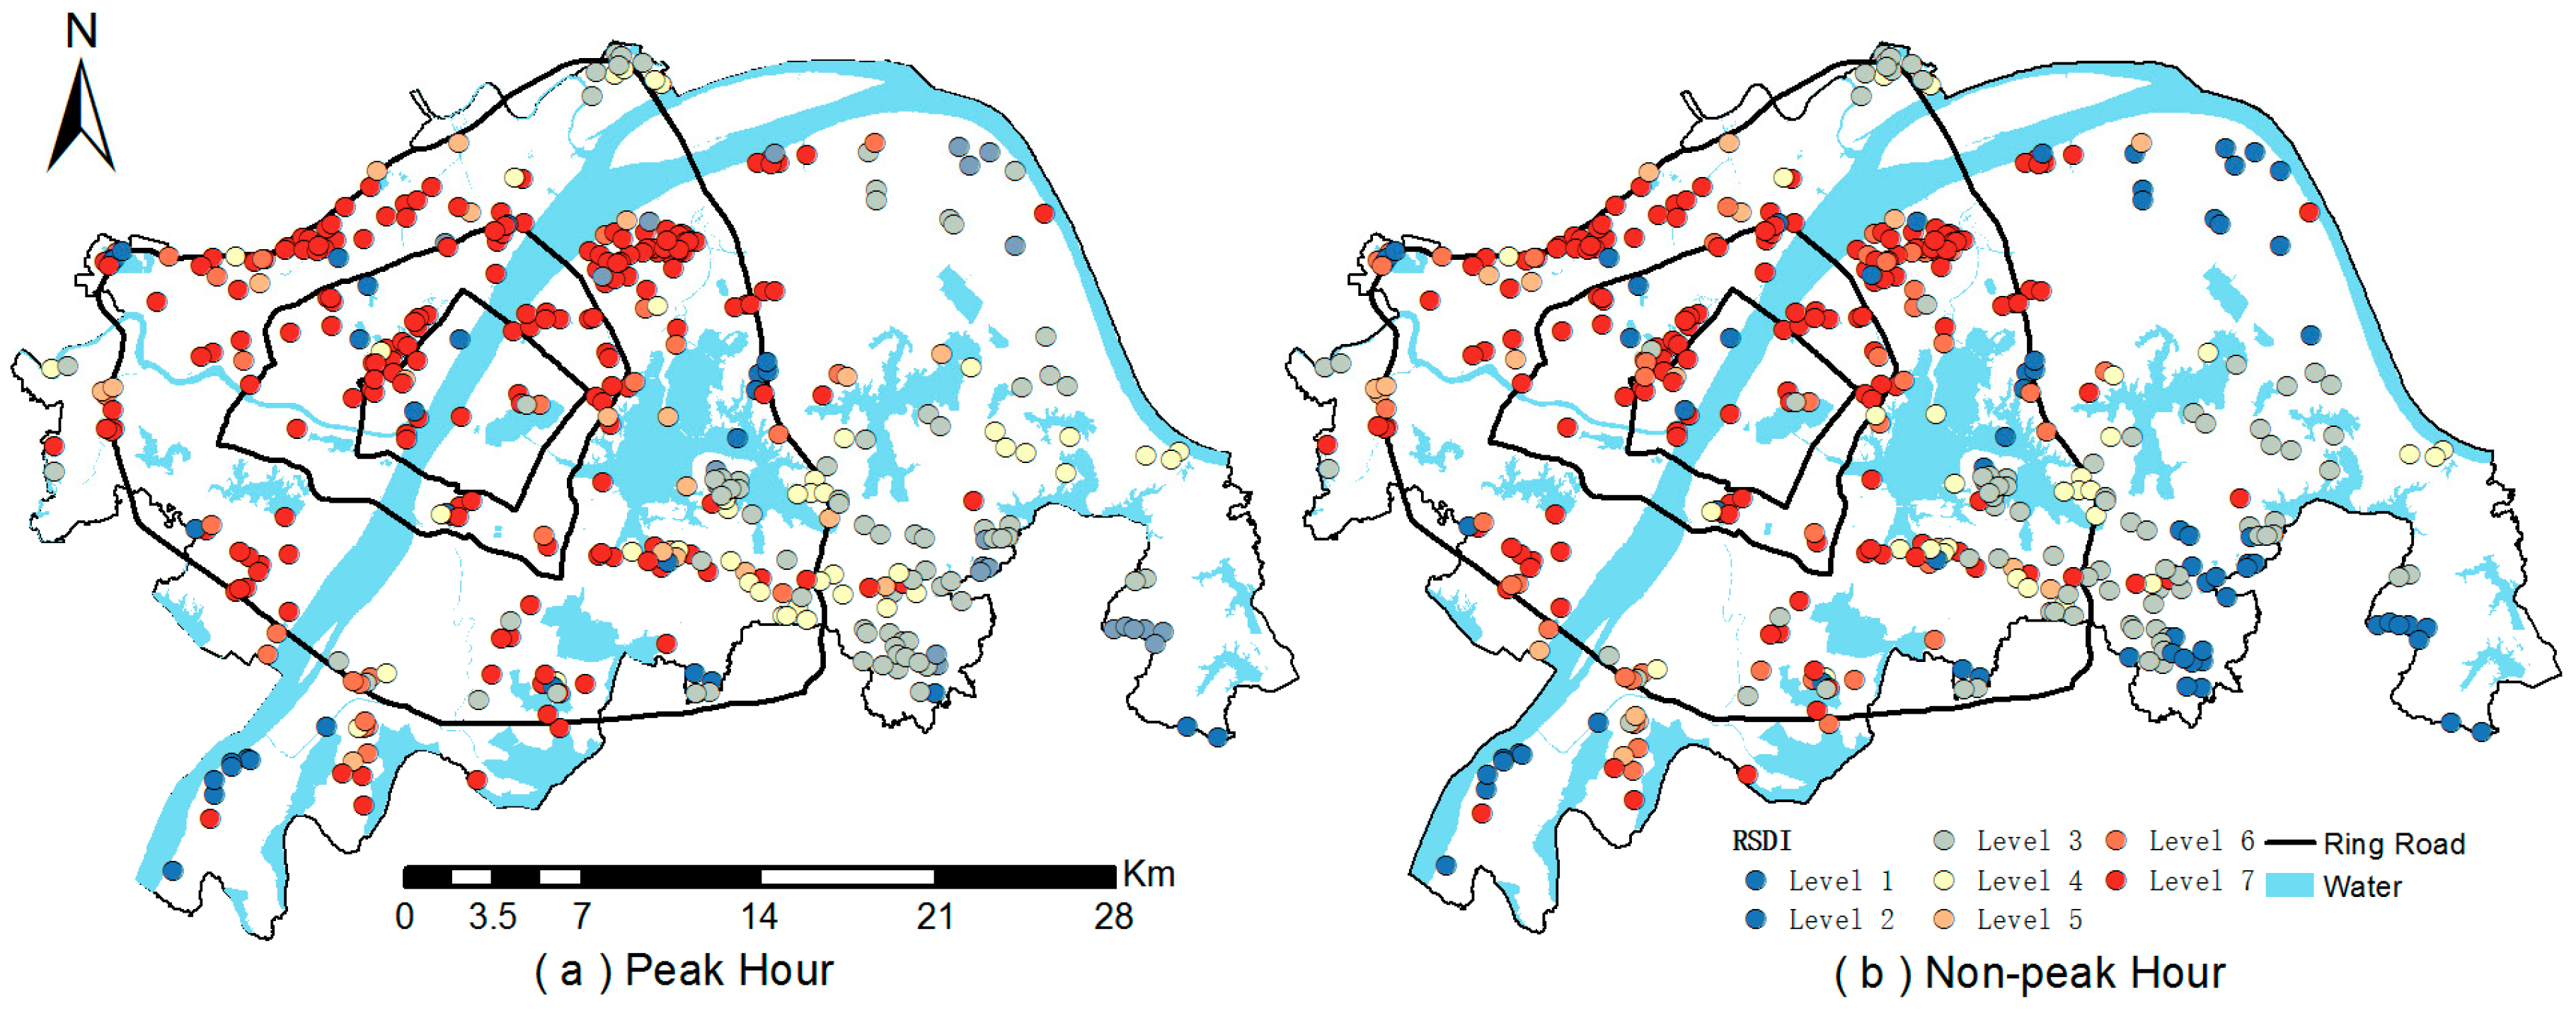
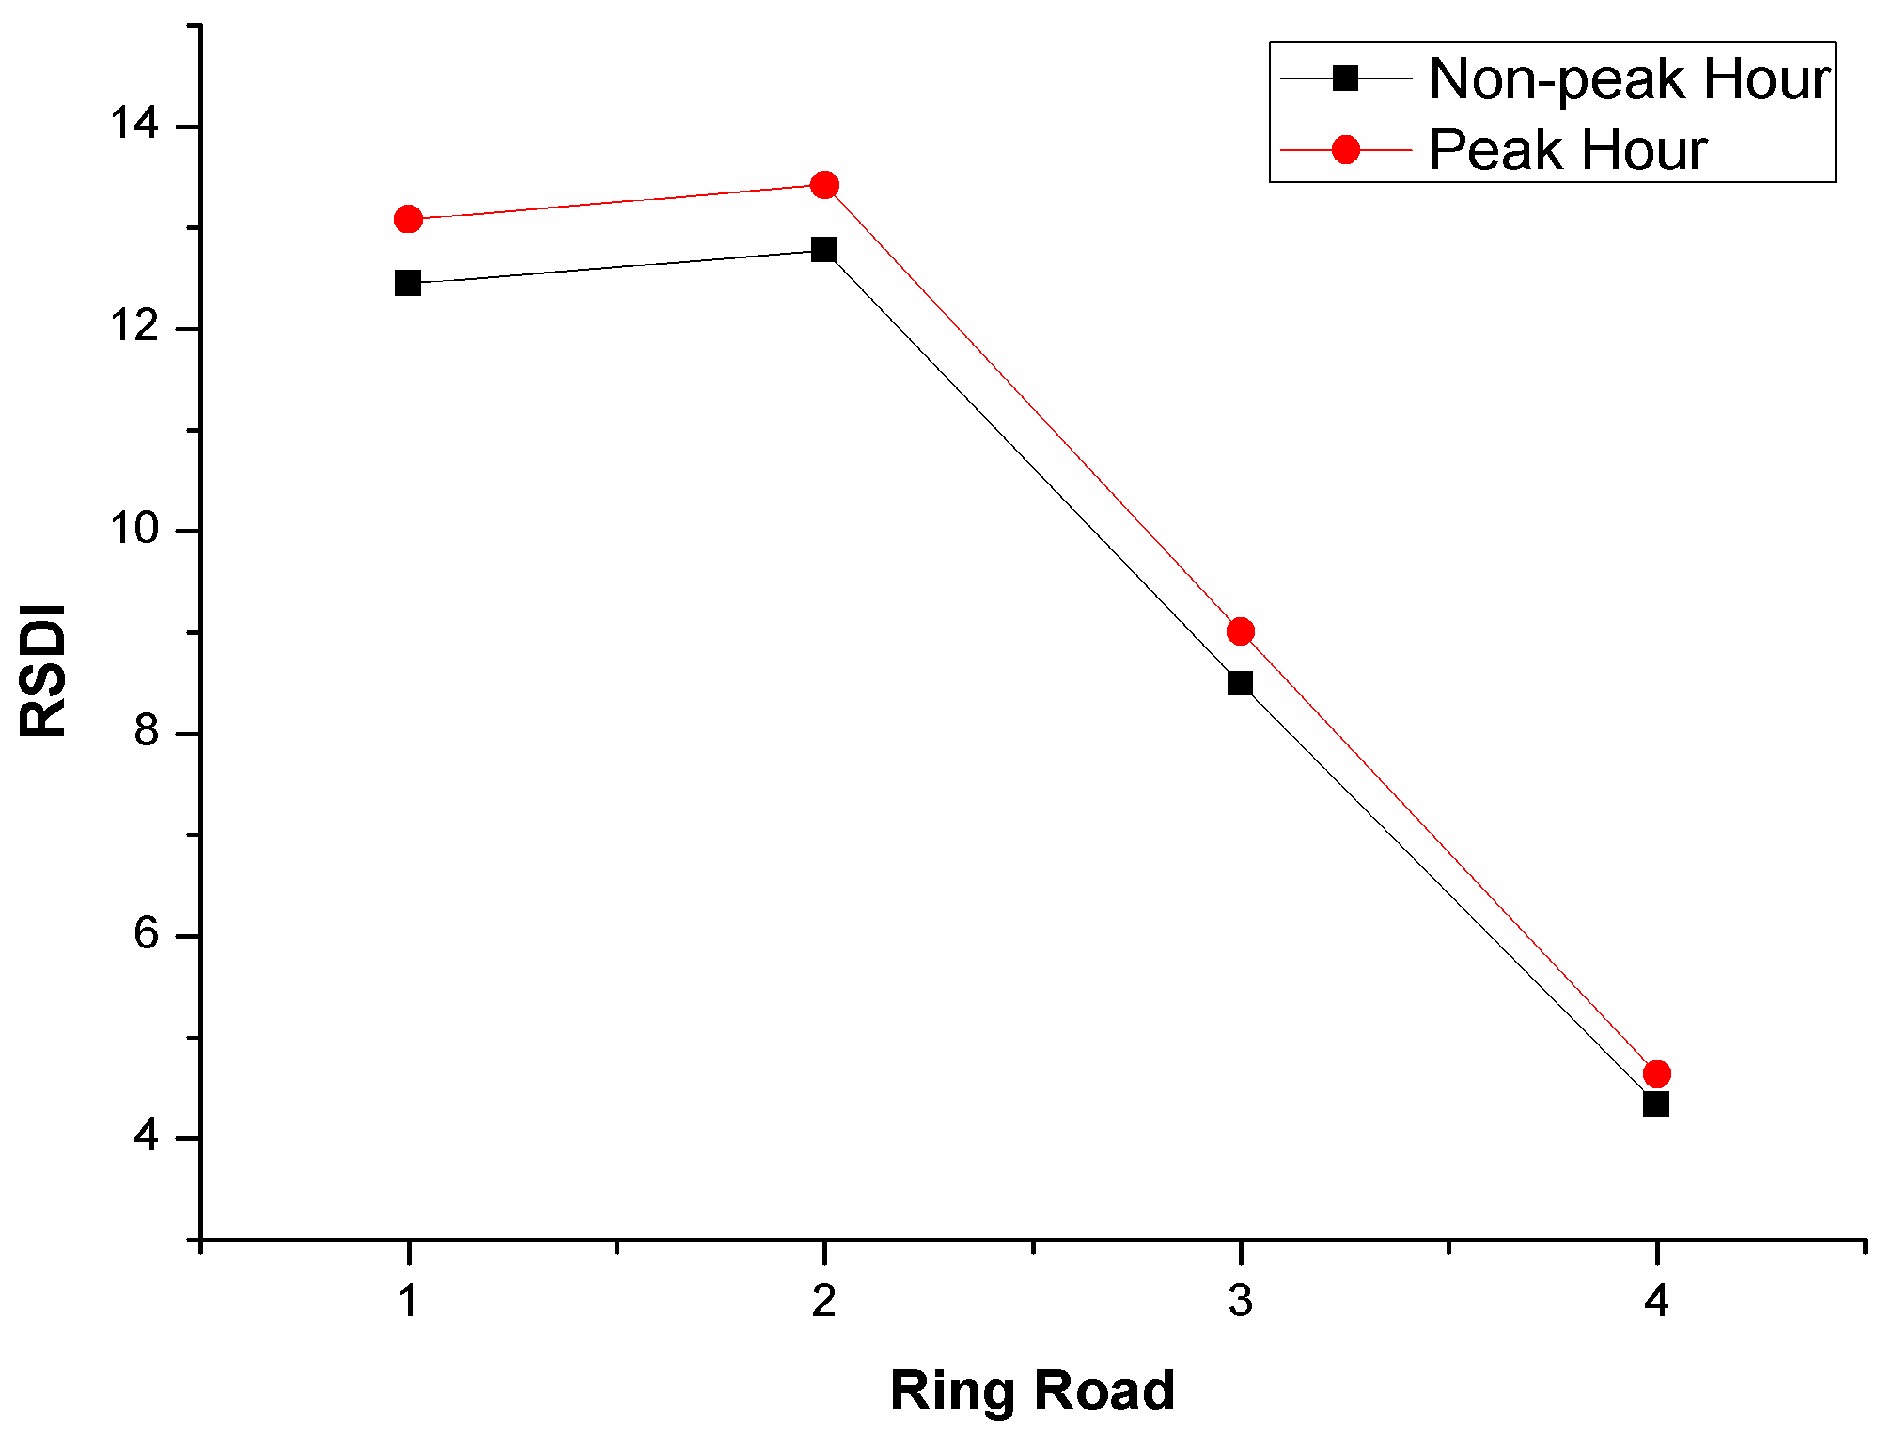
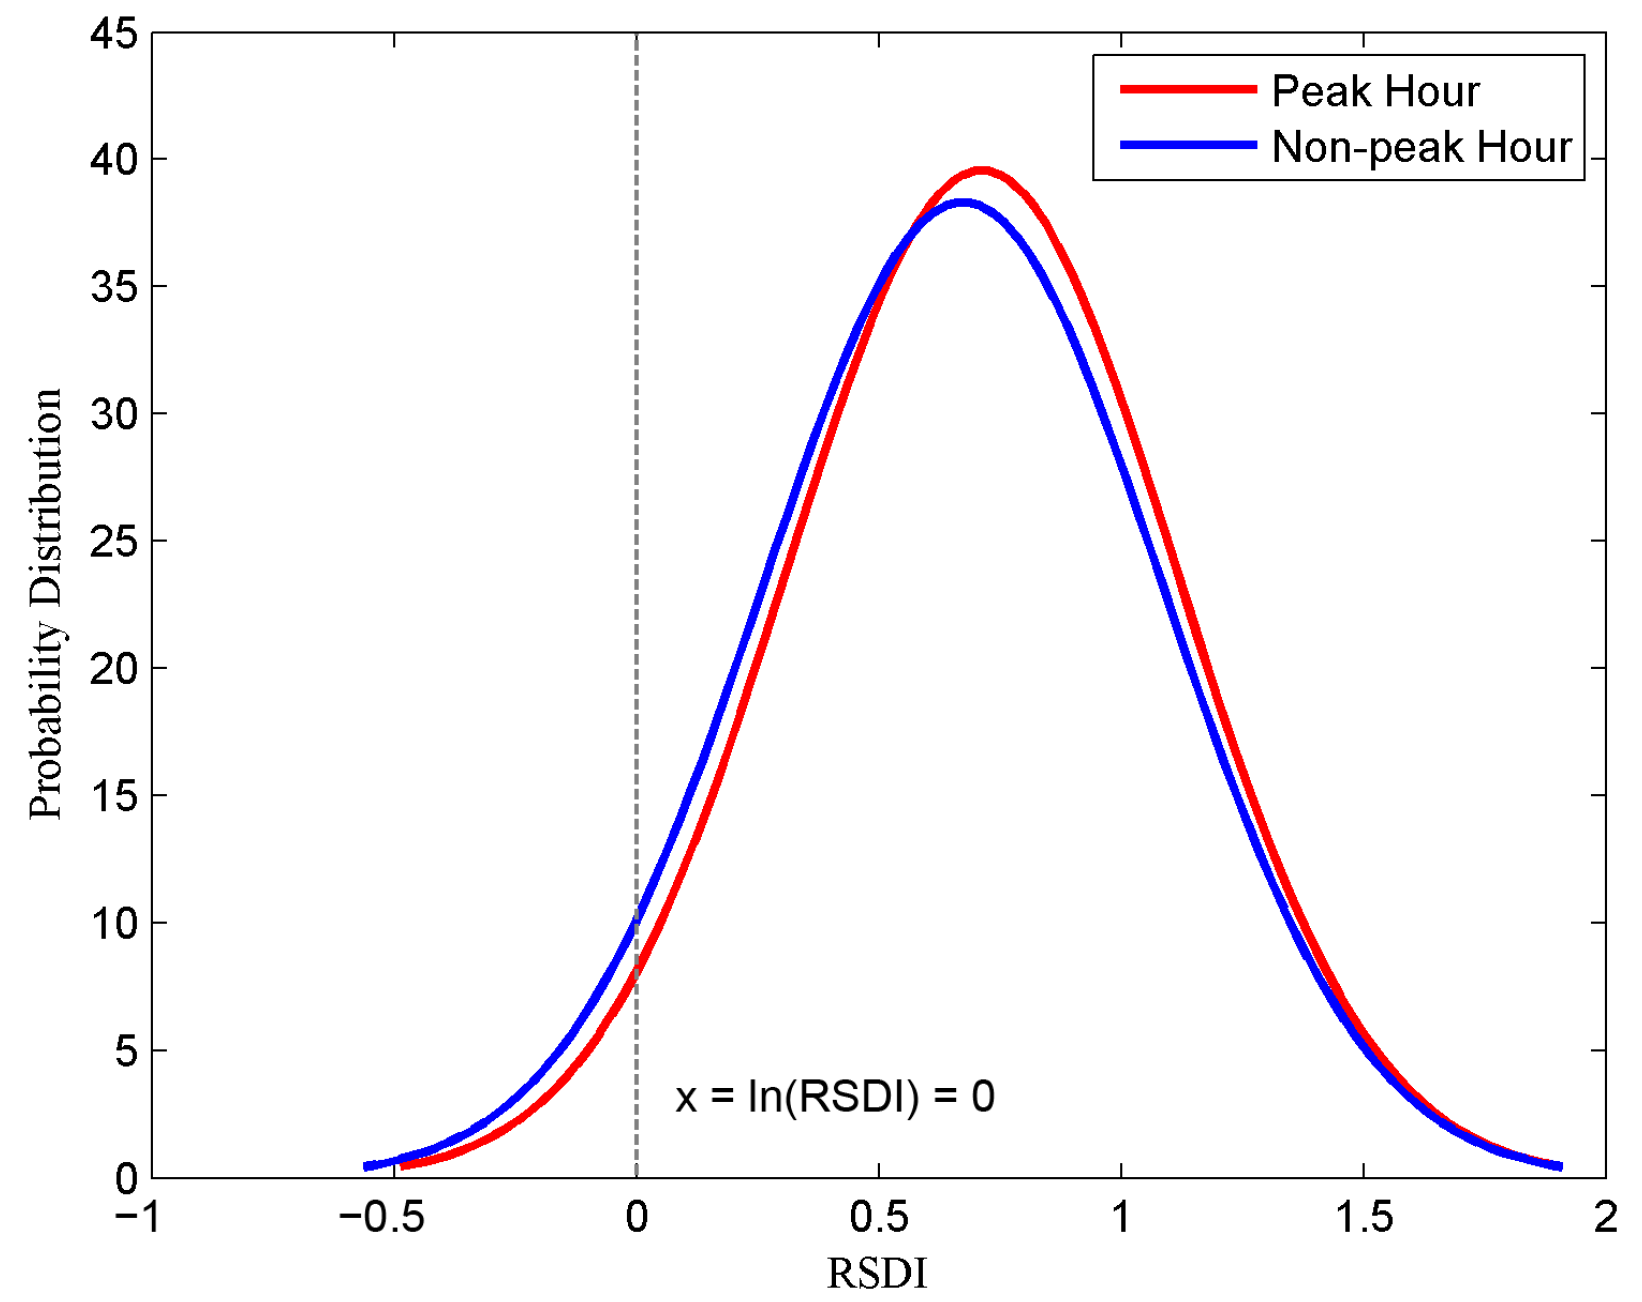
4.2. RSDI
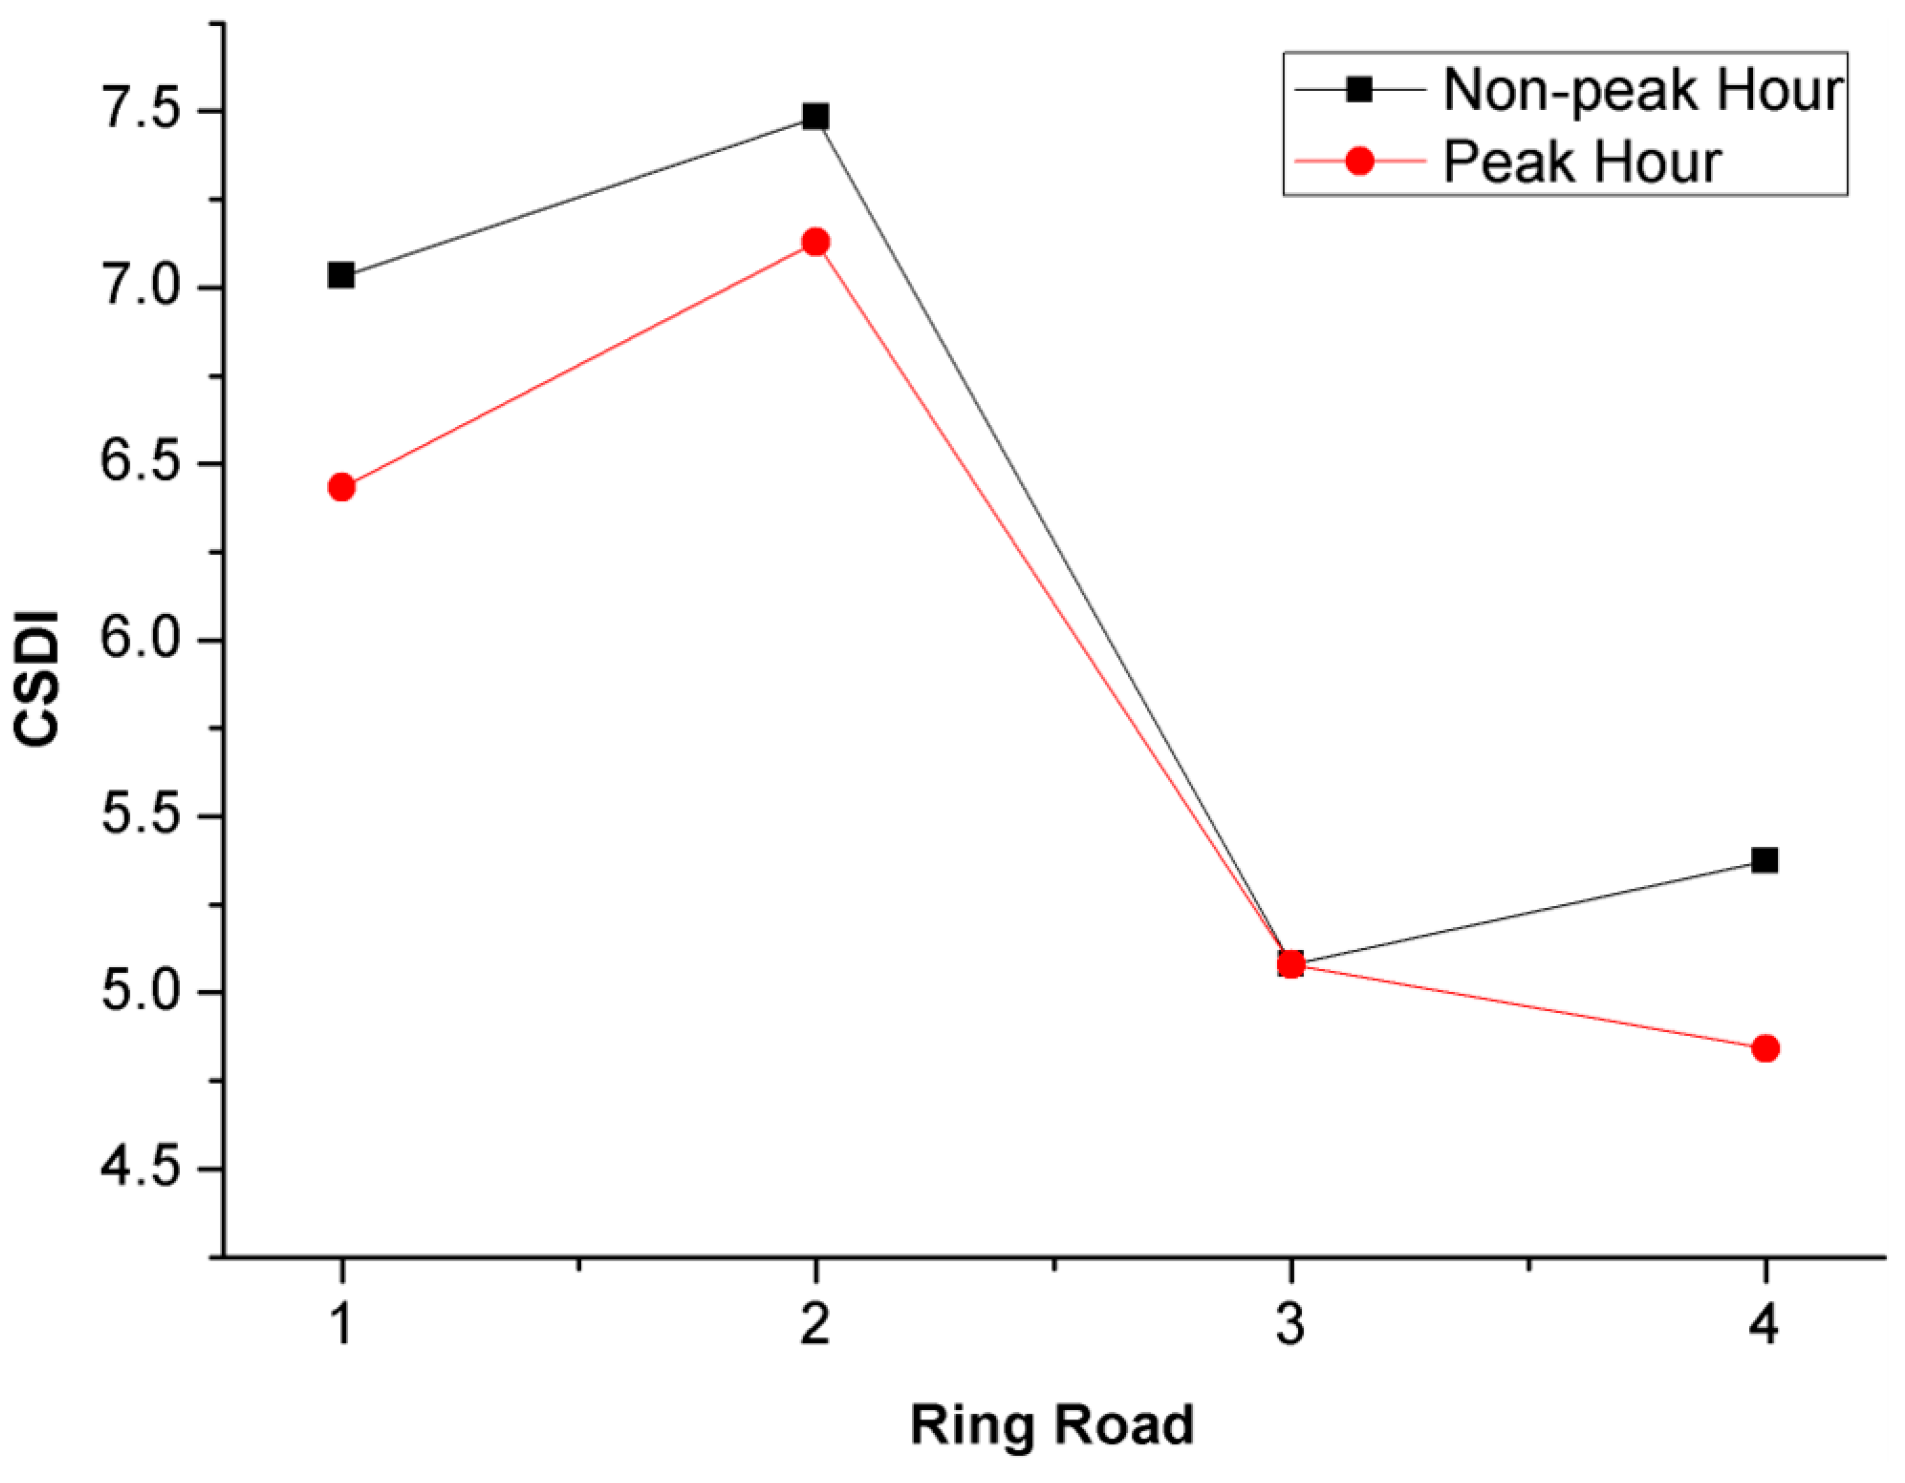
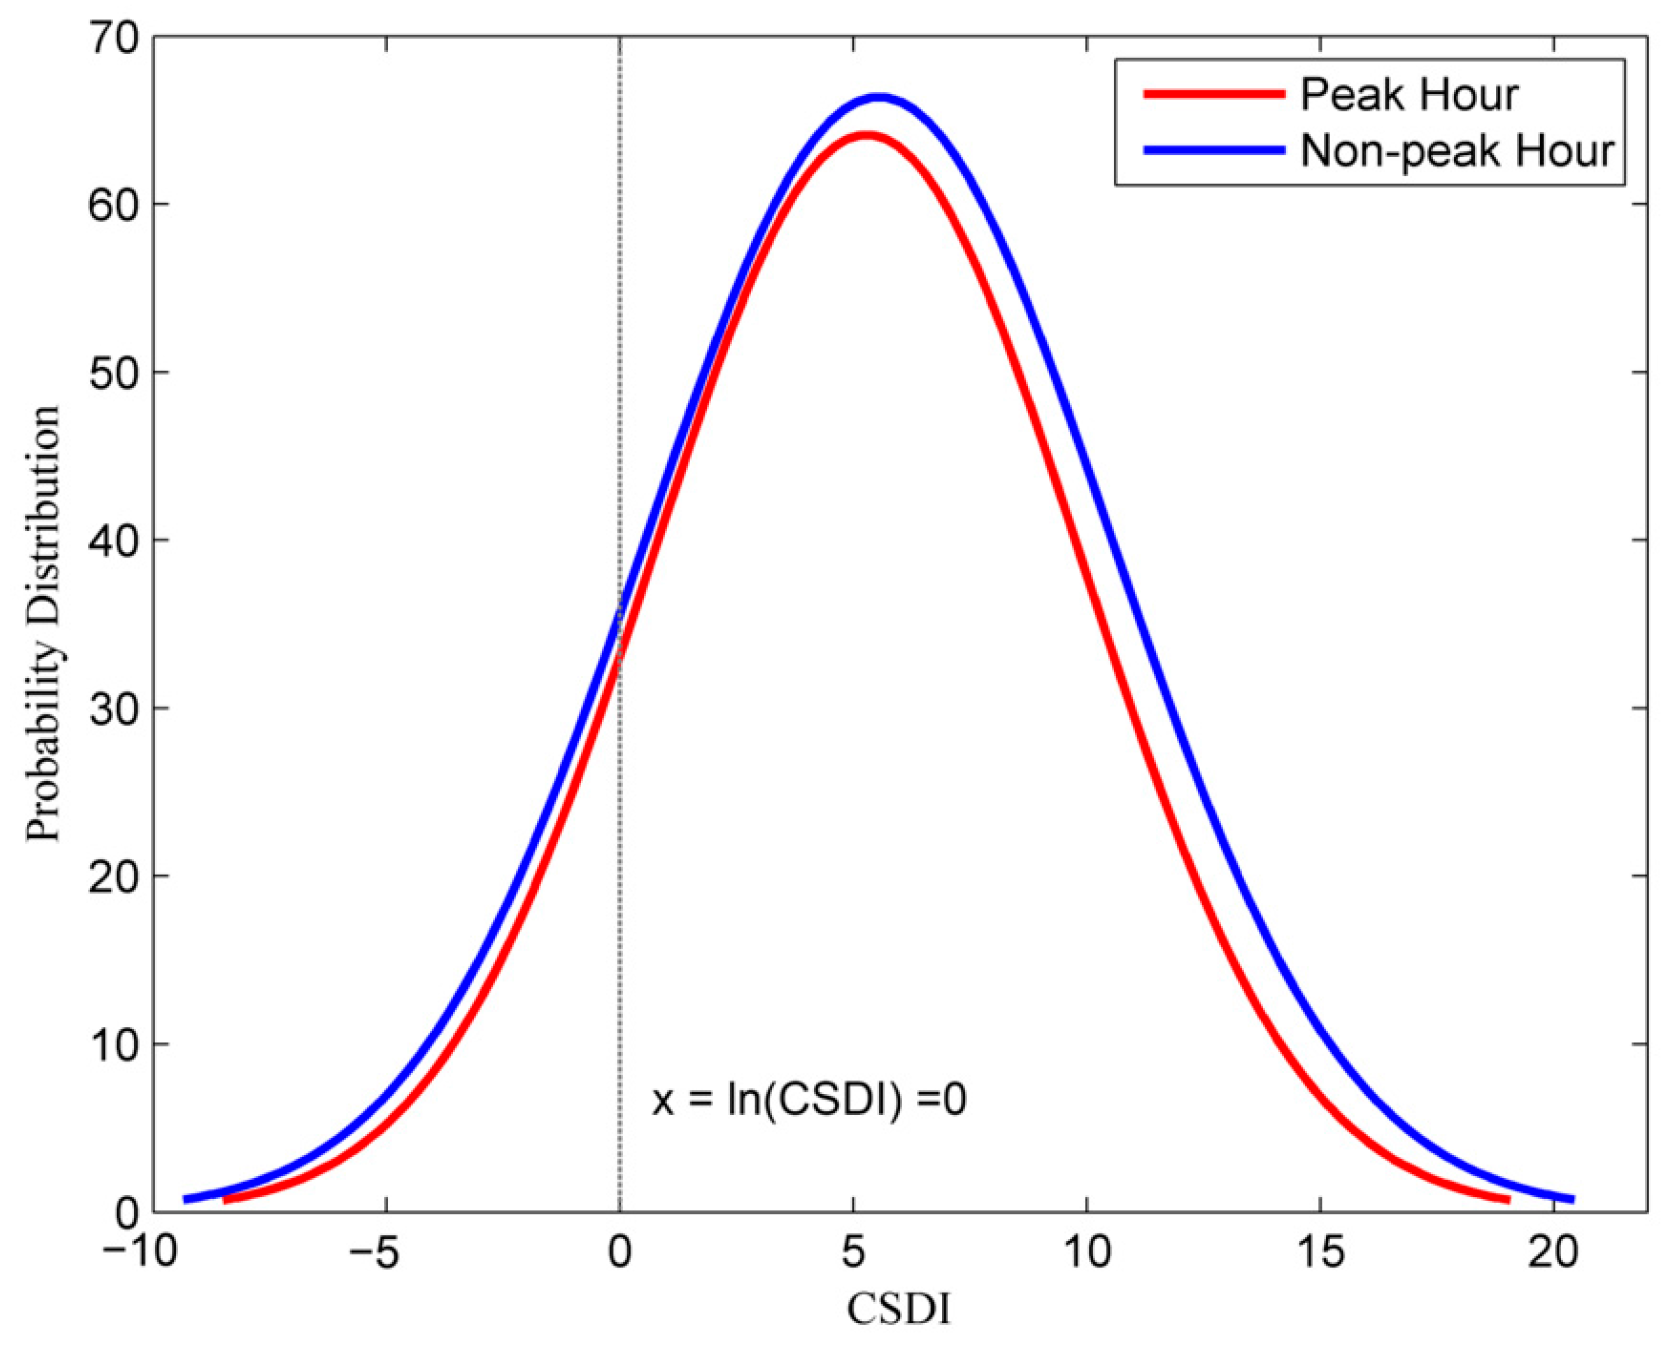
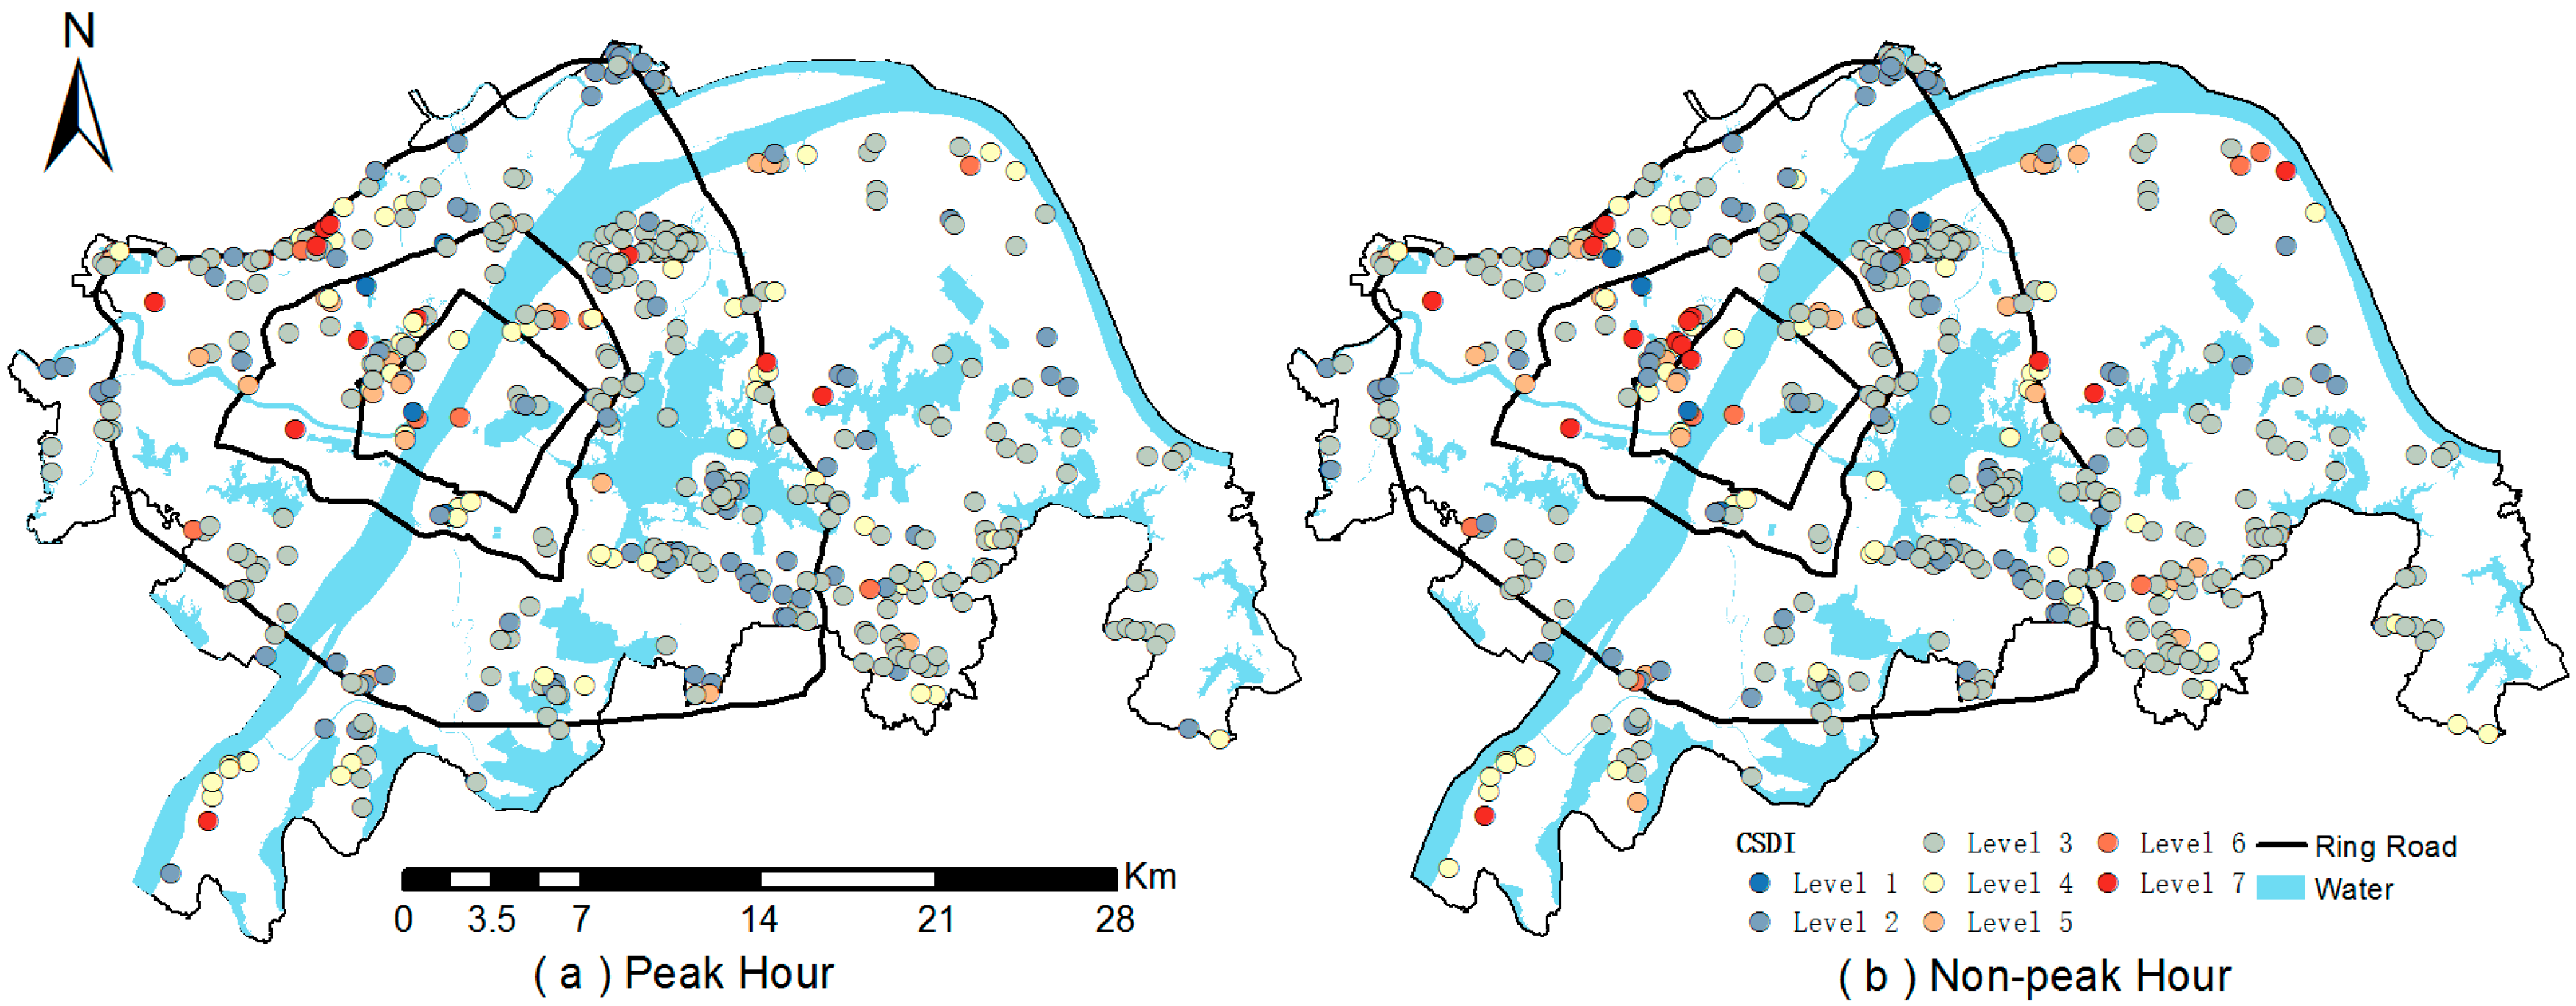
4.3. CSDI
5. Discussions
6. Conclusions
Acknowledgments
Author Contributions
Conflicts of Interest
References
- Zhang, L.; Liu, X.; Li, Y.; Liu, Y.; Liu, Z.; Lin, J.; Shen, J.; Tang, X.; Zhang, Y.; Liang, W. Emergency medical rescue efforts after a major earthquake: Lessons from the 2008 wenchuan earthquake. Lancet 2012, 379, 853–861. [Google Scholar] [CrossRef]
- Editing Group of Tangshan Earthquake. Tangshan Earthquake on 1976; Seismological Press: Beijing, China, 1982; pp. 7–10. (In Chinese) [Google Scholar]
- The Survey of Blast of Ruihai Company. Available online: http://www.bh.gov.cn/html/bhxqzww/YY24845/2015-09-01/Detail_882444.htm (accessed on 28 September 2015). (In Chinese)
- Lämmel, G.; Grether, D.; Nagel, K. The representation and implementation of time-dependent inundation in large-scale microscopic evacuation simulations. Transp. Res. Part C Emerg. Technol. 2010, 18, 84–98. [Google Scholar] [CrossRef]
- Korhonen, T.; Hostikka, S.; Heliövaara, S.; Ehtamo, H. Fds+evac: An agent based fire evacuation model. Pedestr. Evacuation Dyn. 2008 2010, 109–120. [Google Scholar]
- Wood, N.J.; Schmidtlein, M.C. Anisotropic path modeling to assess pedestrian-evacuation potential from cascadia-related tsunamis in the US Pacific Northwest. Nat. Hazards 2012, 62, 275–300. [Google Scholar] [CrossRef]
- Modali, N.K. Modeling Destination Choice and Measuring the Transferability of Hurricane Evacuation Patterns. Master’s Thesis, Louisiana State University, Baton Rouge, LA, USA, 18 November 2004. [Google Scholar]
- Wilmot, C.G.; Modali, N.; Chen, B. Modeling Hurricane Evacuation Traffic: Testing the Gravity and Intervening Opportunity Models as Models of Destination Choice in Hurricane Evacuation; FHWA/LA.06/407; Louisiana Transportation Research Center and Department of Civil and Environmental Engineering of Louisiana State University: Baton Rouge, LA, USA, September 2006. [Google Scholar]
- Baker, E.J. Hurricane Evacuation in the United States; Pielke, R., Jr., Pielke, R., Sr., Eds.; Routledge: Abingdon, UK, 2000. [Google Scholar]
- Lindell, M.K.; Kang, J.E.; Prater, C.S. The logistics of household hurricane evacuation. Nat. Hazards 2011, 58, 1093–1109. [Google Scholar] [CrossRef]
- Mileti, D.S.; Sorensen, J.H.; O’Brien, P.W. Toward an explanation of mass care shelter use in evacuations. Int. J. Mass Emerg. Disasters 1992, 10, 25–42. [Google Scholar]
- Whitehead, J.C. One million dollars per mile? The opportunity costs of hurricane evacuation. Ocean Coast. Manag. 2003, 46, 1069–1083. [Google Scholar] [CrossRef]
- Wu, H.C.; Lindell, M.K.; Prater, C.S. Logistics of hurricane evacuation in hurricanes Katrina and Rita. Transp. Res. Part F Traffic Psychol. Behav. 2012, 15, 445–461. [Google Scholar] [CrossRef]
- Dow, K.; Cutter, S.L. Emerging hurricane evacuation issues: Hurricane Floyd and south Carolina. Nat. Hazards Rev. 2002, 3, 12–18. [Google Scholar] [CrossRef]
- Riad, J.K.; Norris, F.H.; Ruback, R.B. Predicting evacuation in two major disasters: Risk perception, social influence, and access to resources 1. J. Appl. Soc. Psychol. 1999, 29, 918–934. [Google Scholar] [CrossRef]
- Musharraf, M.; Smith, J.; Khan, F.; Veitch, B.; MacKinnon, S. Assessing offshore emergency evacuation behavior in a virtual environment using a bayesian network approach. Reliab. Eng. Syst. Saf. 2016, 152, 28–37. [Google Scholar] [CrossRef]
- Lindell, M.K.; Lu, J.C.; Prater, C.S. Household decision making and evacuation in response to hurricane lili. Nat. Hazards Rev. 2005, 6, 171–179. [Google Scholar] [CrossRef]
- Saha, S.K.; James, H. Reasons for non-compliance with cyclone evacuation orders in Bangladesh. Int. J. Disaster Risk Reduct. 2017, 21, 196–204. [Google Scholar] [CrossRef]
- Baker, E.J. Hurricane evacuation behavior. Int. J. Mass Emerg. Disasters 1991, 9, 287–310. [Google Scholar]
- Gharakhlou, M.; Sabokbar, F. Access enhancement by making changes in the route network to facilitate rescue operations in urban disasters. Int. J. Environ. Res. 2010, 4, 183–192. [Google Scholar]
- Sun, J.; Zhu, X.; Zhang, C.; Fang, Y. Rescueme: Location-based secure and dependable vanets for disaster rescue. IEEE J. Sel. Areas Commun. 2011, 29, 659–669. [Google Scholar] [CrossRef]
- Kleiner, A.; Brenner, M.; Bräuer, T.; Dornhege, C.; Göbelbecker, M.; Luber, M.; Prediger, J.; Stückler, J.R.; Nebel, B. Successful search and rescue in simulated disaster areas. Lect. Notes Comput. Sci. 2006, 4020, 323–334. [Google Scholar]
- Barbarosoğlu, G.; Arda, Y. A two-stage stochastic programming framework for transportation planning in disaster response. J. Oper. Res. Soc. 2004, 55, 43–53. [Google Scholar] [CrossRef]
- Hu, Z.H.; Sheng, Z.H. Disaster spread simulation and rescue time optimization in a resource network. Inf. Sci. 2015, 298, 118–135. [Google Scholar] [CrossRef]
- Wei, X.; Lv, W.; Song, W. Rescue route reselection model and algorithm for the unexpected accident. Procedia Eng. 2013, 62, 532–537. [Google Scholar] [CrossRef]
- D’Agostino, F.; Farinelli, A.; Grisetti, G.; Iocchi, L. Monitoring and information fusion for search and rescue operations in large-scale disasters. In Proceedings of the International Conference on Information Fusion, Washington, DC, USA, 8–11 July 2002; Volume 671, pp. 672–679. [Google Scholar]
- Khamis, N.; Misfian, A.M.; Md Noor, R. Towards sustainable software criteria: Rescue operation and disaster management system model. In Proceedings of the ICNSC IEEE International Conference on Networking, Sensing and Control, Evry, France, 10–12 April 2013; pp. 398–403. [Google Scholar]
- Barsky, L.E.; Trainor, J.E.; Torres, M.R.; Aguirre, B.E. Managing volunteers: Fema’s urban search and rescue programme and interactions with unaffiliated responders in disaster response. Disasters 2007, 31, 495–507. [Google Scholar] [CrossRef] [PubMed]
- Burby, R.J.; Beatley, T.; Berke, P.R.; Deyle, R.E.; French, S.P.; Godschalk, D.R.; Kaiser, E.J.; Kartez, J.D.; May, P.J.; Olshansky, R. Unleashing the power of planning to create disaster-resistant communities. J. Am. Plan. Assoc. 1999, 65, 247–258. [Google Scholar] [CrossRef]
- Glavovic, B.C.; Saunders, W.S.A.; Becker, J.S. Land-use planning for natural hazards in New Zealand: The setting, barriers, ‘burning issues’ and priority actions. Nat. Hazards 2010, 54, 679–706. [Google Scholar] [CrossRef]
- Acharya, G.; Bennett, L.L. Valuing open space and land-use patterns in urban watersheds. J. Real Estate Financ. Econ. 2001, 22, 221–237. [Google Scholar] [CrossRef]
- Cho, S.H.; Lambert, D.M.; Kim, S.G.; Roberts, R.K.; Park, W.M. Relationship between value of open space and distance from housing locations within a community. J. Geogr. Syst. 2011, 13, 393–414. [Google Scholar] [CrossRef]
- Jiao, L.; Liu, Y. Geographic field model based hedonic valuation of urban open spaces in Wuhan, China. Landsc. Urban Plan. 2010, 98, 47–55. [Google Scholar] [CrossRef]
- Nicol, C.; Blake, R. Classification and use of open space in the context of increasing urban capacity. Plan. Pract. Res. 2000, 15, 193–210. [Google Scholar] [CrossRef]
- Van Herzele, A.; Wiedemann, T. A monitoring tool for the provision of accessible and attractive urban green spaces. Landsc. Urban Plan. 2003, 63, 109–126. [Google Scholar] [CrossRef]
- Wu, J.; Plantinga, A.J. The influence of public open space on urban spatial structure. J. Environ. Econ. Manag. 2003, 46, 288–309. [Google Scholar] [CrossRef]
- Rossano, L. Hyogo framework for action 2005–2015: Building the resilience of nations and communities to disasters. In Proceedings of the World Conference on Disaster Reduction, Kobe, Japan, 18–22 January 2005. [Google Scholar]
- China Seismological Bureau. Standards of Earthquake Emergency Shelter and Related Facilities; China Seismological Bureau: Beijing, China, 2008. (In Chinese)
- The Planning of Comprehensive Disaster Prevention and Shelter in the Wuhan Urban Development Area. Available online: http://www.wpdi.cn/nry.aspx?pageid=14&menuid=16 (accessed on 20 December 2014). (In Chinese).
- Ministry of Civil Affairs of the People’s Republic of China. The Promotion of Constructing of Urban Community Across the Country; Ministry of Civil Affairs of the People’s Republic of China: Beijing, China, 2000. (In Chinese)
- What is the Principle of Dividing the Community? Available online: http://www.hbmzt.gov.cn/sqmy/201103/t20110318_95296.shtml (accessed on 5 May 2017). (In Chinese)
- Tianjin Construction Management Committee. Standard for Public Facilities of Urban Residential District of Tianjin; Tianjin Construction Management Committee: Tianjin, China, 2008. (In Chinese)
- Hangzhou Planning Bureau. Supporting Regulations for Public Service Facilities in Urban Planning of Hangzhou; Hangzhou Planning Bureau: Hangzhou, China, 2009. (In Chinese)
- Qingdao Planning Bureau. Sandard and Guideline for Public Service Facilities in Urban Planning of Qingdao; Qingdao Planning Bureau: Qingdao, China, 2010. (In Chinese)
- Chongqing Planning Bureau. Guidelines for Public Service Facilities in Urban and Rural Planning of Chongqing; Chongqing Planning Bureau: Chongqing, China, 2008. (In Chinese)
- Chongqing Planning Bureau. Standard for Public Service Facilities Setting in Residential Area of Chongqing; Chongqing Planning Bureau: Chongqing, China, 2005. (In Chinese)
- Wuhan Transport Survey Weekly. Available online: http://www.whtpi.com/News/11.html (accessed on 5 May 2014). (In Chinese).
- Zhang, Y.; Zheng, L.; Gao, J. Earthquake prevention planning: A case study of Xichang. Plan. Forum 2011, 27, 19–25. (In Chinese) [Google Scholar]
- Higgs, G.; Fry, R.; Langford, M. Investigating the implications of using alternative GIS-based techniques to measure accessibility to green space. Environ. Plan. B Plan. Des. 2012, 39, 326–343. [Google Scholar] [CrossRef]
- Boone, C.G.; Buckley, G.L.; Grove, J.M.; Sister, C. Parks and people: An environmental justice inquiry in Baltimore, Maryland. Ann. Assoc. Am. Geogr. 2009, 99, 767–787. [Google Scholar] [CrossRef]
- La Rosa, D. Accessibility to greenspaces: GIS based indicators for sustainable planning in a dense urban context. Ecol. Indic. 2014, 42, 122–134. [Google Scholar] [CrossRef]
- Geza, T. The application of gravity model in the investigation of spatial structure. Acta Polytech. Hung. 2014, 11, 5–19. [Google Scholar]
- Crooks, V.A.; Schuurman, N. Interpreting the results of a modified gravity model: Examining access to primary health care physicians in five Canadian provinces and territories. BMC Health Serv. Res. 2012, 12, 230. [Google Scholar] [CrossRef] [PubMed]
- White, N.; Mengersen, K. Predicting health programme participation: A gravity-based, hierarchical modelling approach. J. R. Stat. Soc. 2016, 65, 145–166. [Google Scholar] [CrossRef] [Green Version]
- Yao, J.; Murray, A.T.; Agadjanian, V. A geographical perspective on access to sexual and reproductive health care for women in rural Africa. Soc. Sci. Med. 2013, 96, 60–68. [Google Scholar] [CrossRef] [PubMed]
- Chang, H.S.; Liao, C.-H. Exploring an integrated method for measuring the relative spatial equity in public facilities in the context of urban parks. Cities 2011, 28, 361–371. [Google Scholar] [CrossRef]
- Omer, I. Evaluating accessibility using house-level data: A spatial equity perspective. Comput. Environ. Urban Syst. 2006, 30, 254–274. [Google Scholar] [CrossRef]
- McGrail, M.R.; Humphreys, J.S. Measuring spatial accessibility to primary care in rural areas: Improving the effectiveness of the two-step floating catchment area method. Appl. Geogr. 2009, 29, 533–541. [Google Scholar] [CrossRef]
- Luo, W.; Wang, F. Measures of spatial accessibility to health care in a GIS environment: Synthesis and a case study in the Chicago region. Environ. Plan. B Plan. Des. 2003, 30, 865–884. [Google Scholar] [CrossRef]
- Saaty, T.L. How to make a decision: The analytic hierarchy process. Eur. J. Oper. Res. 1990, 48, 9–26. [Google Scholar] [CrossRef]
- Zhou, M.; Fan, Y.D.; Yang, S.Q. Natural Disaster Risk Management and Early Warning System; Science Press: Beijing, China, 2010; pp. 20–25. (In Chinese) [Google Scholar]
- Bish, D.R. Planning for a bus-based evacuation. OR Spectr. 2011, 33, 629–654. [Google Scholar] [CrossRef]
- Agent-Based Transport Simulations Matsim. Available online: http://www.matsim.org/ (accessed on 13 November 2016).


| Rescue Facilities | Service Capacity (in Persons) |
|---|---|
| Medical rescue facility | |
| Comprehensive hospital | 120,000 |
| Specialized hospital | 60,000 |
| Community hospital | 20,000 |
| Security maintenance facility | 120,000 |
| Goods supply facility | 80,000 |
| Hierarchy | Effective Width (m) | Segments | Vehicle Speed | Walking Speed | |
|---|---|---|---|---|---|
| Non-Peak Hours | Peak Hours | ||||
| Main Road | >15 | 1569 | 50 | 25.5 | 5 |
| General Road | 12–15 | 753 | 40 | 20.8 | 5 |
| Branch Road | 8–12 | 3976 | 30 | 15 | 5 |
| Paved Road | <8 | 4134 | 20 | 10 | 5 |
| Total | Quadrant I | Quadrant II | Quadrant III | Quadrant IV | |||||
|---|---|---|---|---|---|---|---|---|---|
| Total | 414 | 230 | 55.56% | 27 | 6.52% | 142 | 34.30% | 14 | 3.62% |
| RA1 | 17 | 2 | 11.76% | 1 | 5.88% | 15 | 88.24% | 0 | – |
| RA2 | 48 | 3 | 6.25% | 8 | 16.67% | 33 | 68.75% | 4 | 8.33% |
| RA3 | 199 | 87 | 43.72% | 13 | 6.53% | 87 | 43.72% | 10 | 6.03% |
| RA4 | 150 | 138 | 92.00% | 5 | 3.33% | 7 | 4.67% | 0 | – |
| Public Security Facility | Goods Supply Facility | Medical Rescue Facility | ||||
|---|---|---|---|---|---|---|
| Peak hours | Non-peak hours | Peak hours | Non-peak hours | Peak hours | Non-peak hours | |
| RA1 | 0.29 | 0.28 | 3.77 | 3.49 | 24.28 | 23.15 |
| RA2 | 0.44 | 0.45 | 4.56 | 4.24 | 24.52 | 23.37 |
| RA3 | 0.19 | 0.18 | 2.64 | 2.46 | 16.71 | 15.76 |
| RA4 | 0.07 | 0.08 | 1.02 | 0.93 | 8.77 | 8.21 |
© 2017 by the authors. Licensee MDPI, Basel, Switzerland. This article is an open access article distributed under the terms and conditions of the Creative Commons Attribution (CC BY) license (http://creativecommons.org/licenses/by/4.0/).
Share and Cite
Gong, J.; Liu, Y.; Liu, Y.; Huang, P.; Li, J. Evaluating the Evacuation and Rescue Capabilities of Urban Open Space from a Land Use Perspective: A Case Study in Wuhan, China. ISPRS Int. J. Geo-Inf. 2017, 6, 227. https://0-doi-org.brum.beds.ac.uk/10.3390/ijgi6070227
Gong J, Liu Y, Liu Y, Huang P, Li J. Evaluating the Evacuation and Rescue Capabilities of Urban Open Space from a Land Use Perspective: A Case Study in Wuhan, China. ISPRS International Journal of Geo-Information. 2017; 6(7):227. https://0-doi-org.brum.beds.ac.uk/10.3390/ijgi6070227
Chicago/Turabian StyleGong, Jie, Yaolin Liu, Yanfang Liu, Pujiang Huang, and Jiwei Li. 2017. "Evaluating the Evacuation and Rescue Capabilities of Urban Open Space from a Land Use Perspective: A Case Study in Wuhan, China" ISPRS International Journal of Geo-Information 6, no. 7: 227. https://0-doi-org.brum.beds.ac.uk/10.3390/ijgi6070227