2. Literature Review
An ecosystem can be understood as “a system of people, practices, values and technologies in a particular local environment” [
15]. The concept of a data ecosystem has seen growing use in research on data driven government and datafication in general. Originally a biological term, the ecosystem metaphor conveys “an evolving, self-organizing system of feedback and adjustment among actors and processes” [
16]. There are various ecosystem analogies (digital ecosystem, business ecosystem, open government ecosystem etc.) but they are essentially comparable and all focus on understanding interrelationships and interdependencies between agents and entities [
17] which produce systemic change. An ecosystem has certain properties, such as cyclical nature, dynamism, evolution, sustainability, demand-supply relationship and embeddedness in a local [
17,
18]. To facilitate the development of an (open government) ecosystem, the following strategies can be employed [
18]: (1) identifying the people and organizations that act as essential components of the ecosystem; (2) understanding the nature of the transactions that take place between those entities; (3) recognizing what resources are needed by each entity in order to engage with each other in transactions of value; and (4) observing the indicators that signal the relative health of the ecosystem as a whole. In general, (open data) ecosystems can be seen as composed of a number of elements, such as participants, data resources and tools, design, context and interdependencies and interactions [
19]. Oliveira and Lóscio [
20] introduce a quadruple to formalize an (open) data ecosystem in terms of the different actors, their resources and roles and the relationships existing between them. It is possible to apply Capability Maturity Models to data ecosystems as an evaluative and comparative basis from which evolutionary pathways towards increased maturity can be designed [
21], but this work is still in its early stages. A more technical perspective focuses on the role data infrastructures can play in terms of curating and sharing data among stakeholders. Data transmission standards and tools, such as Statistical Data and Metadata eXchange (SDMX) and web Application Program Interfaces (APIs) can play a role for the collection and exchange of SDG data [
22] or spatial data across countries such as with the Infrastructure for Spatial Information in Europe (INSPIRE). Data infrastructures are key in integrating data from different sources and supporting various data initiatives [
23]. When data is or is related to geoinformation, developing a spatial data infrastructure (SDI) is crucial. Makanga and Smit [
24] reviewed the status of implementation of SDIs in Africa and found that often the SDI activities on the continent are informal, lack adequate funding and satisfactory stakeholder participation. This generally results in immature SDIs in most countries in Africa.
Specifically, as concerns data ecosystems in the context of SDGs monitoring, the literature is emerging and the knowledge about the elements characterizing such a data ecosystem is fragmented. There is a handful of reports [
25,
26] which use ad hoc approaches to characterize data ecosystems to trace the progress of SDGs in developing countries. For instance, the Data Pop Alliance [
27] proposed a view of big data ecosystem for SDGs as comprised of three Cs: “crumbs” (passively collected data), capacities (human and technical capacities to analyse these data) and communities (new kind of actors involved). In the academic literature, there has been several parallel efforts to conceptualize and characterize data ecosystems for SDGs or, more broadly, for data for public good. Feiring et al. [
28] propose a concept of a “pluralistic data ecosystem,” however they mainly discuss different actors and data sources that should be involved and key principles that should be adhered to in the data exchange. One can also segment a data ecosystem into data collaboratives, that is, cross-sector (and public-private) collaboration initiatives aiming at data collection, sharing, or processing for the purpose of addressing a societal challenge [
14]. Susha et al. developed a taxonomy to characterize the data supply and data demand side of a data collaborative. This framework is represented as a classification which describes different configurations of data collaboratives based on who the participants are, what type of data is exchanged, what the goals are, what the data sharing arrangement looks like and so forth. Due to its comprehensiveness, we choose this framework as a starting point in our study. We added incentive to share data as this was not a distinguishing characteristic for a data collaborative, but it is among actors in a data ecosystem. Haak et al. [
29] developed a framework of criteria for a successful data ecosystem specifically for humanitarian purposes, including data supply, user characteristics and governance criteria. The framework of Haak et al. describes in more detail additional elements of a data ecosystem not explicitly covered in the work of Susha et al., such as data governance and data infrastructures. Further insights into the data supply dimension can be drawn from the work of van den Homberg et al. [
30] who proposed a characterization of data based on the criteria of (1) cost of data extraction and (2) quality of the dataset. The cost of extracting data from the dataset can be low (for structured datasets) or high (for unstructured). The quality of the dataset is determined by its timeliness, source reliability, content accuracy and granularity. We therefore choose to consolidate them to serve as a basis for our data ecosystem framework.
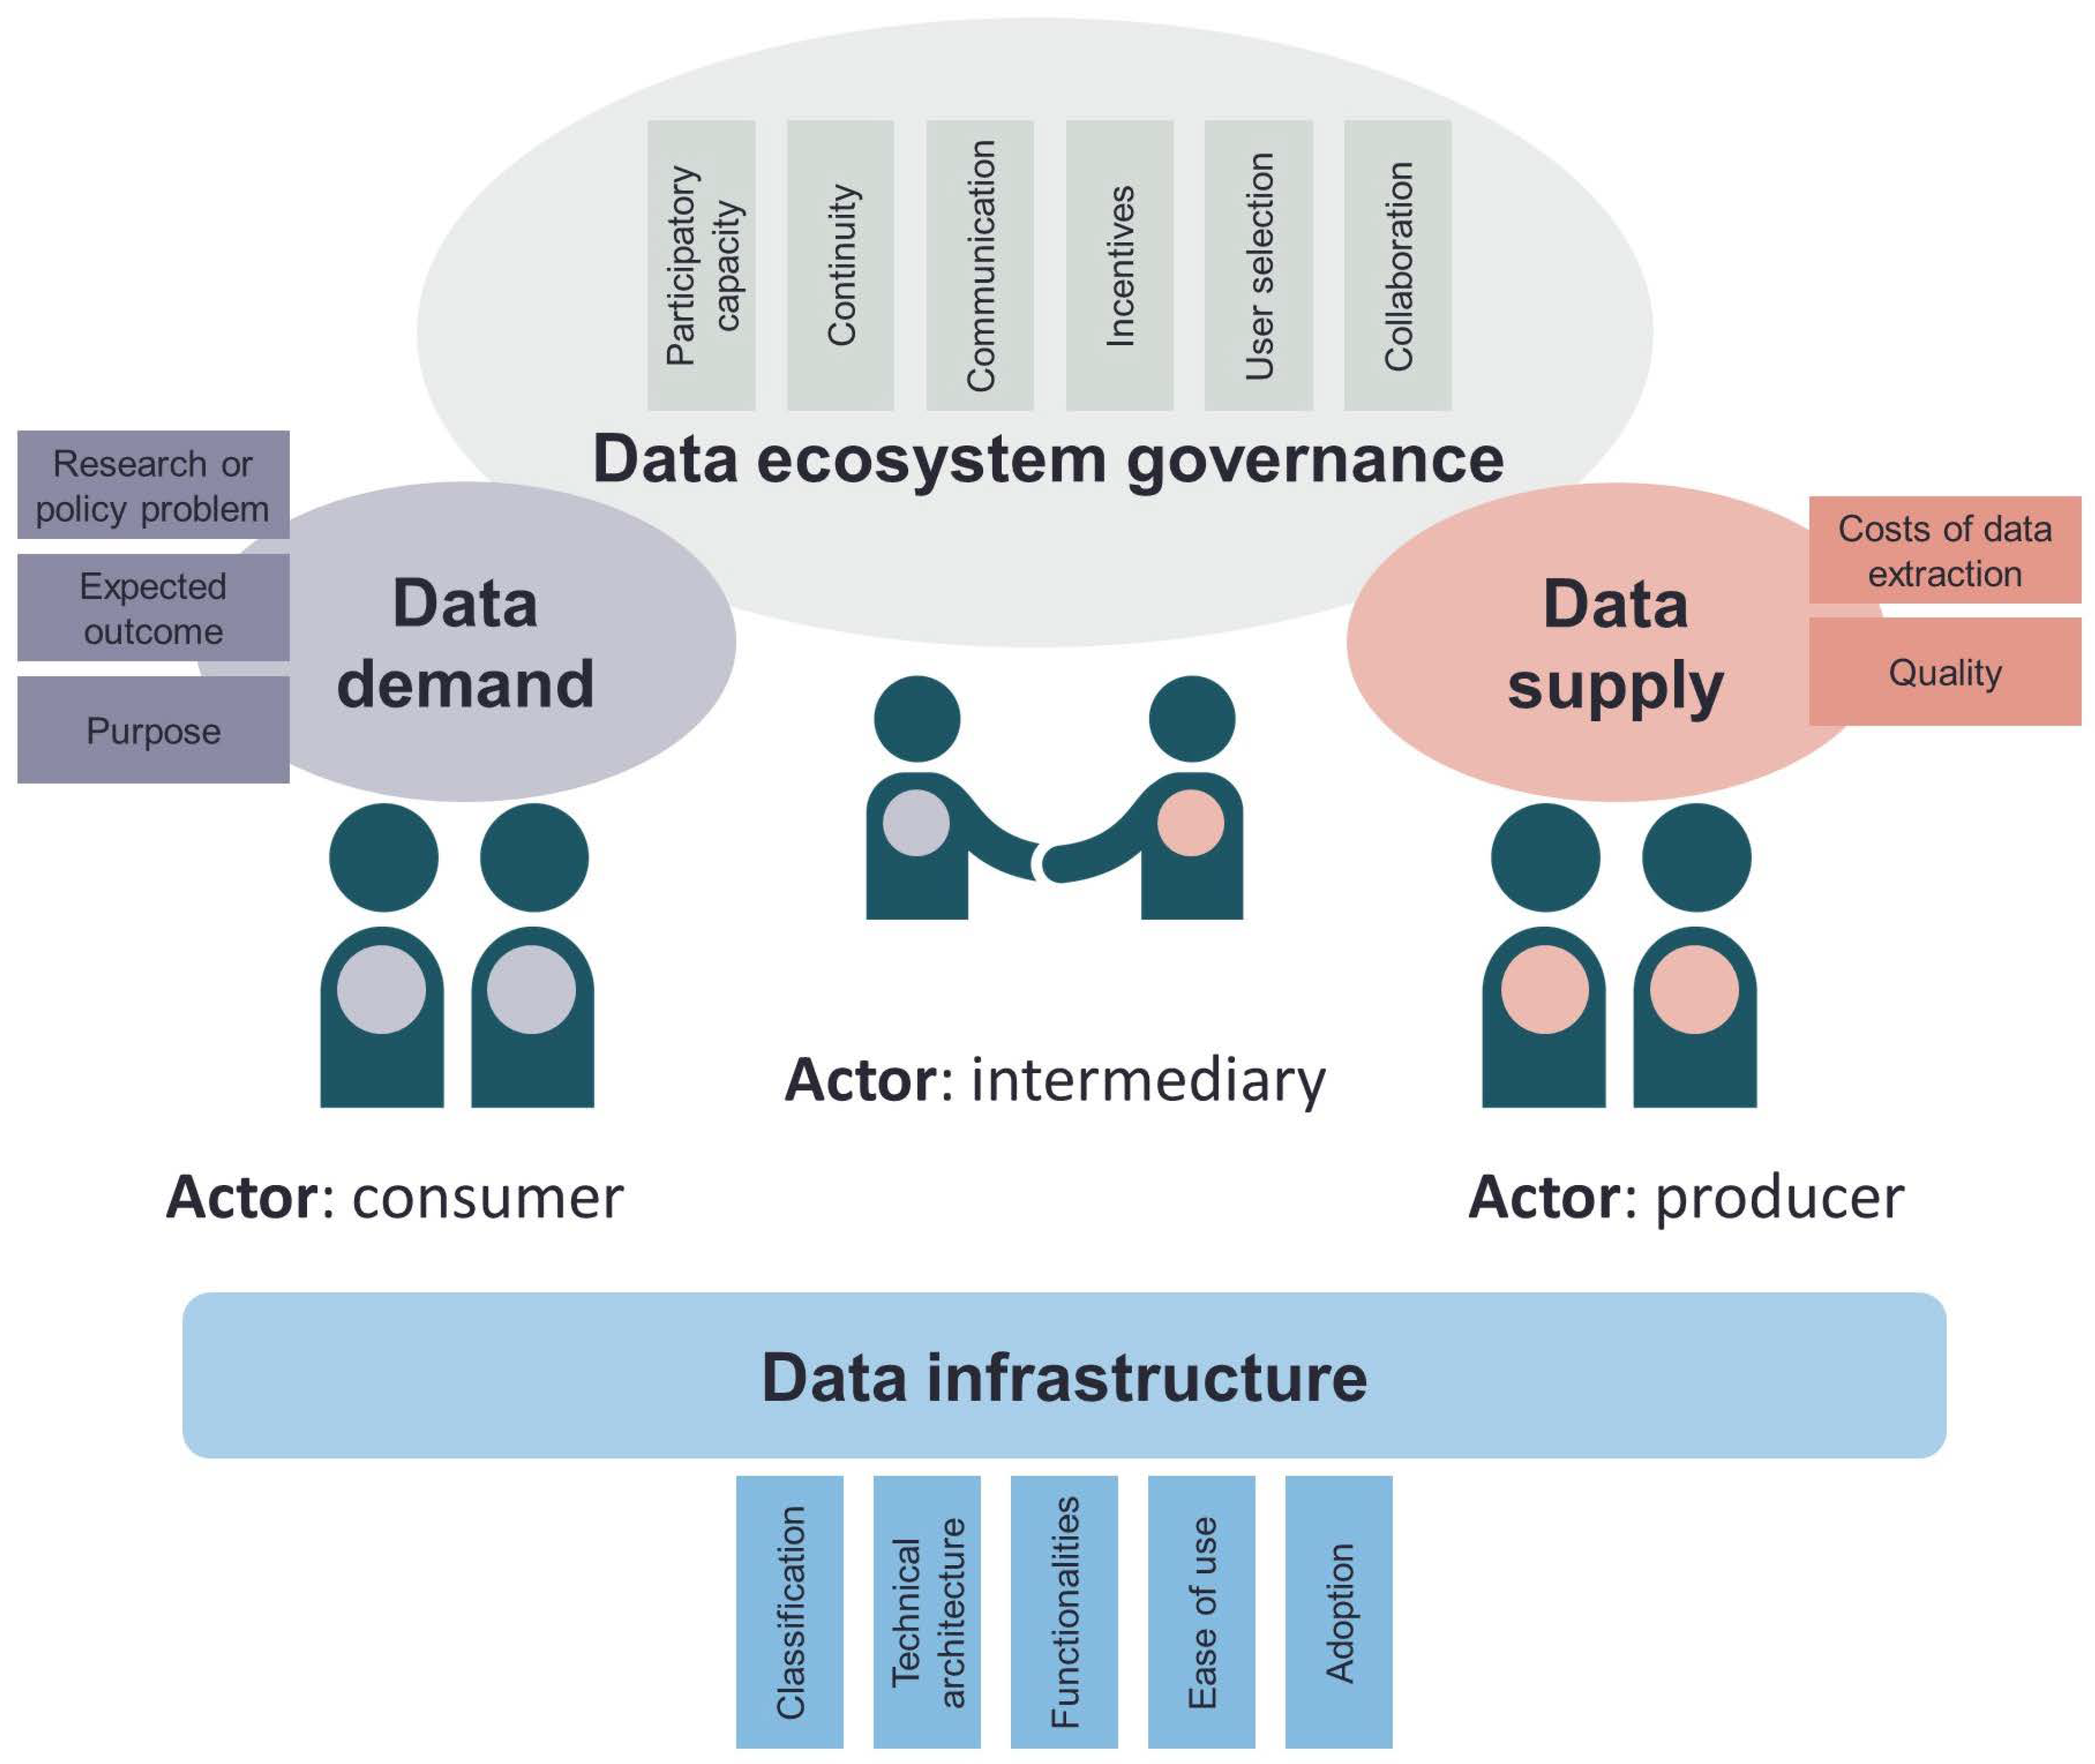
An Integrated Data Ecosystem Framework
Figure 1 and
Table 1 present an integrated framework to characterize data ecosystems which combines the relevant existing frameworks [
14,
29,
30] and further details and elaborates on additional elements. The framework is structured around five dimensions: actors, data supply, data infrastructure, data demand and data ecosystem governance, whereby each dimension has different indicators. Below we describe each dimension and explain how we can characterize them qualitatively. For the data supply dimension, we go one step further as we also explain how to quantitatively score the indicators of this dimension. This will enable us to answer the second objective of our research.
The actor and role dimension describe the actors and the roles they can have as producer, consumer and/or intermediary [
20]. IASC defines three categories of organizations when it comes to how datasets are governed [
31]:
Guardian is responsible for facilitating distribution of datasets and information products (in emergencies for example).
Sponsor is responsible for identifying and liaising with relevant sources to analyse, collate, clean and achieve consensus around a specific dataset or information product.
Source: Designated source or owner of a dataset, fully responsible for the development, maintenance and metadata associated with a dataset and control distribution restrictions.
Where the first two are intermediary roles and the last one is a producer role. The different actors have relationships with one another, meaning that they interact -often based on a common interest- by for example exchanging data or other types of resource through transactions [
20]. In a mature data ecosystem, most data sources will have an associated sponsor and guardian, meaning basically that a data producer has relationships with other actors including users. In immature data ecosystems, data producers might be not well networked.
The data supply dimension captures the characteristics of available data in terms of quality and costs of data extraction. Quality includes timeliness, source reliability, content accuracy and granularity [
30] and spatial coverage. In
Table 2 we describe the scoring of these characteristics. Timeliness is determined by the date of the source and the retention period. We use a score of one when date of the source falls within the retention period and 2 when outside. Source reliability covers the reliability of the data source, describing the authenticity, trustworthiness or competency [
32]. UNISDR proposed a weighting that considers whether the methodology used to get risk information and data was based on the most scientific approach possible, the product of a national consultation and the responsibilities in terms of decision making, planning and storing data [
33]. We used a rating between 1 (reliable) and 6 (cannot be judged). Content accuracy describes whether the data is confirmed by other independent sources; logical in itself; consistent with other information on the subject [
32]. We used a similar rating between 1 (confirmed) and 6 (cannot be judged). Usually, a more reliable data source has also more accurate data, but it is possible that a reliable data source does not provide very accurate data given limitations in measurement equipment for example. Granularity refers to up to which administrative level a data set is available and spatial coverage refers to whether this the case for the whole country or only for parts of the country. Granularity is scored between 1 (data is at available at water point location level) via the different administrative levels up to 5 (national level). Spatial coverage is scored between 1 (country level) and 4 (one or more admin-3 levels covered). We note that we did not include spatial resolution as an additional characteristic as it would only be relevant for the location attribute of a water point; for which it would be the accuracy of a typical GPS measurement. We used the terminology costs to characterize the structuredness of the data as well as the degree of access to data. Structuredness varies from 1 (data is provided ready to use) to 4 (data is not usable). Degree of access ranges from 1 (open data/unrestricted access) to 4 (no access). Costs should not be taken literally as actual costs being made, but as a way to characterize the resources and degree of effort a data user would have to put into making use of the data that is supplied. Costs increase as the data is difficult to find, is of different quality, hard to combine, is not open, is hosted at different infrastructures [
34].
The data infrastructure dimension focuses on the characteristics of the data infrastructure used to provide access to the data. Kitchin [
35] defines a data infrastructure as the institutional, physical and digital means for storing, sharing and consuming data across networked technologies. The simplest data infrastructure is a data holding, where a data provider has an informal collection of data files on a personal computer. Next step is when an organization creates a data archive, catalogue, repository or portal, followed by a single-site or multiple-site repository up to cyber-infrastructures. Institutional characteristics of the data infrastructure will be very basic if we deal with a data holder but become more complex once we go towards the multiple-site repositories. Steudler et al. [
36] give evaluation and performance indicators to assess spatial data infrastructure initiatives. Reference models for these more advanced data infrastructures [
37] give guidelines for example for administrative responsibility, organizational viability, financial sustainability, technological and procedural suitability, system security and procedural accountability. We note that institutional characteristics overlap with some of the indicators under the data ecosystem governance dimension and we choose to describe them as part of this dimension. As we focus on the data use perspective, we selected the following indicators to describe data infrastructures: classification of the infrastructure, technical architecture, functionalities, ease of use and adoption.
The data demand dimension captures the research or policy problem to be addressed with the data, the expected outcome of data use and the purpose of data use. Whereas the data supply dimension focuses on data provision and captures which relevant data exists in the ecosystem, the data demand dimension focuses on data use and captures the expected output in terms of closing a certain information gap within a given problem. A specific problem means that the data user has a clear objective in mind as to what he/she wants to do with the data. This is for example the case for if the government wants to use the data for an investment plan. In the case of an unspecific problem, the user demands the data for example for innovative or research purposes. The expected outcome relates to the problem addressed. If it is a policy problem, the expected outcome can be a needs-based investment plan or to monitor (such as for the SDG reporting). But outcomes can also be data science or data-driven innovation. Purpose of data use can be in line with the reason why it was collected (primary use, for example, for monitoring), but it can also be similar (secondary use) or different (tertiary use). Lastly, purpose of data use can also be creating a data product or service for end users, such as an interactive map or visualization, enabling end users to easily explore the data.
The data ecosystem governance comprises the framework of policies, processes and instruments to realize common goals in the interaction between entities [
29]. The different elements we selected were participatory capacity, continuity of collaboration between users and suppliers, communication, incentive to share and use data, user selection and collaboration among data users. Participatory capacity means that the actors require certain capacities to be able to participate in an ecosystem [
29]. A match between data supply and demand drives participation. Incentives to share and to use data should align as much as possible. Data ecosystems are dynamic systems, whereby continuity of collaboration is primordial. Communication refers to enabling and stimulating a collaborative and interactive environment between stakeholders. User selection focuses on the process of granting access to data (whereas the characteristic degree of access focuses on how much is being opened).
3. Materials and Methods
The research is part of The Global Partnership for Sustainable Development Data (GPSDD) funded “Building a Data Collaborative to support SDGs on Health and WASH in Democratic Republic of Congo (DRC) and Malawi” project. The project consortium consists of the Malawi Red Cross Society (MRCS), CartONG and the 510 data initiative of The Netherlands Red Cross (lead). We use an interpretive case study approach as methodology to reach our objectives of evaluating the integrated framework presented in
Table 1 and identifying alternative data sources.
3.1. Case Study Selection
Malawi and DRC were selected from an initial subset of low income and data poor countries, given the in-country networks of the Red Cross, support by governmental organizations and ongoing data-driven projects. Focus for this research is on Malawi as the implementation of the project was more advanced than in DRC and given strong commitment from the National Statistics Office. We take a country-wide approach and do not zoom in on specific areas. In terms of SDGs, WASH was selected as there are many WASH related interventions in Malawi and given that data for WASH has an important geospatial component. Most countries perform a contextualization and prioritization of the different SDGs in relation to the national strategy and planning processes, thereby limiting the number of targets and indicators. The organization responsible for reporting on the SDGs can subsequently do a baseline of data available on these indicators. In Malawi, the NSO left out the 83 indicators of tier 3, as the metadata is still under development by the SDG secretariat at UN [
38]. They completed an initial draft SDG baseline survey mid-2017 for 103 indicators, with information on items such as method of computation, level of disaggregation, baseline data availability, means of verification and frequency of reporting. In this baseline, the provenance of data on SDGs is almost 100% from governmental census and survey data. In total the Malawi Survey Programme 2008–2018 contains 19 different surveys and censuses [
39]. The WASH SDG has five indicators in relation to waste management and transboundary basins that are part of tier 3. These indicators are hence not included in the case study. For the other WASH SDG indicators, the baseline showed that information on the Validation process is missing. This analysis, in combination with the fact that Open Mapping is very well suited for WASH key objects of interest (such as water points and sanitary facilities) led us to focus the case study on WASH. We selected one of the SDG WASH indicators, that is, 6.1.1. (Proportion of population using safely managed drinking water services), during the scoping of the technical field pilot session in the barrier workshop. It should be measured by the proportion of population using an improved basic drinking water source which is located on premises, available when needed and free of faecal (and priority chemical) contamination [
40]. Our focus is on rural water points as rural access to water is much lower and rural access is almost always through public infrastructure [
41].
3.2. Data Collection
Data collection as part of the case study consisted of workshops, questionnaires, consultations and desk research. In addition, official letters were sent to a few actors to request access to data. Inception and barrier workshops were organized. The main objective of the inception workshop was to make an inventory of actors, the data they hold and the data they would like to have with a special emphasis on WASH. The inception workshop in Malawi was organized in close collaboration with the Malawian NSO. The barrier workshop focused on making an overview of technical, commercial, legal and organizational barriers to data sharing, especially between Open Mapping initiatives and the government and aimed at scoping a technical field pilot. The workshops consisted of plenary presentations, lightning talks and focus group discussions during which also questionnaires were used. The one-day inception and one-day barrier workshop in Malawi were held at a three-month interval, with respectively 60 and 35 participants. Prior and in between these workshops, the research team consulted with a variety of stakeholders (among these stakeholders were the Department of Economic Planning and Development, United Nations Children’s Fund (UNICEF) and United Nations Development Programme (UNDP), the Department of Surveys, Ministry of Health, Department of Disaster Management Affairs (DoDMA) and the World Bank) individually in-country to inform them of the project initiative, learn about their ongoing efforts, to ask for their contribution in the workshops and in some cases to ask if they would be willing to share their data. In this way, a representative group of people from different stakeholders, that is, Government, UN, Red Cross Movement and Academia, was selected. Donors and private sector were not invited but a few were consulted with separately. Participants either had a directly data-related position (statistician, GIS or data expert, Planning, Monitoring Evaluation and Reporting (PMER) officer) or a management related role in which data management aspects were important such as a disaster management officer. Two persons from the research team facilitated the workshops in Malawi and synthesized all the outcomes of the workshops into an inception report, list of actors and their data, data visualizations of the ecosystem and a list of barriers. These results were validated through desk research as well as a review by a selected group of participants and one reviewer from GPSDD. We used these reports, the consultations and additional desk research to fill in the data ecosystem framework. The desk research consisted of a policy analysis of the WASH related policies at global, national and local level. Preliminary results were also presented at the Water sector Monitoring and Evaluation meeting organized by the Sanitation and Water for All Task Force and the Ministry of Agriculture, Irrigation and Water Development (MoAIWD).
4. Results
4.1. Political Economy Analysis of Water Supply Policies and Programming in Malawi
Before we describe the results for the five dimensions of our data ecosystem framework, we characterize the political economy context for water supply in Malawi. We combine a political economy analysis (PEA) with a water governance framework, referring to “the system of actors, resources, mechanisms and processes which mediate society’s access to water” [
42]. We used several insights from [
41] as well as our own data collection means as explained in
Section 3.2.
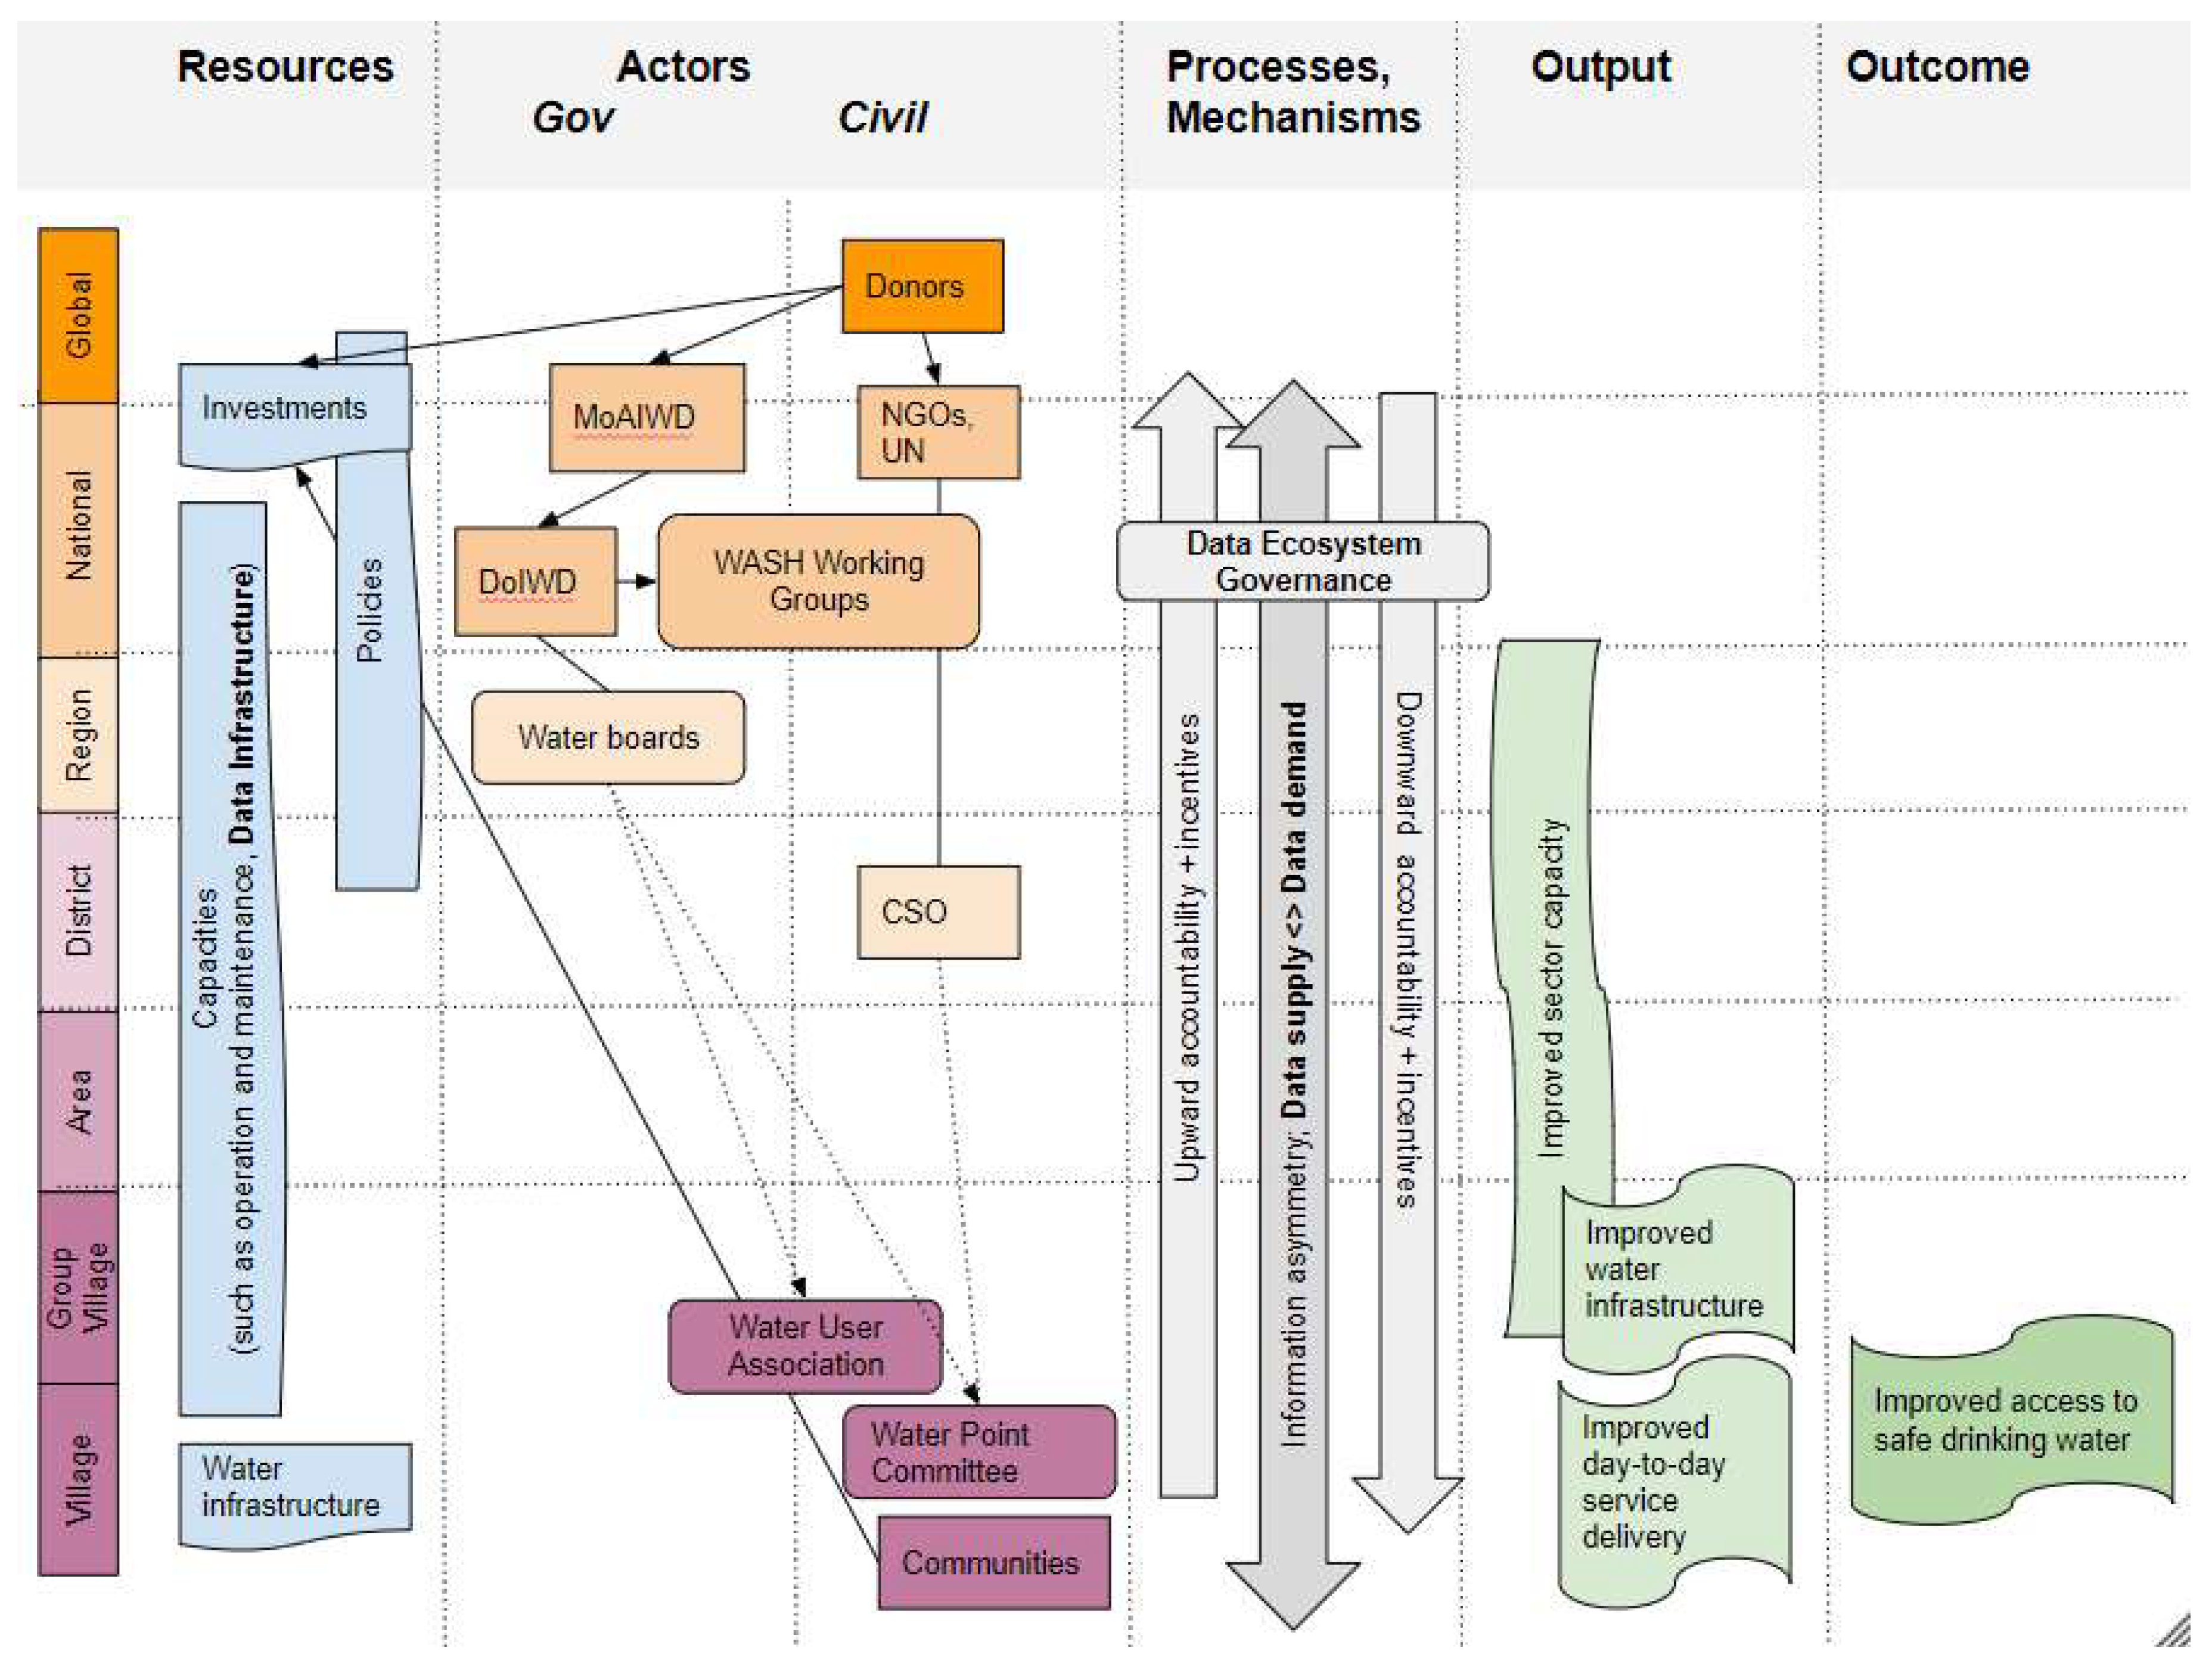
Figure 2 shows -from left to right- how resources, actors, processes and mechanisms result in output and outcome. It distinguishes between the different global, national and local levels. Resources consist of policies, investments, capacities and infrastructure.
The Malawi Growth Development Strategy III (MGDS III) [
43] and the National Water Policy 2005 [
44] are key policy documents that provide high level objectives to the sector. However, the National Water Policy is outdated and, according to Battle and Mambulu [
45], there was little consultation of WASH sector stakeholders during the development of the MDGS III. The high level of the policies in combination with low awareness of these national policies among these actors has led to different implementation approaches. In 2010, the MoAIWD published Implementation Guidelines for Rural Water Supply and sanitation [
46] with the aim to harmonize and standardize approaches for carrying out these services.
Donors play a very important role in terms of investments. The Malawi Economic Justice Network [
47] showed that 86% of MoAIWD expenditures is funded by donors, whereby the MoAIWD controls 97% of the WASH funding [
41]. No detailed information is available about NGO budgets for WASH, but this could account for up to 75% of sector spending [
48]. Despite these considerable donor funding streams, there is still a significant water infrastructure funding gap, which can amount to up to 1.8% of GDP for Sub-Saharan Africa. Moreover, spending on WASH per capita is about twenty times higher for urban than for rural areas, allocations of budgets to districts is minimal and funding tends to go to constructing new water points instead of to ongoing operation and maintenance, especially for project-driven NGO interventions [
41]. This has led to insufficient capacity development and about 30% of the water point infrastructure that is not functioning well [
49]. Overall, we can conclude that financing is inadequate in terms of both quantity and quality (targeting areas and citizens in an equitable way) [
41].
In terms of actors, the MoAIWD is officially responsible for water supply as a public service in Malawi. The MoAIWD includes the Department of Irrigation and Water Development (DoIWD), whose vision is ‘water and sanitation for all, always and prosperity through irrigation.’ This department is broken down in four smaller ‘technical departments,’ including the Water Supply Department. On a regional scale, water provision in urban areas is provided by Malawi’s five Water Boards, one in each of the three regions (North, Central and South) and one in Blantyre and Lilongwe. These Water Boards supervise the water supply in towns and urban centres, mostly by piped systems. More decentralized, there are Water User Associations (WUAs) and Water Point Committees (WPCs). WUAs are legal entities and work as small Water Boards at community level, for instance by the supply of water through operating water kiosks. They operate mostly in urban areas, whereas WPCs operate in rural areas. WPCs Water Point Committees (WPCs) consist of five to ten persons elected from user households being served by a specific water point [
46]. Its responsibilities are both technical -maintaining and repairing the water point- and financial collecting and saving community contributions so that funds are available for maintenance and repairs [
41].
The important role of WPCs in ensuring sustainability of water points is in fact, as Chowns [
41] shows convincingly, an offloading of MoAIWD’s responsibility for a public service provision to communities. This is illustrated in
Figure 2 by the arrow going sideways from the water boards in the governmental column to the WPCs in the civil column as well as by the arrow showing that communities must invest themselves.
In terms of processes and mechanisms, incentives in relation to up- and downward accountability are key to understand [
50]. Exogenous incentives drive key processes. Donor time tables and project logic can lead to over-investment in short term outputs (as explained before in terms of investing more in building a water point than in maintaining it) [
41]. Similarly, devolving of responsibilities and budget to lower governmental levels is in place on paper, but is implemented in reality only to a very limited extent. Endogenous incentives can lead to non-functioning of democratically constructed and participatory WPCs, as local long-standing clientelism patterns prevail. The interaction between the introduced, exogenous bureaucratic interventions through the WPC and NGO projects with existing, endogenous socially embedded processes and institutions leads to what is called institutional bricolage [
51]. Civil society failure manifests itself in terms of WPCs that are unable to act collectively to reach a feasible and preferable outcome in terms of operation and maintenance of water supply. One of the underlying causes are information asymmetries. Information asymmetries exist between the different levels and actors involved as well as within one level (such as within communities). For example, district water officers often do not know which water points need repair. Donors do not know enough about long-term sustainability or cost- effectiveness of their investments in the sector. Water users do not know how much has been spent on providing services to them. These information gaps mean that it is very hard for citizens to hold the state accountable for service provision or for donors to know how cost-effective their grants have been [
41]. The gaps are also caused by a lack of funding and data capacity at especially lower administrative levels. District staff are not held accountable for having data and efforts to develop monitoring systems at district level only function so long as there is external funding [
52]. This also hampers the development and adoption of data infrastructure(s). As we will show later, these information asymmetries and capacity gaps are directly reflected in the mismatch between data supply and demand in the data ecosystem.
Overall, the political and economy analysis shows that both government and donors have offloaded (part of the) responsibility for water supply as a public service to a community management approach in the form of WPC. This abdication of state responsibility evokes institutional bricolage and civil society failure and negatively impacts the data ecosystem.
4.2. Actors and Roles
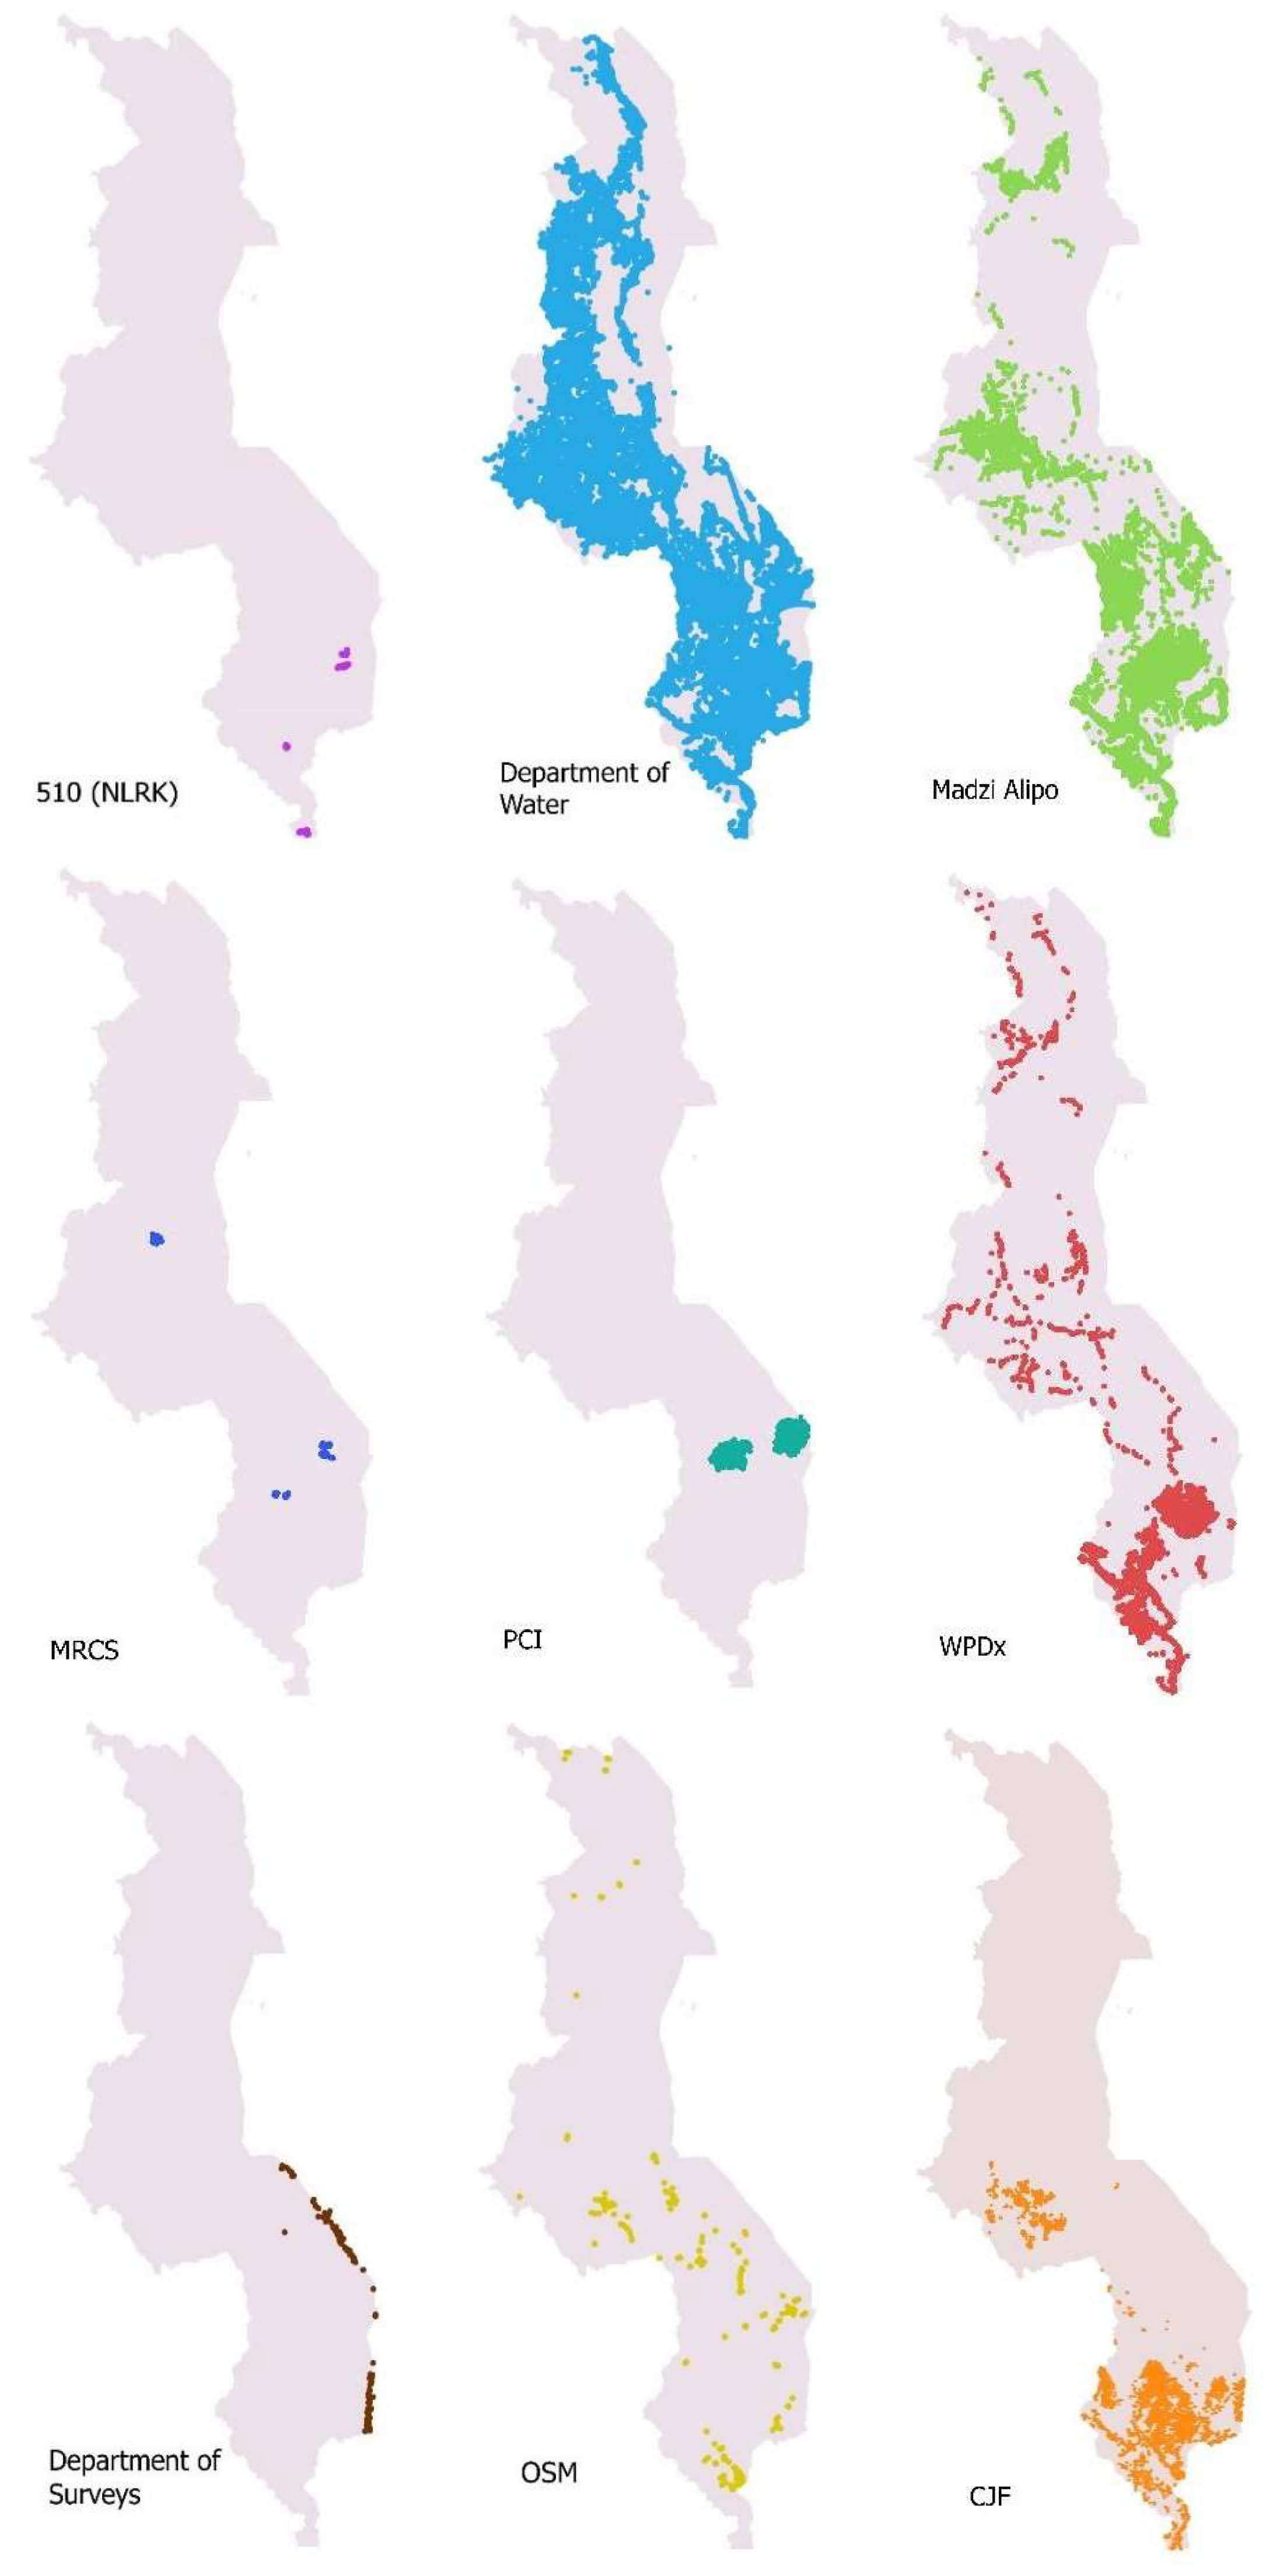
Several of the actors in the WASH sector as introduced high-level in the previous section—as well as some actors from outside the sector—play a role as a data producer, consumer or intermediary. As the WASH data ecosystem in Malawi is immature, we could identify several only loosely coupled (or not coupled at all) networks around an actor. There are two main categories. One category is when a data provider produces data on water points for own use and has no intermediary actor (guardian or sponsor) and data infrastructure associated. The second category is when there is an intermediary that brings together and distributes data from other data producers (and in some cases also their own data) through a data infrastructure. It is important to realize the differences in the database volume; for example, data producers MRCS and 510 have up to 150 waterpoints each, data producer DoIWD 48,555, whereas the intermediary Fishermen’s rest has 23,633 water points on its data infrastructures (the multi-site repository Madzi Alipo). To describe, these subnetworks, that together span the WASH ecosystem, we use for each subnetwork (the top row in
Table 3) either the name of the data producer or the name of the data infrastructure if there is an intermediary.
Most of these governmental organizations have data on water points, since they are responsible for the provision of safe (drinking) water. However, most of this data is not accessible to people outside these organizations. Apart from the governmental actors above, that are directly involved in water supply service provisioning, there are also government agencies that play a role from the data perspective. The National Statistics Office in Malawi (NSO) provides the baseline data for the SDGs, including SDG 6.1.1. In 2015–2016, the large-scale Demographic Health Survey (DHS) was conducted. This survey provided insight in the current state of rural, urban and overall water supply. According to the results of the DHS, 85% of rural households has access to improved drinking water sources, compared to 98% of urban households. Nationally, 87% of the total population uses an improved source of drinking water. The worldwide DHS program (as sponsored by USAID) makes several of the underlying datasets available upon registration. Our current understanding is however that the answers on survey questions in relation to access to water per household are not available with corresponding GPS coordinates as these coordinates are randomly displaced to ensure respondent confidentiality [
53]. The government of Malawi is working with the University of Strathclyde and the Government of Scotland through the Climate Justice Fund: Water Futures Programme on getting water asset management data using the mWater data platform. However, for our study we could only get access to an example dataset and not the full dataset, whereby the reasons for not opening up the dataset might be related to government accountability and protecting a unique position of the contractor. Apart from NSO, also the Department of Surveys (DoS) has a role in terms of data related to water points as their vision is to provide timely, accurate and reliable geospatial information for sustainable development. The department established the Malawi Geographic Information Council (MAGIC) and its executive arm, the National Spatial Data Centre (NSDC) in 2003. NSDC coordinates the acquisition and sharing of harmonized national digital spatial data sets among producers and users and assists in the development of the National Spatial Data Infrastructure (NSDI), linked to MASDAP. This is however still in its early stages as also the Land Survey Bill still has to be approved [
54].
In addition, several NGOs are active in WASH. Here, only those we obtained actual data from will be included. We will start with the intermediary actors that bring data together from a multitude of NGOs. The Water Point Data Exchange (WPDx) contains water point data for many, mostly developing countries, including Malawi. Organizations that contributed to the database in Malawi are Evidence Action, Mzuzu University, PDI-MCH PIMS, Water for People, Water Mission, Water Wells for Africa, World Vision US and WSSCC Survey. Besides these organizations, the WPDx also includes some, but not all, Madzi Alipo data. Madzi Alipo is a project from Fisherman’s Rest, an organization supporting community empowering projects. The Madzi Alipo project aims to provide access to safe drinking water through maintaining and repairing boreholes. This is done by monitoring the current state of the water supply in Malawi using the Madzi Alipo app and database. The app is used on mobile devices to quickly and conveniently log information on the location, working condition and maintenance history of tap and hand water pumps across Malawi and exports the collected data to the Madzi Alipo database. The water point information is dynamic (no shelving of data), with three monthly checks with a map showing the change in status. Besides data gathered by the Madzi Alipo team and its app, this database also includes data that is gathered by other organizations (Africacare, Atkins, Baseda, CADECOM Malawi, Center for Disease Control and Prevention, Christian Health Association of Malawi, Christian Services International, Community Recorded Sources, Danida, DFID, Evidence Action, Freshwater Malawi, GOAL, Médécins Sans Frontières, Malawi Government, MASAF Malawi Social Action Fund, Mission Rabies, Mlambe Project, MRCS, UNHRC, UNICEF, United Purpose, USAID, Water for People, Water Wells for Africa, World Vision and Water Supply and Sanitation Collaborative Council (CSSCC) Survey). The Humanitarian OpenStreetMap Team and the OpenStreetMap (OSM) communities also provided water point data in Malawi by mapping points of interest and utilities in OSM. In OSM, volunteers can, based on satellite imagery, map for instance roads, buildings, utilities and points of interest including water points. After this is mapped, it is checked and validated by more experienced volunteers, before it is published. Apart from these intermediary actors, a few individual actors have relevant data. Project Concern International (PCI) is a global development organization that has data mostly on the districts Balaka and Machinga. The Malawi Red Cross Society (MRCS) and the Netherlands Red Cross 510 data team have collected data on water points as part of Vulnerability and Capacity Assessments (VCAs). Despite the extensive inventory we did, we realize that there must still be other valuable data from organizations involved in drilling a borehole or repairing water wells in the past.
4.3. Data Supply
Table 4 gives an overview of the data supply dimension for the different data producers and data architectures identified in
Section 4.2. We used the scoring for each indicator as explained in
Table 2. The number of attributes is classified in five classes, where 9–11 attributes corresponds to class 1 and 0–2 attributes to a class of 5, so that also for the indicator number of attributes a lower score represents a higher quality as is the case for the other indicators. Total scores for cost and quality are calculated by summing the individual scores.
4.3.1. Quality
To determine the timeliness, we had to establish the retention period. The average lifespan of a water point depends on many factors, such as for instance type, water source and maintenance. Estimations for how long boreholes on average remain functional vary between 10 years [
49] and 20 to 50 years [
55]. However, within the lifespan, the functionality of water points can change quite fast. [
49] state that 30% of installed water point facilities in Malawi is not functional. This is supported by numbers from the largest data providers: 33.5% of water points is not working according to the DoIWD, 40.2% according to data from the Madzi Alipo database and 21.6% according to the WPDx. Because the functionality can change in a short time, the attribute functionality of a water point has therefore a short retention period. Consequently, we decided to use one year as the retention period for those datasets that had the attribute functionality. Data on other attributes will have a longer retention period, so if functionality was not an attribute, we took this into account. The better score on timeliness is compensated by a lower score on number of attributes. In case of water point repositories such as Madzi Alipo or WPDx, we used the timeliness associated with most of the datasets.
In terms of source reliability and content accuracy, we gave the following scores. The national census data of the DHS is collected by the NSO, with trained reporters, resulting in high source reliability and content accuracy. Madzi Alipo regularly checks and corrects data in the portal, either distantly (by aligning different data sources, or performing coordinate reference system corrections, etc.) or in the field (by checking for example GPS locations and functionality) and thus the source reliability and content accuracy scores for this dataset are 1. The WPDx database has similar characteristics as Madzi Alipo, though less checks and corrections are performed on the data, which affects source reliability. Data extracted from OSM has a source reliability score of 1, because the data is, once uploaded, checked and validated by experienced users of OSM, before being published. Additionally, this validation results in a high content accuracy. Source reliability is high for the dataset of the DoIWD, yet content accuracy gets a lower score (3). This is due to the great number of duplicates in the dataset where the GPS locations do not align among sources (see
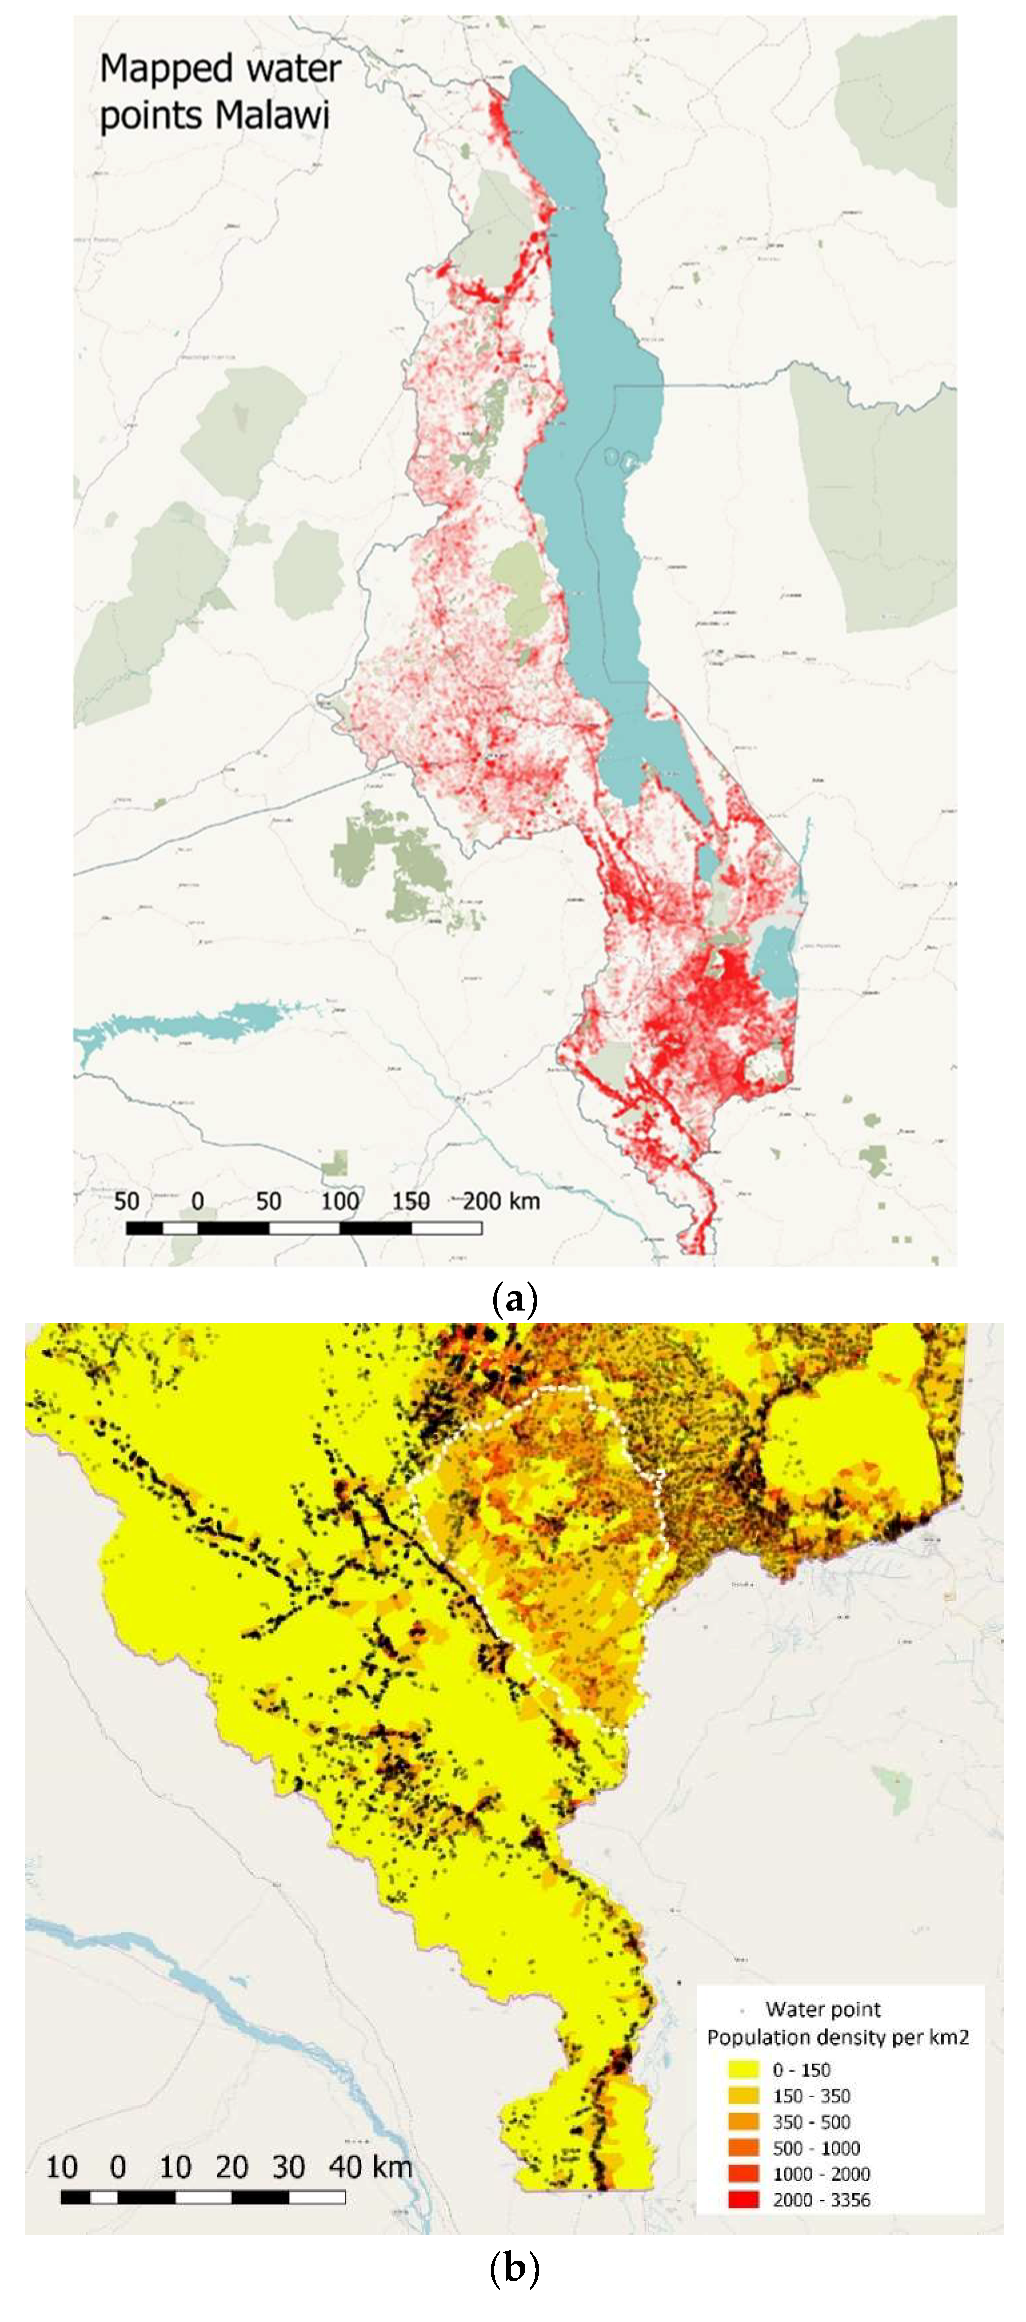
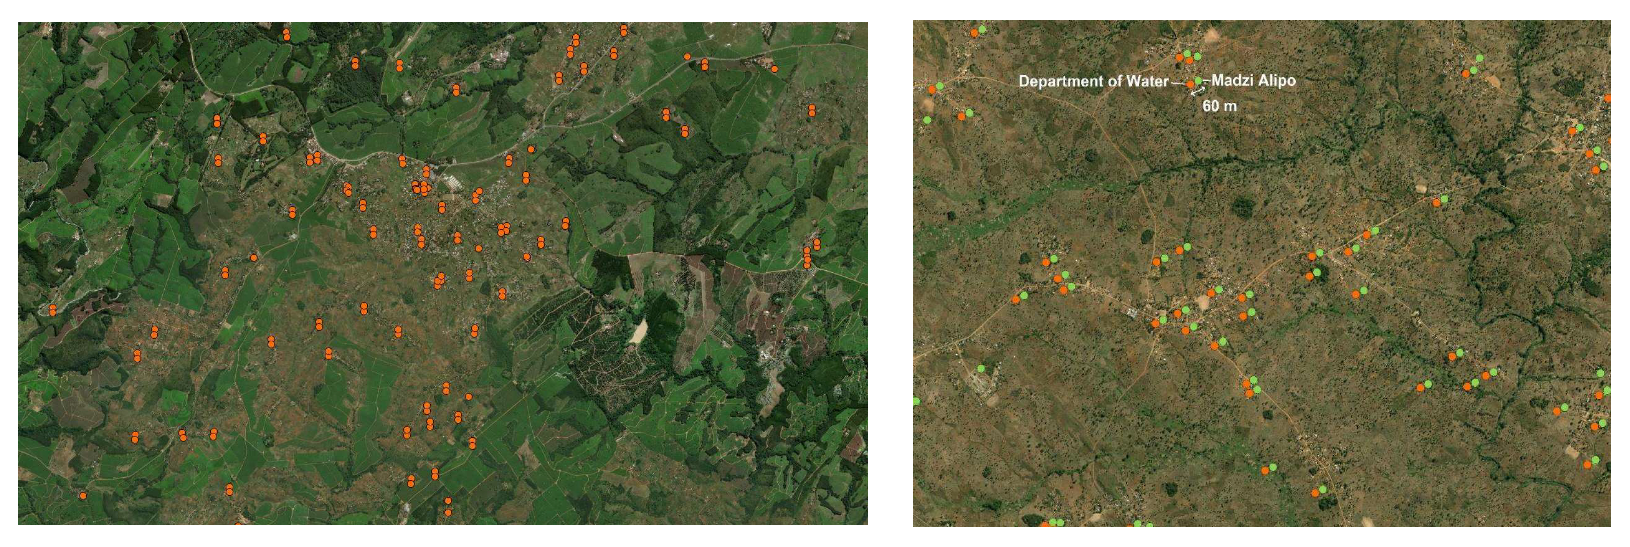
Figure 3). The dataset from the DoS received the highest scores on both indicators, as well as the MRCS dataset, since there are no indications of low source reliability or low content accuracy. The data of 510 is scored like those of the MRCS, yet the latter has received a higher score for content accuracy, because the 510 dataset contains duplicates. Regarding the data from PCI, source reliability and content accuracy are both not affected and therefore receive score 1. The CJF dataset contains some duplicates and although the data points mostly correspond to the points in other datasets, coordinate reference system correction is required. The content accuracy of this dataset is thus 2. For source reliability, the dataset gets the same score.
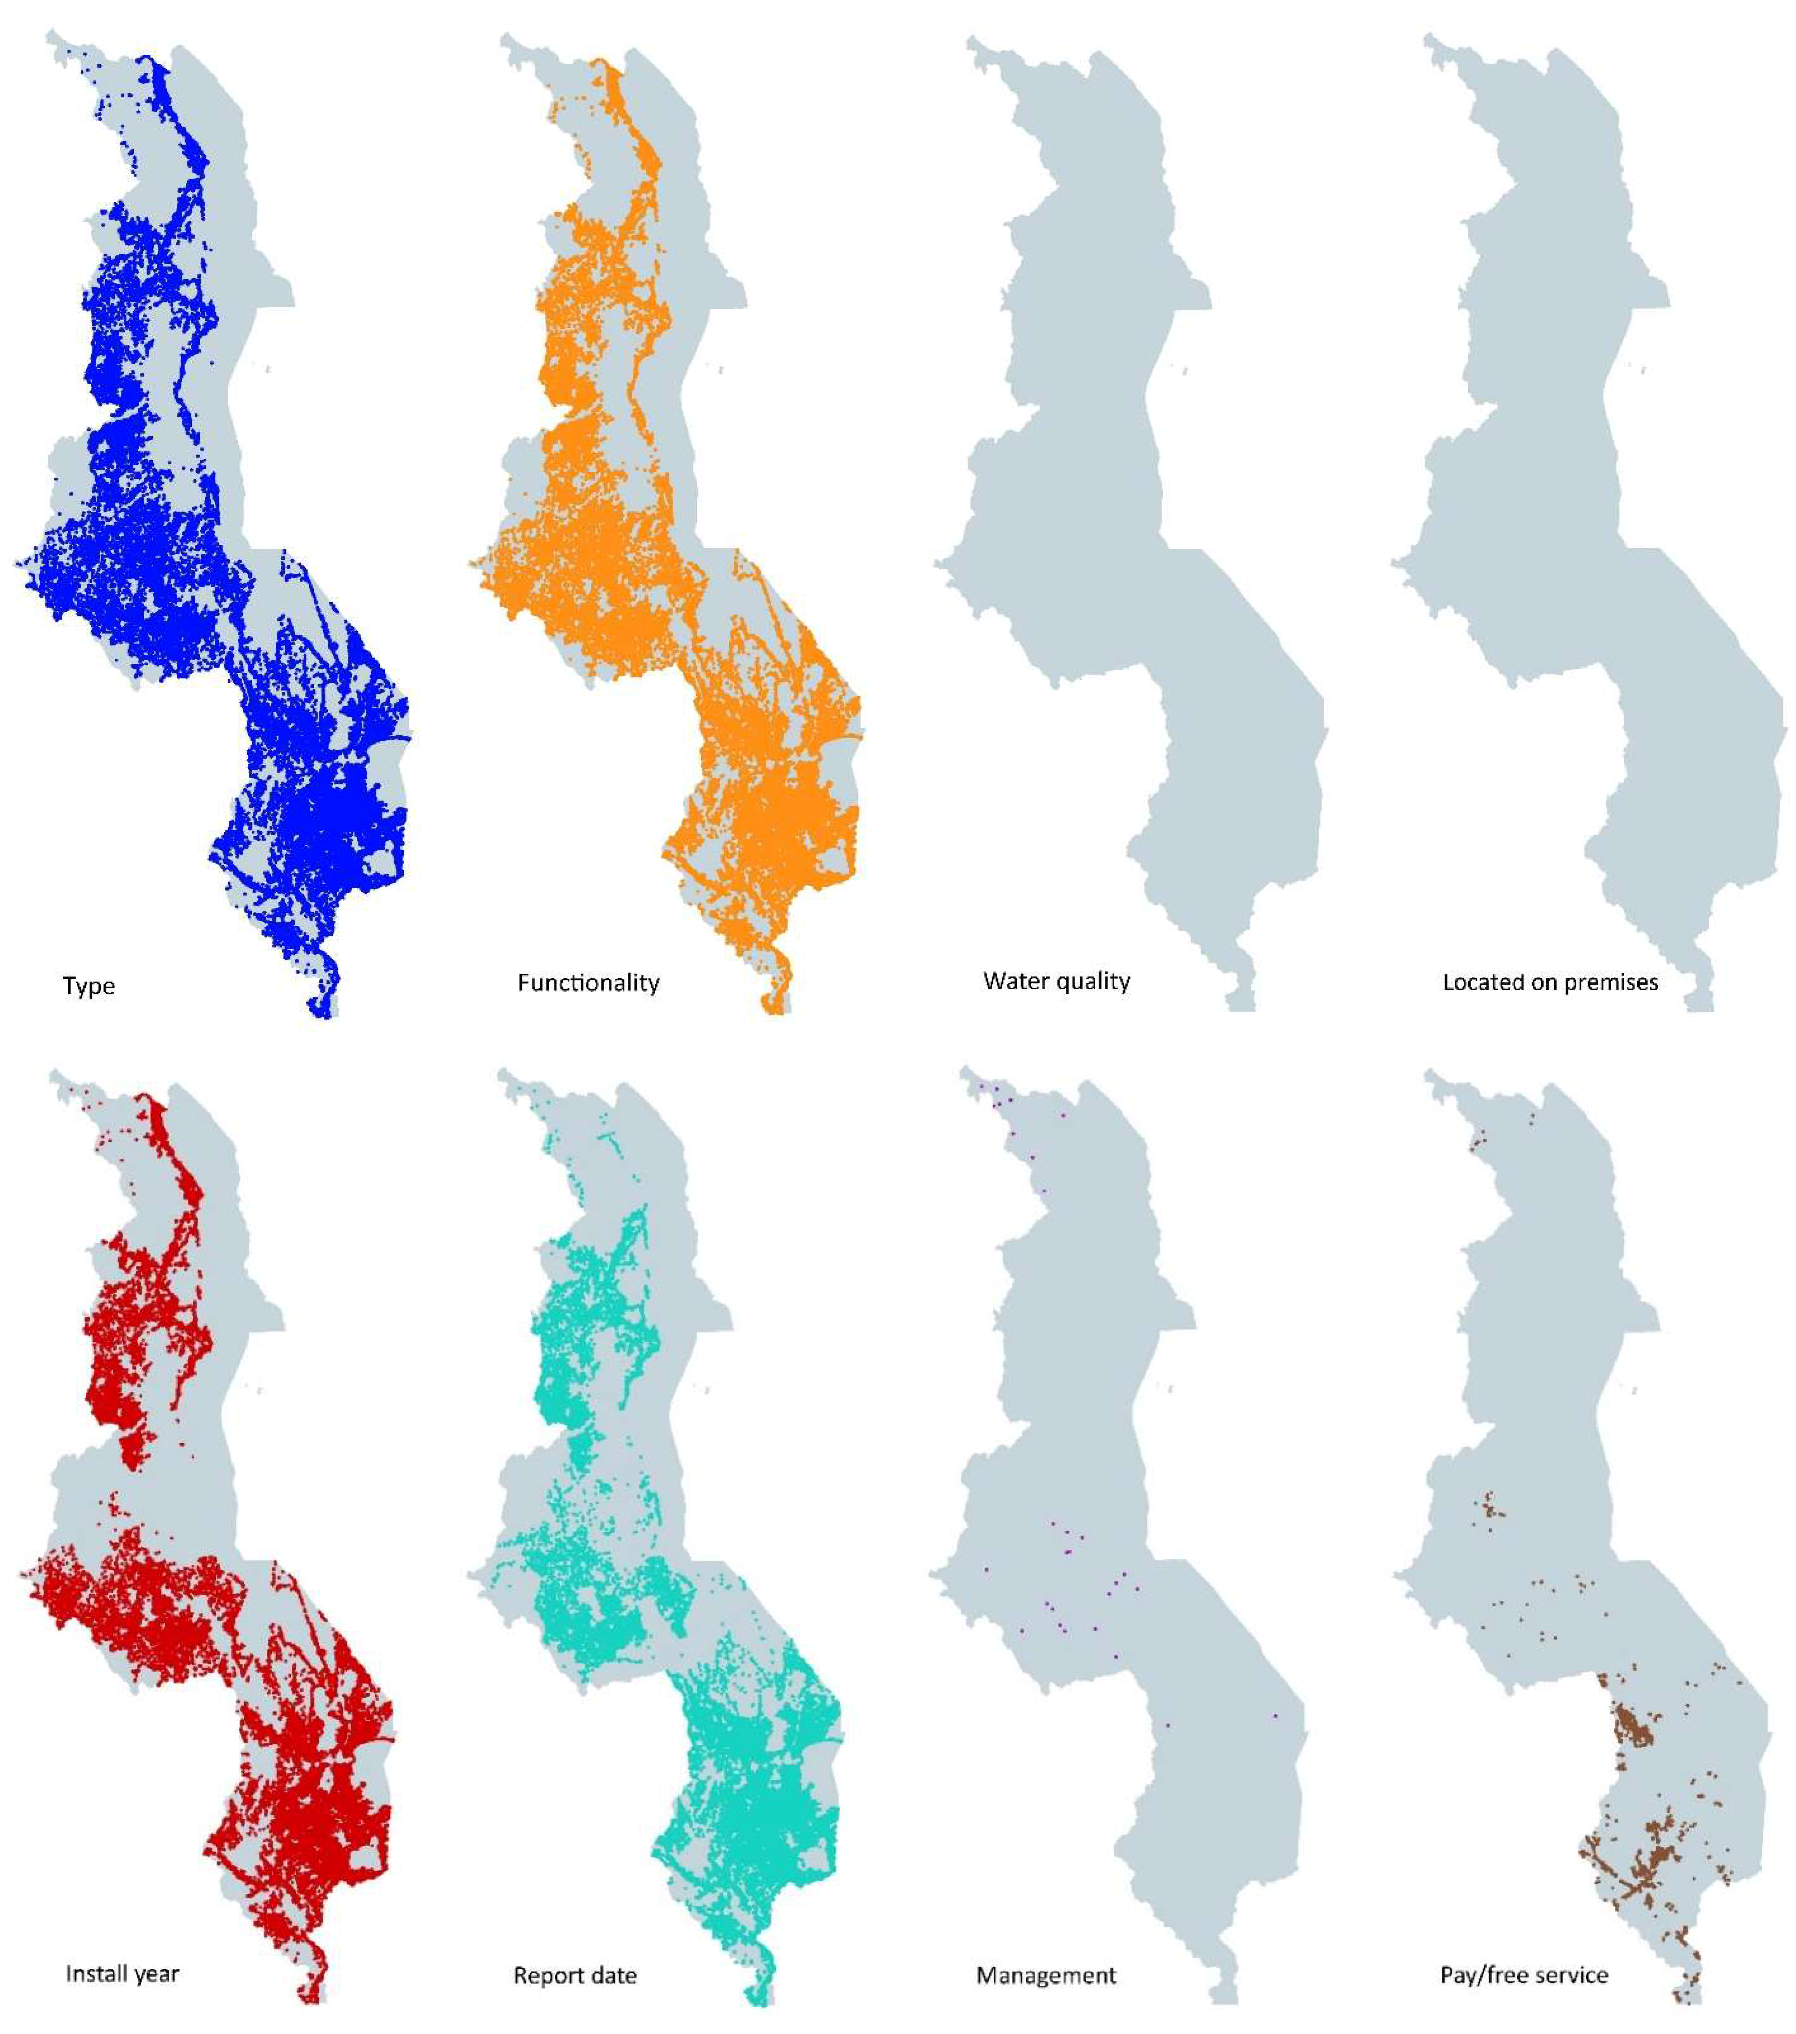
Figure 4 shows the spatial coverage for the different data producers and infrastructures. Madzi Alipo, WPDx and DoIWD have the highest spatial coverage, with OSM coming in fourth. All datasets had the same granularity level, meaning data at the water point level, except for the database of DHS.
Table 5 gives in the left column an overview of the components and proximate explanatory variables for water point sustainability as defined by [
41]. Water point sustainability is hereby defined as continued water point functionality over time. The right column shows the 11 attributes as available in the datasets we analysed. It is important to realize that none of the datasets had data on all these 11 attributes. WPDx, Madzi Alipo and DoIWD had between 7 and 7.5 of these attributes in their databases. Clearly on many components and variables of water point sustainability information is missing. For example, the attribute functionality is commonly measured as whether there is water flowing at the time of visit. This information therefore provides just a snapshot as information on frequency and duration of breakdowns is missing. Moreover, for the limited number of attributes also the spatial coverage is very limited as shown in
Figure 5.
4.3.2. Cost of Data Extraction
First element of cost of data extraction is the level of structuredness. All datasets are provided in structured formats, such as CSV or shapefile, rather than for instance a Word or pdf document. The datasets of PCI, OSM and the MRCS received the highest score on this indicator, because both datasets are shapefiles that are ready to use for analysis, without the need for pre-processing. The dataset from 510 received a lower score, because it contained, besides water points, also some other points of interest, which needed to be filtered out. The datasets provided by Madzi Alipo, CJF, the WPDx and the DoIWD contain a few (Madzi Alipo and CJF) and quite a lot (WPDx, DoIWD) incorrect or duplicate GPS locations, which requires correction in order to be able to use the data for analysis. These datasets therefore also received a score of 2.
Degree of access to data is high (score 1) for WPDx and OSM as it is completely open data. Downloading data from Madzi Alipo requires registration, which categorizes this dataset in the second class. Datasets from PCI, MRCS, DoIWD and DoS are obtained through visiting these organizations and therefore receive score 3. The 510 data is obtained through 510 team members and thus also belonging to category 3. The CFJ dataset is graded with a 4, because obtaining the data required quite some effort and resulted only in getting access to a test dataset and not the complete dataset.
4.4. Data Infrastructure
Table 6 and
Table 7 describes the four indicators of the data infrastructure dimension for all the data producers and infrastructures. In the overview we have excluded the global Humanitarian Data Exchange (HDX), the global OpenAerialMap (OAM) and the country-specific Malawi Spatial Data Platform (MASDAP) (part of the NSDI of Malawi). Through these platforms it is possible to retrieve multiple spatial datasets, including on WASH facilities. They should be checked regularly for new datasets on water points that might get uploaded. At the time of our research, they did not contain datasets other than references to original data sets we have included. First, we classify the data infrastructures. PCI, MRCS and 510 are in between data holder and data archive, as the data was either on individual laptops or on the organizational data archive, where in both cases no specific policy was in place in relation to storing and sharing the data as their role was limited to be a data producer. The governmental organizations (DoIWD, DoS) have a data archive, supported to some extent by a more formal data storing and sharing policy and, in some cases, linked to MASDAP. NSO has data on 556 indicators in the Malawi Socio-economic database (MASEDA) as well as data on the Malawi Data Portal. However, the DHS data was only available through the DHS Program website with DHS data from many countries compiled. Madzi Alipo, WPDx and mWater are more advanced data infrastructures; they can be considered a multi-site repository containing data collected by several stakeholders and with a longer-term strategy, although still based on mainly project-related funding. Madzi Alipo has started to develop a social entrepreneurship model around operation and maintenance. Second, the technical architecture and software is described both in terms of the application(s) used for data collection and the platform. Madzi Alipo has developed a dedicated app; WPDx uses multiple data collection tools and CJF used initially the AkvoFlow app after changing to mWater app. Different software was used to build these platforms, whereby all of them have an API (enabling in principle also mass data transfers and links to for example, initiatives such as API Highways). OSM is built on open source software, whereby for example QGIS or Overpass-turbo can be used to extract data. PCI, MRCS and 510 used different apps to collect data, but mostly ODK. The multi-site repositories have all similar functionalities such as to visualize and download the data. Advanced analysis and reporting are not built into the dashboard but are -for example in the case of Madzi Alipo- done by Fisherman’s rest. They offer an action-oriented quarterly report in terms of borehole repairs and maintenances required, given also through this advanced analysis insight into more attributes.
Madzi Alipo is easy to use, once the registration is done. The data playground of the WPDx is cluttered and not so clear. Data extraction on mWater is quite easy but some knowledge of GIS is required. Detailed numbers on the adoption was not available at the time of writing. Madzi Alipo has a community of 300 registered users (of which the active users are a subset). OSM has on a daily basis on average around 20 users [
56], but of course not specifically in relation to water points. Numbers for mWater and WPDx are only available at an aggregated (sometimes even across countries) level.
4.5. Data Demand
The research or policy problem is in most cases roughly specified and can all be framed in the context of WASH. As shown in
Figure 2, in general decision making in terms of water supply should lead -at the outcome level- to improved access to safe drinking water. This means that -at outcome level- improved day-to-day service delivery is necessary for which -at the output level- capacity building, infrastructure development and day-to-day operation and maintenance of existing infrastructure must take place. We did not include a table for this dimension as there were many similarities among the data produces and infrastructures. Madzi Alipo has as an expected outcome of their data use the objective of improving the day-to-day operation and maintenance of existing infrastructure. mWater, being part of the MoAIWD effort of mapping and analysing all Water and Sanitation Assets in Malawi, aims to support and build evidence for the Malawi Water Sector Investment Plan [
57]. WPDx is governed by a large group of NGOs, international organizations and research institutes. Their expected outcome is that by enabling better sharing the WASH sector (and especially governments) can take better decisions and actions. The individual data providers such as MRCS and PCI demand the data usually for monitoring and evaluation purposes of the WASH projects they implement. MRCS for example collected the data as part of a VCA at the start of a large EU ECHO project. Overall, the primary purpose of data collection remained the same; although one can in some cases conclude that data collected for direct maintenance and repair could also be used for influencing policy or for holding stakeholders accountable. The risk of using the data for holding stakeholders accountable seemed to be the blocking issue for example in getting access to the data of mWater.
4.6. Data Ecosystem Governance
Data ecosystem governance is for most of the data providers and infrastructures in the WASH data ecosystem still at its early stages. In terms of participatory capacity, both Madzi Alipo and WPDx have themselves ample technical and data management expertise enabling them to not only participate in the data ecosystem but also giving them the means to grow a data ecosystem. Madzi Alipo aims to be as open as possible and give technical explanations on their websites. Madzi Alipo has created a community, that can participate in data collection by using their app, but they also encourage organizations to upload the data they already have. In other words, the organizations that contribute to Madzi Alipo do not have to have a high participatory capacity. It has a similar approach as WPDx, where also WPDx works with preferential apps (mWater and AkvoFlow), but they also allow you to send your data files collected with different mobile apps. Contrary to Madzi Alipo, WPDx is a global database with over 400.000 water points across 35 countries [
58]. OSM has a high participatory capacity as well, given that every citizen can learn how to use OSM, contribute to OSM and download all the data. The continuity of collaboration between users and suppliers is especially for OSM well developed and feedback mechanisms (in terms of for example, validation protocols of items mapped) are in place. The data holders and data archives can have medium to high participatory capacity. For example, 510 has advanced data science skills but is not involved in operational decision making. The DoS has less advanced technical knowledge, given also a lack of ICT infrastructure, but is directly incorporating data activities into government practice. The multi-site repositories offer all a continuous collaboration between users and suppliers of data. With the governmental data producers this is rather on demand.
An important incentive to share data between actors is reciprocity. For example, Fisherman’s rest has as objective to populate their database as much as possible and by sharing their data with other actors the likelihood of them sharing as well increases. There are also commercial incentives. The consortium behind WPDx includes data-driven NGOs such as the Akvo Foundation that provide data-related services and infrastructure. OSM contributors from outside Malawi are often motivated by being part of a good cause as well as by the social element of being part of the OSM community and being recognized as an active contributor or expert [
9]. The OSM community in Malawi itself is relatively small with about 100 members registered on Facebook. Up to 125 OSM volunteers are active mapping nodes per day at peak level [
56], where incentives vary -in addition to the above ones- from learning opportunities offered through the OSM community as well as networking opportunities. A barrier to share data can be accountability as seems to be the case for the government data on water point data. Another reason might be that not all consequences of sharing data are overseen. This seems to be the case for high-resolution satellite imagery that the NSO acquired for preparing the new census of 2018, whereby this data can cause harm or can be exploited commercially. Overall, one could say that all organizations in the WASH sector pursue their individual organizational objectives but at the same time also subscribe and aspire to the higher impact goal of access to water for all, which links to the expected outcome of data use under the Data demand dimension.
In terms of user selection, WPDx, Madzi Alipo and mWater require users to register. It is not clear how the government selects users and based on which criteria they grant access. The government of Malawi has joined the Open Government Partnership in 2013 [
59]. The action plan for 2016 to 2018 included a commitment on improving efficiency and effectiveness of quality public services but nothing is said about what this means in terms of providing access to data [
59]. Collaboration among data users is stimulated via the Water sector Monitoring and Evaluation coordination meetings as organized by the MoAIWD and the Sanitation and Water for All taskforce of the Water and Environmental Sanitation Network (WESNet). The objective is to harmonize collaboratively the WASH M&E system in line with the national framework that the government has in place. This implies also harmonizing data collection and analysis efforts. The data sets were however still mostly analysed from the one user perspective or in a few cases self-selected analysis by several users.
Figure 6 show a straightforward example of how data on water point location can be combined with population data to identify gaps. The challenge is also how to move from individual monitoring and evaluation efforts to a shared management information system on water points.
5. Discussion
We proposed a framework consisting of five dimensions—Actors and Roles, Data Infrastructure, Data Supply, Data Demand, Data Ecosystem Governance—which we used to characterize a data ecosystem in Malawi in the context of SDG 6.1.1. (Proportion of population using safely managed drinking water services). We will discuss our findings following these dimensions.
In terms of
Actors and roles, we observe a divide between government and NGO efforts. NGO actors have usually granular and timely data from their projects with however limited spatial coverage. The government actors have more robust country-wide data sets taken at larger intervals and on just a few attributes in relation to water points. NGOs relatively easy share their data, whereas it is difficult if not impossible to get especially disaggregated data from the government. There are no clear niches meaning that some organizations duplicate efforts. It is still a challenge to find complementary ways of working and achieve synergy among the different actors. The data ecosystem we examined was very fragmented in terms of policies, stakeholders and communities which can be seen as a common feature across developing countries. This may be explained by the weak governance and the lack of initiatives to bring actors together. Therefore, our framework provides a holistic view of who is doing what and thus can be used to help narrow this gap and create more awareness. Defining the roles in an ecosystem is essential to understand and manage an ecosystem and estimate its success [
60]. We recommend that the data ecosystem is characterized on a continuous basis as actors will come and go and data supply and demand will fluctuate. The NSO might be best positioned to take on this role.
This lack of collaboration and synergy among actors influences the relationship between
data supply and
data demand. In our case study, it was easier to characterize the data supply than data demand. Quantifying the characteristics of the data supply dimension proved useful as it enabled identification of datasets with sufficient quality and lowest cost for supporting official statistics as well the gaps in data for which additional primary data collection is a necessity. Based on our field work, we observe that stakeholders are not always able to formulate exactly their data demand, that is, what data input they need and what decisions they take in the WASH sector. This sector is characterized by multi-stakeholder decision making which add to this complexity as each stakeholder may have different information needs and perception of the problem at stake. We also note this as a limitation of our framework which currently describes only on a high level how a policy problem can be characterized. Furthermore, in our study we adopted a data-driven approach by identifying which data producers exist in the data ecosystem. A collaborative data-driven approach might result in consensus. As [
61] states “it vaccinates citizens and environments so that they can take larger doses of inequality and degradation in the future.” Kaika argues that real solutions require dissensus. Translated to the case study of this research, how can a more mature date ecosystem enable communities to no longer be just “inclusive” to WASH related processes, but give them a powerful position at the table, whereby they can claim their right to equal access to water? This means elevating our data ecosystem characterization from the socio-technical level to principal negotiating forums. This implies going from a data-driven approach to a problem-driven iterative approach (PDIA) [
62]. PDIA starts by breaking down the decision- making process into problems nominated and prioritized by stakeholders themselves, co-developing data platforms iteratively and evaluating them on whether (or not) they inform decision making, piloting and learning in “authorizing environments” (i.e., government departments over which innovative public managers have formal and exclusive decision-making authority) and finally scaling up. But this approach is highly complex at the ecosystem level because each stakeholder has their own decision-making process.
A characterization of the
data infrastructure shows a large variety of geospatial data sharing platforms, online accessible information management systems and organization specific data archives. The several multi-site repositories seemed even to be in competition with one other, with the risk of the same date sets getting uploaded on all of them concealing that there is in fact a data gap. The governmental single- or multi-site repositories aspire to be part of an overall NSDI but the political support and required resources are still minimum [
24]. The NGO related multi-site repositories have a strong thematic focus and relate to specific projects. In addition to these national data infrastructures, also global players promote their platforms. This plethora of platforms make increasing awareness more difficult and result in lower adoption, especially among users that have poor access to ICT, failing internet and low data literacy. Another barrier is that the existing platforms struggle with ensuring the usability and usefulness of the data, as often metadata on the quality and collection methods are missing. Butterworth et al. [
63] have shown for cities and neighbourhoods how integrated data portals and corresponding data working groups can be successful if setup around an ideally both vertically and horizontally integrated policy framework that includes a set of pre-agreed upon spatial indicators. For the context of Malawi, it is not sure if more geographic focus and policy integration -such as creating a data portal that is specifically targeting and owned by actors at district level (instead of national level) will be helpful as long as the devolution of budget and responsibilities to district level is not improved.
In terms of
Data Ecosystem Governance, we observe that the WASH data ecosystem in Malawi is immature and fragmented. This is a direct reflection of the institutional bricolage and civil society failure that affects the water supply, as was explained in
Section 4.1. Incentives to share and use data are not well aligned and user selection differs among actors whereby some open their data, others only on demand or not at all. As multilateral donors play a large role in developing countries with weak governance (as in this case study in terms of funding WASH projects), they can enforce data sharing and stimulate harmonization of data collection. The International Aid Transparency Initiative (IATI) has worked well in terms of opening project management related data on development and aid projects, so a similar mechanism to push for opening of data that is collected during a project can work as well. We observed large differences in participatory capacity, whereby some actors have high data capacity, but limited operational knowledge of how to use the data for policy and/or decision making at a local level (such as data-driven international NGOs) or the other way around (such as local governments). Therefore, our second recommendation concerns fostering data expertise and capabilities among local actors as opposed to international actors. Cho et al. [
64] showed highly positive cost-benefit ratios of having more data on water related issues. Current research [
65] stressed the importance of improving the capabilities of organizations within the national data ecosystem to produce high quality data. We however look beyond official statistical data and suggest the need for capabilities to fuse, analyse and visualize heterogenous data sources at different geographical scales and time periods for SDG monitoring as census data will not be enough. See et al. [
66] give an overview of how remote sensing data can be integrated with geospatial information to enable or enrich monitoring of different SDG indicators. Stevens et al. [
67] demonstrate, specifically for the objective of high resolution, contemporary data on human population distribution, how census data can be disaggregated by using machine learning techniques in combination with remote sensing data. The geons-approach [
68] allows data to be transferred across spatial scales, by creating spatially exhaustive sets of units based on spectral homogeneity in a specific domain, scalable to the level of policy intervention and independent from any predefined boundaries (such as usually administrative boundaries).
To support the data ecosystem growth and development it is also of value to consider the incentives of different actors to share (or not to share) the data. Obviously, these are very much linked to the endogenous and exogenous incentives introduced in
Section 4.1. Currently the data exchange between the different ecosystem actors is driven mainly by the expectation of reciprocity. However, there are other mechanisms, such as for example, reputation systems, which can be used to encourage proactive collaboration in the data ecosystem. For example, the geospatial data sharing platform Geodash in Bangladesh has grown from its start in 2014 to now over 47 government, international/non-government organizations registered and sharing data. The interactive features on the platform allow users to comment and rate data, influencing search results. This is also a way to create “lightweight” institutional oversight of unofficial but relevant open mapping data [
69].
Overall, our findings are in line with previous research which highlighted the need for better awareness, common standards, improving capacities and building on existing initiatives [
65]. Our work concurs with the view that a data ecosystem has two essential properties: networked character and self-regulation [
20]. Our analysis of the Malawian case study illustrated the kind of complexities involved in achieving self-regulation through interaction and feedback and networked relationships. Namely, in developing countries additional complexities include fragmentation, divide between governmental and non-governmental data activities, complex funding relationships, data poor context, to name a few.
6. Conclusions
Currently, in Malawi, the baseline data available for reporting on SDGs shows a data gap. The census or survey data is only collected at large time intervals, usually only available at highly aggregate spatial levels and not rich in content. However, Verplanke and Georgiadou [
70] demonstrated that water point mapping is highly discretionary and prone to many different types of errors requiring local, verified and regular mapping. Open Mapping data can play an important role in bridging this gap but is generated by a large variety of stakeholders in a non-harmonized way. To harness the potential of these other data sources outside the official statistics realm, it is necessary to understand and chart the data ecosystem with these many stakeholders. This helps to identify those data infrastructures and data collaboratives that have the right characteristics to be beneficial for SDG reporting and that will emerge or grow if given more support.
Our research pursued two objectives: (1) to develop and evaluate a framework to characterize a data ecosystem in a developing country in a data poor context and (2) to show how this can be used to identify data, outside the official statistics realm, that enriches the reporting on SDG indicators. By using this framework in a case study of Malawian data ecosystem in the WASH sector, we mapped the stakeholders, data transactions, tools and resources, as well as charted the landscape of the interdependencies in the data ecosystem. We also were able to give an assessment of the maturity of the data ecosystem as discussed in the previous section.
Based on our findings, we propose the following recommendations to improve the maturity of data ecosystems in developing countries in the context of SDG monitoring:
To lessen the overall fragmentation, we recommend that an NSO takes on the coordinating role of characterizing the data ecosystem on a continuous basis as actors will come and go and data supply and demand will fluctuate;
To increase data adoption and awareness, we recommend that efforts are taken to eliminate the duplication of data across multiple platforms and to increase the quality and usefulness of the data by supplying more metadata;
To stimulate the growth of data supply in the data ecosystem, we recommend that mechanisms are put in place (1) to empower multilateral donors to enforce the opening of data collected during projects and (2) to incentivize data sharing among stakeholders by offering value in return;
To support the development and evolution of the data ecosystem, we recommend fostering data expertise and capabilities among local actors, as opposed to international actors, to obtain and integrate diverse data sources for SDG monitoring;
We recommend our framework to be used for characterizing data ecosystems in other contexts in developing countries and beyond. It can be used by development and governmental practitioners to determine how to optimize a data ecosystem for enhanced data sharing and improved reporting on SDGs. For instance, the framework can help identify which data infrastructures to support and invest in. It can be used to help avoid duplication of efforts by investing into collaborations which are already strong. Our framework to characterize the data ecosystem enables identification of datasets with sufficient quality and lowest cost for supporting official statistics. Equally well, it can be used as part of data preparedness for humanitarian response [
71]. Furthermore, characterizing the data ecosystem can more generally help foster relationships and create more awareness among the actors in the ecosystem. All aforementioned steps can help the data ecosystem to become more mature. Ultimately, harnessing the data ecosystem for SDGs will enable better targeted action towards reaching the SDG targets.
From the research perspective, our work was meant to fill in a gap in the literature and provide a comprehensive and holistic framework for characterizing data ecosystems. We did so in the context of SDG monitoring, but the framework can be equally well applied to other contexts. In the end we proposed a framework developed on the basis of existing research and which embraces the socio-technical nature of the phenomenon of data ecosystems. To the best of our knowledge, there were no previous efforts to systematically develop any similar characterization of such data ecosystems. Furthermore, pursuing our second objective, we tested the scoring framework initially proposed by [
30] in the context of a case study. By doing so we demonstrated that it can be a helpful means in evaluating data sources. Unlike similar frameworks, such as for example, the capability maturity model [
63], our framework is not limited to organizational capacity of an NSO and offers a broader view which also includes other actors in the ecosystem. The novelty of our work lies in the fact that, unlike many existing frameworks of information infrastructures, it captures two important attributes. First, it embraces the realities of the data revolution, namely that data is now scattered across multiple organizations and entities and government data is no longer sufficient to provide a complete picture. Thus, our framework therefore responds to the need (1) to map the multitude of actors holding potentially useful data and (2) to assess the quality and cost of obtaining these data. And second, there is a complex relationship between supply and demand in a data ecosystem, the ‘push’ and ‘pull’ for data. Unlike other frameworks, our framework captures this highly interdependent nature of data ecosystems by including elements which describe what policy issues require data input, why actors share or do not share, how collaboration is organized between actors and the many options to decide how much to share and with whom.
Our framework however has some limitations. First, we acknowledge that on some occasions there was overlap between dimensions of the framework. For instance, incentives to use data are closely related to the expected outcome of data use; similarly, user selection strategies are linked with the dimension of degree of access to data. We explain this by the fact that a certain degree of overlap is inevitable in such a highly complex and interdependent context. When applied to a case study, each dimension requires operationalization. Second, some dimensions of the framework are mostly descriptive and thus more difficult to quantify than others. Therefore, we opted for a mixed approach and quantified only the dimension of data supply. It was not straightforward to establish a coherent (across indicators) scoring mechanism. Third, the level of characterization of each data producer and infrastructure in a data ecosystem is limited by the time and resources available of the research team doing so. For example, if user selection is on agreement basis, this can be a long process requiring building trust as well as drafting formal documents. Lastly, the framework is a first step towards data fusion as it allows to identify and assess the quality of heterogenous data sets in a complex data ecosystem. However, it does not offer data fusion solutions.
Future research can replicate and test our approach in other countries and in the context of other SDGs. Our next step is validation of the framework in a different country, that is, the Democratic Republic of the Congo. This will allow us to apply the framework in a different political and organizational context and further assess its feasibility. We will also use the new data fusion technologies to integrate, analyse and visualize heterogeneous data sources such that more reliable and usable information results.


