1. Introduction
With the popularity of mobile devices and the development of the network infrastructure, social media has quickly integrated into people’s lives. People can easily share what they see and hear, and even what they feel and think with social media. They are like “mobile sensors” [
1] to collect information around them constantly. This provides a new way to acquire disaster-related data. Compared with traditional disaster information collection methods, social media has the characteristics of real-time information provision and low cost. Furthermore, these data contain a lot of geographic information (such as location, time, and other attribute information), which is very important for disaster mitigation. Therefore, many researchers have noticed the importance of social media in disaster mitigation. They have studied disasters from the perspectives of event extraction [
2,
3], user trajectory rules [
4] and data fusion [
5], etc., and achieved good results. However, few researchers have considered the public emotional information contained in social media (especially fine-grained emotions) as an attribute of disaster-related geographic information to aid in disaster mitigation. When disasters occur, public emotions often express the public’s attitude towards disaster, needs during disaster, and feedback on disaster relief, etc. These are very helpful to understand the progress of the disaster quickly and effectively improve the efficiency of rescue. However, there is still a lack of an effective framework to quickly collect, process, and use this emotional information. There are three problems involved: (1) How can the fine-grained public emotional categories be divided during the disaster? (2) Social media has a huge user base. We take Sina micro-blog, a Chinese social media, as an example. According to statistics, as of Q3 2018, Chinese social media platform Sina micro-blog had over 431 million active monthly users [
6]. When disasters occur, this will generate a lot of disaster-related data. As such, how can the fine-grained emotional information contained in these data be extracted more accurately? (3) When these fine-grained emotions are extracted, how can they be regarded as an attribute of disaster-related geographic information to assist disaster mitigation? In this paper, we used a Sina micro-blog and took an earthquake disaster as an example to describe how the framework we built extracted fine-grained public emotions and used them to serve disaster mitigation.
Unlike most emotion analysis studies (they usually divide emotions into three categories: positive, neutral, and negative), we divide the public emotions during the disaster into more dimensions, because the use of multiple dimensions of emotion in the disaster context can allow more details of the disaster to be described. Additionally, studies have illustrated the importance of multidimensional emotional information in disasters. Ekman, et al [
7] showed the differences between anger, disgust, fear, and sadness in terms of antecedent events and likely behavioral responses. Oliver Gruebner et al [
8] analyzed how to apply multiple dimensions of negative emotion (including anger, fear, sadness, surprise, confusion, disgust) to survey disaster mental health. Existing psychological studies [
9,
10,
11] also mention the fine-grained division of emotions in a disaster. Therefore, based on these previous studies and the corpus used in this paper, we subdivide the negative emotions into anger, anxiousness, fear, and sadness.
The commonly used methods for emotion classification include rule-based algorithms and traditional machine learning models [
12]. Rule-based algorithms mainly uses given emotional lexicons and corresponding grammatical rules to calculate the emotional intensity of the text [
13,
14]. This method relies on a large number of manual operations, such as manual development of search rules and a large-scale emotional lexicon [
15], which determines the accuracy of the method. Additionally, this method is weak in dealing with stop words and new words. It is also hard to add some slang and Internet buzzwords to the emotional lexicon in time, such as “喜大普奔” (great satisfaction), “狂顶” (very supportive), etc., which often appear in social media. Traditional machine learning models, such as naive Bayes [
16], maximum entropy, and support vector machine [
17] do not rely on emotional lexicons or search rules. They only need to manually annotate the training set. However, the traditional machine learning method is based on the bag-of-words model, which ignores the semantic relations in text. In other words, it does not consider the order of words in a sentence, which can easily cause misclassification of emotions. For example, the sentences “Although the earthquake is terrible, we are safe and sound” and “Although we are safe and sound, the earthquake is terrible” contain the same words, they express different emotions. Moreover, for traditional machine learning models, the input is the feature words extracted from the text after segmentation. The definition of feature words has a significant impact on the model’s efficiency [
15]. We selected the deep learning method to extract public emotion from social media. Compared with the rule-based method, deep learning does not depend on any emotional lexicons. Therefore, it is not affected by new and unknown words. Unlike traditional machine learning, deep learning uses word vector models to replace the bag-of-words model, which can make good use of semantic information in sentences. Much research has indicated that the performance of deep learning [
18,
19] in natural language processing (NLP) tasks is better than of traditional machine learning.
Furthermore, we used extracted fine-grained public emotions and combined them with traditional geographic information data (population density distribution data, point of interest (POI) data, etc.), and the powerful spatial analysis functions of a GIS (geographic information system) to assist disaster relief. Combining public emotional information could produce the following benefits: (1) It could improve the accuracy and efficiency of disaster assessment. For example, with the help of the powerful spatial analysis functions of a GIS, traditional geographic information data (such as population distribution, traffic distribution, etc.), and emotional distribution data can be combined to assess the affected population in real-time. People who express negative emotions are generally considered to be more affected by disasters. (2) It could help to reduce disaster-related losses. For example, disasters, especially sudden disasters (such as earthquakes, volcanic eruptions, etc.), can easily cause disaster-related mental health problems, such as post-traumatic stress disorder (PTSD) and depression [
20,
21,
22]. Traditional monitoring has difficulty obtaining information about emotions of the public in the disaster area (despite the existence of a questionnaire, its real-time performance is poor). If information about the public’s emotions and corresponding spatio-temporal distribution is known, the disaster reduction department can take corresponding psychological rescue measures to reduce the occurrence of disaster-related mental health problems. In addition, extreme disasters have the characteristics of inevitability and unpredictability [
23]. People will express different emotions at different stages [
24] and have different responses to try to overcome them [
9]. For example, anxious people are more sensitive to the negative side of event-related information and can be easily influenced by rumors [
25]. Therefore, through understanding the distribution of anxious people, we can release the correct disaster information at appropriate times to prevent rumors being intrusive to anxious people. (3) Learning more about the causes of emotion could help us to optimize emergency decisions. By using different emotion categories, we can explore different emotional causes, such as why angry emotions are predominant in a certain area and more anxious emotions are predominant in another area, and why the emotion categories change in some places over time. By understanding the causes of emotion, the disaster reduction departments can carry out targeted countermeasures. In the spatio-temporal analysis of public emotion information, the framework in this paper includes assessing the affected population in real-time, exploring an emotional movement law, and monitoring the causes of emotional change.
The structure of this paper is as follows:
Section 2 describes the data acquisition, parsing, processing, and emotion classification method used in this paper.
Section 3 presents the role of public emotion in assisting disaster reduction with a case study.
Section 4 shows the evaluation of the experimental indicators.
Section 5 concludes the paper.
2. Framework to Analyze Public Emotion from Social Media Big Data
The framework to analyze the role of public emotions in disaster mitigation proposed in this paper includes five major phases: data acquisition and processing, the construction of a word vector list, model training, emotion classification, and spatio-temporal analysis of public emotions (as shown in
Figure 1).
2.1. Social Media Data Acquisition and Parsing
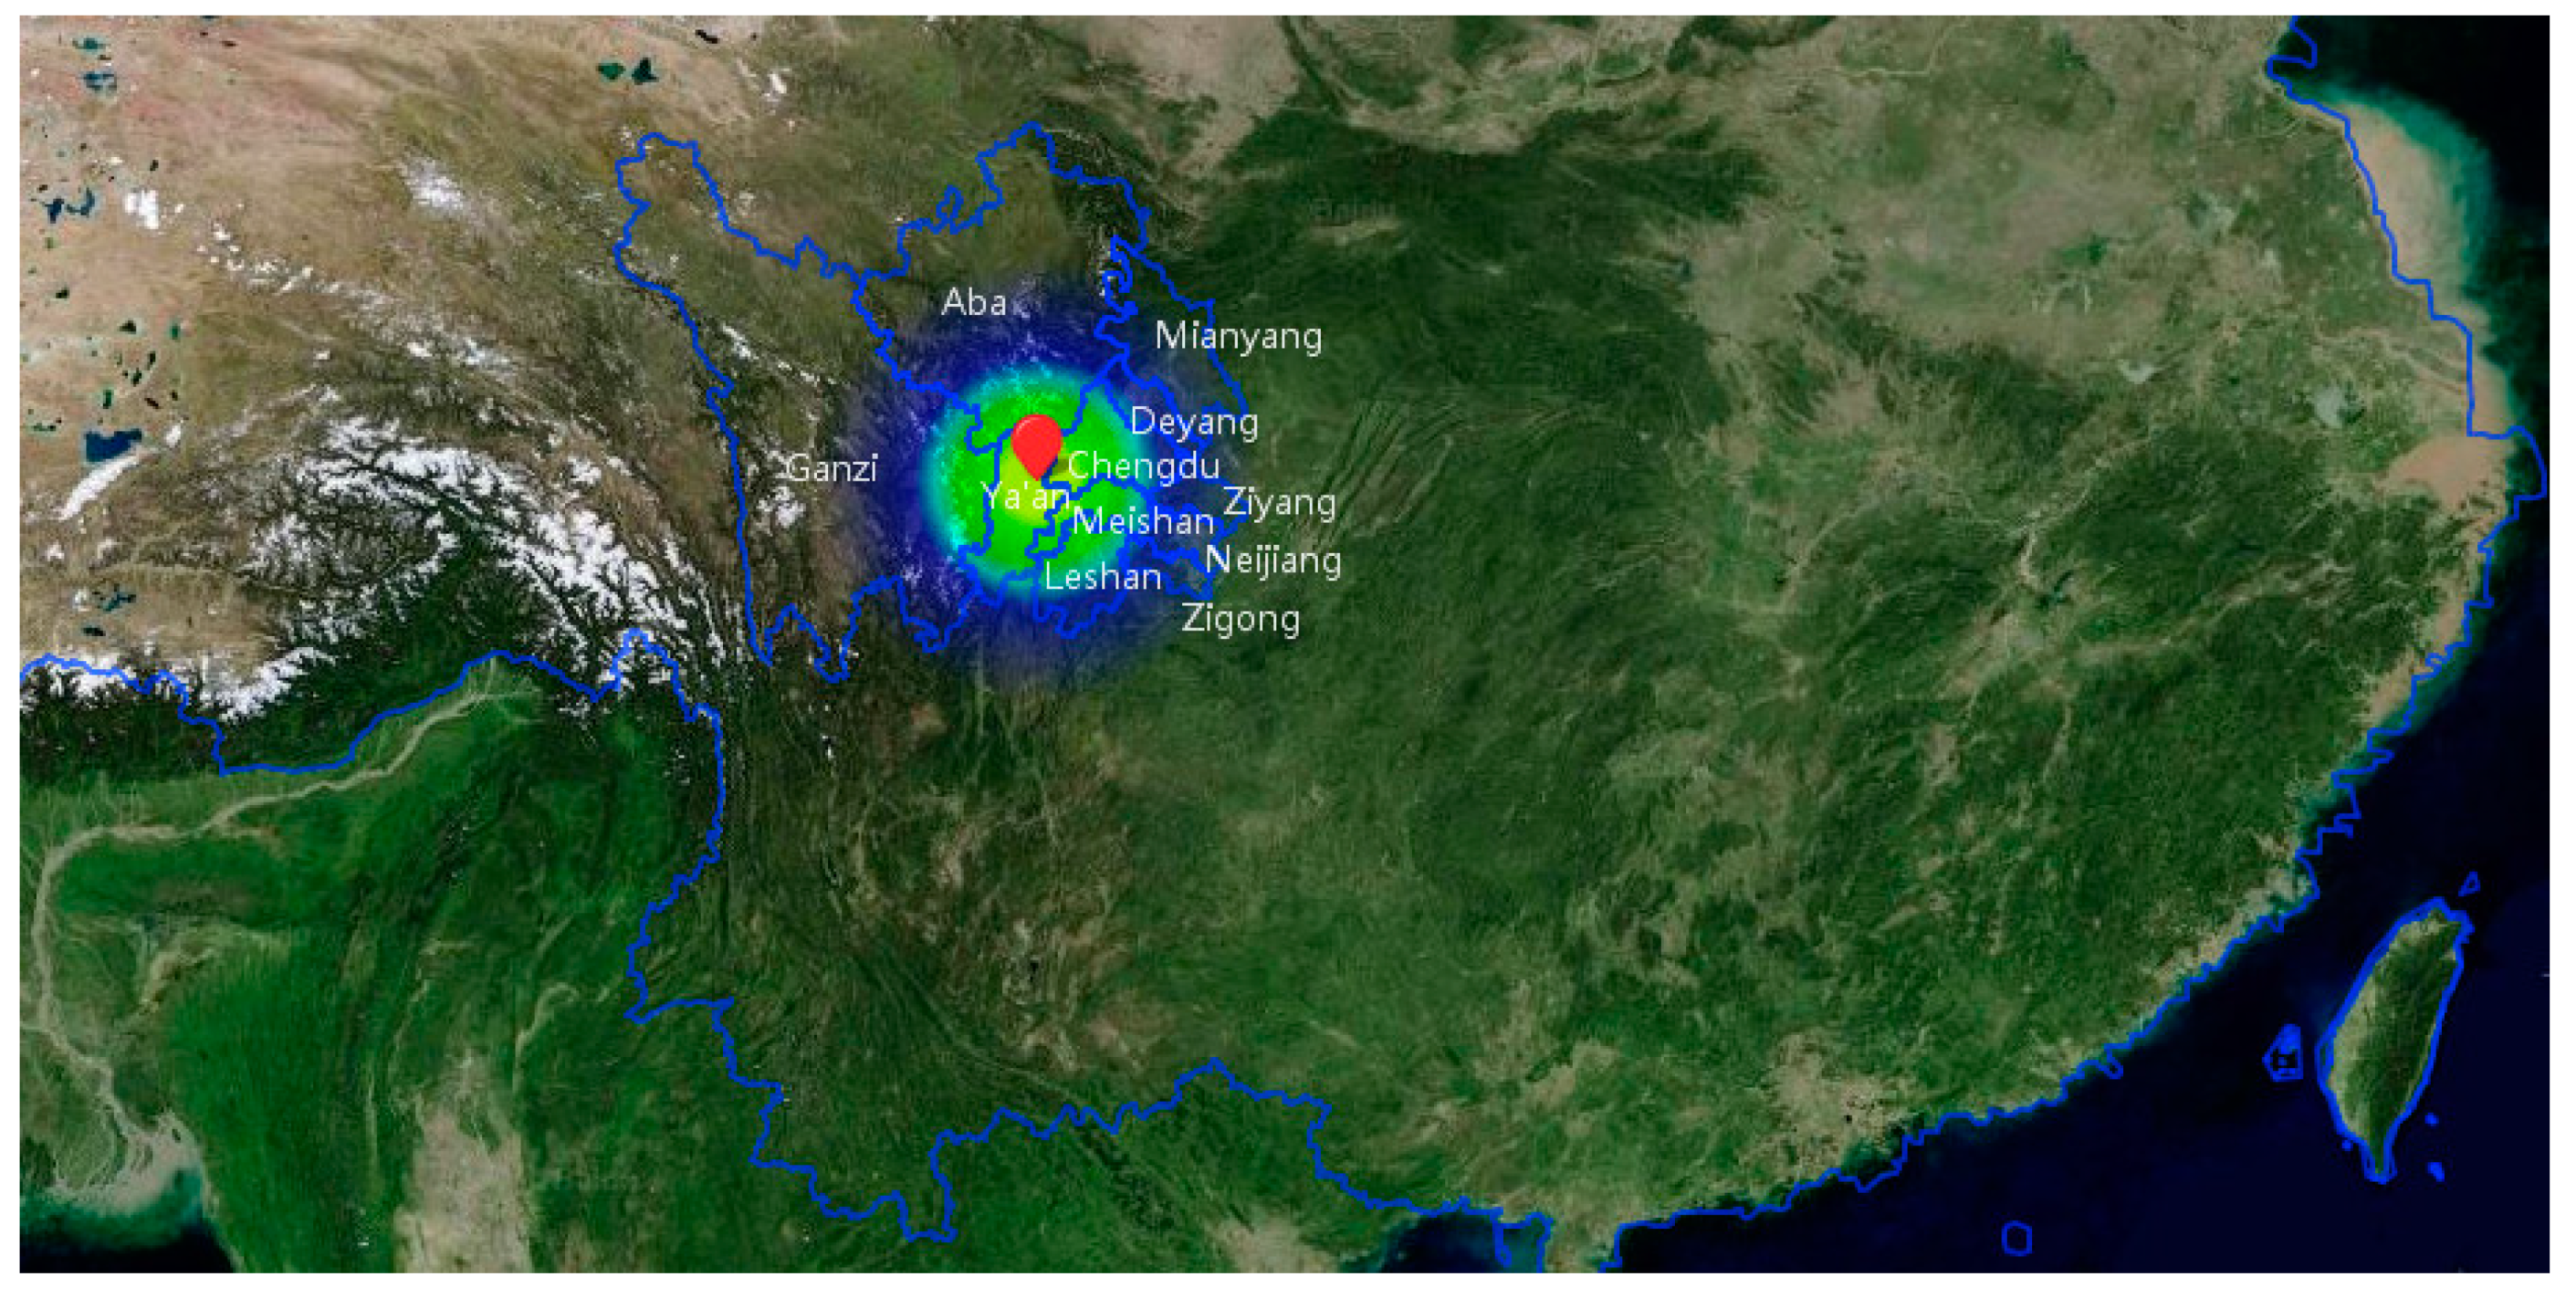
We used an earthquake that happened in Ya’an, Sichuan, China, at 08:02 h on April 20, 2013, as the case study. According to the report by the China Seismograph Network (
http://news.ceic.ac.cn/CC20130420080246.html), the magnitude of this earthquake was 7.0 and its focal depth was 13 kilometers. The epicenter of this earthquake was located at 30.30° N, 103.00° E, which caused about 1.52 million people to be affected in an area of 12,500 square kilometers.
In this paper, social media data was acquired from the Sina micro-blog from the region surrounding the epicenter with a radius of 200 km, which was severely damaged by the earthquake. The affected cities included Ya’an, Meishan, Ganzi, Leshan, Ziyang, Deyang, Chengdu, Aba, Zigong, Mianyang, and Neijiang, as shown in
Figure 2. The time span of social media data was from April 20 until April 26, 2017. Social media platforms usually provide an interface or API (Application Programming Interface) that allows developers to retrieve social media data. However, the retrieval of data in this way has great limitations; for example, you cannot set the time-span and topics, etc. Therefore, in this paper, we used Sina micro-blog’s advanced search capability to get data by using time-span, city names, and event-related key words.
The data format was initially hypertext markup language (HTML). We parsed the data into a structured data format including fields such as “time,” “location,” “text,” etc. Among them, location was represented by the address and the accuracy of them were different. We take Chengdu as an example. Some addresses were described in more detail, such as “East Gate of Sichuan University,” “Sishengci North Street,” etc. Some addresses were roughly described, such as “Funan New District.” There were also some texts that did not have address information. The reason for this is that people have different usage habits (some people do not want to share their location information). We used the API provided by Baidu (
http://lbsyun.baidu.com/index.php?title=webapi/guide/webservice-geocoding) to convert these addresses to latitude and longitude. Among them, for line data, such as “Sishengci North Street,” we took its midpoint coordinates to represent it. For surface data, such as “Wangjiang Campus of Sichuan University” and even “Funan New District,” we extracted the central point coordinate to represent them respectively. We did not assign coordinates to those texts that did not have address information, including those with rough addresses. They were just labeled “Chengdu.”
2.2. Social Media Data Processing
In the subsequence processing steps, we mainly dealt with the text data. The main text processing steps included the conversion of full-width characters to half-width characters and from traditional Chinese to simplified Chinese, as well as recognition of the special characters and symbols. The aim of the first two steps was mainly to improve the computational efficiency of the model. The third step aimed to recognize special characters and symbols, such as “(>_<)”, “
![Ijgi 08 00029 i001]()
”, which are deleted and ignored by many common natural language processing (NLP) tools. However, for an emotional analysis, these special characters and symbols have emotional meaning, for example, “(>_<)” and “(>_<)>” can express troubled emotions. Therefore, in this paper, we interpreted them into text that could be processed by NLP. Some special characters and symbols could be translated into text by the micro-blog platform. For example,
![Ijgi 08 00029 i002]()
could be translated into “tear” (泪). However, others that could not be decoded by the micro-blog platform, such as (>_<) and
![Ijgi 08 00029 i003]()
, were interpreted according to the web’s “list of emoticons,” which includes the emotional implications of all kinds of emoticons through a large amount of published literature. For example, (>_<) can be translated into “troubled” (焦虑) and
![Ijgi 08 00029 i004]()
can be translated into “sad” (伤心).
Finally, after eliminating duplications, there were 39341 data records stored in our database.
2.3. Constructing the Word Vector List
In this paper, we first converted each word from the previously processed texts into a multidimensional vector. This process included two phases: word segmentation and the removal of stop words, and the construction of a word vector list.
2.3.1. Word Segmentation and the Removal of Stop Words
Unlike the English language, there is no space separation between Chinese words. Therefore, we needed to segment Chinese text to get separate words. Additionally, the Chinese micro-blog is more colloquial, which brings great challenges to word segmentation. We compared many different Chinese word segmentation tools, such as “Stanford NLP”, “ANSJ”, “NLPIR (Natural Language Processing & Information Retrieval Sharing Platform)”, and so on. We found that “NLPIR” had the best performance in terms of the accuracy and speed of word segmentation.
There are many meaningless words in text after word segmentation; these are called stop words, such as “在 (on),” “是 (is),” “一会 (a moment),” and so on. These words could affect the accuracy of the model and therefore should be removed. In this paper, we used the vocabulary of stop words developed by the Harbin Institute of Technology—Social Computing and Information Retrieval Research Center to remove stop words. As the focus of this paper was on the emotional analysis, we optimized the vocabulary of stop words by removing sentimental words, such as “愤然 (indignant),” “幸亏 (luckily),” “嘻 (hey)”, etc.
2.3.2. Construction of the Word Vector List
The input used for the emotion classification model was a word vector matrix. We needed to convert each word in the micro-blog text into a multidimensional vector, and then convert the whole sentence into a word vector matrix. In this paper, we converted all previously processed texts into a word vector list. The training text and new text to be categorized were transformed into a word vector matrix by matching them with the word vector list. The method we used for this was word2vec [
26], which projected every word in every sentence to a specified dimensional vector space.
There are two commonly used models in word2vec, which are skip-gram [
27,
28] and CBOW (Continuous Bag-of-Words) [
27,
28]. A large number of experiments have been done to compare these two models in terms of performance and accuracy [
29] and the results show that the semantic accuracy rate of the skip-gram model is better than that of the CBOW model. Therefore, we used the Skip-gram model in our experiment to construct the text feature vector.
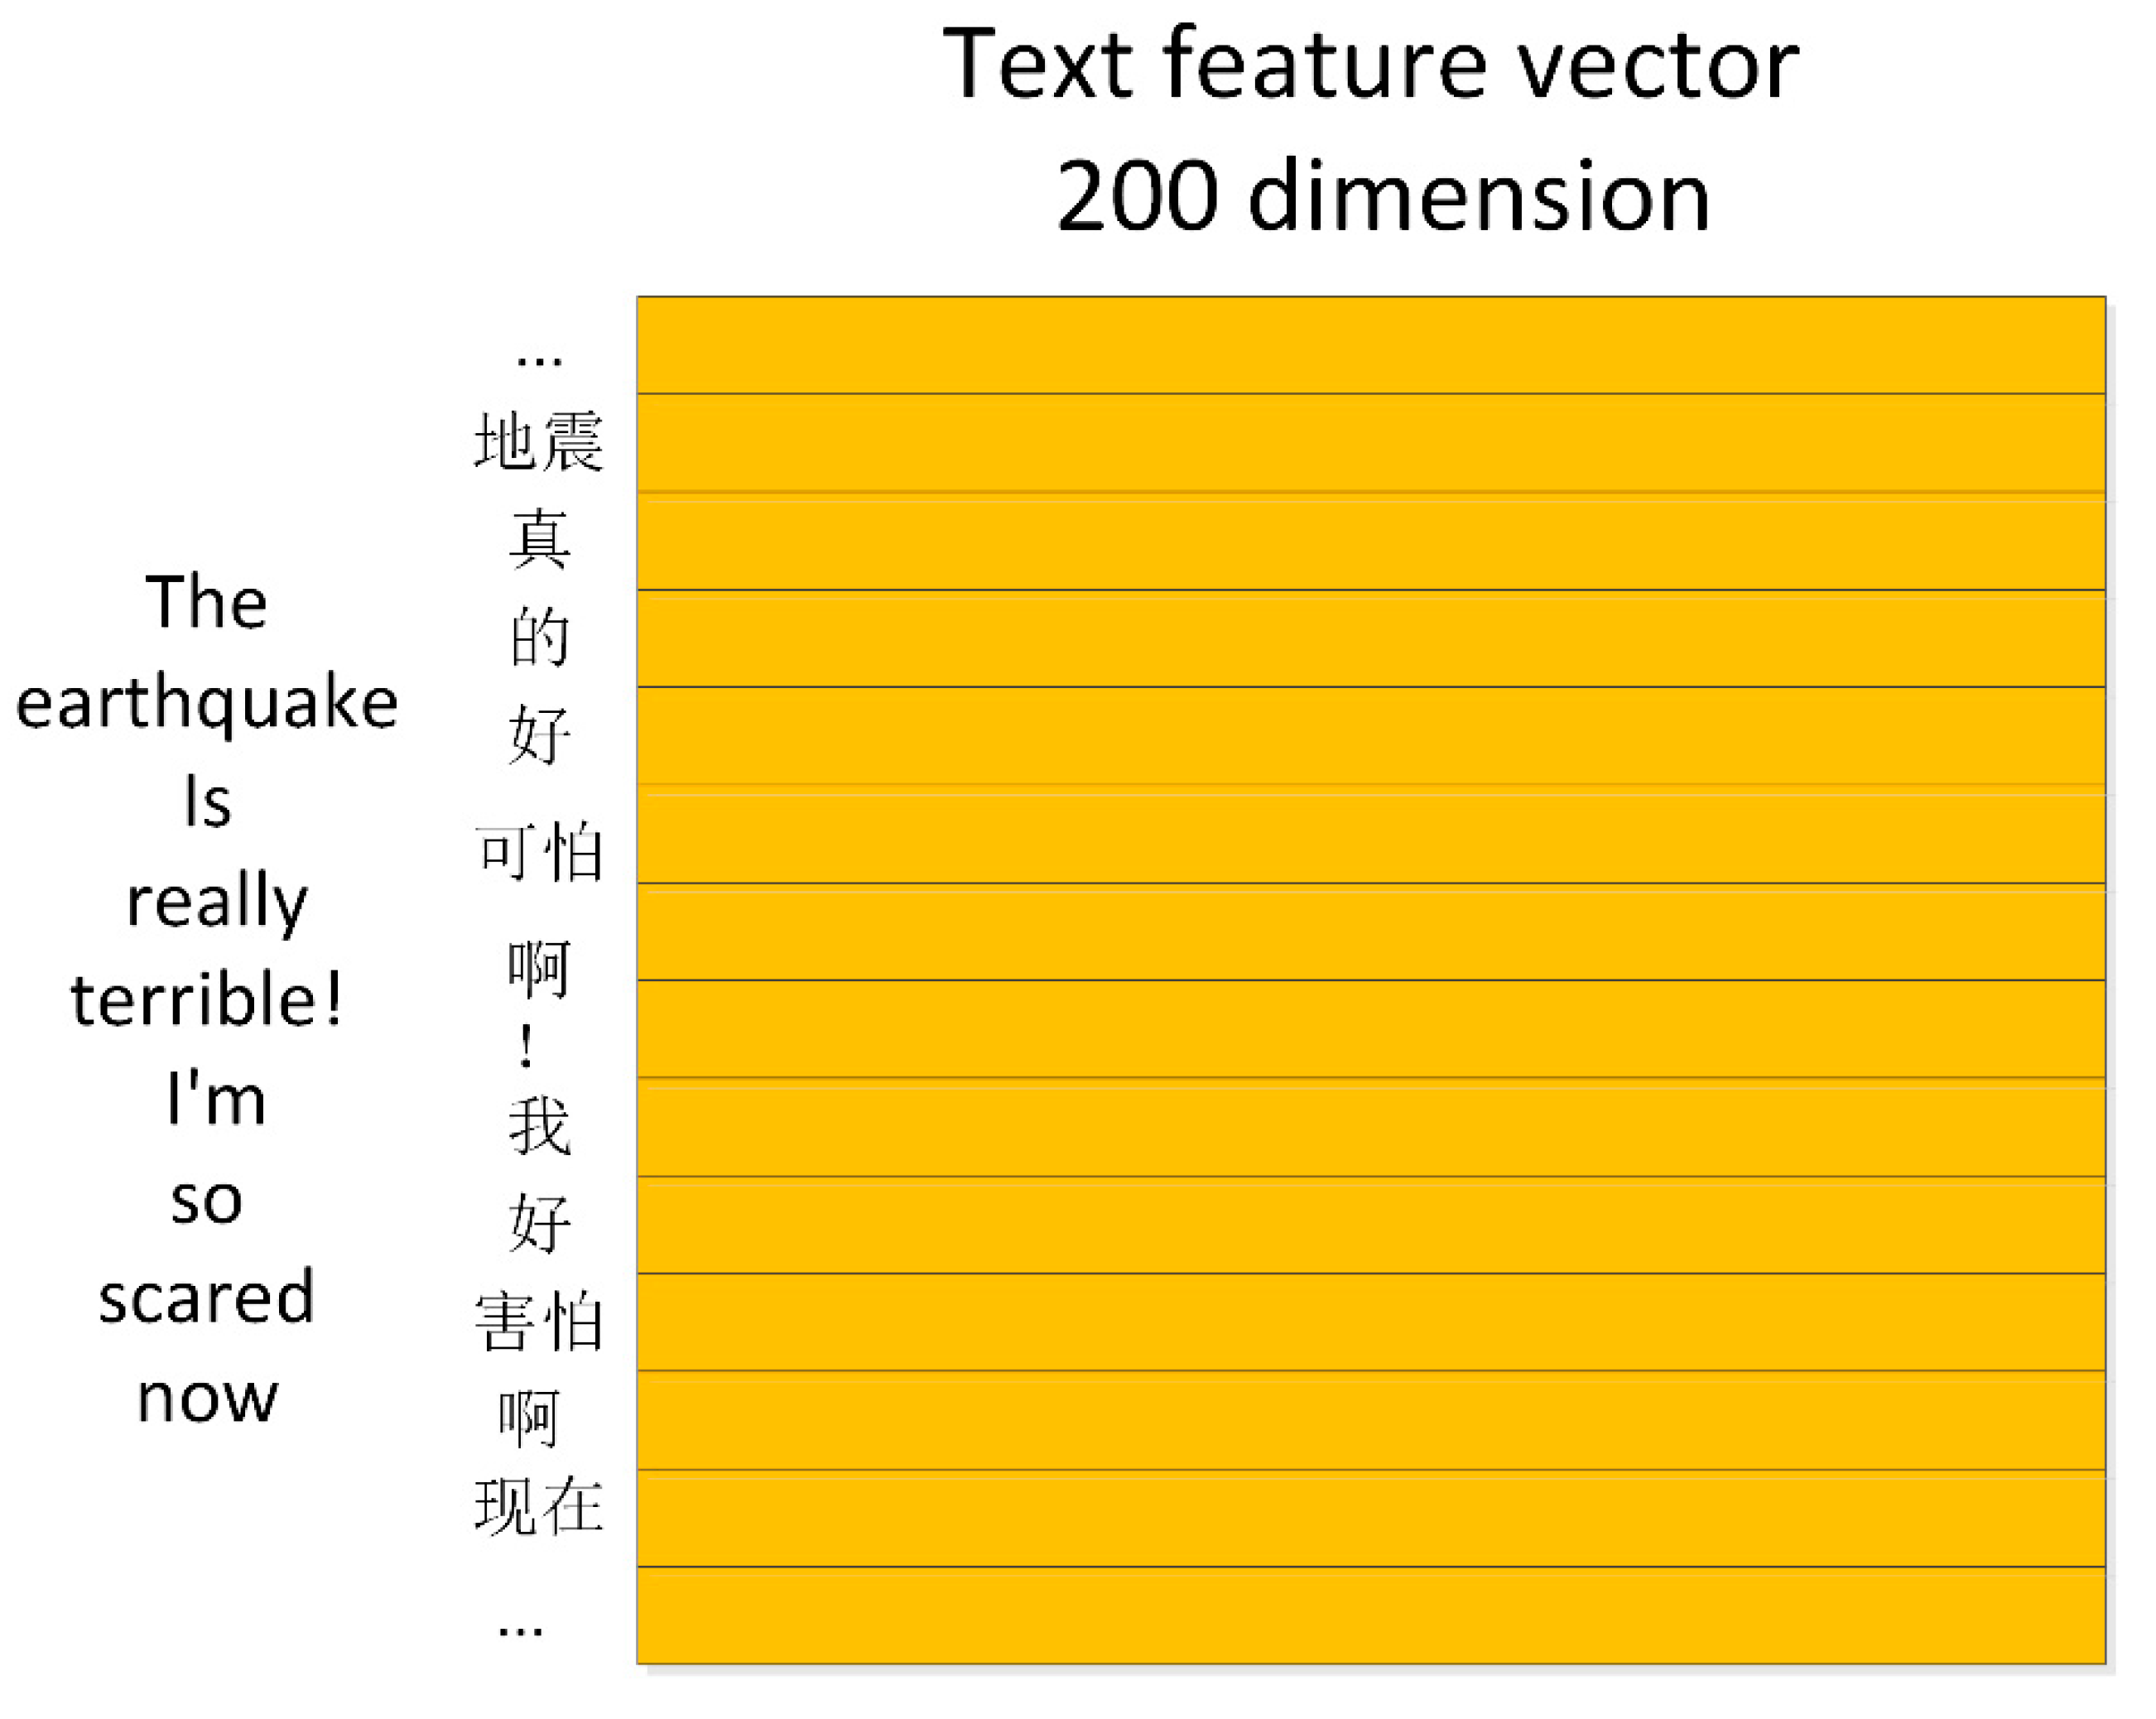
The skip-gram model can determine correlations between words for corpus training. These correlations are represented by the multidimensional feature vectors of each word. Additionally, these multidimensional feature vectors are calculated by taking full consideration of the context of semantic information. From the below formula, given a current word,
, this model tries to find words which have a contextual semantic relationship with the current word. The target of this model is to maximize the objective function,
G:
In this formula, represents the current word and represents the context window. represents the probability of the context information in the current word.
When the training converges, words with similar semantic meanings are closer in the specified dimensional vector space. We exported the text feature vector of each word in the training corpus to generate word embedding. The structure of text feature vectors is shown as
Figure 3.
2.4. Model Training
The deep leaning model selected in this paper was the convolutional neural network. We read much related literature and found that different deep learning methods can be selected for emotion classification, such as the convolutional neural network (CNN), recurrent neural network (RNN), hierarchy attention network (HAN), etc. These models [
30,
31,
32] all have their own characteristics and usage scenarios. According to the literature [
33], CNN performs emotion classification well, especially in shorter sentences. RNN performs document-level emotion classification well [
34]. A previous study [
35] presented the performances of the CNN, RNN, and HAN in emotion classification. The results showed that when the training corpus is large enough, HAN has the highest accuracy, but CNN performs the best when the training corpus is not very large. The annotation of a large training corpus requires a lot of manpower and time. Additionally, it takes longer to train the HAN and RNN models than the CNN model. In this paper, the training corpus used was micro-blog texts, which are mainly short texts. Additionally, the amount of manually tagged training corpus data was more suitable for the CNN model. Therefore, we selected CNN as the method to extract the public emotion contained in social media. The training process of the model is shown below.
2.4.1. Word Segmentation, Removal of Stop Words, and Construction of the Feature Matrix
First, we segmented the training texts to obtain separate words. Then, we used a vocabulary of stop words to remove the meaningless words contained in those separate words. Finally, the remaining words were converted into word vectors through matching with a previously generated word vector list. Ultimately, every sentence was transformed into a feature matrix.
2.4.2. Training Convolutional Neural Network Model
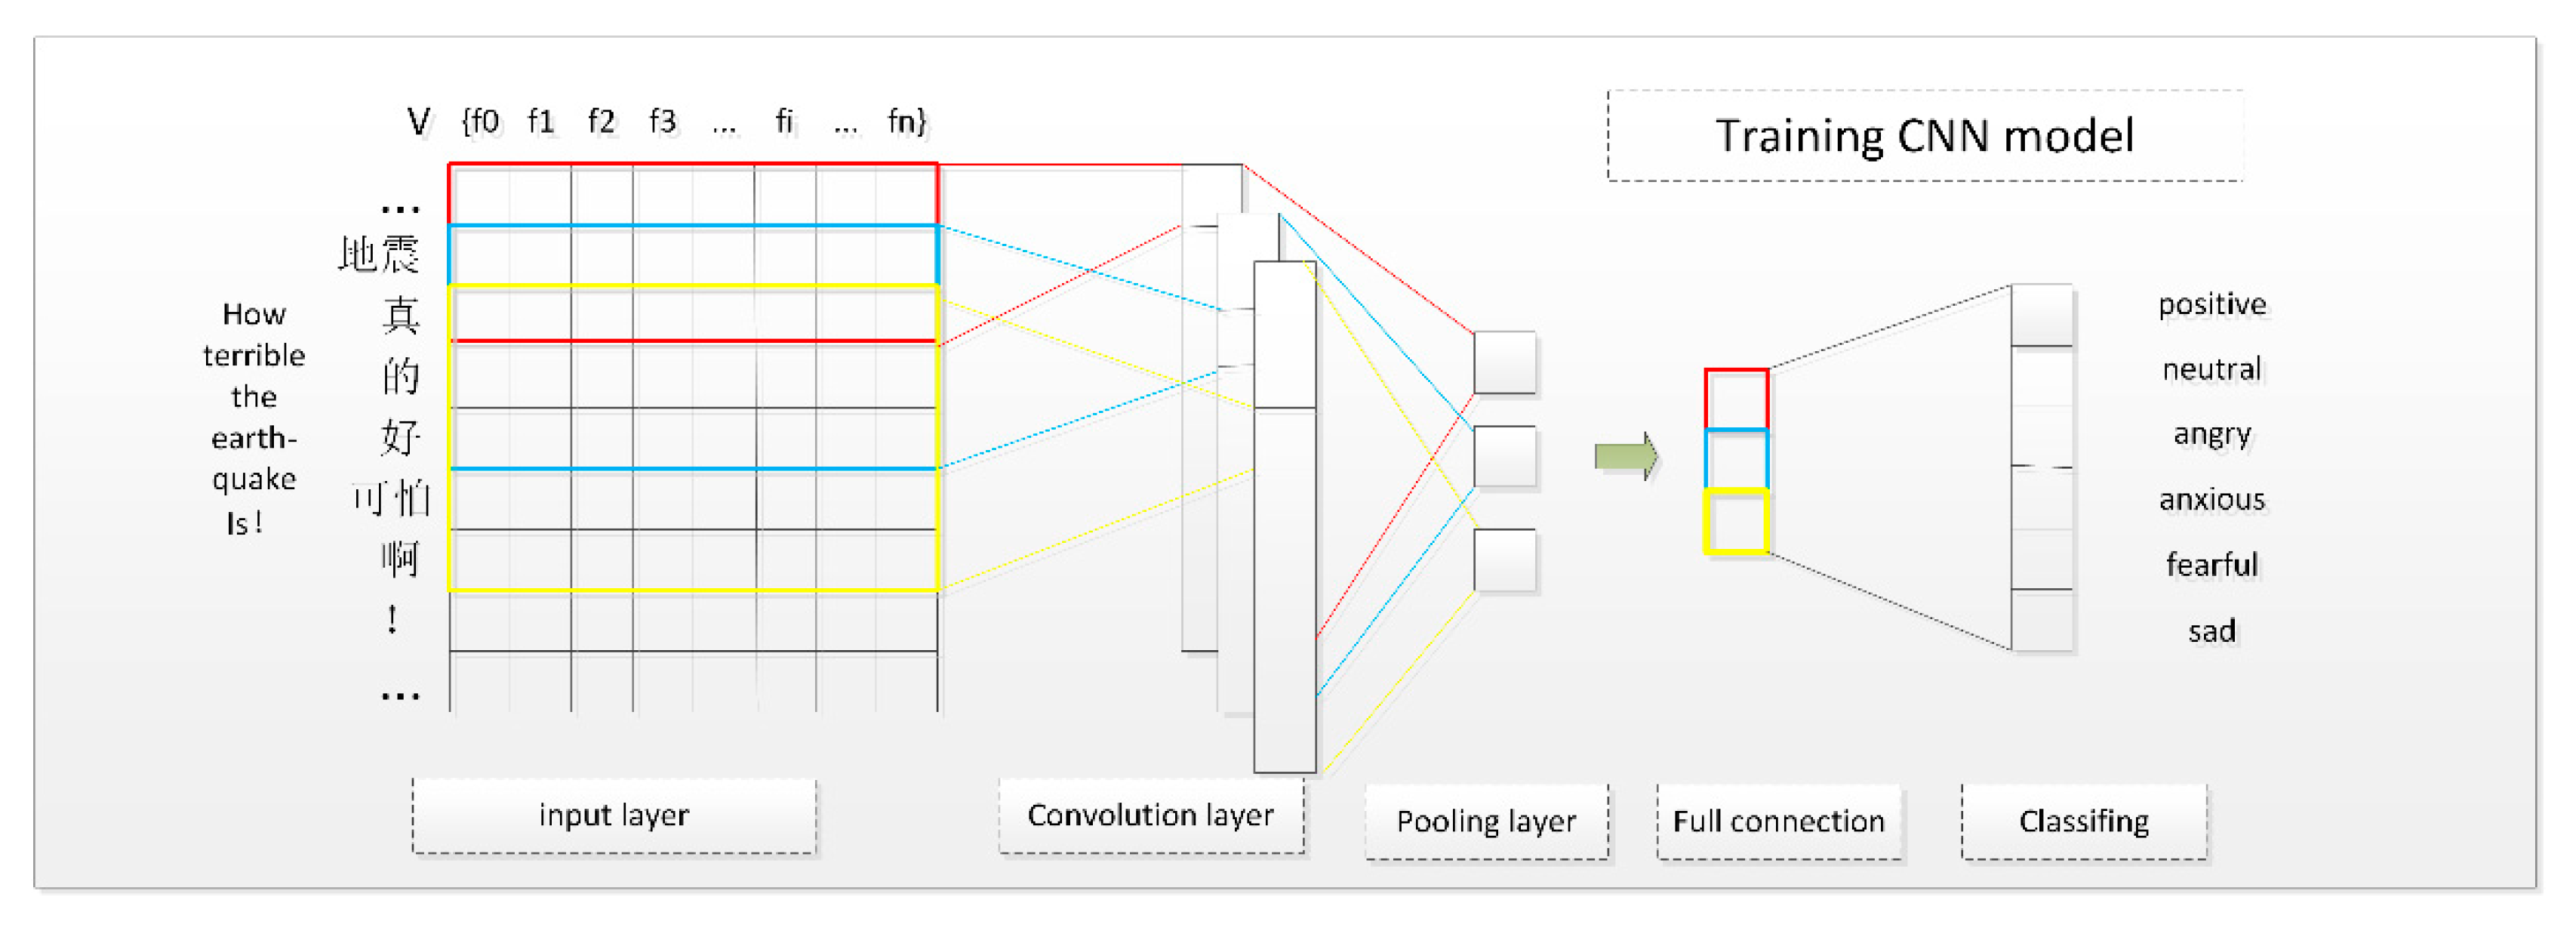
The convolutional neural network (CNN) is a variant of the neural network. It was first successfully used for the recognition of images and videos. Later, some researchers introduced it into the field of natural language processing [
36] and found that it had a good effect. The CNN model used in this paper consisted of an input layer, a convolutional layer, a pooling layer, a fully connected layer, and classification. The structure of the CNN is shown in
Figure 4.
In the course of the training process of the CNN model, the neurons in it are usually set to three dimensions: depth, width, and height. The size of each layer is depth × width × height [
37]. For example, if there is a sentence with 140 words, and each word is set to be 200 dimensions, the size of the input layer is 1 × 140 × 200.
Next, we introduce the layers of the convolution neural network.
Input layer: The input layer of CNN is a matrix that consists of text feature vectors. This matrix is calculated using the skip-gram model, which was described in
Section 2.2. The rows and columns (dimension) in this matrix were set before we put the matrix into the neural network model. Taking the Sina micro-blog text as an example, the number of characters in each sentence was less than 140. Therefore, we set the rows in the matrix to 140. If the number of words in a sentence was less than 140 characters, we used the empty character "space" to supplement the missing characters. Therefore, every sentence is expressed as follows:
In this formula, S represents a character or “pad,” and ⊕ is the concatenation operator.
Convolutional layer: The convolution layer is mainly used to extract features. It abstracts some fragmented elements into features which can be used to distinguish different categories. By convolution, many low-level features can be abstracted to higher level features. For example, the single word “打” or “call” has no emotional meaning. However, the higher-level feature “打call (praise)” can express an emotional attribute. The emotional attributes of these words can be acquired by the model through a large number of training corpus.
Given a matrix
u that is from the input layer for convolution operation, the formula is as follows:
For the matrix , D represents the embedding dimensionality, and L represents the sentence length. The parameter represents the j-th convolutional kernel, which is applied to a window of s words. The parameter represents a bias term. is a non-linear activation function.
Pooling layer: After the convolution operation, we can use the output features to directly classify emotions. However, in doing so, we will not only face the challenge of computational complexity, but also the problem of over-fitting, which will affect the classification accuracy. The pooling operation can solve these problems well. In addition, the pooling operation can also serve as a feature selector that can help to identify the most important features to improve the classification performance.
There are two methods that can be selected, namely max pooling and average pooling. We achieved better results with the max pooling method. This method selects global semantic features and attempts to capture the most important feature with the highest value for each feature map [
37]. The output from the convolution operation
is used as the input of the pooling operation. The formula is as follows:
Fully Connected Layer: The neurons in this layer have full connections with all neurons in the previous layer. Meanwhile, the value of the full connected layer can be calculated through the neurons in the previous layer. In the calculation process, the dropout regularization method is usually used to avoid over-fitting.
Classifying: We can obtain the emotional labels of the original text through the softmax function. In other words, these calculated results represent the probability distribution of the emotional labels.
Based on the training corpus, we can identify the best parameters for the CNN model. Then, this trained model can be used to calculate the emotional categories of new texts.
2.5. Emotion Classification
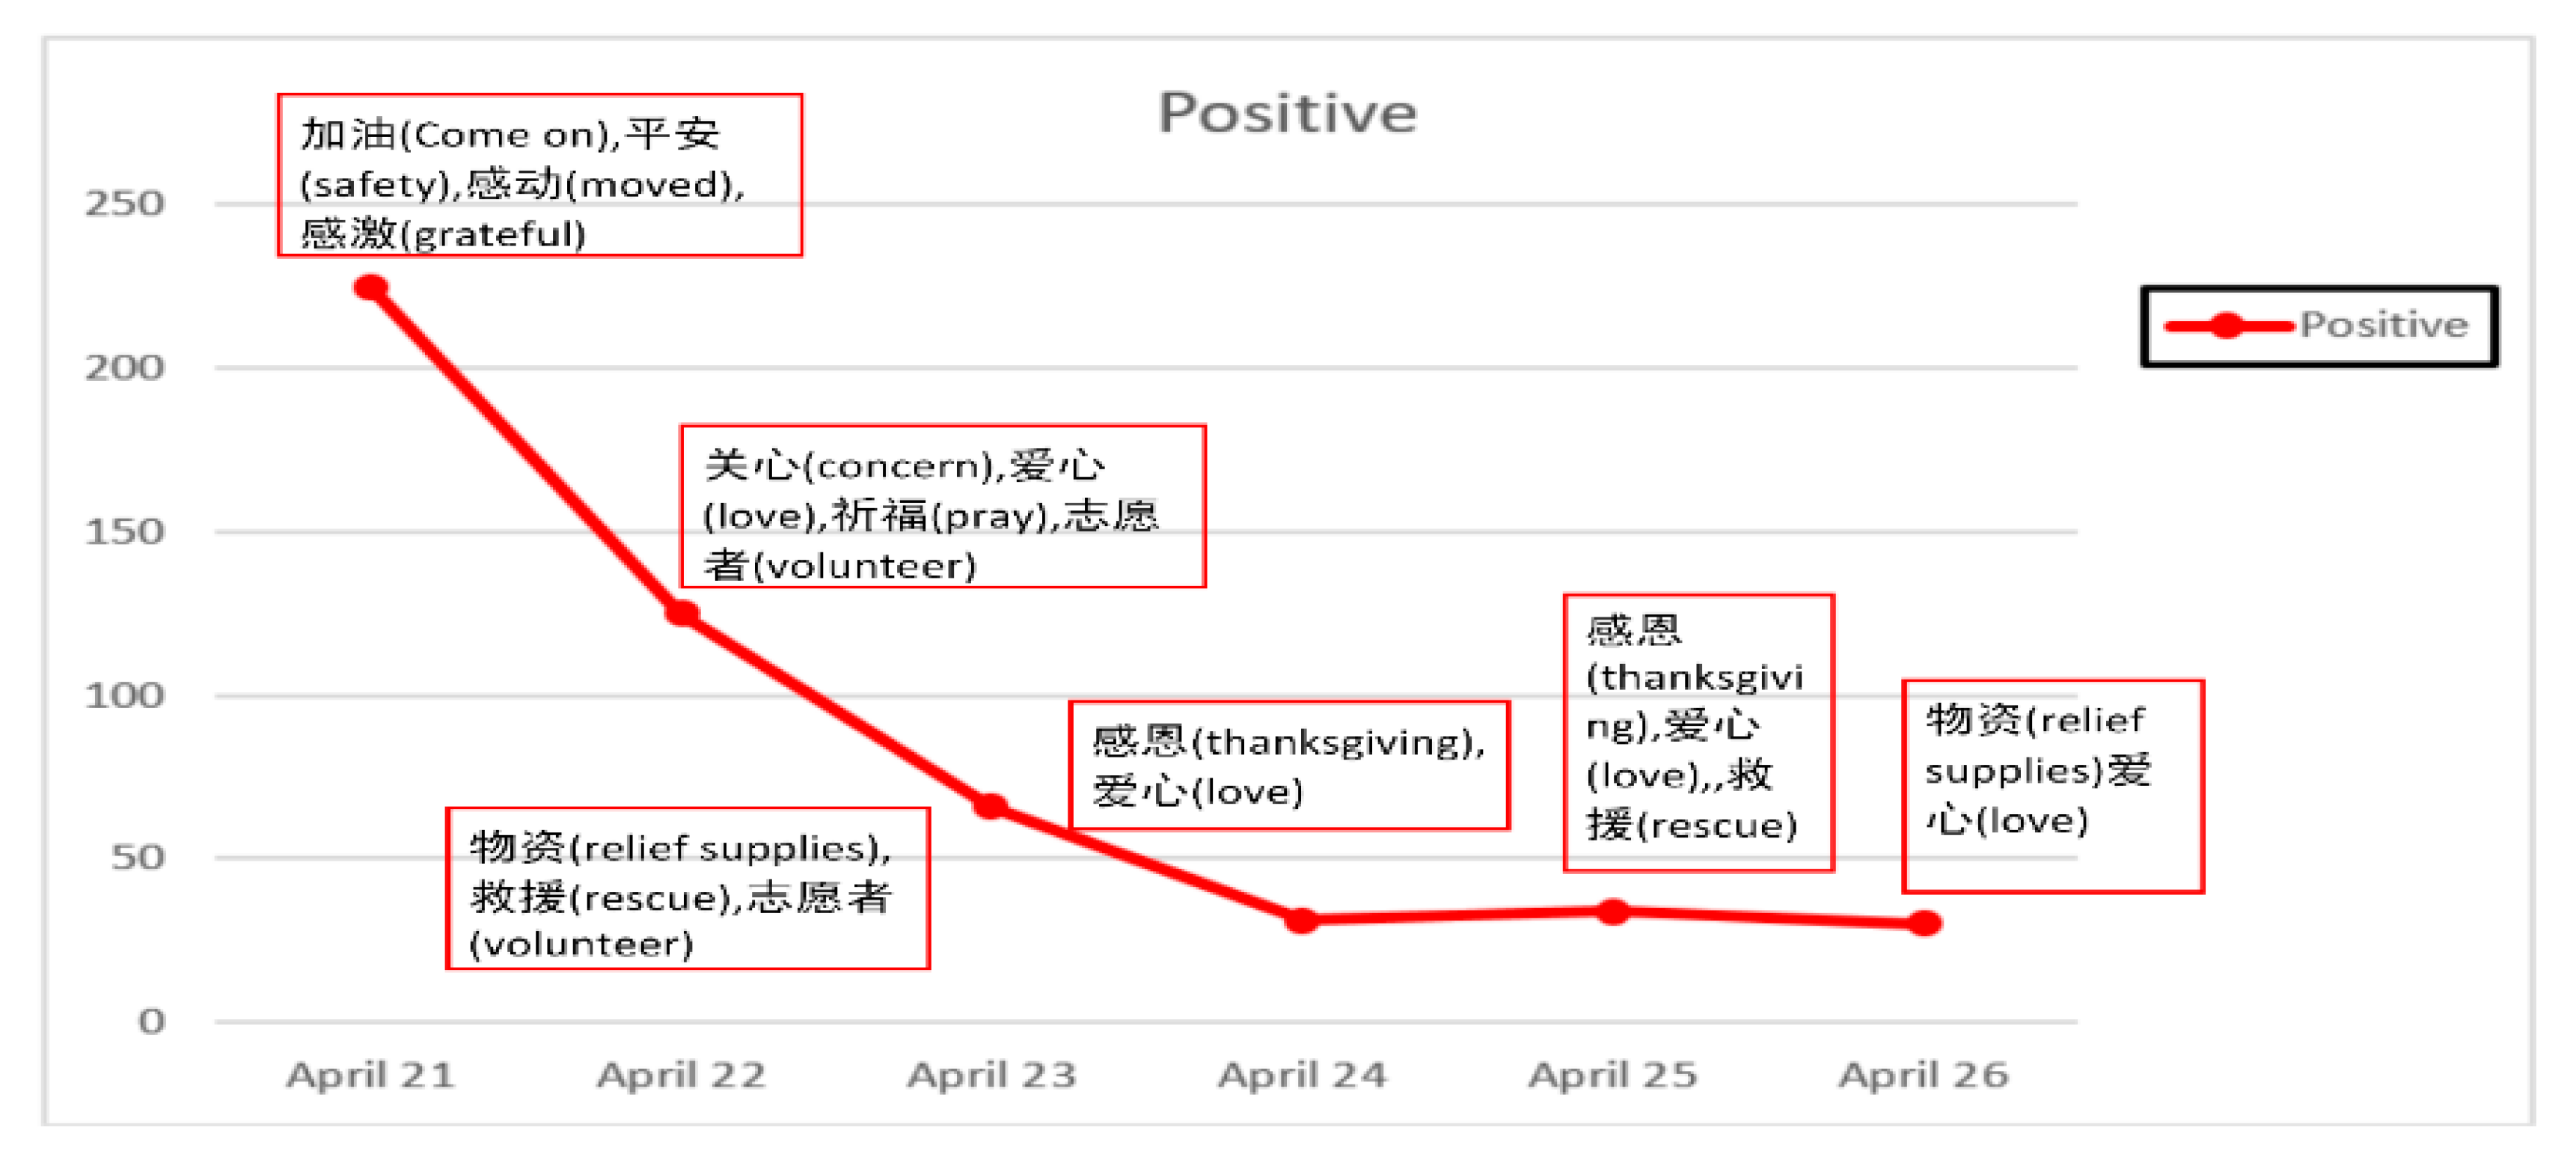
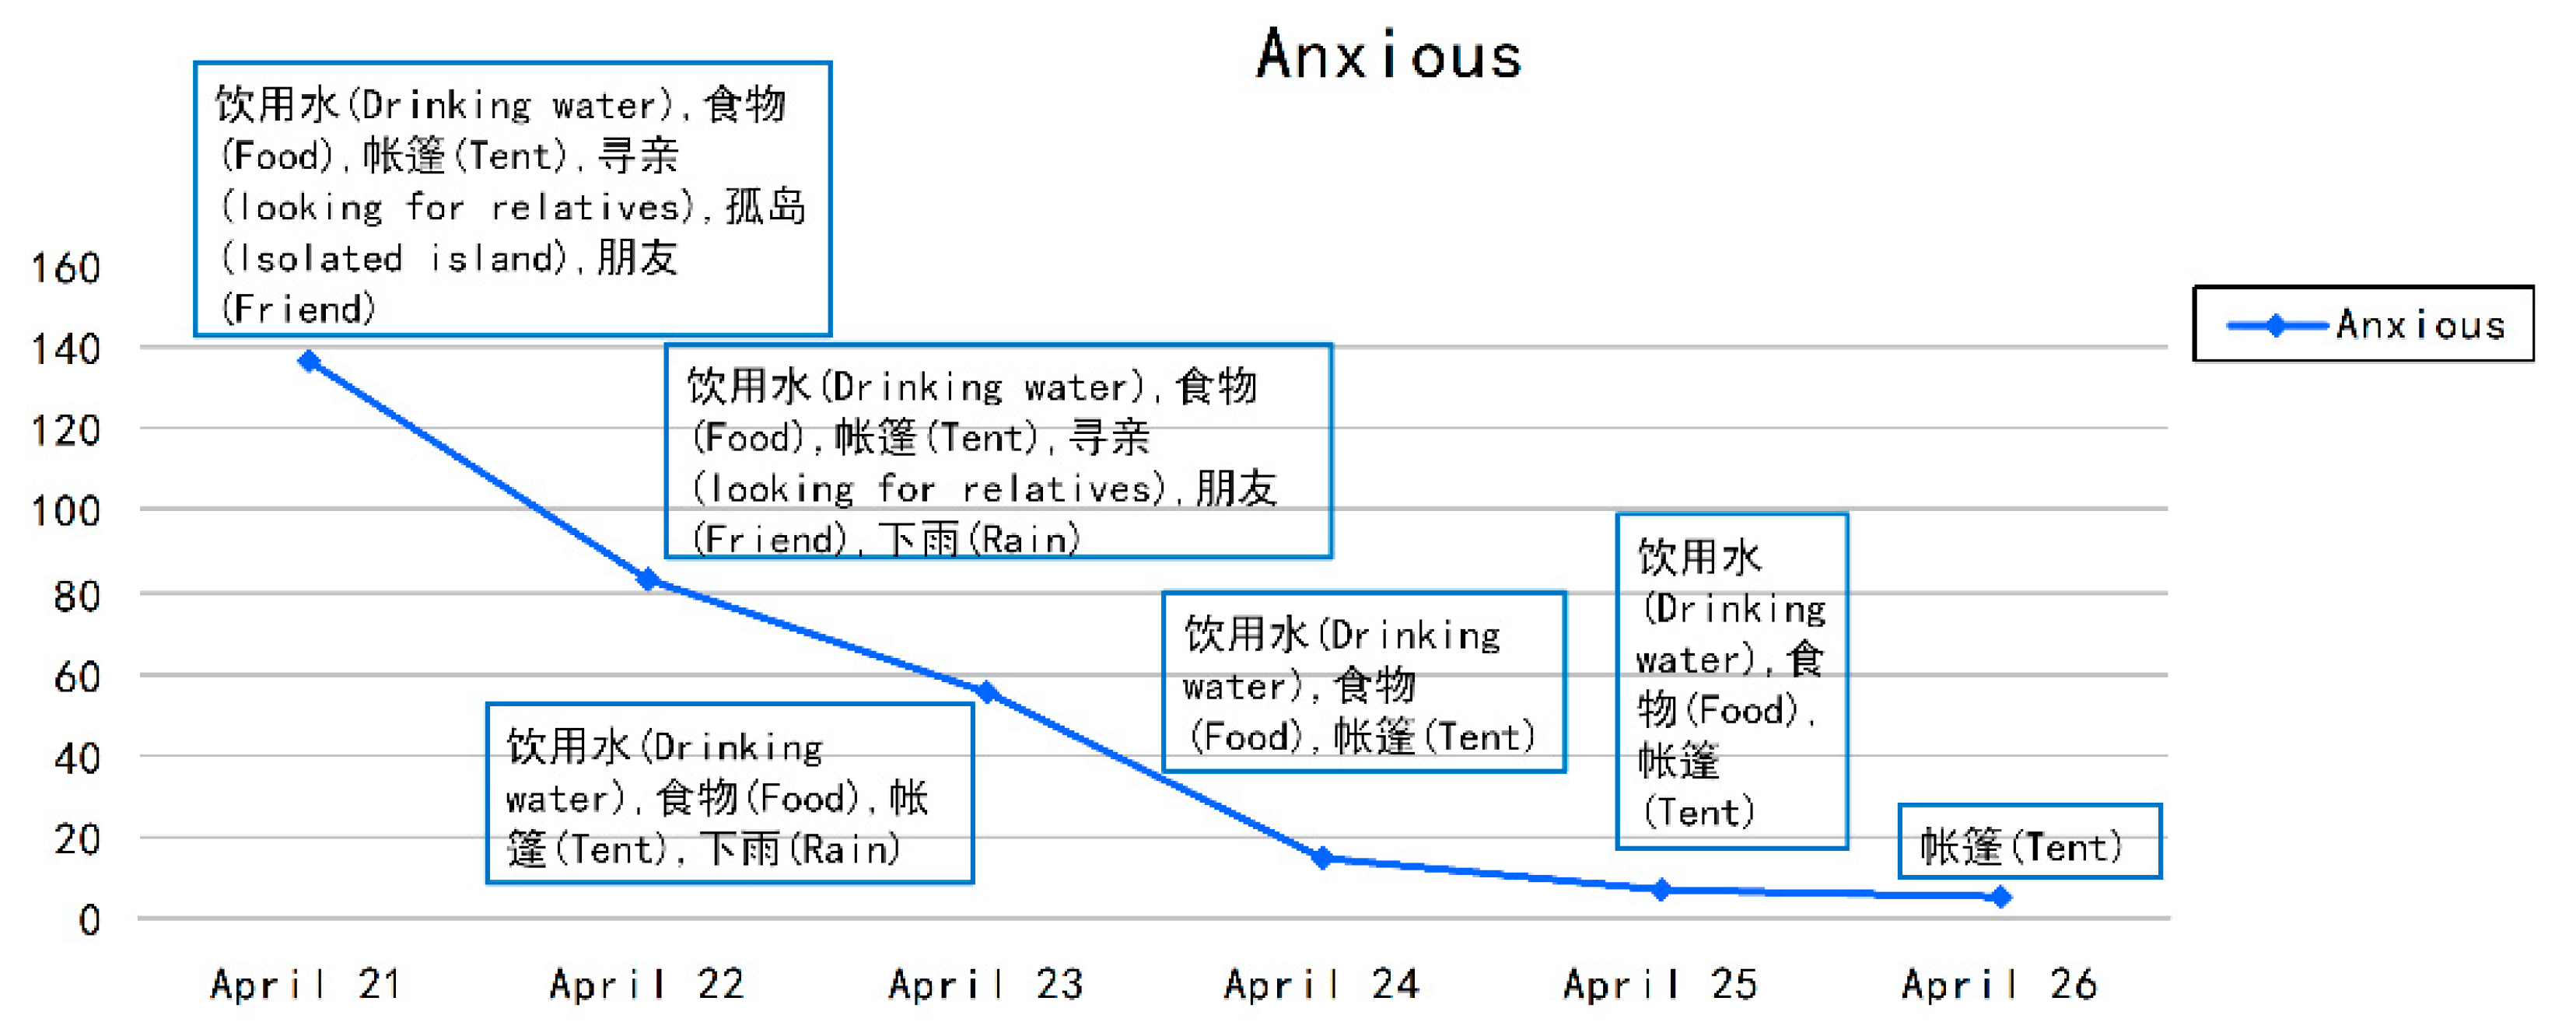
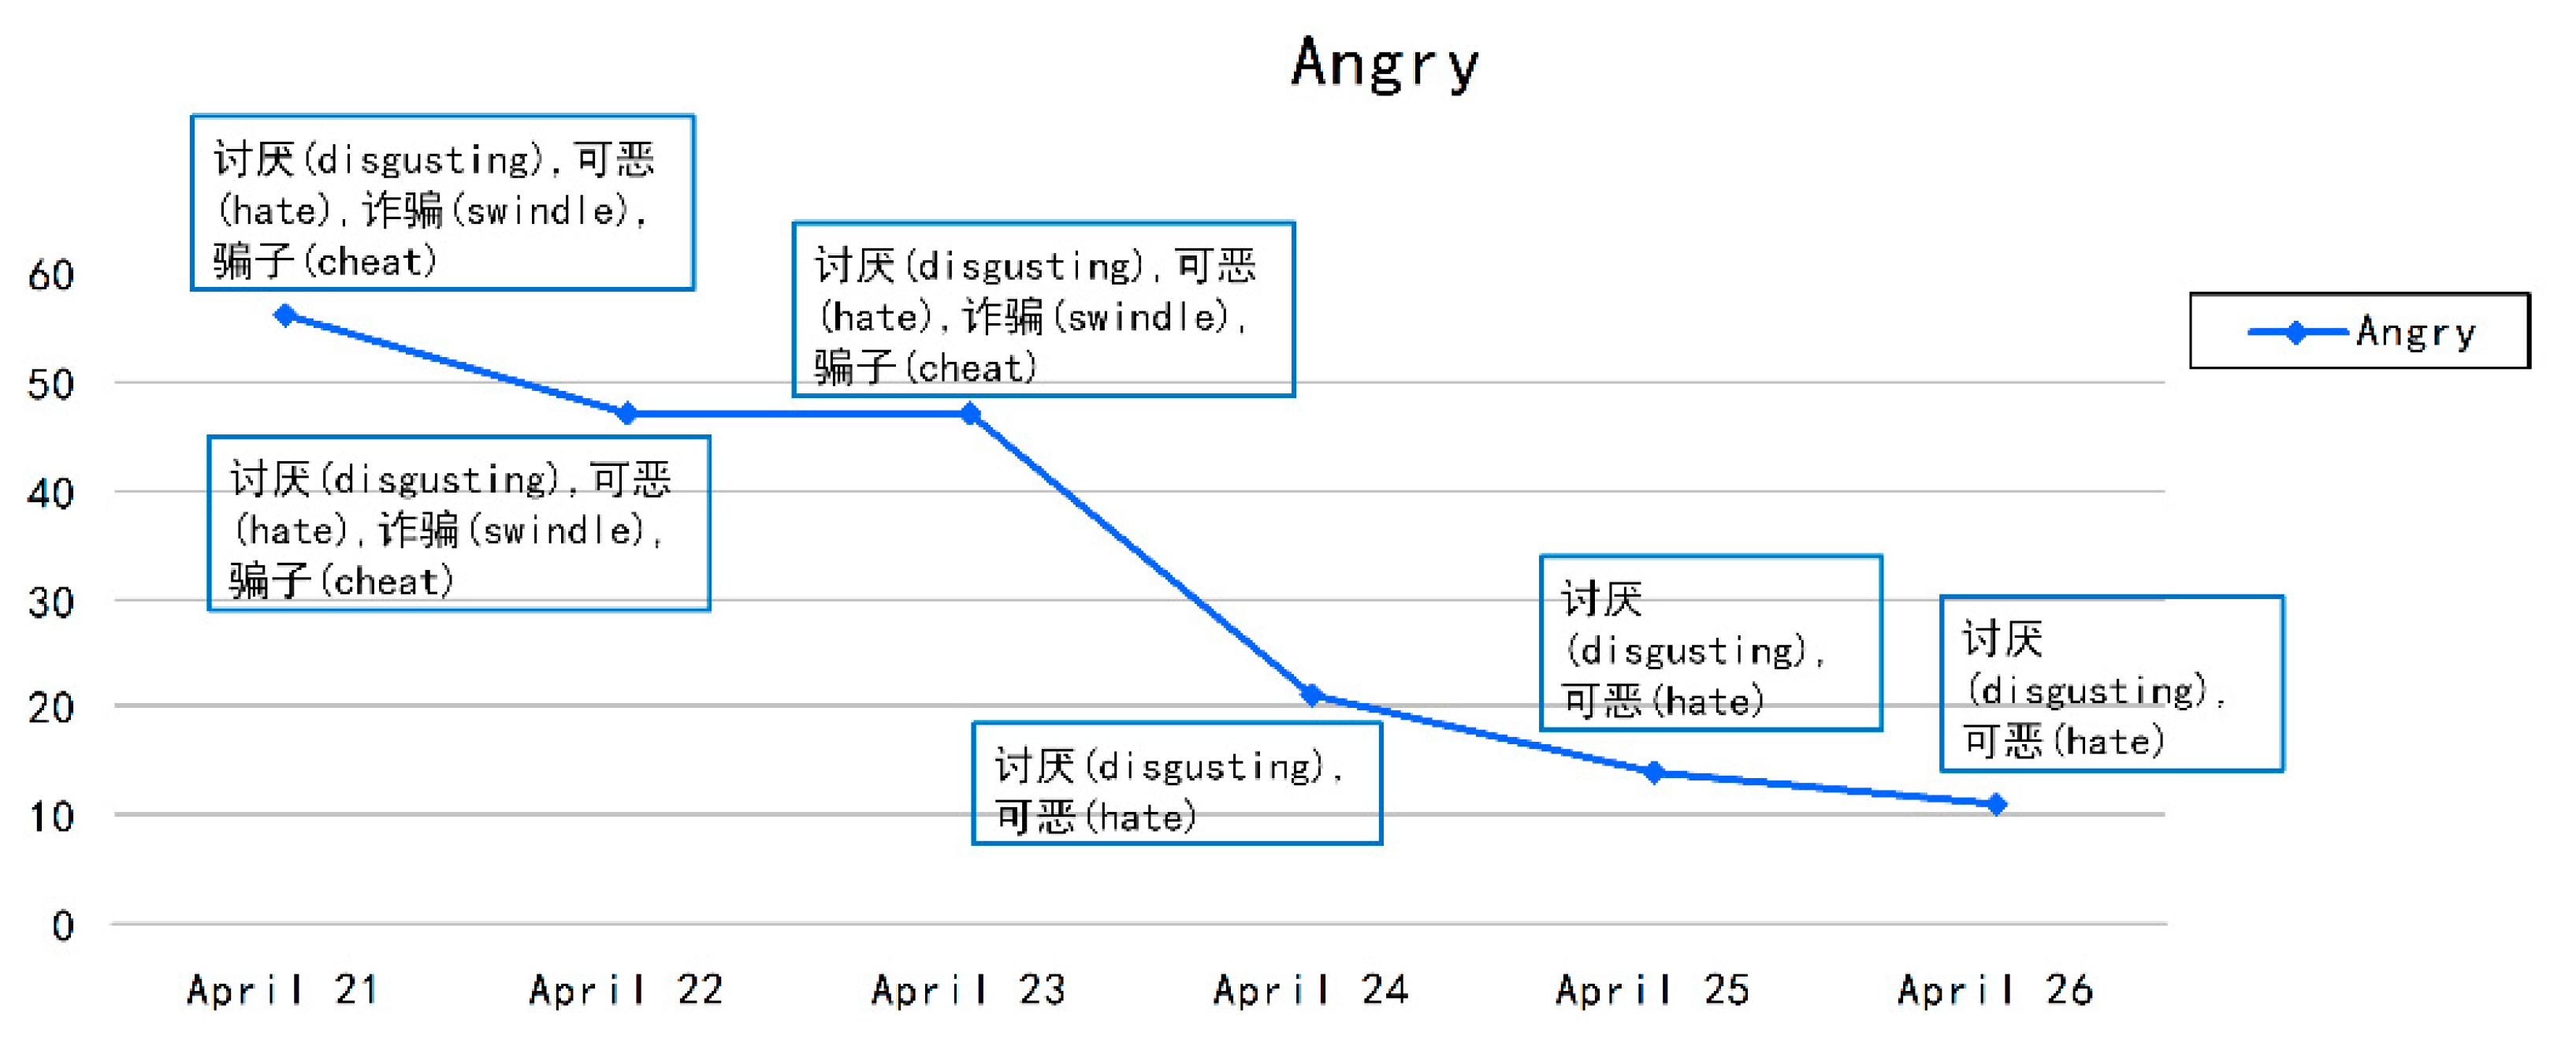
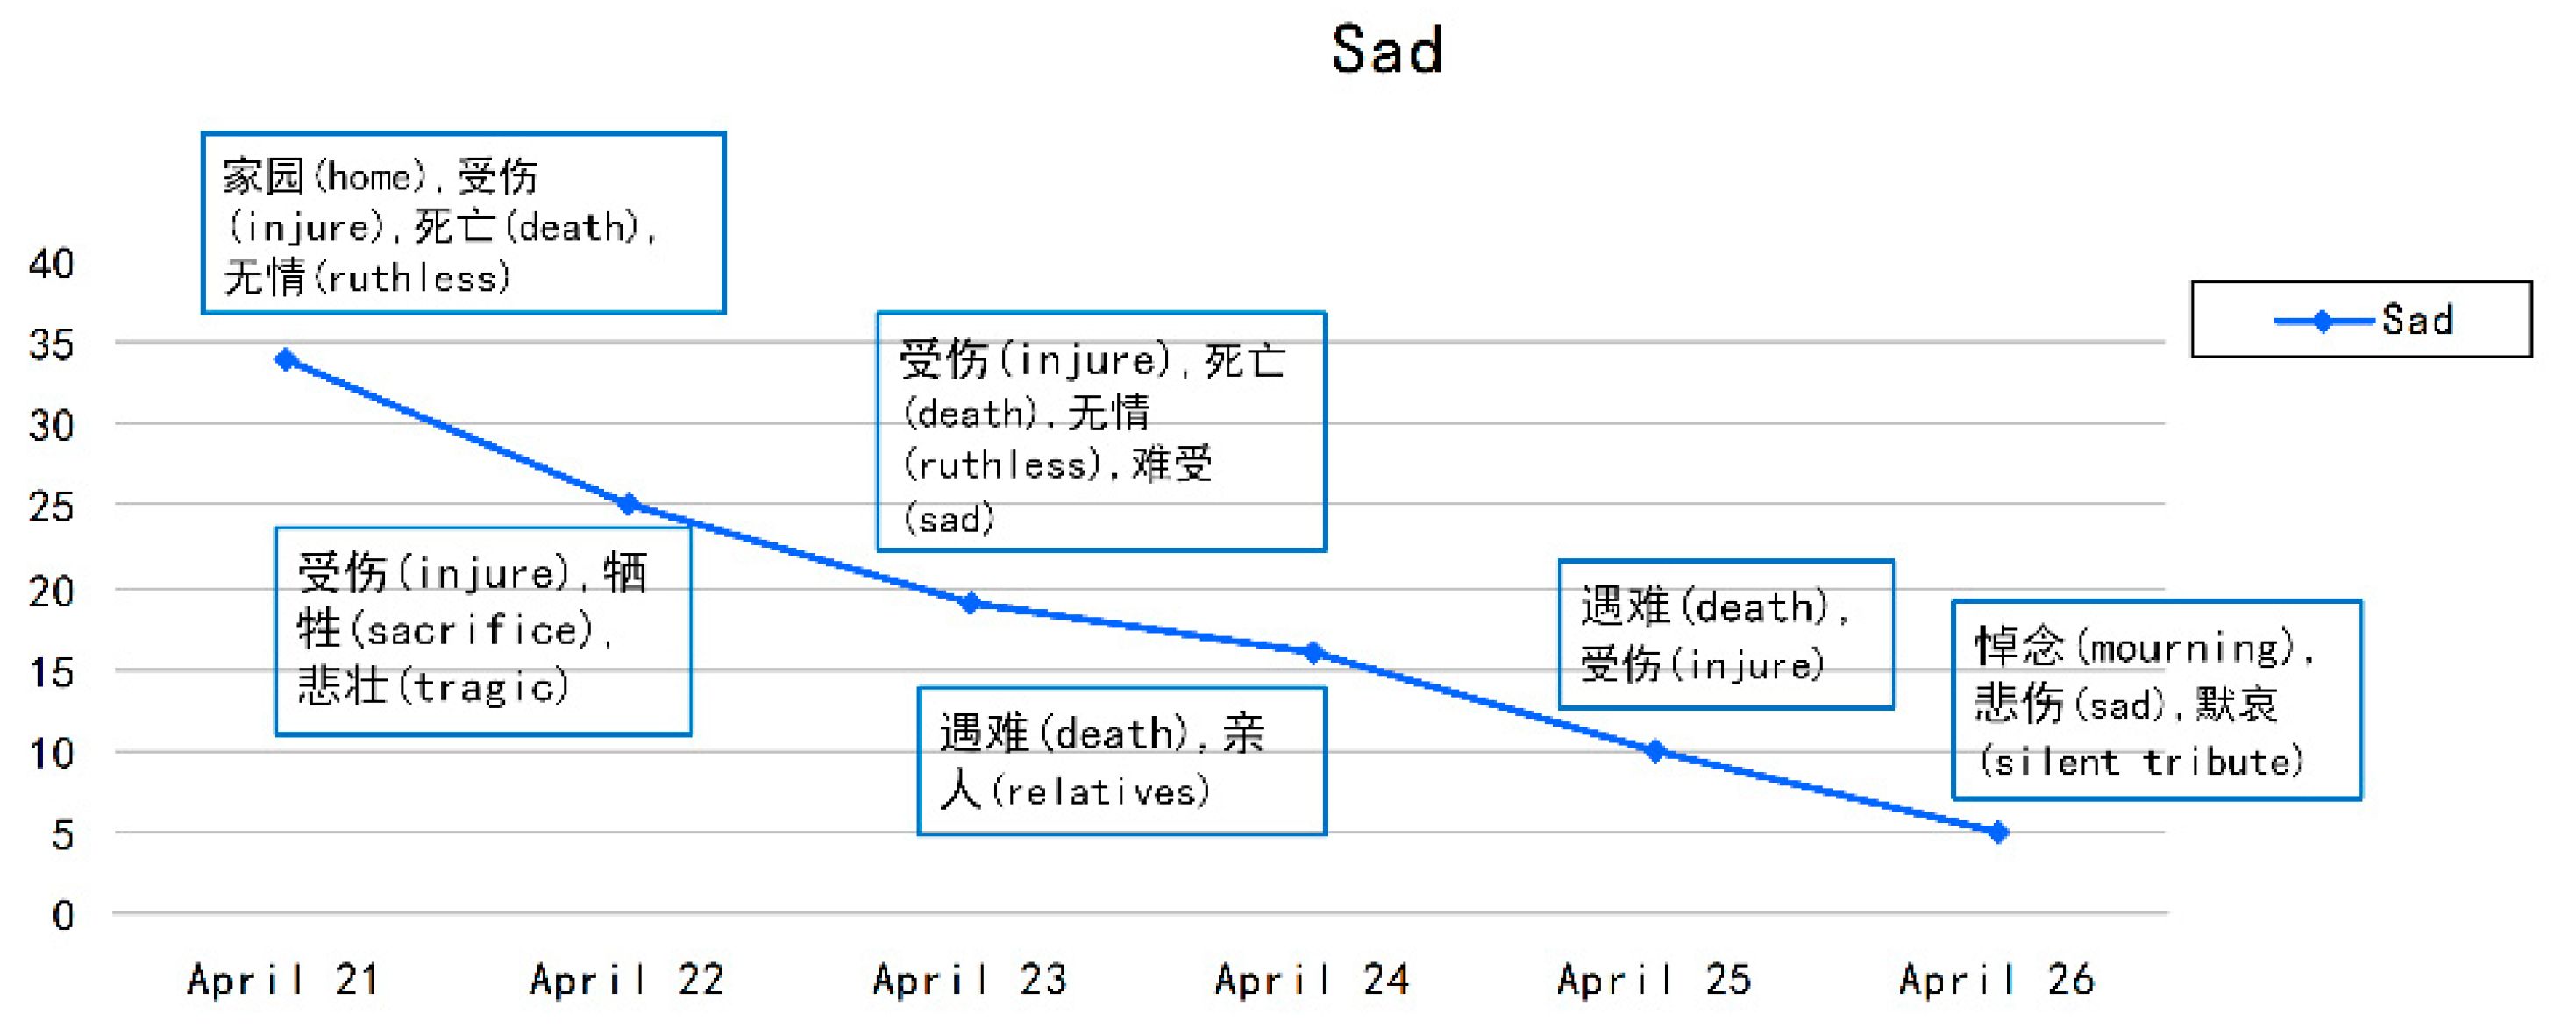
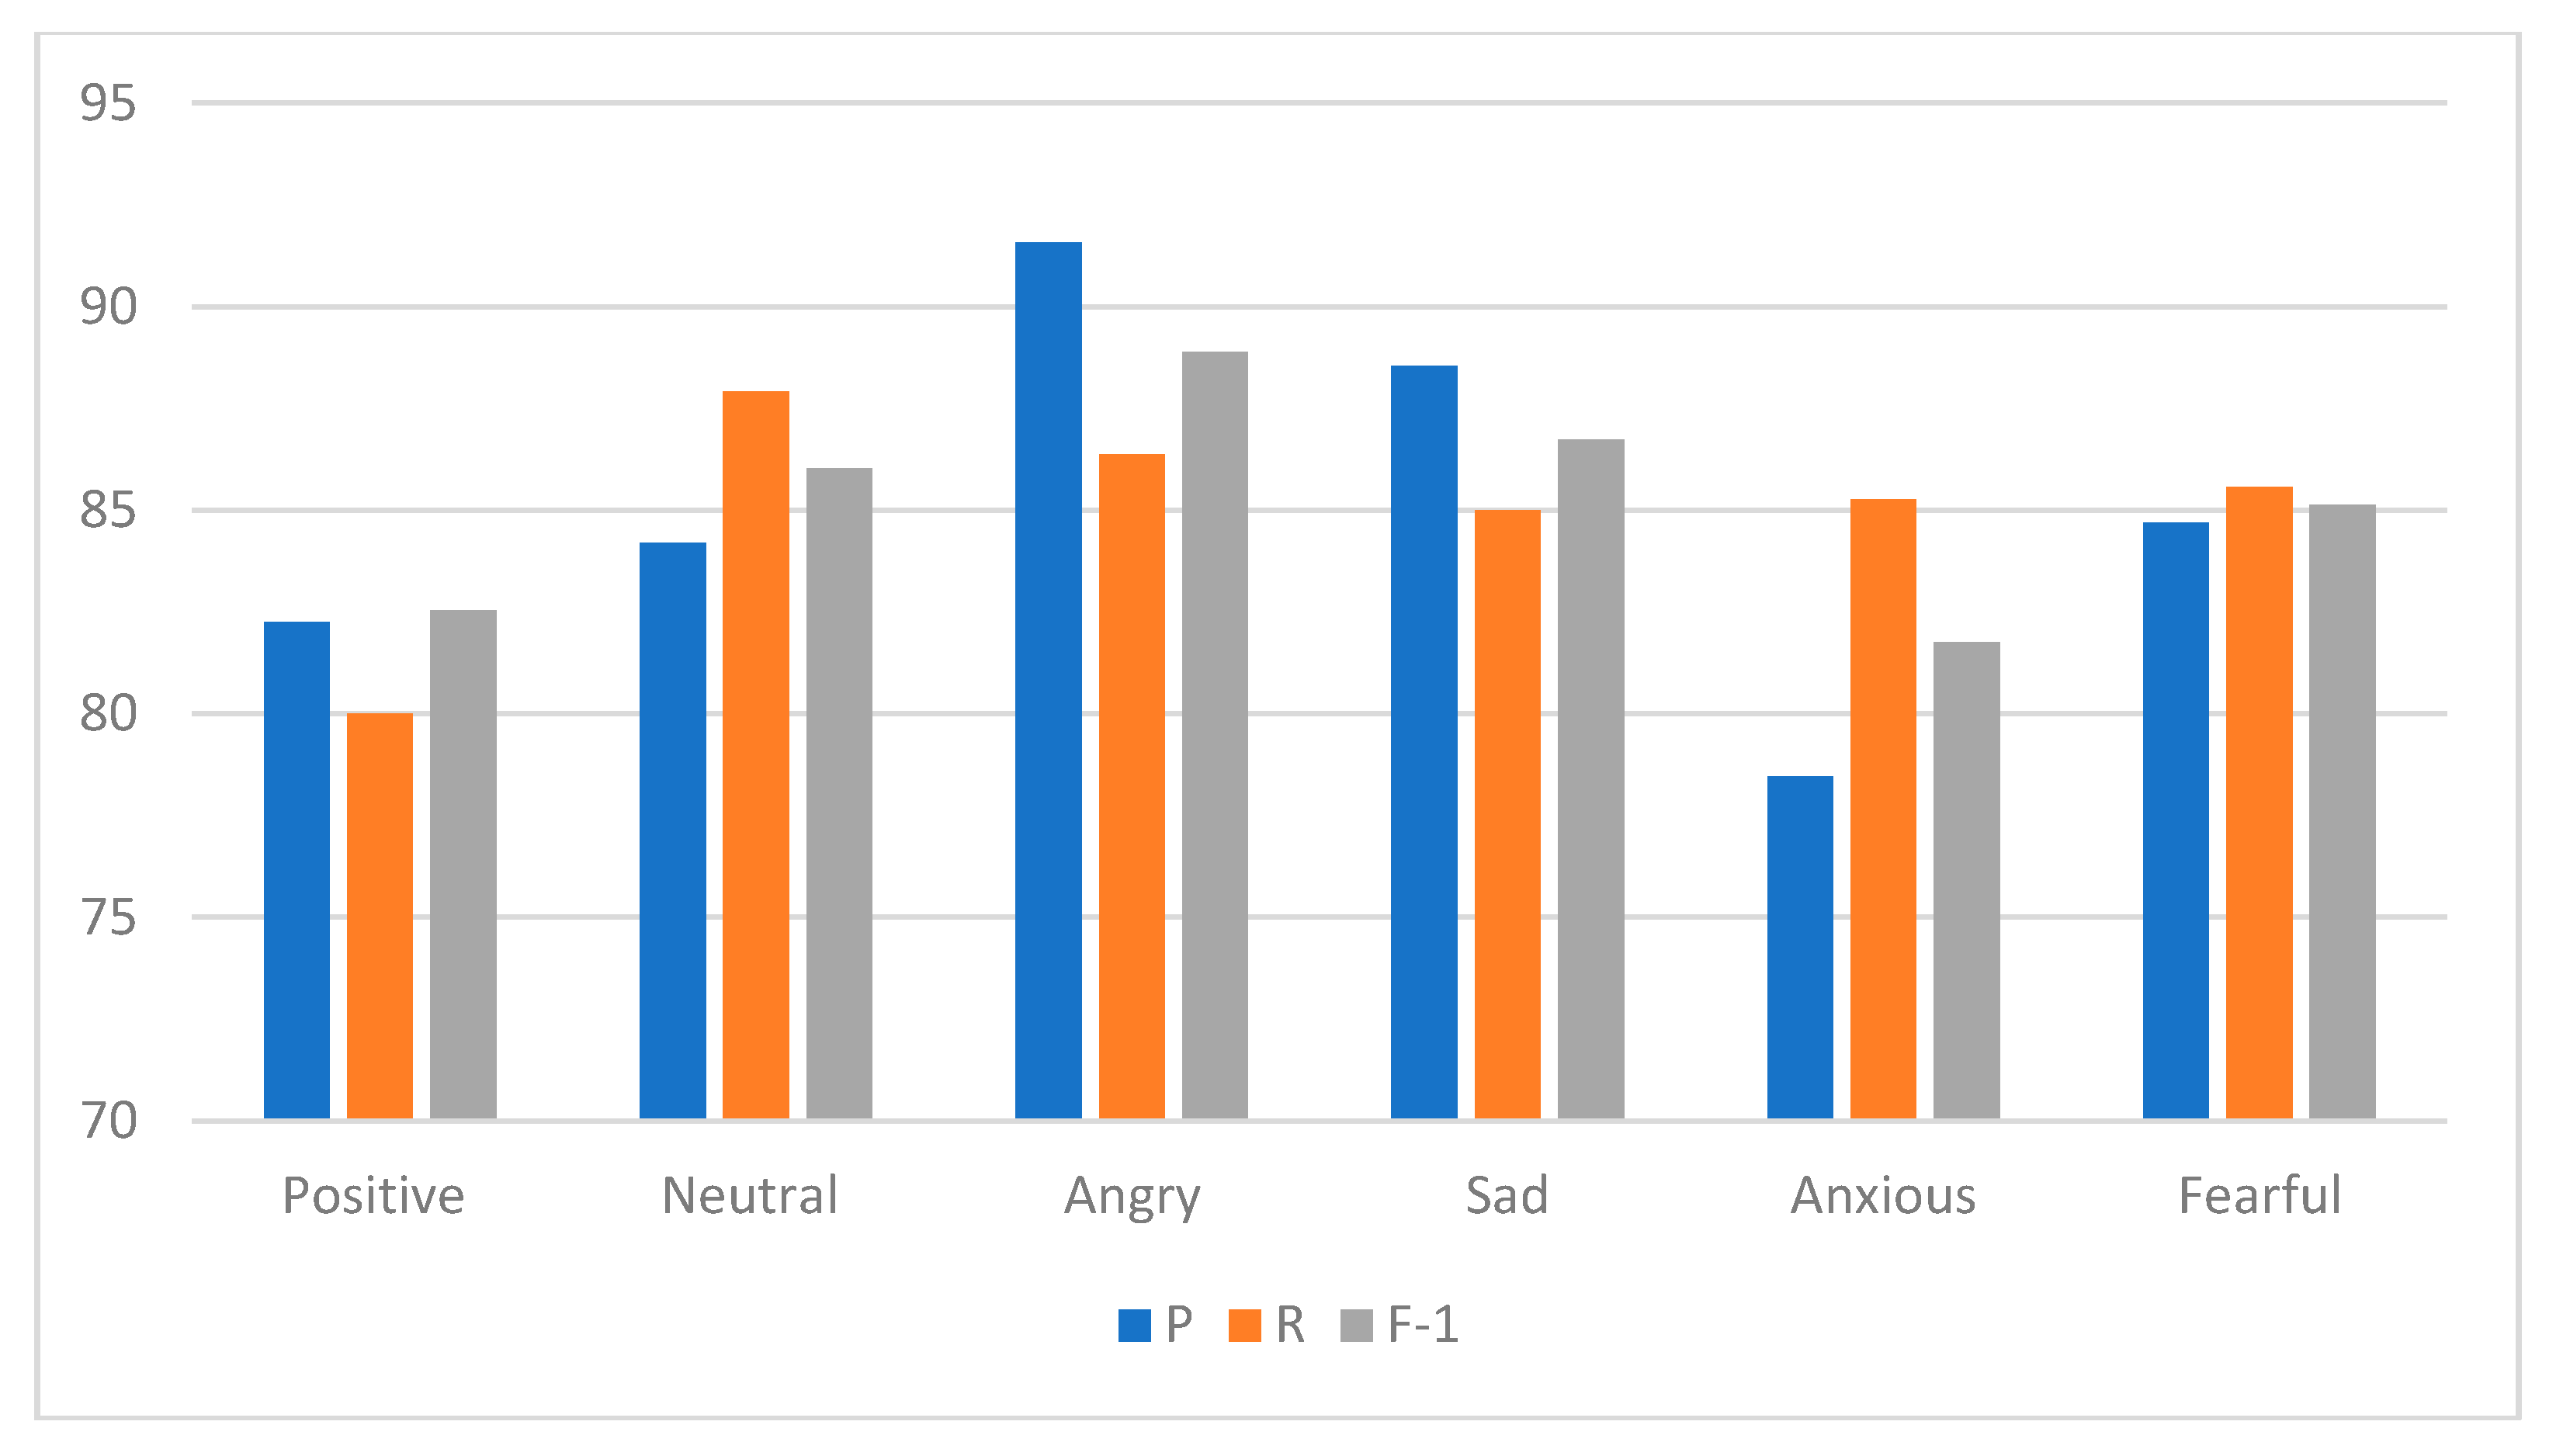
We used the trained CNN model to analyze new texts. The emotions contained in these texts were divided into six categories: positive, neutral, angry, anxious, fearful, and sad. Among them, the positive emotion mainly included the public’s satisfaction with disaster relief, the public’s wishes for the disaster area, and the joy of surviving. The neutral emotion mainly included objective descriptions of the disaster. In the process of classification, new texts were first processed using word segmentation and the removal of stop words. Then, the previously trained word vector list was used to translate each word into a word vector. Furthermore, each new text was transformed into a word vector matrix. Finally, the word vector matrix was input into the trained CNN model. Through the calculation of the model, each new text was labeled into the different emotional categories. We classified all 39,344 pieces of texts into the six emotion categories based on this classification process.
2.6. Spatio-Temporal Analysis of the Public Emotions
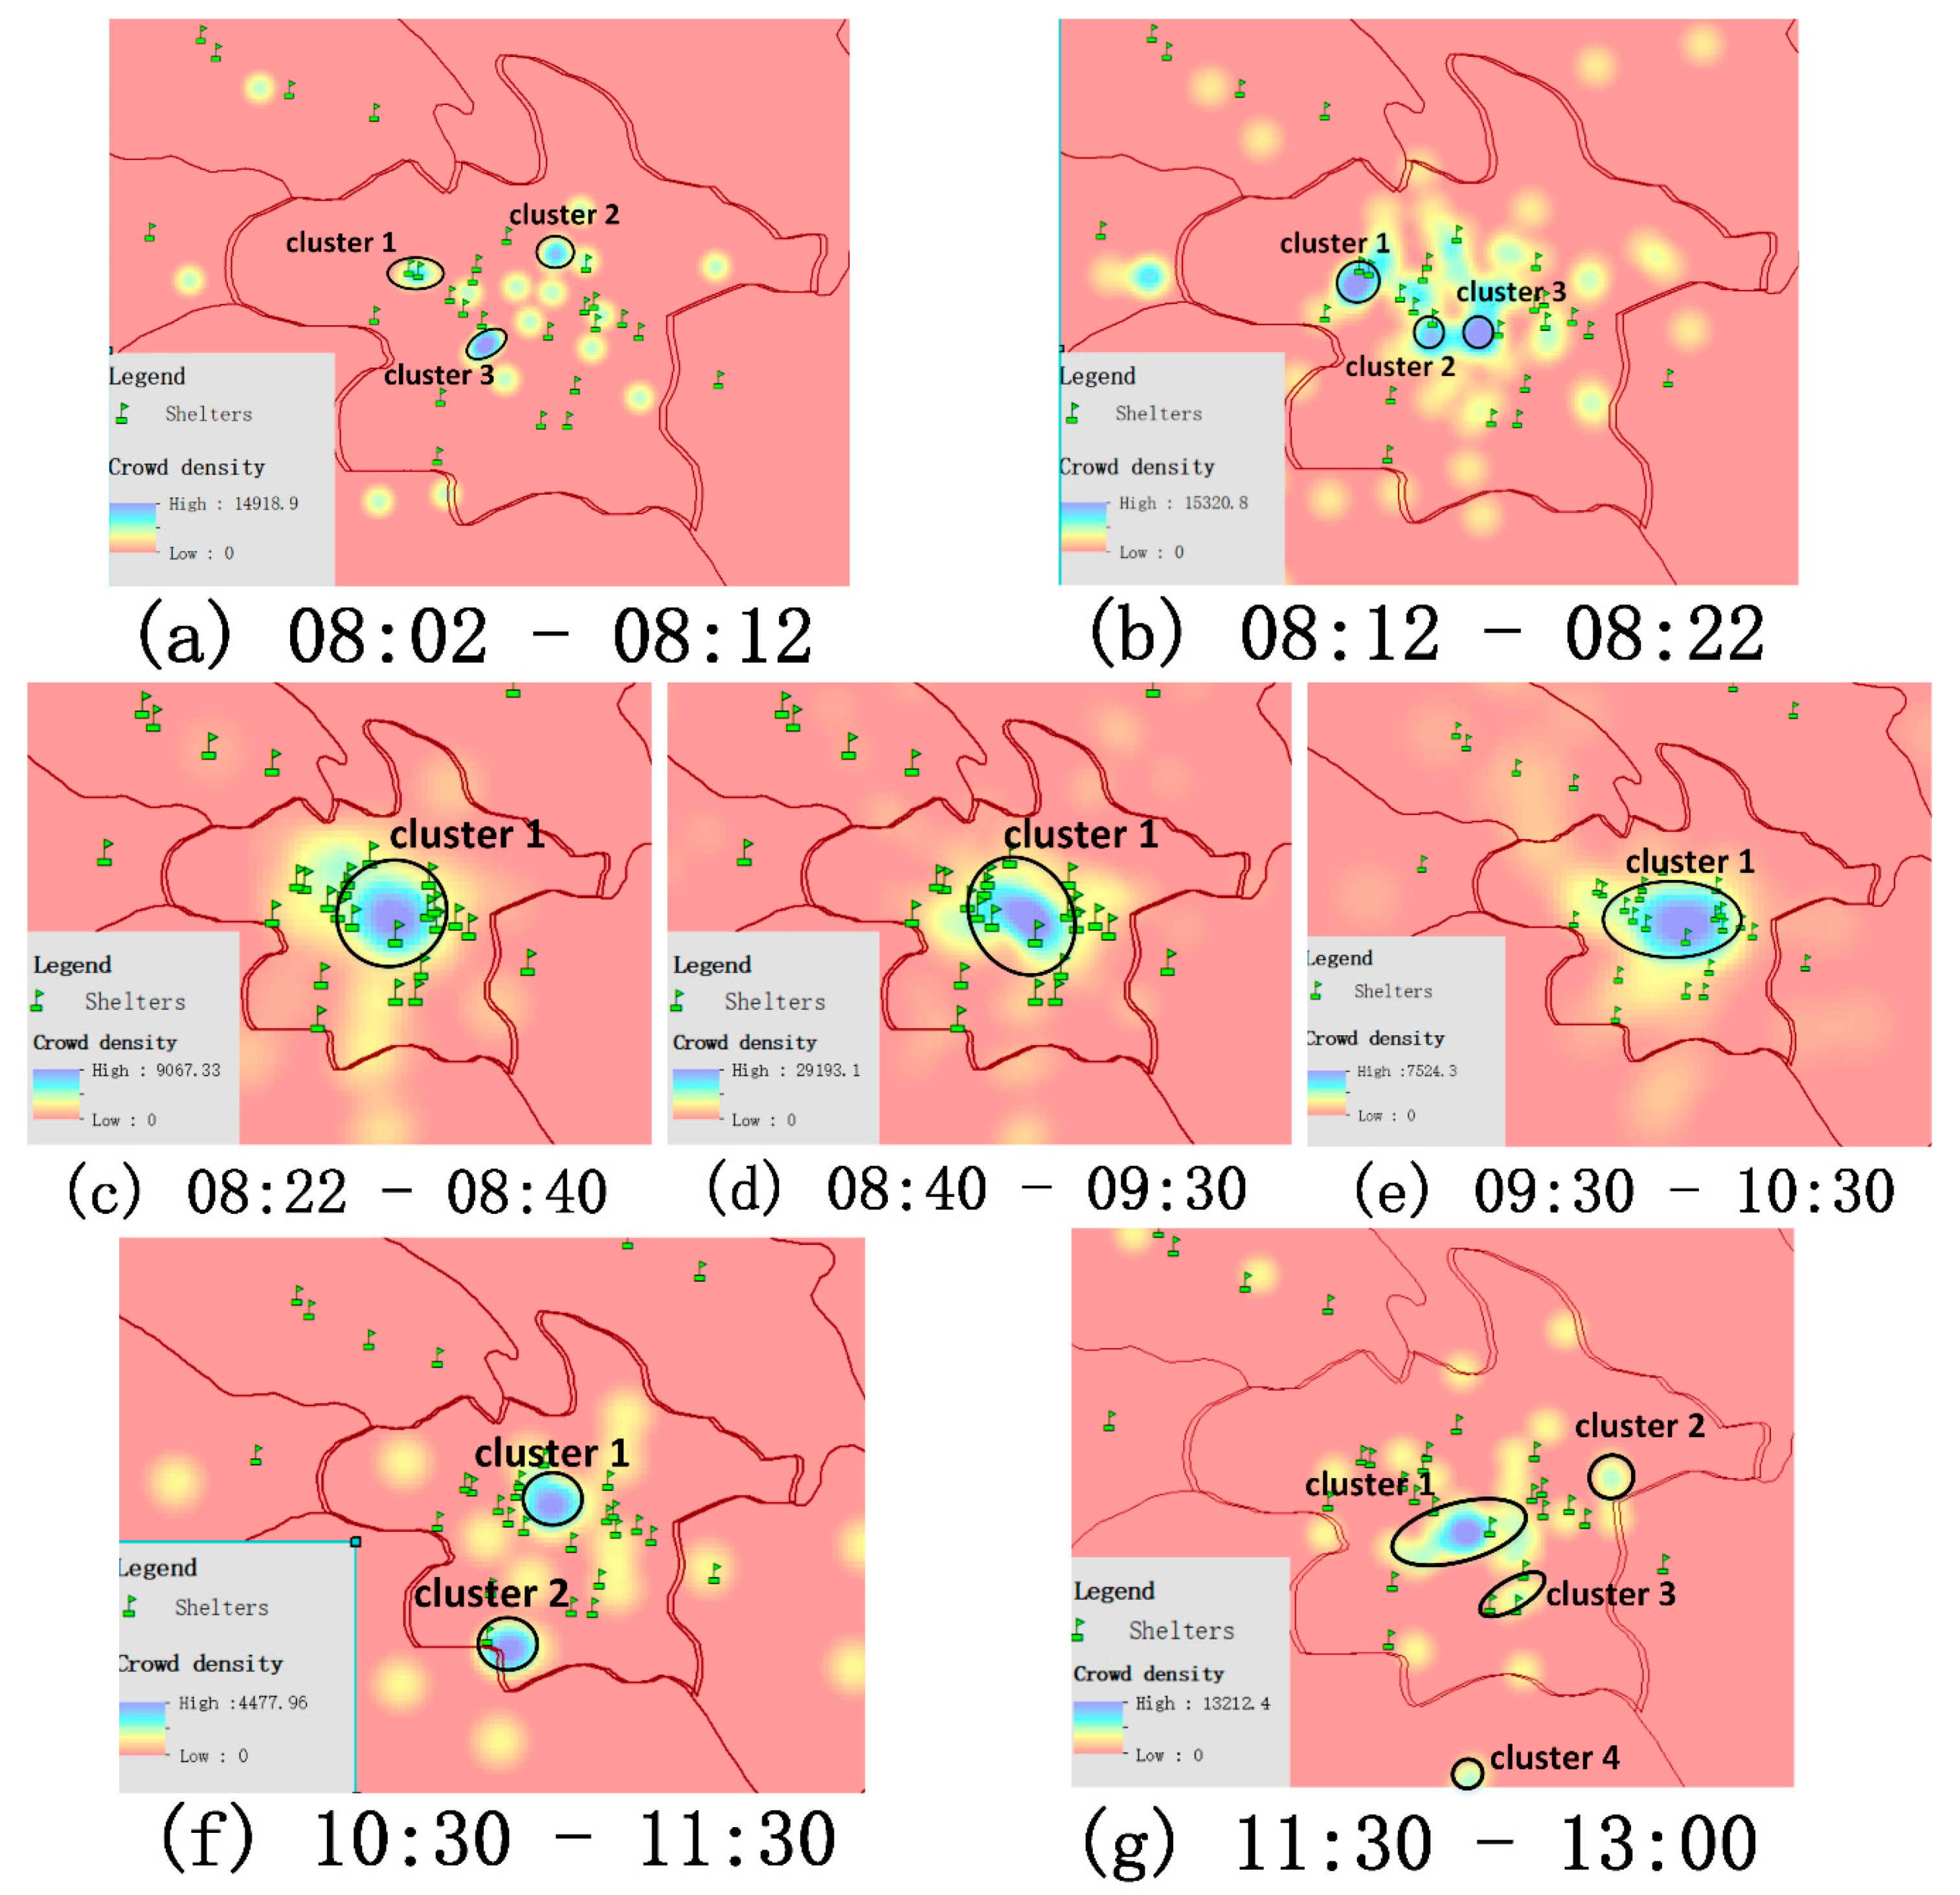
The framework in this paper aims to assist with disaster mitigation by using the public emotional information contained in social media. In the process, emotional information was regarded as an attribute of geographic information. The powerful spatial analysis capability of a GIS was used to combine the emotional information with other geographic data to dig out more useful knowledge. For example, the population density distribution data can be added to carry out a spatio-temporal assessment of the affected population. The POI data (such as a sanctuary) can be considered to explore the spatio-temporal trajectory law of people in sudden disasters. In addition, emotional information can also help disaster reduction departments to screen out urgent public demands from a vast amount of information. The public demands that contain emotional information are also effective feedback for disaster reduction work. They can help to optimize decision-making to improve rescue efficiency.
5. Conclusions
When a disaster occurs, social media can provide a large amount of important disaster-related geographic information to the disaster reduction departments in near real-time. In this paper, we regarded the fine-grained public emotional information extracted from social media as an attribute of geographic information to assist in disaster mitigation. In the process of extracting emotional information, we fully analyzed the characteristics of Chinese social media and selected a suitable algorithm (convolution neural network model). Meanwhile, a large number of special characters and symbols with emotional characteristics contained in social media were also considered to improve the accuracy of classification. The methods in this paper achieved satisfactory results.
In order to verify the effectiveness of the method in this paper in disaster mitigation, we used the 7.0 earthquake that occurred on April 20, 2013, in Ya’an City, Sichuan Province, China, as a case study. We classified the social media texts related to areas affected by the earthquake into six different emotion categories. Then, with the help of GIS software and other traditional geographic information data (population density distribution data and shelter data), we explored the role of public emotional information that is helpful for disaster reduction. The results showed that fine-grained public emotions can provide more powerful data support for disaster reduction departments to optimize rescue strategies and improve rescue efficiency.
Although social media plays an important role in assisting disaster mitigation, it also has some limitations. (1) Social media data is unevenly distributed. The economically developed and populous areas tend to have more users of the Sina micro-blog. In the research area of this paper, Chengdu had the most Sina micro-blog data and these data were more concentrated in the urban area, but it was not the worst-hit city. Therefore, in future research, more abundant data that include other sources is also needed to supplement social media data, such as image data, vehicle-borne GPS data, etc. (2) Not all social media users are willing to share their location information. In the dataset used in this paper, the proportion of text with location information was very small. This limits the use of some spatio-temporal analysis methods. However, we found that there are many geographically named entities in texts and many of them can respect the user’s location. Therefore, an effective method is needed to automatically extract these geographically named entities to supplement the deficiencies of geographic location information in social media.
In addition, the use of social media for disaster mitigation is far from enough. With the development of data mining technology, more disaster-related information contained in social media can be extracted, such as different categories of disaster loss information, etc. With the help of the powerful spatio-temporal analysis ability of GISs, this useful information can play a greater role.

 ,
, 
 ”, which are deleted and ignored by many common natural language processing (NLP) tools. However, for an emotional analysis, these special characters and symbols have emotional meaning, for example, “(>_<)” and “(>_<)>” can express troubled emotions. Therefore, in this paper, we interpreted them into text that could be processed by NLP. Some special characters and symbols could be translated into text by the micro-blog platform. For example,
  could be translated into “tear” (泪). However, others that could not be decoded by the micro-blog platform, such as (>_<) and
  , were interpreted according to the web’s “list of emoticons,” which includes the emotional implications of all kinds of emoticons through a large amount of published literature. For example, (>_<) can be translated into “troubled” (焦虑) and
  can be translated into “sad” (伤心).
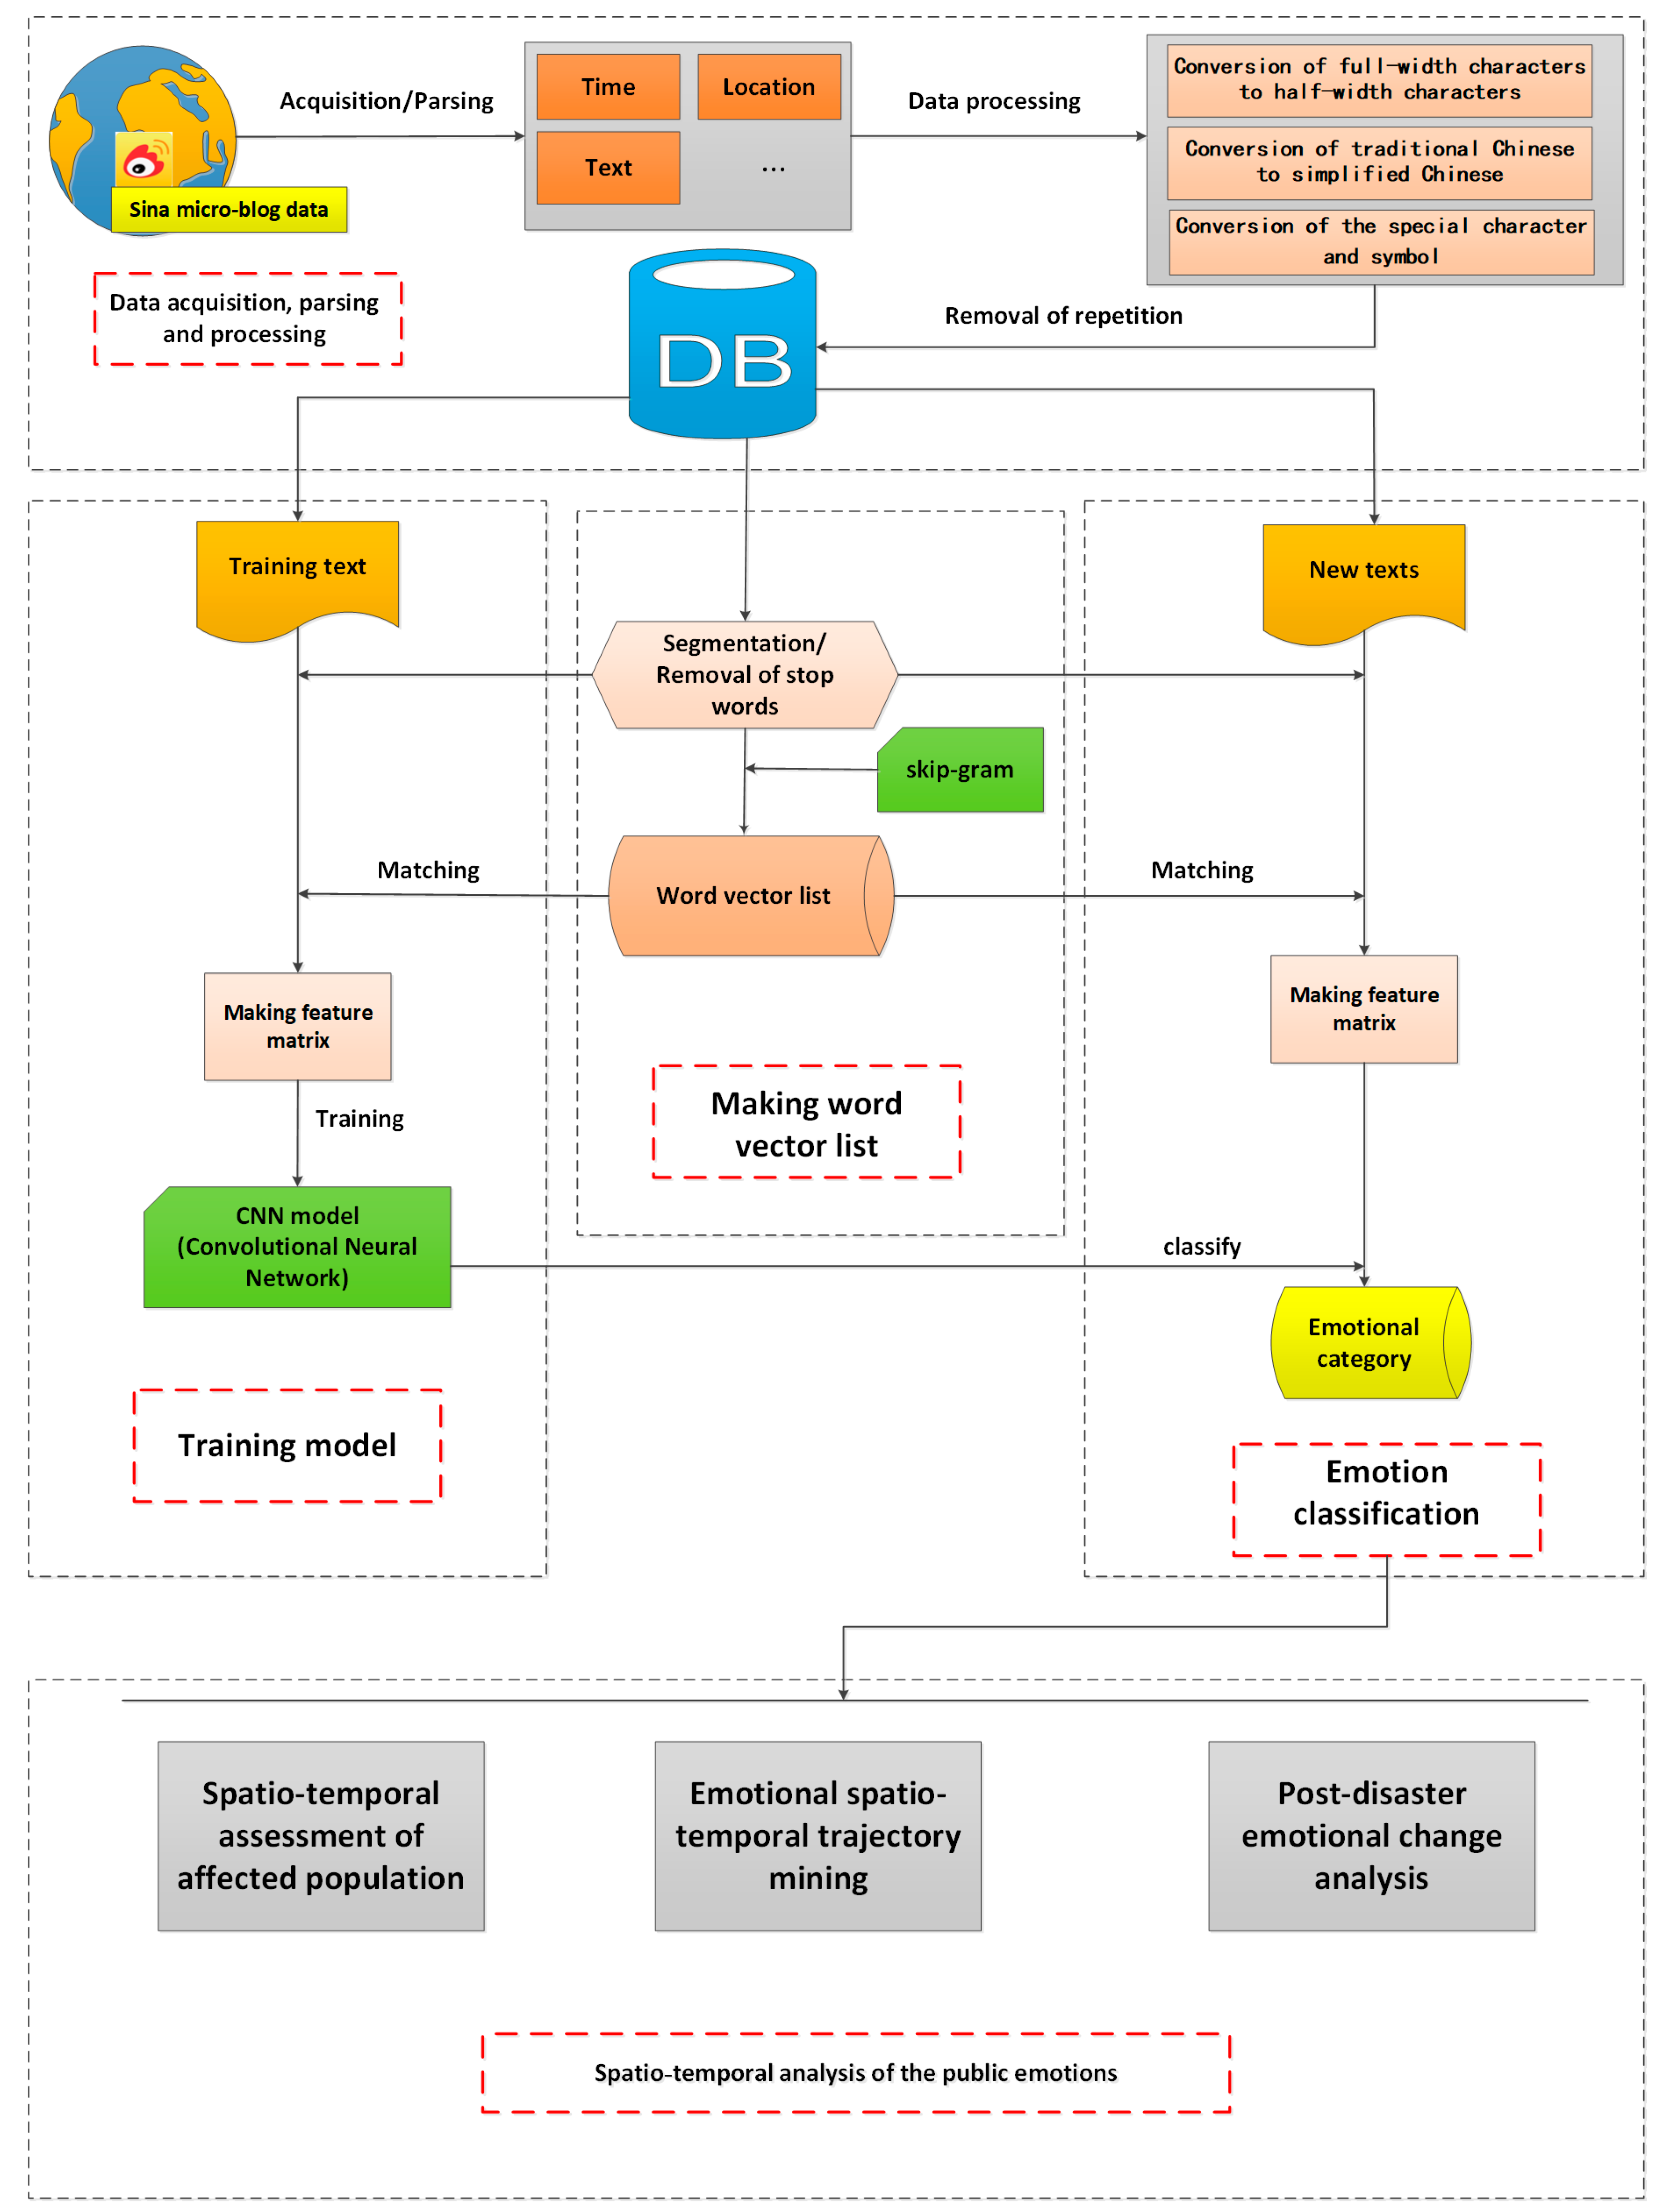


