1. Introduction
“’It’s precisely because we are all equal by nature that we must all be unequal by circumstances.’ Equality remains the only reason for inequality.” [
1] (p. 88).
With the 17 Sustainable Development Goals (SDGs) and 169 targets over 15 years, there is no doubt that the member states of the United Nations (UN) have agreed to an ambitious plan with transformative potential for global development. Considering the 230 indicators to measure progress towards the targets, the challenge of coordinating the monitoring process—both technologically and institutionally—in very different national and sub-national contexts in “developing” and “developed” countries is a complex task.
Although this monitoring challenge is valid for all SDGs, the subnational and spatial focus of Goal 11—i.e., to “make cities and human settlements inclusive, safe, resilient and sustainable” [
2] (p. 14)—adds a further layer of complexity to keeping the pledge “to leave no one behind” and “to reach the furthest behind first” (ibid.). Unequal development among neighbourhoods poses a particular challenge to the monitoring process because city dwellers’ experiences of the issues which SDG 11 aims to address (e.g., by measuring access to critical urban infrastructure) can vary significantly within the city and are mediated by neighbourhood-specific socio-spatial factors.
For instance, this observation is of particular importance for cities with so-called “slums” and informal settlements. About a quarter of the global urban population and some 60% of city-dwellers in Sub-Saharan Africa live in neighbourhoods of this definition [
3,
4]. Notwithstanding these numbers, due to their legal and social status of being “informal,” these communities are frequently invisible in the national statistical systems and geospatial databases on which the SDG monitoring framework relies [
5]. The bias towards the “formal” that is embedded into conventional statistical methods may therefore negatively affect the representativeness of the SDG 11 indicators, especially in cities with slums. It represents a blind spot that, if unmitigated, ultimately leads to regressive policy outcomes that perpetuate multiple forms of intra-urban inequalities.
The overall aim of this paper, therefore, is to provide a conceptual framework to understand the extent to which the SDGs may be affected by inequalities, in particular in what refers to the methodology used for monitoring progress. By focusing on SDG 11, we then assess the current monitoring guidelines for localisation, in particular, the extent to which (and under which circumstances) current localisation guidelines are “robust” against socio-spatial inequalities. This raises a research question regarding the extent to which the representativeness of the current SDG 11 monitoring framework can be affected by intra-urban inequalities.
Awareness regarding these areas of vulnerability and their relation to the urban context is one of the first steps in the decision regarding the fitness-for-purpose of emerging methods to fill these gaps, such as public participatory geospatial methods and citizen-generated data practices. The article also responds to the call for critical urban geography to engage with the most recent global development framework [
6], and the special edition’s invitation to critically de-construct the SDG goals, targets and indicators by questioning “which views are inscribed in a certain indicator?” [
7].
The remainder of this paper is structured as follows:
Section 2 discusses the theoretical background that motivated the research question. It starts with the latest scholarly discussions regarding the SDGs and describes the tensions that can be identified therein. This is followed by a theorisation of inequalities.
Section 3 proposes a framework for describing the mechanics that mediate the representativeness of the SDG monitoring framework regarding inequalities in general and places it into the SDG 11 context in particular.
Section 4 operationalises the conceptual framework with a methodology that is applied to selected (on the basis of their immediacy regarding the quality of life of urban residents) SDG 11 indicators in the analysis (
Section 5).
Section 6 discusses the outcomes and provides three key recommendations in response to the research question.
Section 7 concludes the paper with a call for collaborative work to attempt to “recalibrate” city-level indicators and to account for intra-urban inequalities.
2. Background
In the relatively short period since 2015, a lively discussion among commentators from several academic disciplines and institutional backgrounds regarding the potential of the SDGs as a development framework has emerged. This trend is promising, especially given the claim that critical scholarly engagement with the previous Millennium Development Goals (MDGs) framework was limited [
8]. This section provides an overview of these views and invites the reader to look at this tension through the lens of inequalities.
2.1. Tensions Inherent to SDGs
The debate regarding the SDGs’ potential for equitable and inclusive development that “leaves no one behind” [
2] (p. 3) points to a tension inherent to the framework. On the one hand, commentators argue that the non-binding and open nature of the goals and targets enables bottom-up interpretation and alignment among the horizontal and vertical levels of stakeholders involved in their localisation [
9,
10]. In this view, the potential for collaboration between civil society, government and the private sector to localise SDGs promises a just, equitable and context-relevant global-to-local translation of the SDG targets. Freedom regarding the local interpretation of the targets would not least result in enhanced sensitivity to co-benefits and trade-offs [
11].
On the other hand, more cautious voices argue that a lack of specificity reduces accountability [
9]. At worst, this would result in the SDGs being blind to underpinning structural issues of political economy, thereby “saving the world without transforming it” (p. 203). Kaika [
11] makes a similar point in arguing that the four pillars of SDG 11 (inclusiveness, safety, resilience and sustainability) “can only be allocated/handed down: From those in power to those in need” (p. 98) and do not address the root causes of social and environmental development challenges. Her view is that development should be driven by self-empowered communities acting as co-decision-makers who “establish new
hows when it comes to making communities safe, resilient, sustainable or included” (ibid.). This echoes Rancière’s critical interpretation of intellectual emancipation, which by definition becomes a hierarchical “way of organising the eternal minority” if placed into an institutional context [
12] (p. 34).
Scholars are also concerned about the need for aggregation to inform the indicators, as it dilutes the visibility of variations in inequalities. The (not uncontroversial; see for example Liverman [
8]) ability to compare national indicator rankings may be a prerequisite for a globally deployed development framework. However, referring to the statistical problem of ecological fallacy, a number of authors have pointed out that aggregated views may gloss over the needs of the most marginalised and vulnerable by celebrating average improvement at the national or city level [
8,
13,
14]. Similar arguments have been applied to indicators with quantitatively defined parameters, such as a financial (e.g., extreme poverty; US
$1.90 a day) or a distance-based access measure (see SDG indicator 11.2.1: Access to public transport). This kind of standardised approach facilitates the “multi-stakeholder peer reviews of national progress ‘based upon globally-harmonized formats’” Hajer et al. [
15] approve of as part of an effort to mobilise public and private sector “agents of change towards sustainable development” (pp. 1657,1658). Critical authors argue that such one-dimensional indicators struggle to reflect the complexity of lived realities, overlooking, as Liverman [
8] argues, the less quantifiable and often context-specific social needs. She, therefore, calls for multi-dimensional or even community-defined measures to complement the financial criterion of poverty (ibid.). Scholars have called for similar approaches in other sectors, such as sanitation, as the meaning of what constitutes “improved access” varies according to the spatial context and to other factors including gender, cultural, educational, and environmental considerations [
16,
17].
In the face of these challenges at the target and indicator levels, some argue that technology-enabled disaggregated data (e.g., social media or remote sensing) promise to improve the SDG indicators’ representativeness [
10,
18,
19]. However, the critical response is that these technologies often only increase the efficiency of harvesting data that is subsequently allocated into the pre-determined concepts, while citizens’ contributions are limited to a range between passive data extraction and community consultation for choosing among a “set menu” of development options [
11] (p. 96), as opposed to “smart technologies that are democratic” [
20] (p. 163). In addition to these conceptual observations, other commentators have also pointed to operational challenges related to these techniques, such as algorithmic bias (see, for example, Acolin and Kim [
21] on remote sensing informal settlements) and the digital divide, especially the gap in mobile broadband use between “developed” and “developing” countries [
22]. The latter limits the applicability of geo-tagged social media data in contexts with lower levels of mobile broadband ownership. Such critical work, therefore, emphasises the need for contextual knowledge that is produced collaboratively and participatorily to detect location-specific and complex social needs, which is of particular importance for marginalised communities [
11,
13,
23].
Based on the aforementioned observations we argue that the inherent tensions in the SDGs summarised in
Table 1—whether they represent a framework with transformative opportunities or whether the potential of regressive threats prevails—depend on their ability to account for various forms of inequalities. These will be discussed in the following subsection. The relation between inequalities and the SDG monitoring framework will be presented in the conceptual framework in
Section 3.
2.2. Inequalities
In the study of development, inequalities have been conceptualised from several angles. The traditional framing of development indicators is based on income. If the level of well-being differs across income groups, they are referred to as
vertical inequalities [
24].
Horizontal inequalities cut across the economic categories and are related to social discrimination. These are based on group characteristics such as gender, race, ethnicity, or legal and migration status [
25,
26].
Intersecting inequalities combine both horizontal and vertical characteristics. They are viewed as intensification (rather than grid) of two or more types of social, economic and demographic inequalities which exacerbate each other (ibid.), regressively increasing barriers to development, and leading to persistent unequal development trajectories among different groups in society [
25].
Spatial inequalities are differences in development associated with place-based characteristics, such as remoteness, high density or poor municipal infrastructure provision, and often coincide with the above-described intersecting inequalities [
25]. This results in further intensification because although a spatially equal city with intersecting inequalities is hypothetically possible [
27], in practice the groups who experience spatial and intersecting inequalities simultaneously are the ones who tend to be most persistently and furthest left behind [
26]. In development monitoring terms, this means that even though an indicator shows overall improvement, progress may still be slower for specific groups in (already) disadvantaged locations [
24,
25].
With their ability to open up and to enable active, and arguably more democratic, contributions to hitherto closed systems of knowledge [
28] Information and Communications Technologies (ICTs) are viewed as a levelling force [
29]. Various forms of digital inequalities, however, prevent the development potential of the ICTs to be realised fully. Notably, many have argued that ICTs further intensify existing inequalities, specifically due to the digital divide which limits access and effective use of ICT, such as ownership of hardware and software, connectivity, as well as lack of digital literacy and skills [
29,
30]. The latter result in secondary disparities between those who can contribute with data (e.g., through microblogging in social media), and those who are consumers or even entirely absent from the digital domain. Digital inequalities therefore often not only mirror but
reinforce other forms of inequalities [
29,
31].
An example of challenges arising from the above-described forms of inequalities is mobility in Medellín (this relates to SDG indicator 11.2.1, which measures convenience in access to public transport, and is investigated in the analytical section further below). Although investments into the public transport systems resulted in reduced travel times at city level [
32], lower-income residents (
vertical inequality) who live in the neighbourhoods that are located in the historically less accessible and more hazardous hills of the city (
spatial inequality) still appear to be less mobile than people living in other areas as they struggle to pay for using the aerial cable car—and this particularly applies to female residents (
horizontal inequality) [
33]. They, therefore, continue to be dependent on the informally provided buses which are less reliable, take longer to make their way through the hills and present a higher risk to personal safety for women (ibid.). Illustrating the regressive impact of the combination of intersecting and spatial intra-urban inequalities, a spatio-temporal analysis of mobility of different social classes in Medellín indicates that the city’s poorer residents face lower transport efficiency, i.e., they spend more time in transit for shorter distances than the wealthier sections who travel farther [
34]. This example shows that the combination of intersecting and spatial intra-urban inequalities results in differences in experiences among residents from different neighbourhoods of a city.
The understanding regarding the extent to which inequality exists depends on the often conflicting and hierarchically provided (as Rancière [
1] argues) conceptualisations of equality. Thus, according to Stone “equality often means inequality and equal treatment often means unequal treatment” [
35] (p. 41). For this author, the factors that determine conceptualisations of equality include the importance given to the various stakeholders (Stone’s “recipients” dimension), the definition of the policy item which is being distributed and measured, and the type of parameter used for classifying the degree of access (Stone also proposes a “processes of distribution” dimension, which in SDG terms relates to policy implementation. Considering this paper’s focus on SDG monitoring we only draw on Stone’s “recipients” and “item” dimensions). The latter two refer to Stone’s “items” dimension, which concerns decisions regarding the definitional boundaries of the item or service in question, and the extent to which the value of the latter should be customised to reflect differences in needs [
35]. For the indicator 11.2.1 example, the following questions may need to be considered (non-exhaustive examples):
Regarding the “recipients”: How is the base resident population categorised, which may include intersectional and spatial criteria; e.g., is it only the residents of “formal” and permanent structures or also the “informal” settlements; is it the resident population living within the administrative boundary of the city, or does it also comprise residents living in the wider commuting area?
Regarding the “item boundary”: How is public transport defined? Should it include taxis or moto-taxis, or escalators (in the case of Medellín, for example)?
Regarding the “item value”: How is “convenience” in access to public transport defined? Different policy stakeholders allocate a different value (e.g., differential importance of distance, affordability, safety etc.).
Based on this understanding of the different types of inequalities, in the following we relate them to the opportunities and threats in the SDG framework that were identified in
Section 2.1.
3. Conceptual Framing
This section firstly presents a framework for understanding the relation between inequalities and SDG monitoring (
Section 3.1), and subsequently applies it to SDG 11 (
Section 3.2).
3.1. Inequalities and SDG Monitoring
In
Section 2.1 we argued that the tensions inherent to the SDG monitoring framework depend on its ability to account for various forms of inequalities.
Section 2.2 theorised different forms of inequalities in the context of this study using Stone’s [
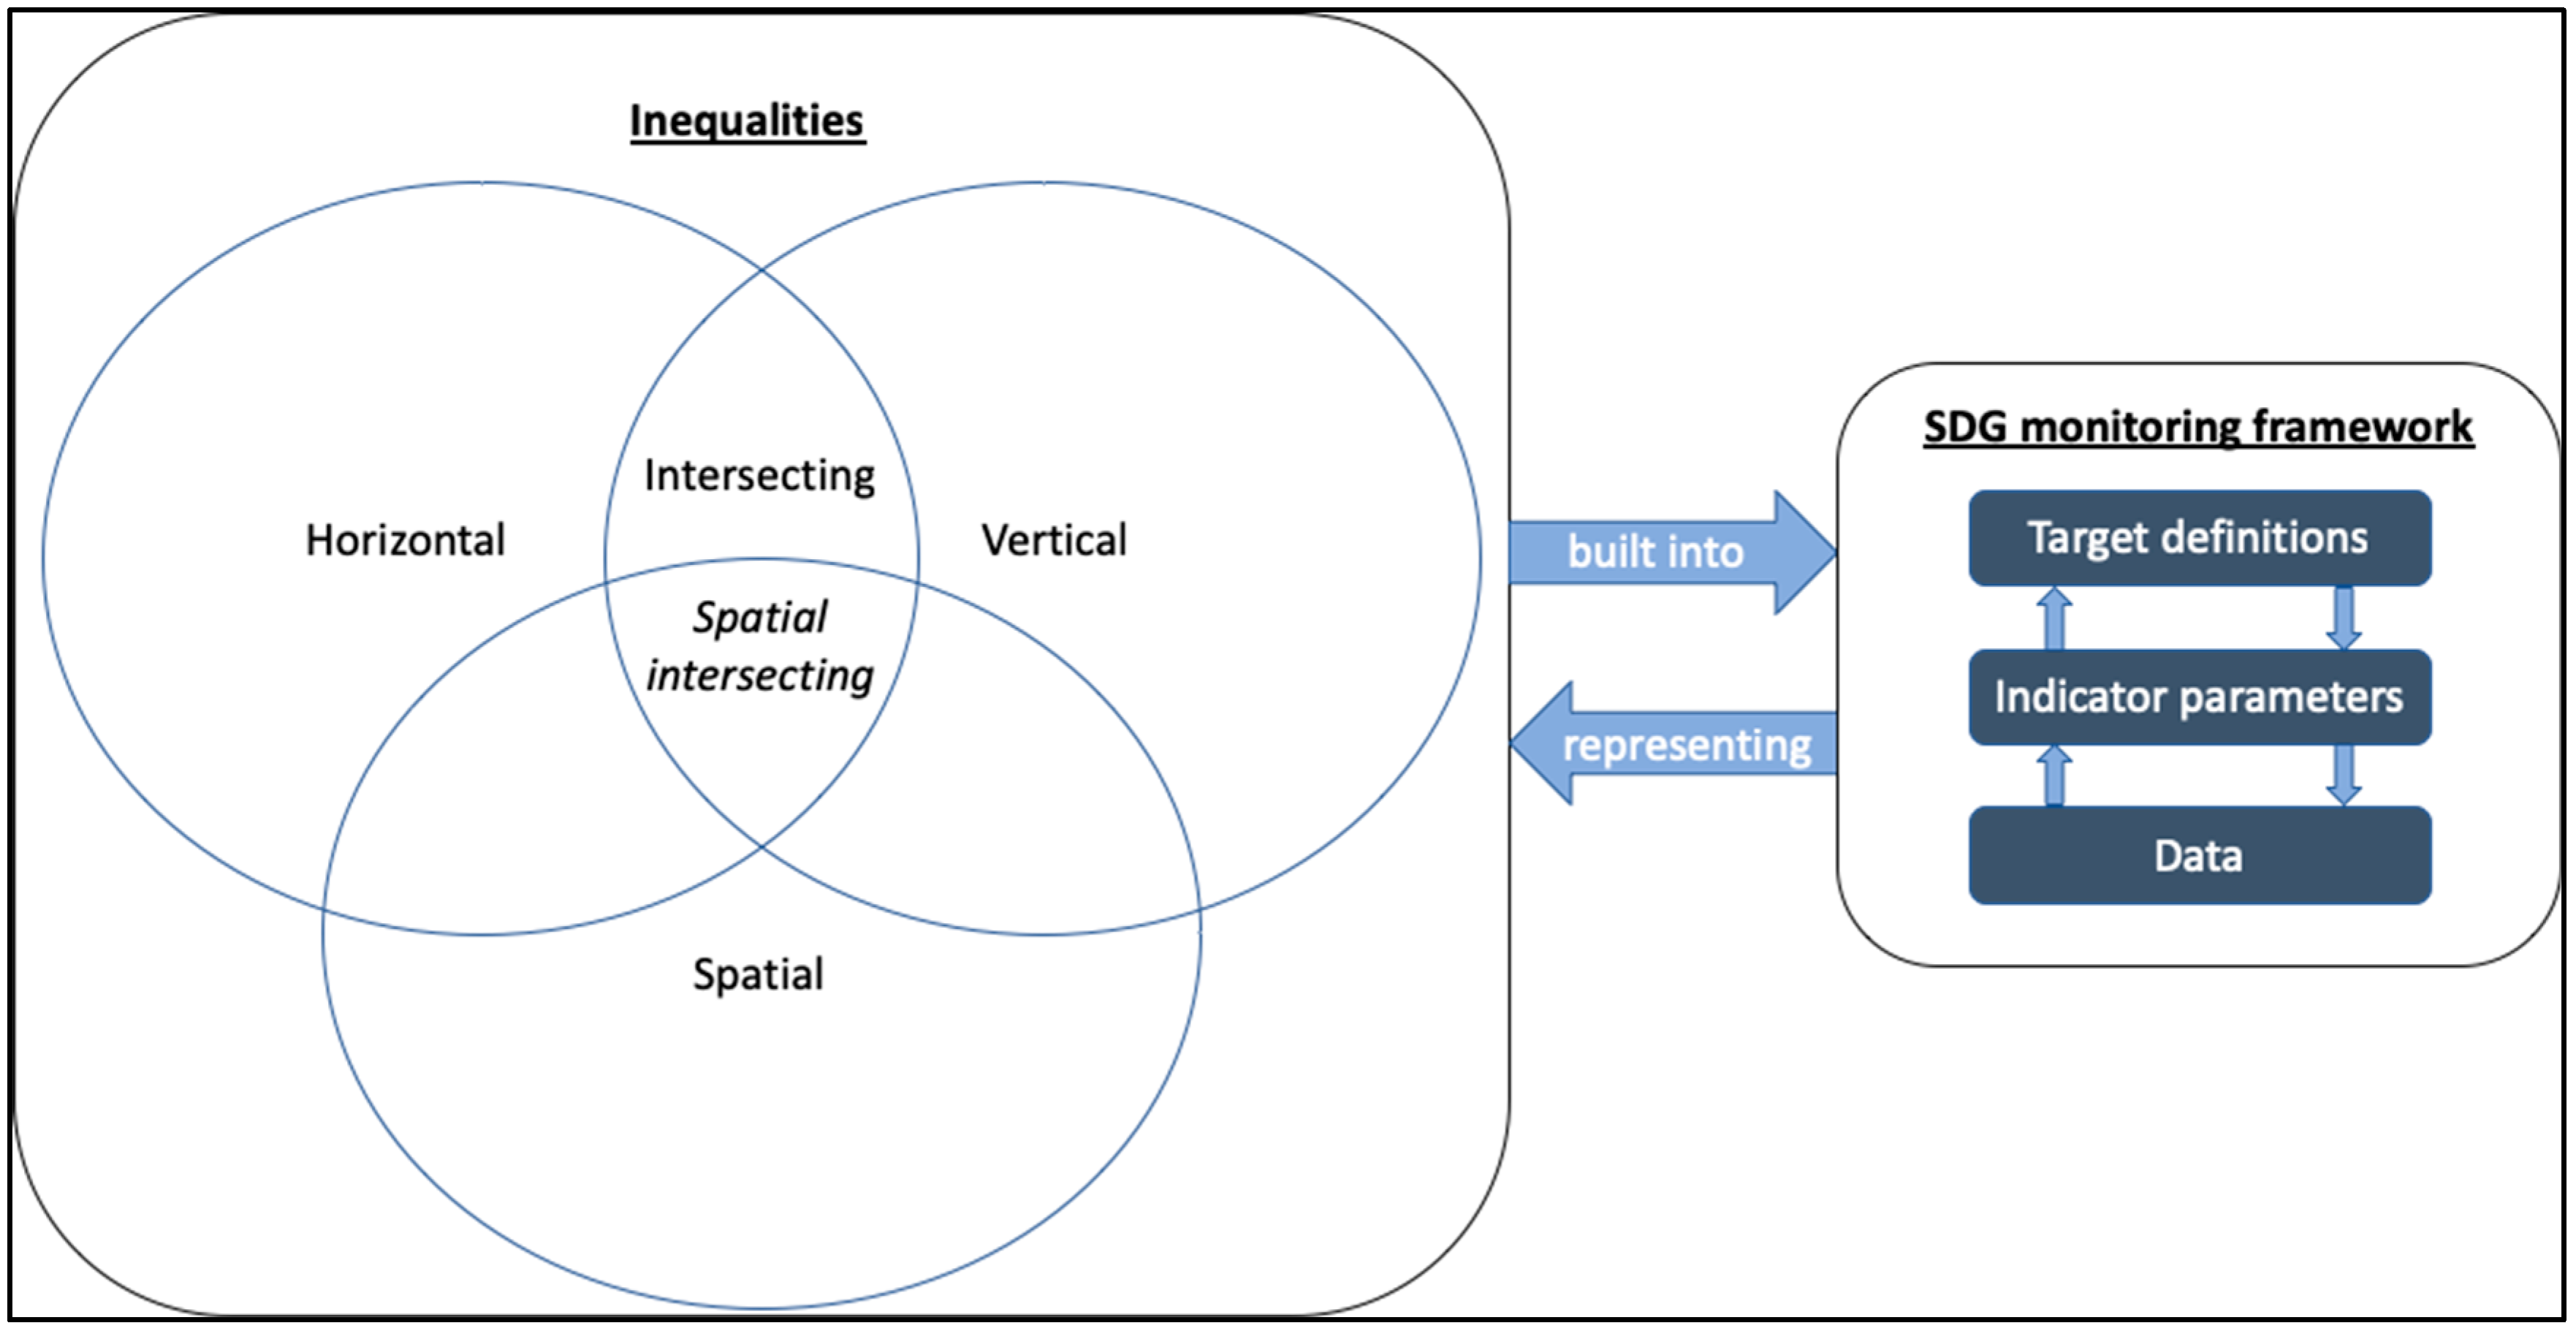
35] conceptualisations of equality. Here, we propose a framework to describe how these different types of inequalities are related to SDG monitoring (see
Figure 1). It is based on the observation that the interpretation of the targets, the formulation of the parameters and the generation and selection of data is mediated by conflicting conceptualisations of equality, which results in the different types of inequalities being “built into” the SDG monitoring framework (top horizontal arrow from left to right). This in turn mediates the monitoring frameworks’ ability to account for the inequalities and therefore determines its representativeness (bottom horizontal arrow from right to left).
This relationship is not static in time as the framing of SDG monitoring dimensions may be adapted according to changes in the nature of inequalities. Similarly, the SDG framework dimensions also interact dynamically, as for example emerging data practices may result in a revision of indicator parameters and target definitions (see the vertical arrows in the monitoring framework box on the right).
Figure 1 also indicates our proposal to extend Kabeer and Santos’ [
25] concept of intersecting inequalities to emphasise the combined challenges of intersecting and spatial inequalities in the form of “spatial intersecting inequalities.”
3.2. SDG 11 Monitoring in Focus
With cities now being home to the majority of the global population [
36], their importance for global development is undisputed, especially considering the cross-sectoral character of urbanisation. The western scholarly discussion on intra-urban inequalities goes back at least 2500 years (arguably starting with Plato) [
37]. Yet, with SDG 11 (“make cities and human settlements inclusive, safe, resilient and sustainable” [
2]) (p. 14) the global development focus on the city is only relatively recent. This Goal thus is the first globally coordinated commitment to establish monitoring systems to assess the multidimensional aspects of urbanisation.
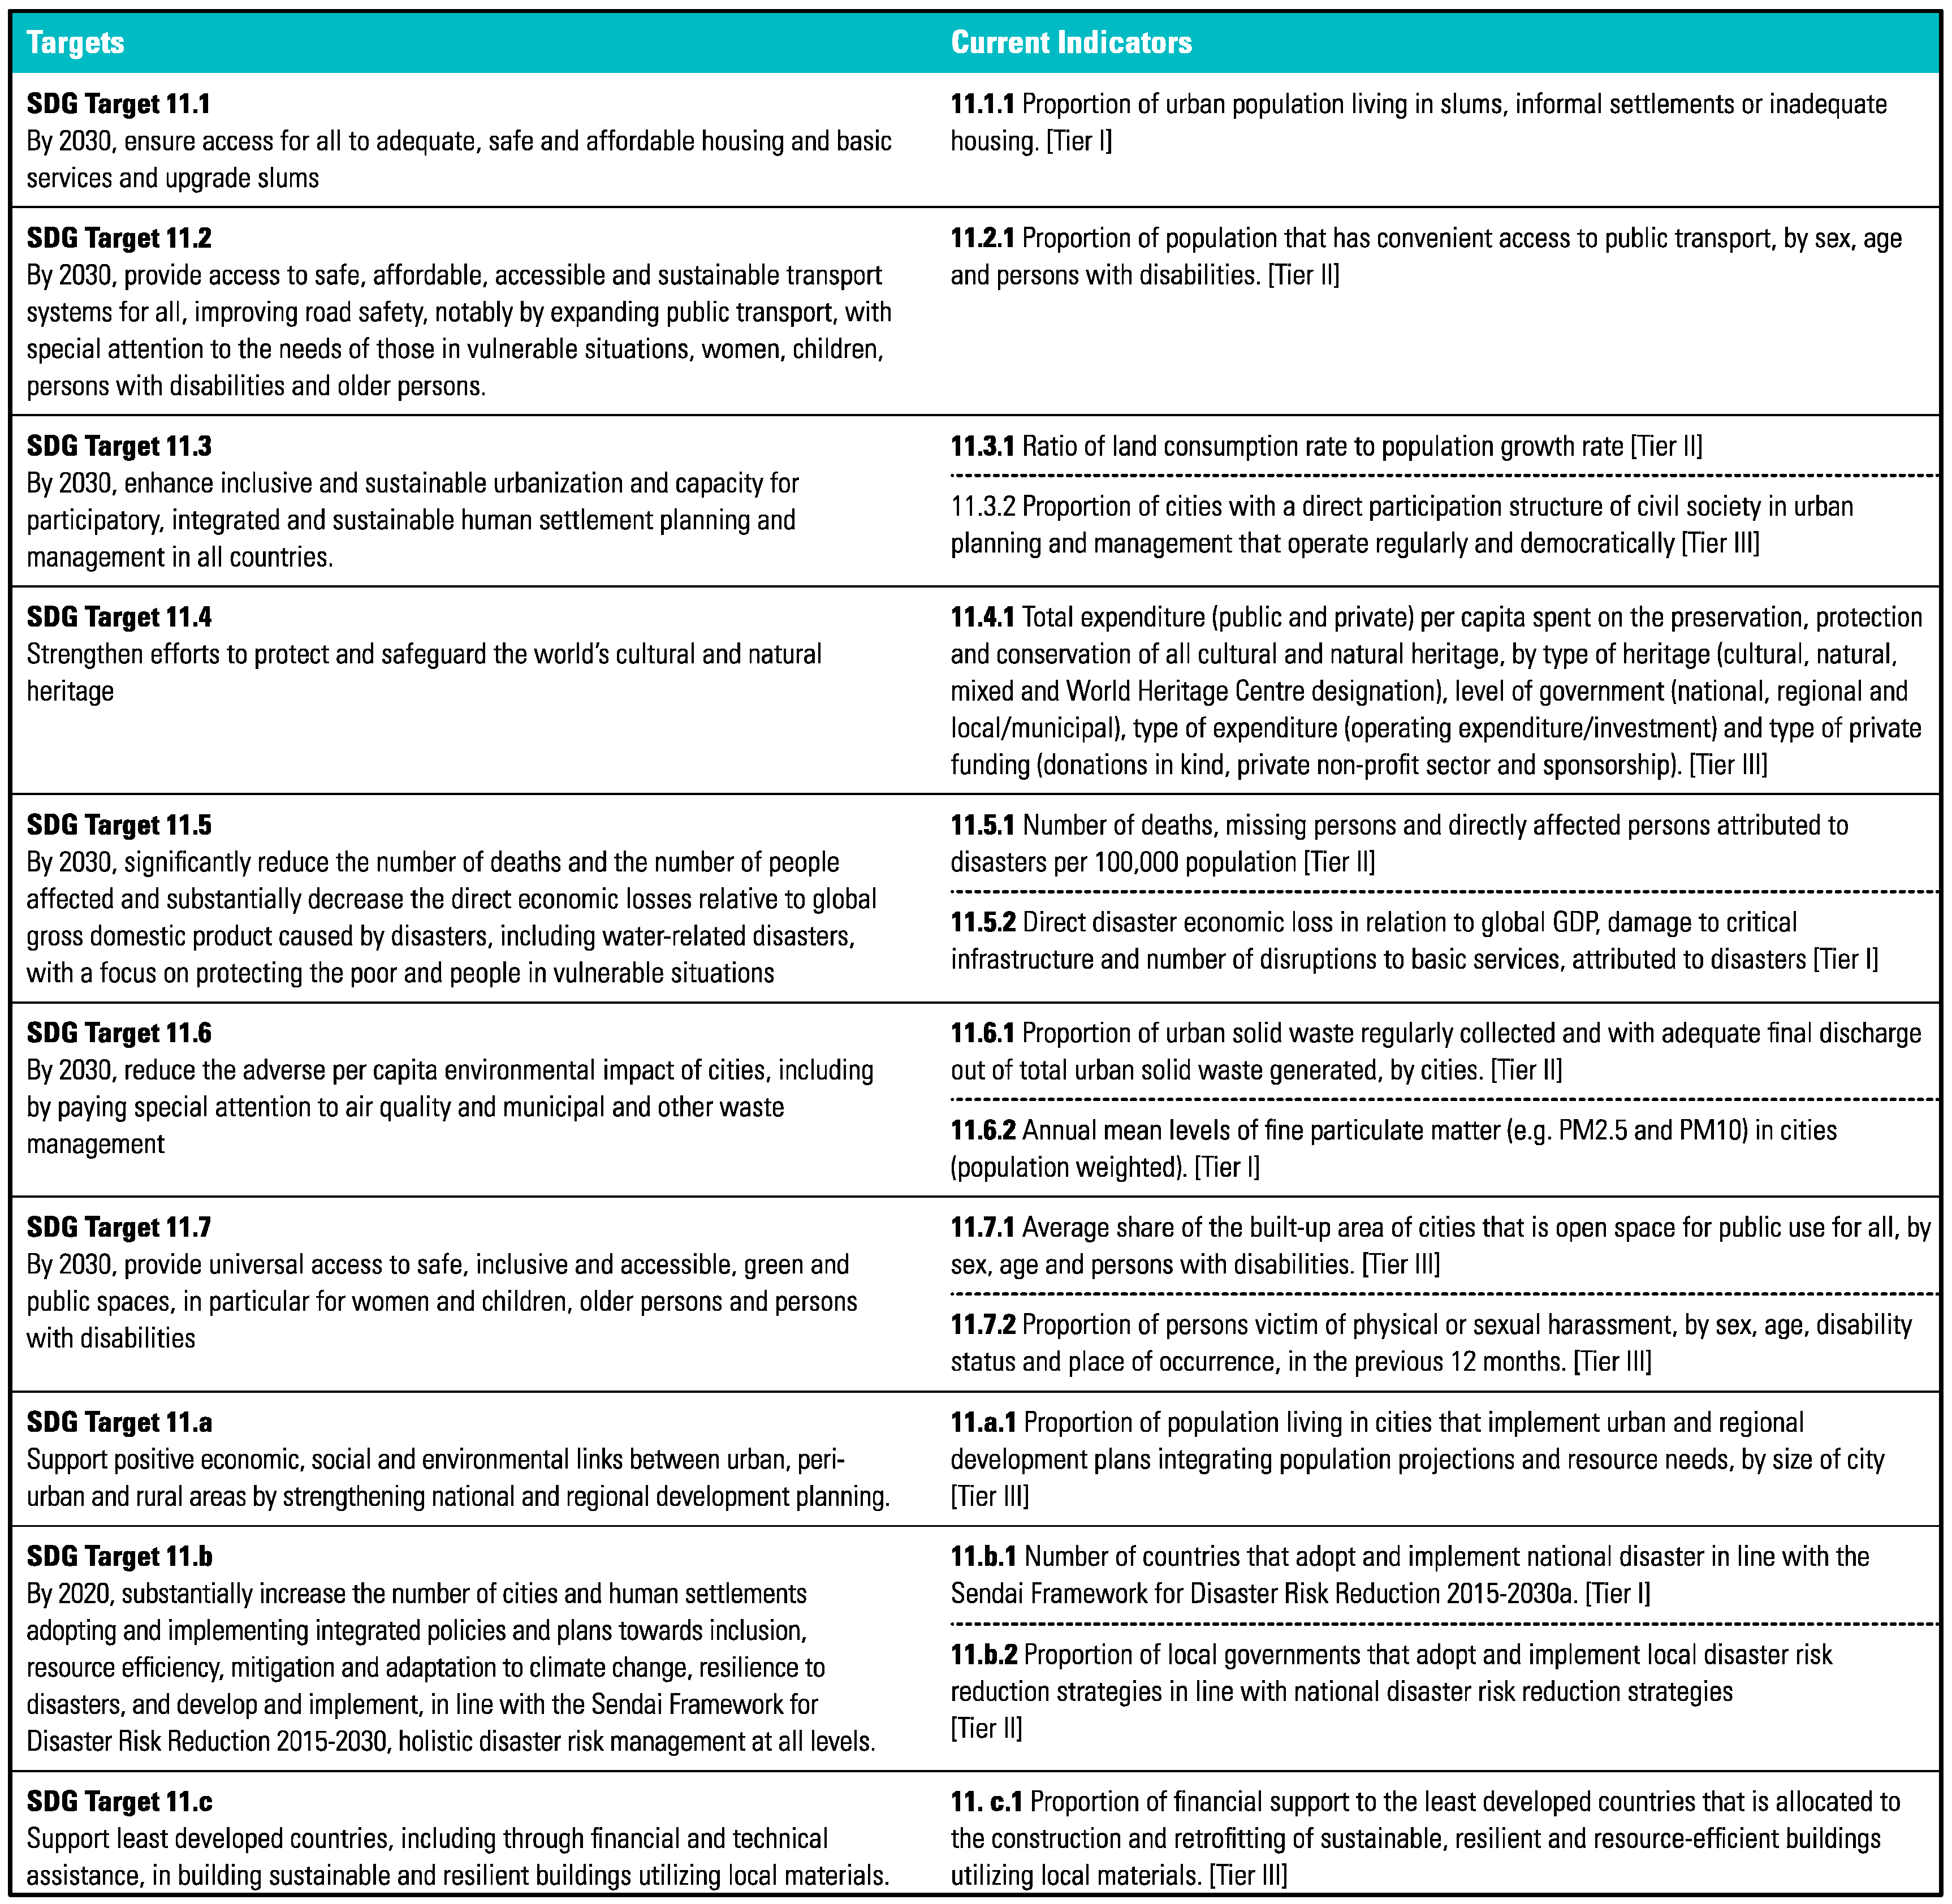
What makes SDG 11 (see the
Appendix for a table (
Figure A1) with the targets and indicators) particularly interesting as a case study for this analysis is that it is the only Goal which focuses on development outcomes at the subnational (city) level. With cities representing increased density of human settlements—and thus of (in)equalities—in space, to be representative, the SDG 11 monitoring framework needs to be sensitive to the role of inequalities at
intra-city scale, i.e., between neighbourhoods.
How then can inequalities affect the representativeness of the SDG 11 monitoring framework? Here, the lack of conceptual precision some authors had identified in the target definitions can be conducive to localisation—it may indeed be intentional—as it opens the framework up to local interpretations. However, conceptual openness to interpretation and uncritical operationalisation of the targets could also lead to regressive outcomes, as the concepts could be used to mobilise in favour of undifferentiated conceptualisations of equality and non-contextualised planning approaches, which can increase vulnerability. This may especially be the case in cities with high spatial intersecting inequalities, where intra-urban interpretations of the target definitions may be more diverse.
The question regarding the extent to which inequalities could affect the representativeness of the SDG 11
indicators needs to be discussed in the context of the SDG indicator tier classification which is based on the indicators’ conceptual clarity and data availability. Tier III indicators are defined as indicators “with no internationally agreed established methodology or standards” [
38] (p. 4). A closer look suggests that this official definition refers to differences in conceptualisations of the respective indicator, such as what constitutes public open space (indicator 11.7.1) or sexual harassment (11.7.2), amongst others. Other reasons for an indicator to be classified as Tier III is the lack of an agreed methodology for data collection and for calculating the indicator. Indicators in Tier II have defined parameters and established calculation methods, but limited data availability in the majority of UN member states. Tier I indicators have both, concepts that have been adopted and operationalised by the UN’s Inter-Agency Expert Group on SDGs, and recent and periodically sourced data that is available from national statistical systems for at least half of the member states [
38].
Some Tier I and II indicators are based on concepts which are at least as broad as the above-mentioned Tier III examples, and which also may vary across socio-spatial contexts. City dwellers’ definitions of convenience in access to public transport (11.2.1) or essential health services (3.8.1—included here because it represents a basic urban infrastructure) for example may vary according to horizontal, vertical, spatial and intersecting inequalities within the city. However, these indicator concepts are measured with comparatively narrowly defined parameters—a distance measure in the case of 11.2.1, and a set of 14 tracer indicators on healthcare provision for 3.8.1.
Regarding
data, Howard et al. [
39] remind us that inclusive development depends on the knowledge of marginalised groups being embedded in the data. This view echoes Sassen’s statement that “every neighbourhood has knowledge about the city that is different from the knowledge of the center, of the city government, of its elites and experts” [
28]. Monitoring systems that do not reflect the “complex realities of people living at the margins of society” [
39] (p. 1) risk reinforcing the multiple forms of inequalities. In the conventional data practices, such as census or household surveys this may be related to sampling frames being based on the formal constituents of a city, resulting in poor representativeness in cities where informal processes in housing, transport and other critical urban services play an important role of daily life [
40]. Moreover, other surveys, which may be more inclusive and more frequent, such as the Demographic and Health Survey Program (DHS) or the Multiple Indicator Cluster Surveys (MICS), have a specific thematic area and thus may have limited value for indicators outside their focus.
Monitoring challenges related to spatial inequalities may also be due to practical issues, for example in the case of physical barriers to access to conduct the survey, or outdated censuses—especially in slums which have a high proportion of transitory population. Undercounting the most vulnerable in the city may also be related to political reasons and “socially constructed census tracts” [
8] (p. 177), as well as underreporting due to fear of stigmatisation which may bias household survey replies from respondents from marginalised urban communities [
39,
41]. Lucci et al. [
41] also highlight the problem of household surveys with sample sizes that are often too small (e.g., only distinguishing between urban/rural) to capture the development outcomes of the most marginalised urban residents as well as the lack of granularity, both of which compound the problem of ecological fallacy.
Echoing notions of the digital divide, Howard et al. [
39] also warn against the assumption that data from digital repositories (e.g., social network data or Big Data) increase the visibility of marginalised communities and representativeness “if the way digital data is produced is exclusionary” (p. 2), as it depends on “who controls the new systems and determines what knowledge they produce, who has access to the data, who interprets them, and of course, what they are used to achieve” [
40] (p. 96). This, therefore, calls for participatory and open data practices which are both top-down and bottom-up, for the data to accurately reflect the multi-dimensional complexities of the lives of marginalised communities [
39,
40].
4. Methodology
The research question—to what extent could the representativeness of the SDG 11 indicator and data framework be affected by spatial and intersecting intra-urban inequalities?—will be addressed by a review of documentary evidence regarding the provisions to account for inequalities in the methodological and data proposals for monitoring SDG 11. These publicly available documents are addressed to Member State monitoring practitioners, which include National Statistics Offices, city government, academia and civil society organisations:
The SDG 11 metadata document [
38] comprises the main methodological issues and challenges, the proposed methodologies and data sources for measuring the SDG 11 indicators;
the SDG 11 Synthesis Report [
42] was prepared for the 2018 United Nations High Level Political Forum, which reviewed the latest global trends as well as methodological advances for monitoring SDG 11; and
documentation used for training the National Statistics Offices and other stakeholders involved in monitoring in the Member States, such as the latest versions of the SDG 11 training manuals, including data collection checklists [
43].
Adhering to the indicator sequence of SDG 11, the targets and indicators were categorised according to the degree to which they accounted for intra-urban inequalities in the target definition, the indicator definition and parameters, and the data sources and production methods to inform the indicator. The analysis focused on those indicators whose development outcomes
directly affect the quality of life of urban residents and where intra-city variations are likely to occur in cities with high levels of inequalities. These are 11.1.1 (proportion of people living in slums, informal settlements and inadequate housing), 11.2.1 (convenient access to public transport), 11.5.1 (number of deaths, missing persons and directly affected persons attributed to disasters), 11.6.1 (urban waste collected), 11.6.2 (annual mean levels of particulate matter), 11.7.1 (share of built-up area that is open space for public use for all), and 11.7.2 (proportion of persons victim of physical or sexual harassment). The other SDG 11 indicators either refer to administrative and financial interventions and denominators, or, only indirectly affect the residents’ experienced quality of life (see the table in the
Appendix). We have analysed all of the indicators mentioned above, but for the sake of brevity
Section 4 will only provide an extended analytical description for a sample of four indicators (one of each Tier, with Tier III represented by the two 11.7 indicators. A summary table at the end of the analysis comprises all seven indicators, and their detailed descriptive analyses can be made available upon request to the corresponding author.
The level of salience of intra-urban inequalities is assessed according to the following criteria:
For the target definition: Level of reference to inequalities: Universal (for example, “equal access” or “access for all”), targeted, mentioning specific vulnerable groups, or no reference; the question here is: “To which extent does the target definition refer to the potential existence of urban inequalities?”
For the indicator: Disaggregation requirement indicating sensitivity to vertical, horizontal and spatial intra-urban inequalities. Here, the question addressed is: “Do the indicator definition and parameter disaggregation requirements reflect sensitivity to the three types of intra-urban inequalities?”
For the data sources and production methods: Proposed degree of participation, ability to capture marginalised urban communities (currently and ideal case/future data sources and production methods, depending on institutional and technological capacities); referring to the observations regarding data in
Section 3.2, we asked, “are the proposed current, future and ideal data sources and production methods able to bring intra-urban inequalities into the picture?”.
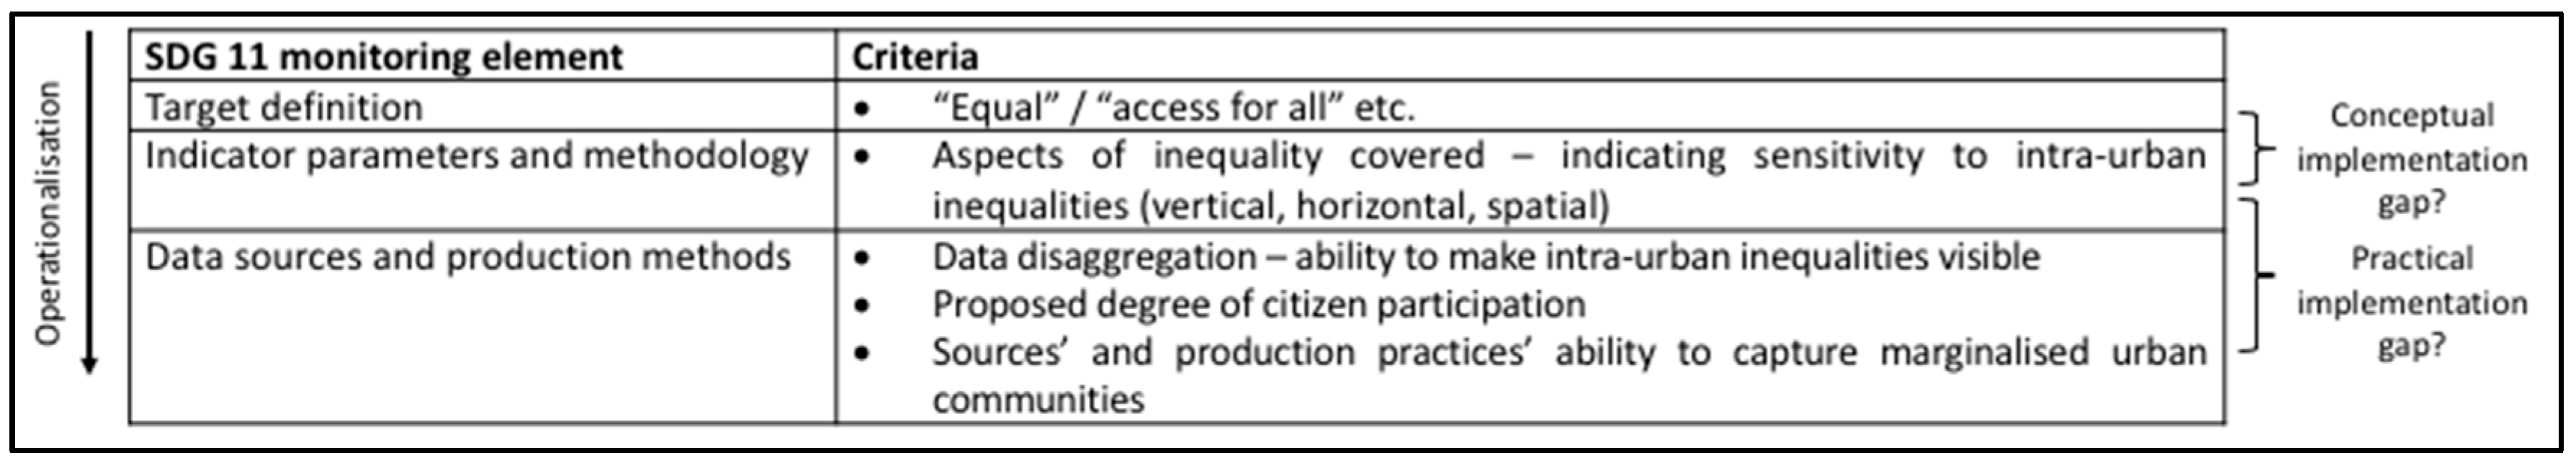
1., 2. and 3. represent an increasing scale of operationalisation in SDG 11 monitoring. Implementation gaps (see
Figure 2) may emerge in the form of a conceptual implementation gap, for example where the target definition accounts for inequalities but the indicator relies on narrowly defined parameters. There may also be a practical implementation gap, for example where parameters aim to capture intra-urban inequalities, but data practices do not yet exist to provide the required level of disaggregation. With an accepted monitoring methodology and data sources, only Tier I indicators may have both types. For Tier II indicators the analysis looked for conceptual implementation gaps and the
potential of practical implementation gaps based on the
proposed data sources, while the “inequality vulnerability assessments” of the two Tier III indicators was based on the theoretical discussions and proposals in the guidance documents for the monitoring stakeholders. It is possible that in some cases these implementation gaps are interdependent.
The categorisation thus also reflects the indicator Tier status by including the minimum/current and ideal case/future proposals regarding methodology and data, which allows for variations in local technological and institutional capacities.
Figure 2 summarises the methodological approach.
For a systematic analysis the methodological approach has been operationalised with the following questions in mind, which are applied to each indicator (
Table 2).
5. Analysis
With the methodological approach defined and operationalised we assessed the selected indicators in turn. The four indicators selected for an extended analysis were 11.1.1 (proportion of people living in slums, informal settlements and inadequate housing) (Tier I), 11.2.1 (convenient access to public transport) (Tier II) and the two 11.7 indicators; 11.7.1—share of built-up area that is open space for public use for all; 11.7.2—proportion of persons victim of physical or sexual harassment) (both Tier III).
5.1. Target 11.1/Indicator 11.1.1 (Tier I)
Progress towards Target 11.1: By 2030, ensure access for all to adequate, safe and affordable housing and basic services and upgrade slums is measured by indicator 11.1.1—the proportion of urban population living in slums, informal settlements or inadequate housing [
38] (p. 10). As this target by definition deals with intra-urban inequality, its representativeness can only be affected by implementation gaps.
Referring to housing deprivation in the form of “slums,” “informal settlements” and “inadequate housing,” this indicator reflects the relative nature of intra-urban inequalities regarding housing by operationalising the target along parameters for urban service accessibility, the character of the building structure, tenure, spatial context, affordability and cultural adequacy [
38]. The possibility of intersecting inequalities, therefore, appears to be accounted for in the parameters of this indicator.
The metadata document specifically refers to spatial inequalities by calling for disaggregated data at the intra-urban level [
38]. Intersecting inequalities are also addressed with household level data on gender, ethnicity, income and disability (ibid.). There, however, appears to be a practical implementation gap to inform housing adequacy (especially regarding affordability, accessibility and cultural adequacy). The SDG 11 Synthesis Report indicates that there is currently limited technical capability to collect data in this regard [
42].
The main data sources and practices currently proposed in the training documentation refer to census data, Demographic and Health Surveys, and Multiple Indicator Cluster Surveys [
43]. Representativeness regarding potential intra-urban inequalities, therefore, depends on the inclusivity of the census and thematic relevance of the complementary surveys (see replies to C1 and C2 in
Table 3).
Future data production methods the SDG 11 Synthesis Report refers to, such as the combination of satellite imagery analysis in combination with participatory slum mapping [
42], are likely to enhance the indicators’ ability to reflect bottom-up perceptions of multiple forms of inequality.
Table 3 shows the assessment of indicator 11.1.1 in response to the corresponding questions listed in the operationalised methodological approach above.
5.2. Target 11.2/Indicator 11.2.1 (Tier II)
Target 11.2. aims to, “by 2030, provide access to safe, affordable, accessible and sustainable transport systems for all, improving road safety, notably by expanding public transport, with special attention to the needs of those in vulnerable situations, women, children, persons with disabilities and older persons” [
38] (p. 21). It calls for equity in access to transport, specifically refers to forms of intersecting inequalities (such as gender, often intensified by spatial inequality, resulting in a positive assessment for question A1 in
Table 3) and is measured by the “proportion of population that has convenient access to public transport, by sex, age and persons with disabilities” (ibid). Convenience in access to transport currently is assessed with a distance parameter (no more than 500 metres walking distance from a frequently visited reference point, such as a home, a place of employment, market or other commercial centres) [
38]. Although distance is a spatial factor, it does not reflect spatial intra-urban inequalities, as the adequate distance may vary according to the density and other structural characteristics of a neighbourhood (see corresponding responses to question B1 and B2).
In its current version, this indicator is vulnerable to various forms of inequality, which is due to both a conceptual and practical implementation gap. As already mentioned as an example in the Background Section, the distance parameter limits the representativeness of “convenience in access” in cities with multiple forms of intra-urban inequalities. Acknowledging this vulnerability, the SDG 11 Synthesis Report report points to the challenges of spatial intersecting inequalities in urban mobility [
42]. Both metadata and SDG 11 Synthesis Report emphasise the need for further methodological refinement regarding the parameter for “convenient access” and relatedly, the technological capacity to produce data for informing it.
In terms of data, the current parameter relies on geospatial data for the location of public transport stops and population served, drawn from conventional sources, such as the city administration or service providers, or open data, such as OpenStreetMap [
38]. The potential of the data sources currently proposed in the guidance material for national stakeholders [
43] to generate representative data, therefore, depends on the inclusivity of the data practices for generating the data (response to C1). With the aim to establish buffer service areas, the indicator’s focus is by definition intra-urban (C2). The positive assessments for D1 and D2 reflect the methodological proposals for enhancing representativeness regarding spatial intersecting inequalities. Extending the item’s boundary in Stone’s terms [
35], might include origin-destination surveys to measure convenience in access to opportunities (as opposed to transport stops), the inclusion of informal transport systems in monitoring, as well as open-source trip planning platforms, which can increase the visibility of transport needs of marginalised communities.
5.3. Target 11.7/Indicator 11.7.1 (Tier III) and Indicator 11.7.2 (Tier III)
Target 11.7 directly refers to aspects of horizontal (in)equality by aiming to “provide universal access to safe, inclusive and accessible, green and public spaces, in particular for women and children, older persons and persons with disabilities, by 2030” [
38] (p. 70) (see A1 in
Table 3). Indicator 11.7.1, measuring the “average share of the built-up area of cities that is open space for public use for all, by sex, age and persons with disabilities” (ibid.) operationalises this aim for monitoring by calling for data which is disaggregated along demographic attributes. Depending on the inclusiveness of the data sources, this enhances the indicator’s sensitivity to horizontal inequalities regarding access to open space (B1). Spatial and vertical inequalities are not referred to in the parameter definition (B2), despite the SDG 11 Synthesis Report’s suggestion that use of public space for leisure is higher for urban residents with lower incomes [
42].
The data practices proposed for informing this indicator consist of satellite imagery digitisation, complemented with ground-truthing as well as community-based maps to establish ownership (public or private) and complement non-existent or outdated municipal inventory lists of public spaces. The ideal data practices proposed for this Tier III indicator are thus likely to capture inequality-related differences in access and interpretations of public space across neighbourhoods (D1 and D2). Where implemented, this indicator is therefore likely to accurately represent potential inequalities regarding access to public space in cities.
Indicator 11.7.2 (Tier III) measures the “safe access” aspect of target 11.7 by monitoring the “proportion of persons victim of physical or sexual harassment, by sex, age, disability status and place of occurrence, in the previous 12 months” [
38] (p. 81). While the indicator definition accounts for the possibility of horizontal inequalities, the documents mention that there is uncertainty regarding a universal agreement on the definition of “sexual harassment” [
38]. “Place of occurrence” in the indicator definition represents a non-spatial typology (home, workplace, street). The indicator, therefore, does not account for spatial inequalities in its current version (see replies to B1 and B2 in
Table 3).
The likelihood that physical and sexual violence is underreported due to gender inequality is compounded by the lack of disaggregated data, which currently mostly only report the type of crime, and consistent reporting methods (some countries have dedicated surveys, while others provide a specific module in the Demographic and Health Surveys (see replies to C1 and C2 in
Table 3).
Future data practices mentioned in the SDG 11 guidance documents include participatory geo-spatial methods. It can therefore be expected that the practical implementation gap regarding the availability of data which can make visible horizontal, as well as intra-urban spatial intersecting inequalities, can be reduced (see replies to D1/D2).
6. Discussion
The seven SDG 11 indicators and their related targets that were selected for the analysis of the SDG 11 monitoring framework’s ability to account for intra-urban inequalities (four of which were presented in extended form above) are characterised by the immediacy of their focus areas. These areas (i.e., housing, access to public transport, the impact of disasters, solid waste, air pollution, access to green and public spaces and personal safety) directly affect how people experience daily life in their neighbourhoods. However, the analysis suggests that not all of these indicators similarly account for the possibility of urban residents not being equally able to realise their rights to access or protection, which are at the core of SDG 11.
While four out of the five target definitions analysed provide some consideration regarding vertical or horizontal inequalities, the possibility of spatial inequalities does not feature at the target level. Moreover, half of the targets assessed emphasise the possibility of specific horizontal inequalities, yet the relation between target definition and indicator parameters regarding attention to vertical and horizontal inequalities is not always direct. This suggests that there are conceptual implementation gaps—especially in the Tier II indicators that were analysed in this paper (see 11.2.1, 11.5.1, 11.6.1). Crucially, except for 11.1.1 (which by definition measures spatial intra-urban inequalities), the significance of the intra-urban spatial context does not appear to be considered in the indicator parameters. This is especially important when considering that the SDG 11 Synthesis Report points to the impacts of intra-urban spatial inequalities in several indicators [
42] (11.1.1, 11.6.1, 11.6.2 and 11.7.1).
The degree to which the representativeness regarding intra-urban inequalities of the two Tier I indicators is affected by practical implementation gaps is debatable, as indicator 11.1.1 currently relies on conventional sources, and 11.6.2 does not consider any types of intra-urban equalities in the first place. With most of the Tier II indicators currently proposing the use of conventional, centrally administered data sources as the basis for monitoring, there is a potential of undercounting informality due to systematically biased sampling frames.
The conceptual and methodological openness of the two Tier III indicators we analysed provides an opportunity for enhanced representativeness. Their challenges relate to the lack of existing conventional datasets and the need for emerging data practices that are able to result into disaggregated data at group level and thus provide spatial detail at neighbourhood level, incorporating local meaning of green and public space (11.7.1) and victims’ perceptions of experiences and risk of physical and sexual violence (as opposed to top-down defined concepts).
Much of the indicators’ robustness against the risk of perpetuating intra-urban inequalities therefore currently depends on the inclusiveness of the data practices used to inform them. Encouragingly, the guidance documents acknowledge the need for intra-urban differentiation regarding the multiple forms of inequalities, since the “ideal/future case scenario” of most of the indicators calls for data which is disaggregated at the intra-urban level.
Given the SDGs’ mandate to “leave no-one behind” and “reach those furthest behind first,” the response to the research question is as follows:
The SDG 11 monitoring framework would benefit from a more prominent position and emphasis of intra-urban inequalities at the conceptual/definitional level across all targets and indicators. This would be essential for closing the conceptual implementation gaps in the short term and create awareness of the former among monitoring stakeholders.
In the medium term, a methodological approach to “recalibrate” the city-level indicators to describe the degree of intra-urban variances regarding the outcomes of the respective SDG 11 indicator, especially in cities with a high degree of inequalities (such as cities with slums), may be worth of further investigation.
In the long term, the practical implementation gaps may be closed with the emergence of methodologies and data practices which allow for intra-urban perspectives and differences in experiences.
7. Conclusions and Future Work
In the context of the discussions regarding the SDGs’ effectiveness and potential for progressive development, we have argued in this paper that the prevalence of opportunities or threats in the SDG 11 monitoring framework depends on the extent to which intra-urban inequalities are accounted for. We further suggested that this could be done by addressing two types of implementation gaps in the monitoring system, which, if left unaddressed, are likely to contribute to perpetuating several types of inequalities. This specifically relates to spatial intersecting intra-urban inequalities, which are not reflected in most of the analysed indicator parameters. Moreover, with emerging participatory geospatial data practices being adopted, it will increasingly be possible to use them to complement the currently proposed conventional data sources and practices, such as census and household surveys.
In terms of theoretical contribution, this paper addresses the extensive debate regarding the potential of the SDG monitoring framework by pointing to its ability to account for inequalities as a mediating factor. It provides a conceptual toolbox for assessing the SDG 11 monitoring system in this aspect, and therefore can be regarded as a basis for evaluating further conceptual and methodological refinements of the latter as well as the fitness-for-use of emerging data generation methods—such as public participatory geospatial methods and citizen-generated data practices—particularly regarding their “vulnerability” to inequalities.
In line with the initial questions underpinning this paper, we propose further research to complement the current data sources with locally produced indicator samples that incorporate local meaning. These could become an important element for localisation as it can “recalibrate” the national or city-level indicator outcome, resulting in a better picture regarding intra-urban variations, which is of particular importance of cities with so-called slum neighbourhoods. Extending UN-Habitat’s “National Sample of Cities” methodology, which “takes into account sub-regional and city specific characteristics and variances can be used to monitor the dominant pattern in the country’s cities in an aggregated manner” [
44] (p. 4), such an approach could be in the form of an ‘Urban Sample of Neighbourhoods.’ The purpose of such a sample would be to obtain insight regarding the intra-urban variances of a city’s neighbourhoods, which in turn could be fed into the National Sample of Cities.
An important topic which was outside the scope of this paper is the privatisation of urban property and infrastructure, which has increased sharply since 2008 [
45]. Future related work may, therefore, discuss the impact of non-resident privatisation and corporate ownership on the interpretation and measurement of the urban development targets in the 2030 Agenda, not least inclusiveness and sustainability.
As suggested earlier, inequalities in cities have been the focus of scholarly discussion for over two millennia (at least in the “West”). It will take some time to adapt the monitoring and governance systems, and technological and institutional capabilities, and most importantly (although maybe somewhat idealistically), practiced equality in participation, to be able to make them visible and account for them. This paper intends to offer a contribution towards that direction and hopefully sparks further discussions among the various stakeholders in urban policy, civil society, academia, urban services and critical infrastructure provision, who collectively can bring about these necessary changes.


