Letter

How Data-Poor Countries Remain Data Poor: Underestimation of Human Settlements in Burkina Faso as Observed from Nighttime Light Data

1
Institute of Urban Research, Malmö University, SE-211 19 Malmö, Sweden
2
Department of Human and Economic Geography, Lund University, Sölvegatan 10, SE-223 62 Lund, Sweden
*
Author to whom correspondence should be addressed.
ISPRS Int. J. Geo-Inf. 2019, 8(11), 498; https://0-doi-org.brum.beds.ac.uk/10.3390/ijgi8110498
Submission received: 20 September 2019 / Revised: 17 October 2019 / Accepted: 3 November 2019 / Published: 4 November 2019

Abstract

:
The traditional ways of measuring global sustainable development and economic development schemes and their progress suffer from a number of serious shortcomings. Remote sensing and specifically nighttime light has become a popular supplement to official statistics by providing an objective measure of human settlement that can be used as a proxy for population and economic development measures. With the increased availability and use of the Defense Meteorological Satellite Program Operational Linescan System (DMSP-OLS) and data in social science, it has played an important role in data collection, including measuring human development and economic growth. Numerous studies are using nighttime light data to analyze dynamic regions such as expansions of urban areas and rapid industrialization often highlight the problem of saturation in urban centers with high light intensity. However, the quality of nighttime light data and its appropriateness for analyzing areas and regions with low and fluctuating levels of light have rarely been questioned or studied. This study examines the accuracy of DMSP-OLS and VIIRS-DNB by analyzing 147 communities in Burkina Faso to provide insights about problems related to the study of areas with a low intensity of nighttime light during the studied period from 1992 to 2012. It found that up to 57% of the communities studied were undetectable throughout the period, and only 9% of communities studied had a 100% detection rate. Unsurprisingly, the result provides evidence that detection rates in both datasets are particularly low (3%) for settlements with 0–9999 inhabitants, as well as for larger settlements with population of 10,000–24,999 (28%). Cross-checking with VIIRS-DNB for the year 2012 shows similar results. These findings suggest that careful consideration must be given to the use of nighttime light data in research and global comparisons to monitor the progress of the United Nation’s Sustainable Development Goals, especially when including developing countries with areas containing low electrification rates and low population density.

Graphical Abstract

1. Introduction

The traditional ways of measuring global sustainable development and economic development schemes and their progress suffer from a number of serious shortcomings [1]. Official development statistics are subject to high costs and capacity constraints. They are based on data collected through traditional means such as surveys, which makes them expensive to produce. It also requires countries to have high statistical capacities to produce statistics at the demanded levels of accuracy and reliability. Many poor and developing countries lack such capacities despite decades of international statistical support. Particularly, the problem of measuring economic growth has stimulated research in economic geography and economics for many decades [2,3,4]. Despite continuously revised and more encompassing research on global comparisons of income and economic activity using conventional data (time series or panels measured at country level), it is difficult to find reliable data for all countries on lower administrative levels. Apart from the lack of data on low administrative levels, a number of studies have pointed out serious measurement errors in gross domestic product (GDP) growth [5,6,7,8].
Traditional measures of development also tend to have low observational detail and lead to heterogeneous global coverage. Data is collected for provinces or states, and typically only national-level data is shared and distributed by the United Nations (UN) and other international organizations. These global datasets do not permit analyses of trends and trade-offs between regions or city networks nor between various population groups within and across countries. Furthermore, traditional measures of development such as household surveys and population censuses are characterized by low temporal frequency and heterogeneous temporal coverage. Most indicators are estimated annually or even once every few years. In addition, data are typically one or several years old once they are made available. Consequently, most of these official data cannot serve as an early warning function or in monitoring development schemes.
It is highly unlikely that comprehensive, high-quality data for traditional progress indicators or the global Sustainable Development Goals will be available for all countries within the next 20 years. In fact, the above shortcomings are common to most socio-economic statistics, especially in developing countries.
Remote sensing data and methods have recently emerged as a viable option to help overcome the above shortcomings. Mostly associated with biophysical applications, remote sensing has, for some time, been used in social science research. The majority of that research has focused on relatively marginal problems in contemporary social science, which are often related to land-use and land-cover issues [9].
In a recent study with the aim of analyzing the socio-economic effects of the mining industry in a selection of West African countries, it was observed that relatively large human settlements were undetected in the nighttime light data [10]. More specifically, when the sum of intensity of lighting was calculated for the period from 1992 to 2012, it was noted that some districts flickered between no lights detected at all to relatively normal levels of lighting in an unrealistic way. In light of the increasing applications of nighttime light in mapping human development, these findings provide important insights about how low levels of light can fluctuate in the nighttime light datasets.
The aim of the paper is to bring light to the problems that can arise when analyzing geographical areas with a very low intensity of nighttime light. This is an important contribution in an era where nighttime light data is used by an increasing number of academic disciplines and contexts.
The main objective of the present study is to test the accuracy of nighttime light (NTL) image products (i.e., the Defense Meteorological Satellite Program Operational Linescan System (DMSP-OLS) stable light products and Day/Night Band of the Visible Infrared Imaging Radiometer Suite (VIIRS-DNB) composites) focusing on small geographical areas with low population and levels of nighttime light. To fulfill this study objective, we first use the World Gazetteer list of human settlements to geographically locate 147 communities in Burkina Faso. Then, we aim to detect these human settlements in the DMSP OLS dataset over the period from 1992 to 2012 and to cross-check the result with VIIRS-DNB for the year 2012. The detection rates are compared across the datasets with the projected population obtained from the World Gazetteer list of human settlements [11]. Finally, we analyze household-level data on electricity availability from 2006 in the 147 communities to compare the results of the nighttime light detection.

2. Literature and Background

The distribution of artificial lighting on Earth provides a unique view of human activities and development [12,13]. The potential of nighttime light data for the study of human activities was recognized first by Croft [14] and then in the mid-1980s by various authors [15]. Although still not a well-used dataset within the social sciences, nighttime light data have been used in research related to economic development (see, for example: [1,12,15,16,17,18]), population [19,20,21,22,23,24], urbanization (see, for example: [25,26,27,28]), epidemiology (see, for example: [29,30]), wars and crime (see, for example: [31,32]), and poverty (see, for example: [33,34,35]). Past research consistently confirms a strong relationship between nighttime light and economic activity in a single year [14,16,36,37,38]. In cross-sectional analysis, nighttime light tends to have a stronger relationship with GDP than population [15,39]. Across a diverse group of 21 countries, lit area and GDP follow a log-linear relationship with an R2 of 0.97 [15]. The linkage between lit area and derivatives of sum of light with economic activity allows the mapping and estimation of GDP from NTL at a range of scales in places where no standard accounts data exists, as exemplified by the production of the first-ever 1 × 1 decimal degrees global map of GDP [40]. Although Sutton et al. [38] argue that NTL can only crudely, if still significantly, estimate sub-national GDP due to its coarse spatial and spectral resolution, it has been used to accurately predict household level wealth in local levels [41,42,43,44]. Bruederle and Hodler [45] studied the relationship between NTL and human development at small geographical areas and concluded that nighttime lights are also a good proxy for local human development when using a research design mapping cross-country variation between small spatial units. Their study does not consider the problem with fluctuating levels of NTL between the studied years for areas with low population density and low electrification rates. Nighttime light has been used to estimate the level of the informal activities in the economy using Cambodia as the study area. Tanaka and Keola [46] demonstrate that data on nighttime light are particularly useful in capturing informal activity. Given the cross-sectional data on formal and informal activity across regions, their approach is applied to estimate the shadow economy in Cambodia. Their approach relies crucially on nighttime light to estimate the shadow economy. Their results provide evidence that the growth of informal activity in Cambodia is larger than that of formal activity, thereby leading to a growing share of informal activity over time in Cambodia. These studies have made attempts to advance research in two directions: (a) estimation of the level of economic activities, such as purchasing power parity (PPP), real GDP, and nominal GDP, and (b) disaggregation of these measures into smaller administrative/non-administrative areas that lack official statistics. These earlier studies provide important knowledge about the dynamic of nighttime light, arguing that human activities can be seen through nighttime light imaginary. However, these studies lack a critical analysis and discussion on the accuracy of nighttime light to detect low levels of nighttime light when analyzing and comparing human development between small geographical areas with scattered population.

3. Materials and Methods
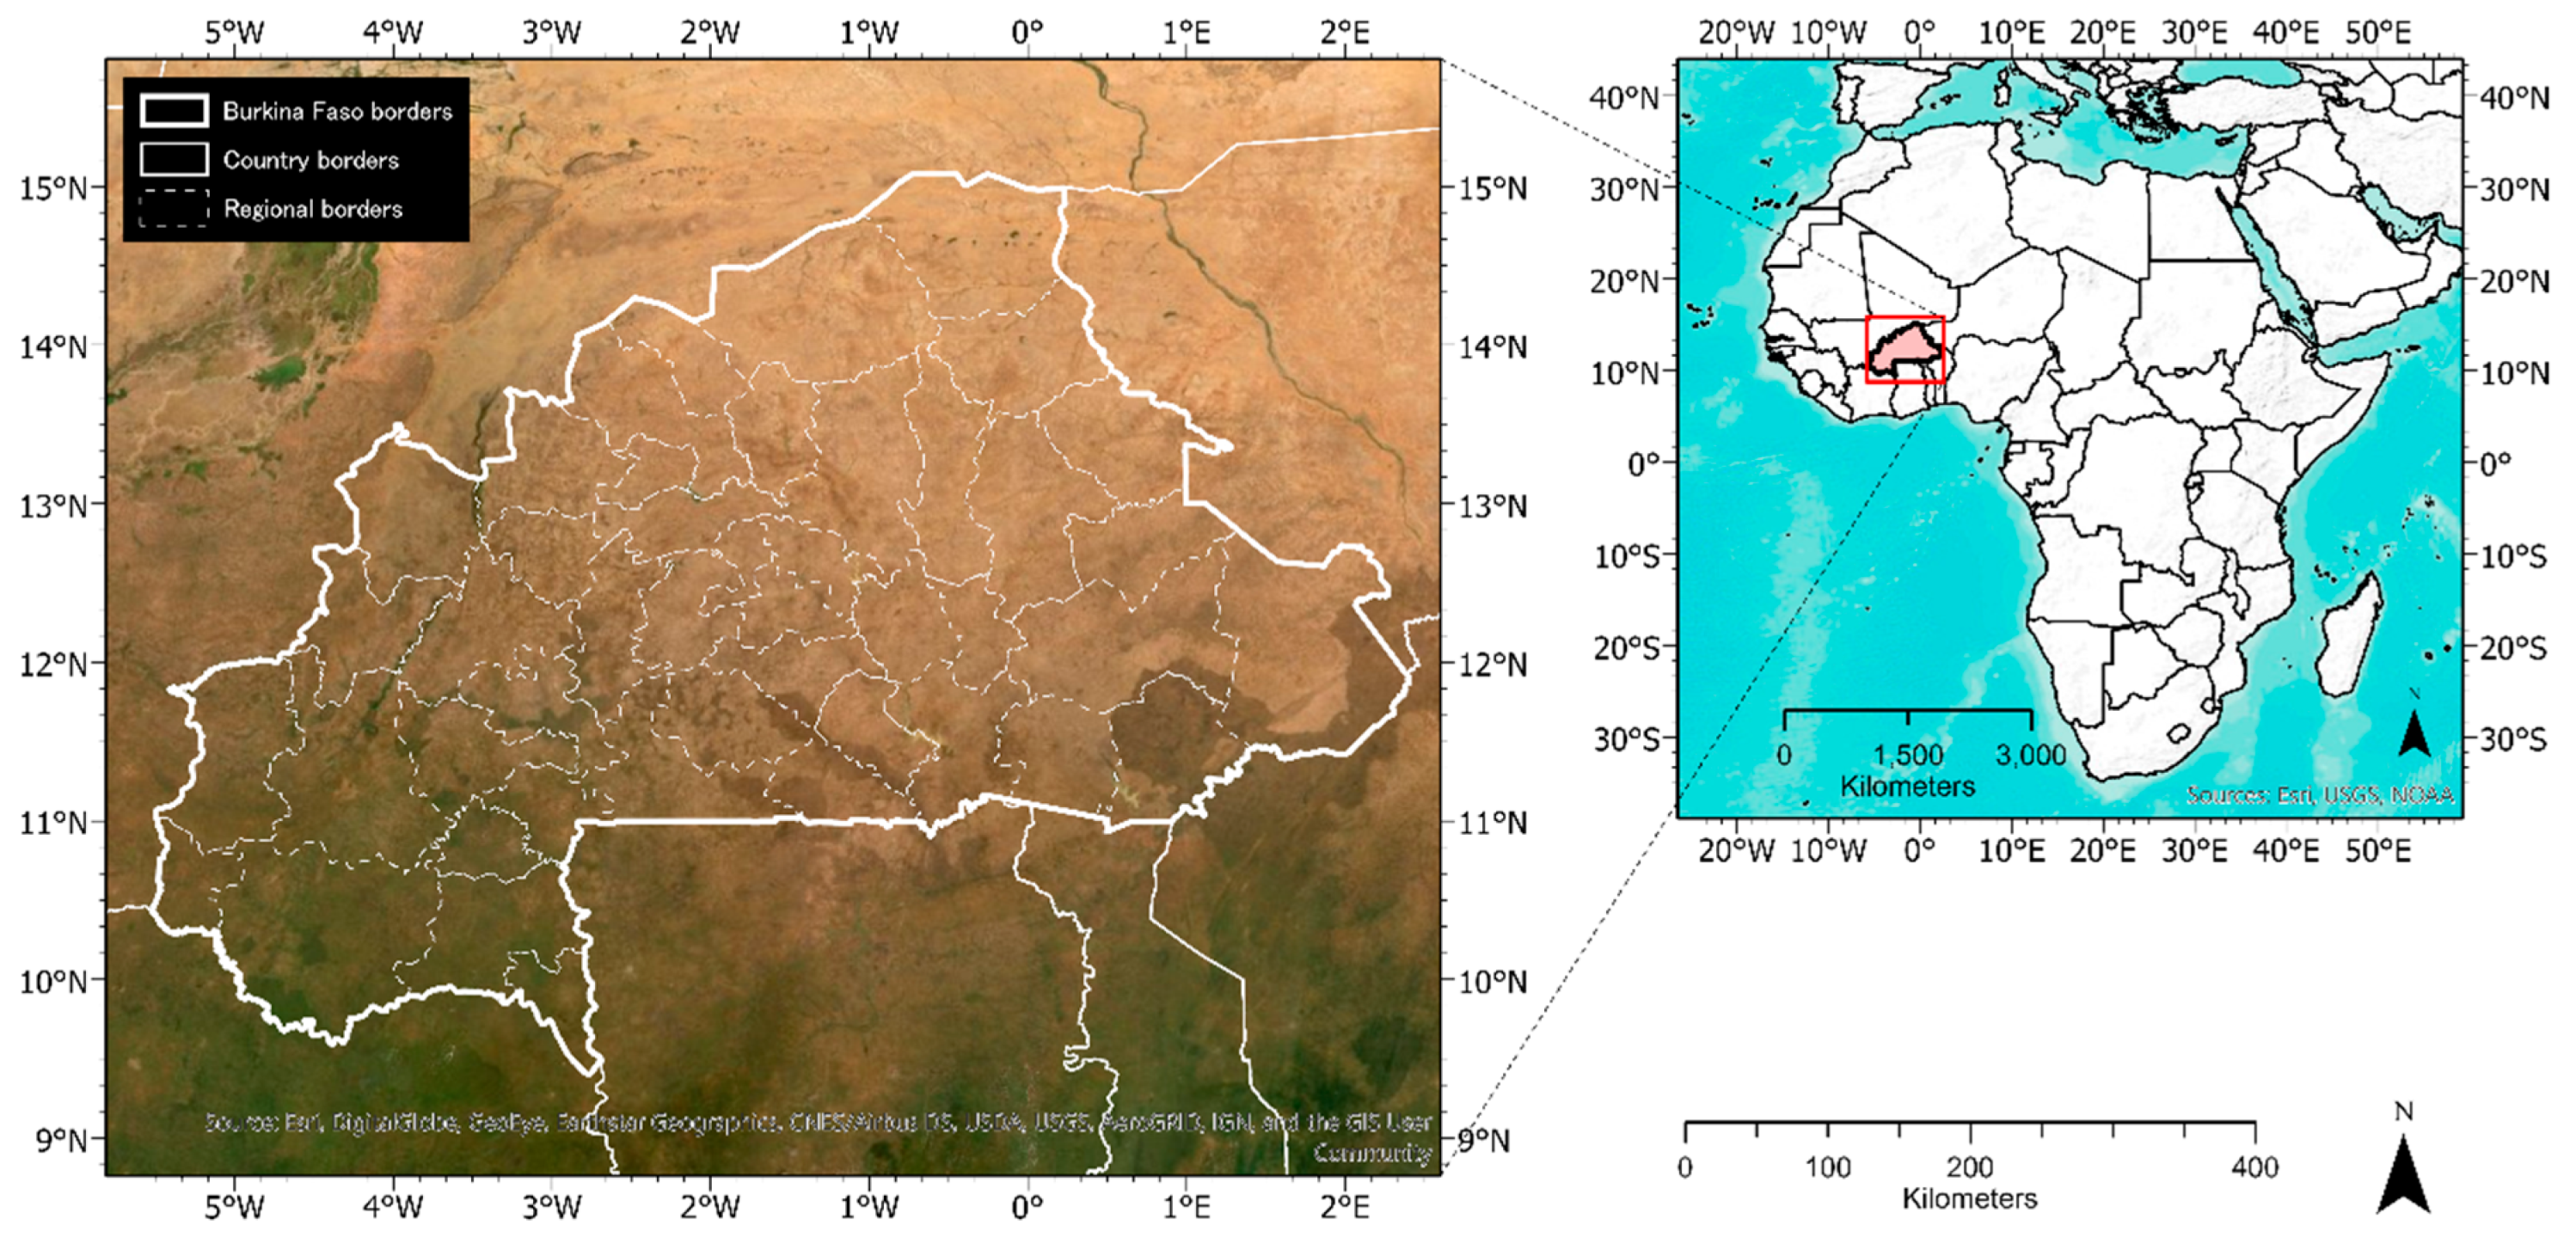
3.1. Study Area

Our analysis focuses on nighttime light observations from Burkina Faso, which is a landlocked West African country of about 14 million people. Figure 1 illustrates Burkina Fas’s landlocked location: it is about 1000 kilometers from the nearest coasts in Côte d’Ivoire, Togo, and Ghana—the poor state of roads and railways is a key obstacle to sustained growth. Large parts of the country lack vegetation.
Burkina Faso’s energy costs are the highest in the West African Economic and Monetary Union (WAEMU) at XOF (1000 West African CFA Franc (XOF) equals 1.7 USD in June 2019) 118 per kilowatt/hour, compared to XOF 56 for Benin and XOF 53 for Niger. The lack of supply and frequent and lengthy power cuts both seriously affect the economy. Electricity access in Burkina Faso is one of the lowest in the world, with a national rate of 18.83% in 2015 compared to the African average of 40%. The per-capita consumption of electricity by total population is only 50 kWh per year. The total generation capacity in Burkina Faso is 256 MW, which is insufficient to meet peak demand within the economy. Power demand is growing at close to 10% per annum [47]. While Burkina Faso employs diesel generators to produce electricity, the high production costs attributed to fluctuating oil prices, as well as growing demand, have forced the government to begin interconnecting Burkina Faso’s grid with that of neighboring countries such as Ghana and Cote d´Ivoire to import additional electricity requirements [48]. The country’s low levels of energy consumption and electricity access provide a suitable case to test the ability and accuracy of the nighttime light to detect area with low levels of nighttime light emissions.

3.2. Data and Methods

The National Oceanic and Atmospheric Association’s National Geophysical Data Center (NOAA-NGDC) has operated the Defense Meteorological Satellite Program (DMSP) for more than 40 years. The program is aimed at monitoring weather using the Operational Linescan System (OLS), which is a series of sensors that are designed to collect global cloud imagery. At night, the visible band is intensified using a photomultiplier tube (PMT), allowing sensors to detect clouds illuminated by moonlight. The boost in detection of lighting afforded by the PMT also leads to the detection of light emitted by human activities including settlements, gas flares, and fishing boats, and new methods to treat the problem of desaturation has been developed [38,49,50,51,52]. The DMSP-OLS sensors have a resolution of 0.56 km, which is averaged on-board into five-by-five blocks to produce a “smoothed” dataset with a resolution of 2.7 km [53]. The OLS is an oscillating scan radiometer, which collects 14 orbits daily in 3000-km swaths. This means that each OLS provides complete global daytime and nighttime coverage of the Earth every 24 hours [38,52].
The NOAA-NGDC processes the remotely sensed nighttime lights data in order to produce composites that exclude moon and sunlit data, glare, locations covered by clouds, and auroral activity [53]. Each composite is an annual average of the daily useable observations for each satellite sensor. Annual datasets have been freely available since 1973, but have only been digitally archived since 1992. Each composite set contains three image types: cloud-free, average visible lights, and stable lights GeoTIFF images. Currently, there are 33 composite sets available online, spanning the period from 1992 to 2012 and taken from six different satellites.
For this study, annual stable lights (version 4) imagery was used. This dataset is filtered to remove ephemeral lights and background noise, including forest fires, lights from fishing vessels, and reflections of moon or starlight, so that only persistent surface lights remain. The intensity of lighting is coded in six-bit digital numbers (DN) that range from 0 to 63. In order to simplify the analysis, for years with multiple satellites generating data, the DN values were averaged into one yearly DN value for each pixel. The DMSP OLS data can detect radiances down to the 5E-10 W cm-2sr-1 range, which means that the sensors are able to detect most types of bulbs used for external lightning, including faint light sources from rural areas [53]. However, there are several known issues with the data. These issues include signal saturation in urban areas due to six-bit quantization, overestimation of the actual size of lighting on the ground, and a lack of on-board calibration [38,52]. For each satellite year, we only map the occurrence of lit pixels (DN > 0) within each village location, and do no investigate changes in levels nor spatial changes, as issues of that kind are not affecting our results.
We apply relative radiometric rectification to the images based on the concept of pseudo-invariant features (PIFs) customized to NTL [54,55]. This is a regression-based calibration method that takes a reference region where lighting intensity has changed very little over time, and uses this region to standardize the datasets. This approach remains the most widely used calibration method for its simplicity and adaptability, and for this reason, it was selected for this application. Hall et al. [56] detail the procedure and calibration coefficients used for each image. Then, the calibration coefficients were applied globally to each satellite product. Then, the individual satellite products were averaged by year in order to create the final set of images used for analysis.
The Day/Night Band (DNB) of the Visible Infrared Imaging Radiometer Suite (VIIRS) carried by the Suomi National Polar-Orbiting Partnership (NPP) is the next generation in nighttime light data [57]. The VIIRS satellite was released in early 2013 by the NOAA-NGDC and gathers data on 22 channels, one of which is the DNB. The Earth Observation Group of the NOAA-NGDC has now made available two nighttime light composites from the DNB data collected on nights with zero moonlight during 18–26 April 2012 and 11–23 October 2012 [57,58]. The DNB is an improvement to the DMSP-OLS in many aspects, because it was specifically designed to measure solar and lunar reflection and both natural and anthropogenic nighttime light emissions, whereas the nighttime light data produced by the OLS was a by-product of its original intended use for cloud detection [59]. Its other important improvements are (a) reduced pixel saturation, (b) reduced overestimation of lighting, (c) better calibration and radiometric resolution, (d) collocation with multispectral measurements on VIIRS and other NPP sensors, and (e) increased spatial resolution and pixel-size variation [59]. The DNB has a dynamic range of up to 2E-10 W cm-2sr-1 and 14-bit quantization [57,58]. The wider range boosts the appearance of faint light sources, while the fine quantization ensures that bright pixels, such as those in city centers, do not saturate [59]. The NPP-VIIRS data has a spatial resolution of 742 m over the entire swath, meaning that images are equally sharp at the edge of the scan as they are at the nadir [60]. This is achieved by using “sub-pixel” detectors, which are aggregated in 32 different aggregation zones, with fewer detectors used farther away from the nadir [60]. The VIIRS-DNB has been preprocessed to select the high-quality, cloud-free data to include in the composite. The currently available composites have not been filtered to remove non-anthropogenic light sources such as fires, volcanoes, and background noise [57]. Besides, the NPP-VIIRS data employ onboard calibration, which is not available for the DMSP-OLS data [60]. Aside from these improvements, it is important to note that it is still a challenge to apply time-series analyses using NPP-VIIRS [60]. In previous studies, some scholars have employed NPP-VIIRS data to estimate the social economy, urban extent, and electric power consumption at the regional scale, and also demonstrate that NPP-VIIRS nightlight data probably provide higher capacity than that of DMSP-OLS imagery [61]. For example, Li et al. [62] employed NPP-VIIRS data to estimate gross regional products (GRP) in China and demonstrated that the data have a strong capacity to model regional economic indicators at the national scale.
For the present study, the 11–23 October 2012 VIIRS-DNB nighttime lights composite was used to cross-check and compare the detection rates with the DMSP-OLS imagery.
We examined a selection of 147 communities in Burkina Faso. This selection was taken from the World Gazetteer and contained projected populations for 2012 and the geographical coordinates of each community. Throughout the present research, the 2012 projected populations are used and referred to as population. The World Gazetteer list contained 200 communities; however, only 147 of those contained geo-referenced location information, and thus were the only communities used in this study. In addition, the locations were confirmed by importing coordinates into Google Earth and then visually checked to ensure that they coincided with inhabited areas.
The communities ranged in population from 7433 to 1,626,950 people. For each year over the period from 1992 to 2012, we determined which communities were detectable in the DMSP-OLS stable lights imagery. Communities were deemed as detectable if any cell within a three-by-three pixel neighborhood of its point location (centroid) was lighted. Any type of stable electric nighttime light is accounted for as a sign of human communities.
The same technique was used to determine which communities were detectable in the VIIRS-DNB nighttime light data for October 2012. The only difference is that a nine-by-nine pixel neighborhood was used in order to keep the search neighborhood areal size on the ground consistent with that used for the DMSP-OLS data. The reason for the larger neighborhood area used for VIIRS-DNB is the difference in resolution; thus, the size of the pixels from VIIRS-DNB is smaller than that of the DMSP-OLS pixels. Then, the results were compared to the DMSP-OLS detection rate for 2012.
Household-level data on electricity availability in 82 communities was obtained from the Minnesota Population Center Integrated Public Use Microdata Series [63], which assembles and standardizes census microdata from around the world. The data for Burkina Faso was obtained from the National Institute of Statistics and Demography and constituted a list of households as well as the community in which they were located and a Boolean for whether the household had access to electricity. The data available was for 2006. The household-level data was aggregated to the community level and compared to the DMSP-OLS detection rate to evaluate how electrification levels are reflected in the detection rate. Each community was geo-referenced and matched with the communities that were detected in the DMSP-OLS dataset; this information is reported in Table 1.

4. Results

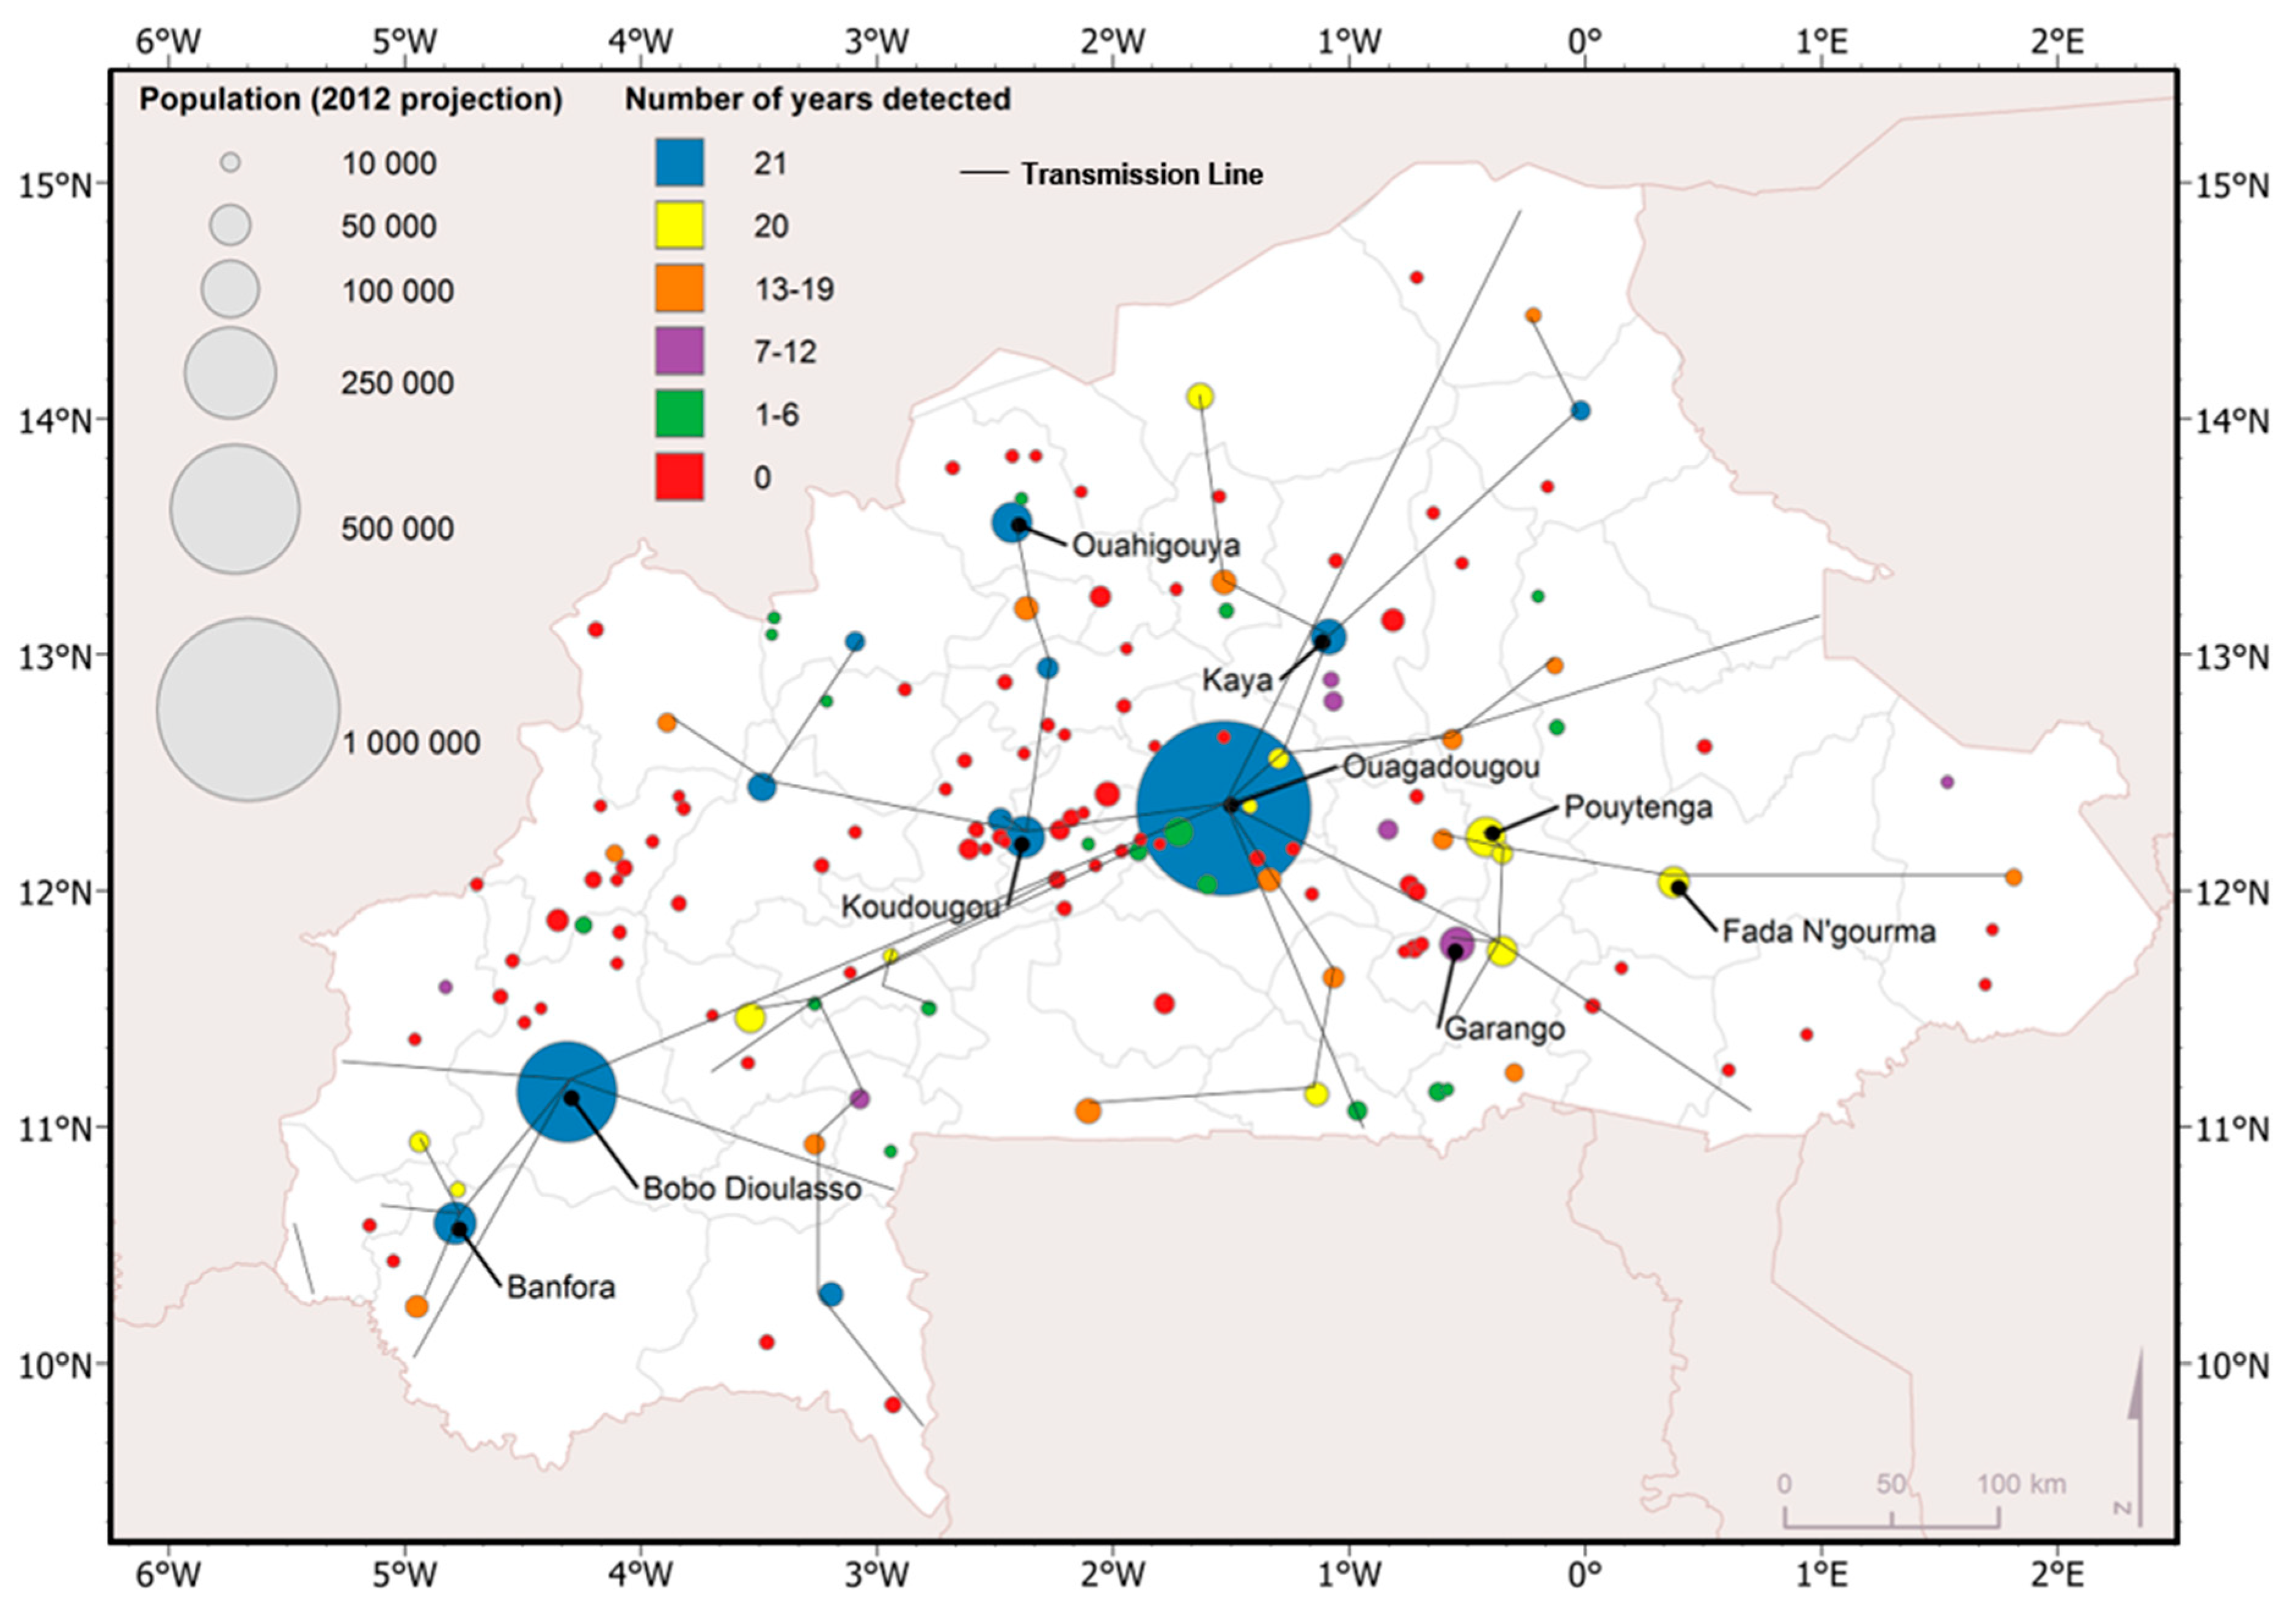
4.1. Detection of Communities using DMSP-OLS and VIIRS-DNB

The results of the investigation for DMSP-OLS are shown in Table 1. Only 12 out of the 147 communities were consistently detectable in the DMSP-OLS nighttime light imagery throughout the 21-year period. This included Burkina Faso’s capital and most populated city, Ouagadougou, which has a population of 1,626,950. In fact, the country’s five most populated cities were detected for all 21 years. Of the remaining communities within the top 10 most populated communities in Burkina Faso, only one other, Kaya—the country’s seventh most populated community—was detected throughout the 21-year period. Three communities, Pouytenga, Fada N’gourma, and Tenkodogo, the sixth, ninth, and 10th most populated communities respectively, were detected for 20 of the 21 years, missing only the lighting data in 1992. Garango, the country’s eighth most populated community, with a population of 63,527, fared the worst in terms of detection, as it was missing from the lighting data during nine years, between 1992 and 2000.
Apart from the six communities within the top 10 most populated communities, only six other communities were detected consistently for the 21-year period. These communities ranged in population from 19,680 to 42,542. A further 11 communities apart from those already mentioned were detected for 20 of the 21 years. All of these communities were only missing from the data during 1992. The overarching trend for communities that were detected only partially during the period was that they usually went undetected during the early part of the period, and then began to be detected consistently after that. In fact, communities that were detected during 13 to 19 years of the 21 years were consistently detected after 2000. It was only between 1992 and 1999 that these communities were missing from the data. In some of these cases, where communities suddenly began to be detected, it could be an indication that lighting only became available at that time. However, there also exist cases where communities were detected in some earlier years, then not in others, and then were again detected in subsequent years. This occurred with some communities in the 13–19-year category, but more consistently with those in the 1–6 and 7–12-year categories.
Eighty-three communities, or 57% of the 147 communities studied, went completely undetected for the entire 21-year period. In total, this accounted for 933,606 people, which was 20% of the total population of the 147 communities studied. In general, the undetected communities were those with the lowest populations. Of the 83 undetected communities, 58% had a population under 10,000. However, some communities that were never detected had substantial populations. For example, Kindi, with a population of 32,207, is the country’s 16th most populated community and the most populated community to be completely undetected in the DMSP-OLS imagery.
The highest rate of undetected communities occurred in 1992, followed by 1995, 1996, 1993, and 1994, in that order. In 1992, 92% of communities were not detected in the nighttime lights imagery. This decreased to 82% by 1996, 73% by 2002, and by 2012, the percentage of undetected communities was 60%.
The detection rates of DMSP-OLS data and the population of each of the 147 communities studied are mapped in Figure 2. Here, it can be seen that there is no clear spatial pattern for the communities that were detected or not detected in the DMSP-OLS data. That is to say, not one area of Burkina Faso contains an uncharacteristic proportion of the undetected communities. However, the map does make it clear that as communities decrease in population, their likelihood of being detected in the nighttime light imagery decreases. There is a clear pattern relating the network of transmission lines for electricity from the year 2009 to detected communities. The likelihood of detecting a community served by the transmission lines increases; however, there are still exceptions in the communities with 0–49,000 inhabitants.
Table 2 breaks down the detection rate of communities by population. Again, it can be seen that the communities with larger populations are detected during a higher percentage of years in the nighttime light imagery. Those communities with less than 10,000 inhabitants are highly unlikely to be detected, with an average detection rate of less than one year out of the 21-year period.
Using VIIRS-DNB data, 66 communities or 45% of the 147 communities studied were detected. This is compared to 40% (59 communities) for 2012 using the DMSP-OLS data. The VIIRS-DNB and DMSP-OLS data detected 56 communities consistently in 2012. The VIIRS-DNB data was able to detect 10 communities that were not detected by the DMSP-OLS data; however, it also did not detect three communities that were detected by the DMSP-OLS data. The VIIRS-DNB data was able to detect four communities with a population under 10,000 that were not detected by the DMSP-OLS data.

4.2. Access to Electricity and Rate of Detection

In total, 1.14% of the households included in the microdata had access to electricity in 2006. On average, 1.16% of the households in each community had access to electricity. Table 3 presents the average level of access to electricity per community within each of the detection rate categories used previously.

5. Discussion

While nighttime light imagery has been shown to correlate strongly with population and has been used to estimate and model the distribution of global population [22,24], this study clearly reveals new insights as to the limitations of the datasets. The DMSP-OLS dataset was only able to accurately detect (with a 100% detection rate over 21 years) approximately 9% of the 147 communities studied in Burkina Faso. The communities that were most accurately detected were those with the largest populations, while communities with populations below 10,000 were generally undetected. Therefore, it is evident that in Burkina Faso, the detection of human settlement becomes more difficult as the population of the settlement decreases. This could be due to a number of reasons. First, it is possible that the DMSP-OLS sensor was unable to detect the low levels of radiation emitted by communities with a low population density. Second, it is likely that many communities were undetected due to low levels of electrification in Burkina Faso. Furthermore, it is possible that even in those communities that do have access to electricity, most of it is dedicated to indoor lighting or other activities using electricity such as water pumps, which would not be detected in the nighttime light imagery.
However, the study does reveal that detection rates have increased over time in Burkina Faso. In 1992, only 8% of communities were detected in the nighttime light imagery, while by 2012, 40% of the communities were detected. This corresponds to a detection rate of 66% of the population of the 147 communities studied in 1992 and a detection rate of 79% in 2012. This increase in detection over time could be explained by two reasons. Firstly, the processing of the nighttime light imagery has improved, and the algorithms used are now better at detecting areas of low lighting and low population. Secondly, these communities were not electrified early in the 21-year period, and over time, electrification has increased. Electrification has, in fact, increased over time in Burkina Faso; however, compared to global rates, it remains very low. In 1992, the World Bank estimated that 6.1% of households in Burkina Faso were electrified. This figure had increased to 13.1% by 2012. It can be seen that the detection rate and the level of access to electricity appear to be unrelated. Access to electricity is generally low, but there is no relationship that indicates that communities that are more often detected have higher levels of access to electricity. This finding seems counter intuitive, as one would expect that communities with lower levels of electricity would have lower lighting intensities and would therefore be more difficult to detect.
The 2012 detection rates by DMSP-OLS and VIIRS-DNB nighttime light data were quite consistent. While the VIIRS-DNB data was able to detect some additional communities, it did not provide a very large improvement over the DMSP-OLS dataset. This may provide evidence that it is a lack of electrification (or electrification at intensities that can be picked up by both the DMSP-OLS and VIIRS sensors) that leads to communities being undetected by the nighttime light datasets and not an issue with the processing of the datasets. However, it should be highlighted that the results can be seen as preliminary with a possible future expansion by using a VIIRS-DNB dataset with a longer time period.
Previous studies have also attempted to quantify the population detection level of the nighttime light imagery. Doll [64] found that in sub-Saharan Africa, up to 60% of the population was undetected at population densities of 2000 people/km2, and that on average, 20% of the population was undetected at the same population density. Doll and Pachauri [35] found that in Africa, the percentage of unlit pixels remains high for increasing levels of population density. Both of the mentioned studies were built on global population density grids. This study contributes to and expands on the findings from those studies by identifying specific communities that are undetected in the nighttime light imagery as well as the time period of their detection rather than relying on population density estimations. The present study expands earlier findings by relating the detection rate to household data regarding the access to electricity and the location of the community in relation to the transmission line network for electricity. The results indicate that communities that are more often detected have higher levels of access to electricity.
It should also be noted that there exist clusters of nighttime light that appear to be communities, but that do not correspond to any community in the list used. This could reflect one of the 53 communities from the original list of 200 communities, which did not contain coordinates, or they could reflect other communities not contained on the list at all.

6. Conclusions

The use of the DMSP-OLS nighttime light dataset for social science applications has increased substantially over time and is becoming an often-used proxy for economic development and population in places with poor statistical data. With the recent availability of VIIRS-DNB nighttime light data and the improvements in data quality and spatial resolution that they afford, scholars have become increasingly interested in the continued use of nighttime light data in socio-economic research. For this reason, it is important that the accuracy of the both the DMSP-OLS and VIIRS-DNB datasets for identifying human settlement is understood and taken into account when conducting research.
This study examined the DMSP-OLS nighttime light stable lights composites from 1992 to 2012 to determine their ability to detect communities in Burkina Faso. It found that up to 57% of the communities studied were undetectable throughout the period and that only 9% of communities studied had a 100% detection rate. Interestingly, detection improved over the years, reflecting either improved OLS sensors and image processing or increasing electrification. The examination of VIIRS-DNB nighttime light data for October 2012 revealed that the VIIRS-DNB data were not much better at detecting communities. In fact, the VIIRS-DNB detection rate was only 5% higher than that of DMSP-OLS for 2012.
The similarities in detection between the DMSP-OLS and VIIRS-DNB nighttime light datasets reveal that the improvements that are said to come along with the new generation of light detection satellites do not have a significant impact for small communities in Burkina Faso. Further tests in other countries and regions could be beneficial in developing a better understanding of the ability of nighttime light datasets to detect human settlements throughout the world. Nonetheless, the findings of this study are important because they illustrate the limitations of the nighttime light datasets, at the very least in areas where access to electricity is limited. These findings should be taken into account when using the DMSP-OLS and VIIRS nighttime light data as proxies for human settlement because significant portions of the population may be unrepresented by these datasets.

Author Contributions

Magnus Andersson and Ola Hall conceived, designed the study, and contributed to the analysis of the data. Maria Francisca Archila collected and processed the data and performed the analysis. Magnus Andersson collected data, made maps, and wrote the paper. All authors reviewed and edited the draft, approved the submitted manuscript, and agreed to be listed and accepted the version for publication.

Funding

This research received no external funding.

Conflicts of Interest

The authors declare no conflict of interest.

References

  1. Keola, S.; Andersson, M.; Hall, O. Monitoring economic development from space: Using nighttime light and land cover data to measure economic growth. World Dev. 2015, 66, 322–334. [Google Scholar] [CrossRef]
  2. Gallup, J.L.; Sachs, J.D.; Mellinger, A.D. Geography and Economic Development. Int. Reg. Sci. Rev. 1999, 22, 179–232. [Google Scholar] [CrossRef]
  3. Maddison, A. Monitoring the World Economy, 1820–1992; Organization for Economic Cooperation and Development: Paris, France, 1995. [Google Scholar]
  4. Barro, R.J. Economic growth in a cross-section of countries. Q. J. Econ. 1991, 106, 407–443. [Google Scholar] [CrossRef]
  5. Nordhaus, W.D. Geography and marcoeconomics: New data and new findings. Proc. Natl. Acad. Sci. USA 2006, 103, 3510–3517. [Google Scholar] [CrossRef] [PubMed]
  6. Henderson, J.V.; Storeygard, A.; Weil, D.N. Measuring economic growth from outer space. Am. Econ. Rev. 2012, 102, 994–1028. [Google Scholar] [CrossRef]
  7. Johnson, S.; Larson, W.; Papageorgiou, C.; Subramanian, A. Is newer better? Penn World Table Revisions and their impact on growth estimates. J. Monet. Econ. 2013, 60, 255–274. [Google Scholar] [CrossRef] [Green Version]
  8. Ravallion, M.; Chen, S. When Economic Reform is Faster than Statistical Reform: Measuring and Explaining Income Inequality in Rural China. Oxf. Bull. Econ. Stat. 1999, 61, 33–56. [Google Scholar] [CrossRef]
  9. Hall, O. Remote sensing in social science research. Open Remote Sens. J. 2010, 3, 1–16. [Google Scholar] [CrossRef]
  10. Chuhan-Pole, P.; Dabalen, A.L.; Land, B.C. Mining in Africa: Are Local Communities Better Off? World Bank Publications: Washington, DC, USA, 2017. [Google Scholar]
  11. World Gazetteer. 2015. Available online: https://apps.gis.ucla.edu/geodata/dataset/world_gazetteer/resource/0fcd1a90-8fe3-4e05-92de6cad419e69c0 (accessed on 6 March 2017).
  12. Chen, X.; Nordhaus, W.D. Using luminosity data as a proxy for economic statistics. Proc. Natl. Acad. Sci. USA 2011, 108, 8589–8594. [Google Scholar] [CrossRef] [Green Version]
  13. Levin, N.; Duke, Y. High spatial resolution night-time light images for demographic and socio-economic studies. Remote Sens. Environ. 2012, 119, 1–10. [Google Scholar] [CrossRef]
  14. Croft, T.A. Nighttime images of the earth from space. Sci. Am. 1978, 239, 86–98. [Google Scholar] [CrossRef]
  15. Elvidge, C.D.; Baugh, K.E.; Kihn, E.A.; Kroehl, H.W.; Davis, E.R.; Davis, C.W. Relation between satellite observed visible-near infrared emissions, population, economic activity and electric power consumption. Int. J. Remote Sens. 1997, 18, 1373–1379. [Google Scholar] [CrossRef]
  16. Doll, C.N.H.; Muller, J.-P.; Morley, J.G. Mapping regional economic activity from night-time light satellite imagery. Ecol. Econ. 2006, 57, 75–92. [Google Scholar] [CrossRef]
  17. Ghosh, T.; Powell, R.L.; Elvidge, C.D.; Baugh, K.E.; Sutton, P.C.; Anderson, S. Shedding light on the global distribution of economic activity. Open Geogr. J. 2010, 3, 148–161. [Google Scholar]
  18. Mellander, C.; Lobo, J.; Stolarick, K.; Matheson, Z. Night-time light data: A good proxy measure for economic activity? PLoS ONE 2015, 10, e0139779. [Google Scholar] [CrossRef]
  19. Lessman, C.; Seidel, A. Regional Inequality, Convergence, and Its Determinants: A View from Outer Space. Eur. Econ. Rev. 2017, 92, 110–132. [Google Scholar] [CrossRef]
  20. Wu, R.; Yang, D.; Dong, J.; Zhang, L.; Xia, F. Regional Inequality in China Based on NPP-VIIRS Night-Time Light Imagery. Remote Sens. 2018, 10, 240. [Google Scholar] [CrossRef]
  21. Sutton, P.; Roberts, D.; Elvidge, C.D.; Melj, H. A comparison of nighttime satellite imagery and population density for the continental United States. Photogramm. Eng. Remote Sens. 1997, 63, 1303–1313. [Google Scholar]
  22. Sutton, P.; Roberts, D.; Elvidge, C.D.; Bauch, K. Census from heaven: An estimate of the global human population using night-time satellite imagery. Int. J. Remote Sens. 2001, 22, 3061–3076. [Google Scholar] [CrossRef]
  23. Pozzi, F.; Small, C.; Yetman, G. Modeling the distribution of human population with night-time satellite imagery and gridded population of the world. In Proceedings of the Pecora 15/Land Satellite Information IV/ISPRS Commission I/FIEOS 2002 Conference, Denver, CO, USA, 10–15 November 2002. [Google Scholar]
  24. Bustos, M.F.A.; Hall, O.; Andersson, M. Nighttime lights and population changes in Europe 1992–2012. AMBIO 2015, 44, 653–665. [Google Scholar] [CrossRef]
  25. Lu, H.; Zhang, M.; Sun, W.; Li, W. Expansion analysis of yangtze river delta urban agglomeration using dmsp/ols nighttime light imagery for 1993 to 2012. ISPRS Int. J. Geo-Inf. 2018, 7, 52. [Google Scholar] [CrossRef]
  26. Henderson, M.; Yeh, E.T.; Gong, P.; Elvidge, C.D.; Baugh, K.E. Validation of urban boundaries derived from global night-time satellite imagery. Int. J. Remote Sens. 2003, 24, 595–609. [Google Scholar] [CrossRef]
  27. Wang, L.; Li, W.; Wang, P.; Liu, X.; Yang, F.; Qu, J.J. Spatiotemporal characterization of the urban sprawl and its impacts on urban island in China with DMSP/OLS and MODIS measurements. Theor. Appl. Climatol. 2019, 138, 293–303. [Google Scholar] [CrossRef]
  28. Elvidge, C.D.; Cinzano, P.; Pettit, D.R.; Arvesen, J.; Sutton, P.; Small, C.; Nemani, R.; Longcore, T.; Rich, C.; Safran, J.; et al. The Nightsat Mission Concept. Int. J. Remote Sens. 2007, 28, 2645–2670. [Google Scholar] [CrossRef]
  29. Kloog, I.; Haim, A.; Stevens, R.G.; Barchana, M.; Portnov, B.A. Light at night co-distributes with incident breast but not lung cancer in the female population of Israel. Chronobiol. Int. 2008, 25, 65–81. [Google Scholar] [CrossRef]
  30. Bharti, N.; Tatem, A.J.; Ferrari, M.J.; Grais, R.F.; Djibo, A.; Grenfell, B.T. Explaining seasonal fluctuations of measles in Niger using nighttime lights imagery. Science 2011, 9, 1424–1427. [Google Scholar] [CrossRef]
  31. Agnew, J.; Gillespie, T.W.; Gonzalez, J.; Min, B. Baghdad nights: Evaluating the US military ‘surge’ using nighttime light signatures. Environ. Plan. A 2008, 40, 2285–2295. [Google Scholar] [CrossRef]
  32. Witmer, F.D.W.; O’Loughlin, J. Detecting the effects of wars in the Caucasus regions of Russia and Georgia using radiometrically normalized DMSP-OLS nighttime lights imagery. GISci. Remote Sens. 2011, 48, 478–500. [Google Scholar] [CrossRef]
  33. Moor, A.M.; Alegana, V.A.; Gething, P.W.; Tatem, A.J.; Snow, R.W. Using remotely sensed night-time light as a proxy for poverty in Africa. Popul. Health Metr. 2008, 6, 5. [Google Scholar]
  34. Elvidge, C.D.; Sutton, P.C.; Ghosh, T.; Tuttle, B.T.; Baugh, K.E.; Bhaduri, B.; Bright, E. A global poverty map derived from satellite data. Comput. Geosci. 2009, 35, 1652–1660. [Google Scholar] [CrossRef]
  35. Doll, C.N.H.; Pachauri, S. Estimating rural population without access to electricity in developing countries through night-time light satellite imagery. Energy Policy 2010, 38, 5661–5670. [Google Scholar] [CrossRef]
  36. Ebener, S.; Murray, C.; Tandon, A.; Elvidge, C.C. From wealth to health: Modelling the distribution of income per capita at the sub-national level using night-time light imagery. Int. J. Health Geogr. 2005, 4, 5. [Google Scholar] [CrossRef] [PubMed]
  37. Sutton, P.C.; Costanza, R. Global estimates of market and non-market values derived. Ecol. Econ. 2002, 41, 509–527. [Google Scholar] [CrossRef]
  38. Sutton, P.C.; Taylor, M.J.; Anderson, S.; Elvidge, C.D. Sociodemographic characterization of urban areas using nighttime imagery, Google Earth, Landsat, and “social” ground truthing. In Urban Remote Sensing; CRC Press: Boca Raton, FL, USA, 2007; pp. 291–310. [Google Scholar]
  39. Zhou, D.; Zhao, S.; Zhang, L.; Sun, G.; Liu, Y. The footprint of urban heat island effect in China. Sci. Rep. 2015, 5, 11160. [Google Scholar] [CrossRef] [PubMed]
  40. Doll, C.H.; Muller, J.P.; Elvidge, C.D. Night-time imagery as a tool for global mapping of socioeconomic parameters and greenhouse gas emissions. AMBIO 2000, 29, 157–163. [Google Scholar] [CrossRef]
  41. Weidmann, N.B.; Schutte, S. Using night light emissions for the prediction of local wealth. J. Peace Res. 2017, 54, 125–140. [Google Scholar] [CrossRef]
  42. Levin, N.; Zhang, Q. A global analysis of factors controlling VIIRS nighttime light levels from densely populated areas. Remote Sens. Environ. 2017, 190, 366–382. [Google Scholar] [CrossRef] [Green Version]
  43. Bennett, M.M.; Smith, L.C. Advances in using multitemporal night-time lights satellite imagery to detect, estimate, and monitor socioeconomic dynamics. Remote Sens. Environ. 2017, 192, 176–197. [Google Scholar] [CrossRef]
  44. Jean, N.; Burke, M.; Xie, M.; Davis, W.M.; Lobell, D.B.; Ermon, S. Combining satellite imagery and machine learning to predict poverty. Science 2016, 353, 790–794. [Google Scholar] [CrossRef] [Green Version]
  45. Bruederle, A.; Hodler, R. Nighttime lights as a proxy for human development at the local level. PLoS ONE 2018, 13, e0202231. [Google Scholar] [CrossRef]
  46. Tanaka, K.; Keola, S. Shedding light on the shadow economy: A nighttime light approach. J. Dev. Stud. 2017, 53, 32–48. [Google Scholar] [CrossRef]
  47. African Development Fund. Electrification Project for Semi-Urban Arears of Ouagadougou and Bobo Dioulasso. 2016. Available online: https://www.afdb.org/fileadmin/uploads/afdb/Documents/Project-and-Operations/Burkina_Faso_-Approved-_AR_-Electrification_project_for_semi-urban_arears_of_Ouagadougou_and_Bobo_Dioulasso.pdf (accessed on 14 April 2018).
  48. Eberhard, A.; Rosnes, O.; Shkaratan, M.; Vennemo, H. Africa’s Power Infrastructure; The World Bank: Washington, DC, USA, 2011. [Google Scholar]
  49. Elvidge, C.D.; Milesi, C.; Dietz, J.B.; Tuttle, B.T.; Sutton, P.C.; Nemani, R.; Vogelmann, J.E. US constructed area approaches the size of Ohio. Eos Trans. Am. Geophys. Union 2004, 85, 233. [Google Scholar] [CrossRef]
  50. Baugh, K.E.; Elvidge, C.D.; Ghosh, T.; Ziskin, D. Population detection profiles of DMSP-OLS night-time imagery by regions of the world. In Proceedings of the 30th Asia-Pacific Advanced Network Meeting, Hanoi, Vietnam, 9–13 August 2010. [Google Scholar]
  51. Ma, X.; Tong, X.; Liu, S.; Ma, Z.; Zheng, S. An Improved Index for Desaturation of DMSP Nighttime Light Data. In Proceedings of the IGARSS 2018—2018 IEEE International Geoscience and Remote Sensing Symposium, Valencia, Spain, 22–27 July 2018; IEEE: Piscataway, NJ, USA, 2018. [Google Scholar]
  52. Elvidge, C.D.; Hsu, F.C.; Baugh, K.E.; Ghosh, T. National trends in satellite observed lighting: 1992–2012. In Global Urban Monitoring and Assessment Through Earth Observation; Weng, Q., Ed.; CRC Press: Boca Raton, FL, USA, 2013. [Google Scholar]
  53. Schott, J.R.; Salvaggio, C.; Volchok, W.J. Radiometric scene normalization using pseudoinvariant features. Remote Sens. Environ. 1988, 26, 1–16. [Google Scholar] [CrossRef]
  54. Elvidge, C.; Ziskin, D.; Baugh, K.; Tuttle, B.; Ghosh, T.; Pack, D.; Erwin, E.; Zhizhin, M. A fifteen year record of global natural gas flaring derived from satellite data. Energies 2009, 2, 595–622. [Google Scholar] [CrossRef]
  55. Elvidge, C.D.; Hsu, F.-C.; Baugh, K.E.; Ghosh, T. National trends in satellite-observed lighting. Glob. Urban Monit. Assess. Earth Obs. 2014, 23, 97–118. [Google Scholar]
  56. Hall, O.; Bustos, M.A.; Boke Olén, N.; Niedomysl, T. Population Centroids of the World Administrative Units from NighttimeLights 1992–2013. Sci. Data 2019, 6, 235. [Google Scholar] [CrossRef] [PubMed]
  57. Shi, K.; Yu, B.; Huang, Y.; Hu, Y.; Yin, B.; Chen, Z.; Chen, L.; Wu, J. Evaluating the ability of NPP_VIIRS nighttime light data to estimate the Gross Domestic Product and the electric power consumption of China at multiple scales: A comparison with DMSP-OLS data. Remote Sens. 2014, 6, 1705–1724. [Google Scholar] [CrossRef]
  58. Baugh, K.; Hsu, F.C.; Elvidge, C.; Zhizhin, M. Nighttime light compositing using the VIIRS Day-Night Band: Preliminary results. Proc. Asia-Pac. Adv. Netw. 2013, 35, 70–86. [Google Scholar] [CrossRef]
  59. Lee, T.E.; Miller, S.D.; Turk, F.J.; Schueler, C.; Julian, R.; Deyo, S.; Dills, P.; Wang, S. The NPOESS VIIRS Day/Night visible sensor. Bull. Am. Meteorol. Soc. 2006, 87, 191–199. [Google Scholar] [CrossRef]
  60. Ma, T.; Zhou, Y.; Wang, Y.; Zhou, C.; Haynie, S.; Xu, T. Diverse relationships between Suomi-NPP VIIRS night-time light and multi-scale socioeconomic activity. Remote Sens. Lett. 2014, 5, 652–661. [Google Scholar] [CrossRef]
  61. Ma, T.; Zhou, C.; Pei, T.; Haynie, S.; Fan, J. Responses of Suomi-NPP VIIRS-derived nighttime lights to socioeconomic activity in China’s cities. Remote Sens. Lett. 2014, 5, 165–174. [Google Scholar] [CrossRef]
  62. Li, X.; Xu, H.; Chen, X.; Li, C. Potential of NPP-VIIRS nighttime light imagery for modeling the regional economy of China. Remote Sens. 2013, 5, 3057–3081. [Google Scholar] [CrossRef]
  63. Minnesota Population Center. Integrated Public Use Microdata Series; International: Version 7.0 Burkina Faso; IPUMS: Minneapolis, MN, USA, 2018. [Google Scholar]
  64. Doll, C.N.H. Development of a 2009 stable lights product using DMSP-OLS. In Proceedings of the 30th Asia-Pacific Advanced Network Meeting, Hanoi, Vietnam, 9–13 August 2010. [Google Scholar]
Figure 1. Reference map of study area: Burkina Faso.
Ijgi 08 00498 g001
Figure 2. Detection rates of DMSP-OLS nighttime light data, population of communities, and the network of transmission lines in Burkina Faso.
Ijgi 08 00498 g002
Table 1. Detection rate of communities in Burkina Faso in Defense Meteorological Satellite Program Operational Linescan System (DMSP-OLS) nighttime lights data.
Detection RateCommunities Detected
YearsPercentageCountPercentageAverage Population
21100%129%222,679
2095%129%33,418
13–1962%–91%1510%21,743
7–1233%–57%75%21,891
1–65%–29%1812%13,852
00%8357%11,248
Table 2. Detection rate of communities in Burkina Faso in DMSP-OLS nighttime light data by population.
Communities Detected
PopulationAverage Detection Rate (%)CountPercentage
0–99993%5940%
10,000–24,99928%6242%
25,000–49,00069%1712%
50,000–499,99993%75%
500,000+100%21%
Table 3. Access to electricity of communities in Burkina Faso by detection rate in DMSP-OLS nighttime light data.
Detection RateElectrification
YearsPercentageElectrified
Households
Total Number
Households
Percentage ElectrifiedAverage Electrified per Community
21100%3875970.50%0.68%
2095%5738521.48%1.23%
13–1962%–91%5599800.55%0.64%
7–1233%–57%9648351.99%2.14%
1–65%–29%10392631.11%1.22%
00%33323,7191.49%1.26%

