Article

Assessing the Distribution of Heavy Industrial Heat Sources in India between 2012 and 2018

1
State Key Laboratory of Remote Sensing Science, Institute of Remote Sensing and Digital Earth, Chinese Academy of Sciences, Beijing 100101, China
2
Remote Sensing and Digital Earth, Chinese Academy of Sciences, Beijing 100094, China
3
Sanya Institute of Remote Sensing, Sanya 572029, China
*
Author to whom correspondence should be addressed.
ISPRS Int. J. Geo-Inf. 2019, 8(12), 568; https://0-doi-org.brum.beds.ac.uk/10.3390/ijgi8120568
Submission received: 28 October 2019 / Revised: 28 November 2019 / Accepted: 8 December 2019 / Published: 10 December 2019
(This article belongs to the Special Issue Geo-Informatics in Resource Management)

Abstract

:
The heavy industry in India has witnessed rapid development in the past decades. This has increased the pressures and load on the Indian environment, and has also had a great impact on the world economy. In this study, the Preparatory Project Visible Infrared Imaging Radiometer (NPP VIIRS) 375-m active fire product (VNP14IMG) and night-time light (NTL) data were used to study the spatiotemporal patterns of heavy industrial development in India. We employed an improved adaptive K-means algorithm to realize the spatial segmentation of long-term VNP14IMG data and artificial heat-source objects. Next, the initial heavy industry heat sources were distinguished from normal heat sources using a threshold recognition model. Finally, the maximum night-time light data were used to delineate the final heavy industry heat sources. The results suggest, that this modified method is a much more accurate and effective way of monitoring heavy industrial heat sources, and the accuracy of this detection model was higher than 92.7%. The number of main findings were concluded from the study: (1) the heavy industry heat sources are mainly concentrated in the north-east Assam state, east-central Jharkhand state, north Chhattisgarh and Odisha states, and the coastal areas of Gujarat and Maharashtra. Many heavy industrial heat sources were also found around a line from Kolkata on the Eastern Indian Ocean to Mumbai on the Western Indian Ocean. (2) The number of working heavy industry heat sources (NWH) and, particularly, the total number of fire hotspots for each working heavy industry heat source area (NFHWH) are continuing to increase in India. These trends mirror those for the Gross Domestic Product (GDP) and total population of India between 2012 and 2017. (3) The largest values of NWH and NFHWH were in Jharkhand, Chhattisgarh, and Odisha whereas the smallest negative values, the S l o p e _ N W H in Jharkhand and Chhattisgarh were also the two largest values in the whole country. The smallest negative values of S l o p e _ N W H and S l o p e _ N F H W H were in Haryana. The S l o p e _ N F H W H in the mainland Gujarat had the second most negative value, while the value of the S l o p e _ N W H was the third-highest positive value.

1. Introduction

Over the few past decades, India has become one of the world’s fastest-growing major economies and is now considered a newly industrialized country [1]. The amount of heavy industry, which is an important component of basic industry and provides technical equipment, power, and raw materials for all sectors of the national economy, has also soared in India [2]. This industry effectively supports the economic development of the country. However, this growth has been accompanied by a large increase in greenhouse gas emissions and other air pollutants from heavy industrial production [3]. Therefore, real-time maps of the layout of heavy industrial development are becoming important for studies of Indian economic development and air pollution issues [2,4].
Many scholars and nonprofit organizations or institutions have focused their attention on the global distribution of one or more energy types or industries. The British Petroleum (BP) company [5] and the International Energy Agency (IEA) [6] provide regular, annual reports of energy (coal, oil, gas, etc.) prospects. The Global Power Emissions Database (GPED) [7] was formed from individual power-generating units for 2010 [3]. In addition, the India Coal-Fired Power Plant Database (ICPD) [8] is also available for India. These databases include a large amount of information that can be used for mining and strategic development in India. However, traditional statistical methods usually involve a lot of human error; in addition, the real-time distribution of heavy industry in India is not available.
Satellite images, which can be considered to be objective, true data, have become the most effective way to monitor the dynamics of Land-Cover (LC) and Land-Use (LU) (also referred to as LULC) [9,10]. Heat sources, such as the combustion of fossil fuels in cement plants and steelworks and the flaring of petroleum gas in oil fields [2,11], are also vital for most heavy industries. Therefore, thermal anomaly products derived from remote sensing data provide new ways of revealing the objective and real-time distribution of heavy industry in India. Recently, it has been widely and well-used in the detection of global-scale self-ignition fire point data [12,13,14,15,16]. Also, the night-time thermal anomaly product from the National Polar-orbiting Operational Environmental Satellite System (NPOESS) Preparatory Project (NPP) Visible Infrared Imaging Radiometer (VIIRS) has been successfully applied in studies of volcanic activity [17] and oil exploitation [18]. NPP VIIRS night-time fire data (resolution 750 m) were used to identify industrial heat sources considering their time, space, and temperature information [11,19]. Also, better active global fire-points product named NPP VIIRS active fire product (VNP14IMG), with 375-m resolution and covering day- and night-time thermal anomaly, was provided by Schroeder et al. [20] and Giglio et al. [21]. It effectively provided an improved response for fires with small areas. Then, Ma et al. [2] proposed a heavy industry heat source detection model based on an improved adaptive K-means algorithm using long-term VNP14IMG data. This produced good results for mainland China; however, due to the complexity of the Indian geographical coverage, the precision was not so good when this was applied to India.
In addition, large and heavy equipment and facilities (such as heavy equipment, large machine tools and large buildings) are also important characteristics of heavy industry. So, the use of lighting is also common and necessary in those areas. Night-time light (NTL) data, especially the VIIRS day/night band (DNB) data, can provide the day and night distribution of lights for the whole world [22,23]. Therefore, in this study, NTL data were used to modify Ma’s model [2]. The new heavy industry heat source detection model for revealing spatiotemporal patterns in and the development of heavy industry in India based on an improved adaptive K-means using VNP14IMG and NTL was then developed. As part of this study, VNP14IMG and NTL data were acquired and preprocessed. We adopted an improved adaptive K-means algorithm using long-term VNP14IMG data to construct heat-source objects. Then, many hot features, including geometric, statistical, and heat source attribute features, were extracted for each heat-source object. In addition, the initial heavy industry heat sources were discriminated from other heat-source objects using a threshold recognition model based on hot features. Finally, maximum night-time light data were used to delineate the final heavy industry heat sources.
The remainder of this article is organized as follows. Section 2 describes the study area, data sources, main data preprocessing steps, and methodology. Section 3 shows the experimental results that were obtained using the VNP14IMG and NTL data and discusses and assesses the distribution of heavy industrial heat sources in India. Conclusions are drawn in Section 4, and recommendations for future research are given.

2. Materials and Methods

2.1. Study Area

India is a country in South Asia, lying to the north of the equator between 6°44′ N and 35°30′ N and 68°7′ E and 97°25′ E. It is surrounded by the Indian Ocean, the Arabian Sea, and the Bay of Bengal. Since market-based economic reforms began in 1991, India has emerged as a global player with one of the fastest-growing major economies and is now considered a newly industrialized country [24]. It is also the world’s second-most populous country (with more than 1.3 billion people) as well as being the most populous democracy in the world. India is a federal republic governed under a parliamentary system and comprises 29 states and seven union territories, giving a total of 36 entities (as shown in Figure 1). It should be noted, however, that Jammu and Kashmir state, marked by the red dashed line, lies within the disputed Kashmir region.

2.2. Data Sources

2.2.1. VIIRS Active Fire/hotspot Data

In this study, the VNP14IMG data were selected as input data for the evaluation of the distribution of heavy industrial heat sources in India. This product is based on reprocessed nominal-resolution Collection 1 data from the NASA Land Science Investigator Processing System (Land-SIPS) [20]. Using the MOD14/MYD14 algorithm, several modifications were implemented to accommodate the unique characteristics associated with the VIIRS 375-m data [25]. The newly improved 375-m data, compared to the traditional coarser-resolution (≥ v1 km) fire products, provide a greater response for fires that cover relatively small areas and improved mapping of large fire perimeters. So, it is well suited to support fire management as well as to meet other scientific applications’ needs. VNP14IMG data (19 January 2012 to now) can be freely obtained from the Fire Information for Resource Management System (FIRMS) [26]. Three million nine hundred ninety-eight thousand four hundred sixty-five observed Indian fire hotspots, ranging from 19 January 2012 to 31 December 2018, were used in this paper, and their spatial density is shown in Figure 2.
VIIRS Nightfire product (VNF), using Day/Night Band (DNB), near-infrared (M7 and M8), short-wave infrared (M10), and mid-wave infrared (M12 and M13) to detect subpixel heat sources, has been used in gas [27] and industrial heat sources detection [11]. So, VNF data were downloaded from the Earth’s Observation Group (EOG) [26]. Their spatial distribution maps from VNF data and VNP14IMG data were made to compare in the study area (Figure 3) on 01/01/2018. It showed that VNP14IMG data were quite abundant in India. The fire/hotspot number of VNP14IMG was more tban five times than VNF. Its spatial distribution range was also bigger than the VNF data. So, VNP14IMG data were used lastly to detect heavy industries.

2.2.2. NPP−VIIRS Night-time Light Data

NPP−VIIRS night-time light (NTL) data were also used in this study. Compared with the Defense Meteorological Satellite Program/Operational Linescan System (DMSP/OLS) data, the night-time light data had a higher spatial resolution (15 arc-seconds, about 750 m) and a wider radiometric detection range [22,27]. These data can be obtained from NOAA’s National Centers for Environmental Information (NOAA/NCEI) website [28]. However, as it is a preliminary product, these data are not filtered to remove detected light associated with gas flares, fires, volcanoes, or aurorae, and the dataset has not been processed to remove background noise [29]. In addition, the VIIRS annual night-time light data are being discontinued by NOAA, and only annual data from 2015 and 2016 are supported [30]. Therefore, the ‘Flint’ annual data were also obtained from the Chinese Academy of Sciences [31]. These data are not affected by fires, volcanoes, and background noise as they have been through statistical cleaning and average noise reduction preprocessing. Therefore, these annual products can be considered as the surface light, and ‘Flint’ version Beta 1 [32] was used in this study. This ‘Flint’ imagery consists of 15 arc-second grids, spanning the range −180 to 180 degrees longitude and from −65 to 75 degrees latitude. The digital pixel numbers (DN) range from 0–255. The ‘Flint’ India light data for India in 2018 is shown below as Figure 4.

2.2.3. Auxiliary Data

Indian national, state, and taluk boundaries were acquired from the Global Administrative Areas (GADM) provided by the Center for Spatial Sciences at the University of California, Davis [33]. The latest version (version 3.6, released on 6 May 2018) was used. The coordinate reference system based on the WGS84 datum was adopted for the boundary files. In order to support the verification of heavy industry heat sources in India, high-resolution images from Google Earth were also utilized in this paper.

2.3. Data Preprocessing

The size of the long-term time series of active fire/hotspot data was huge, and the ‘Flint’ data consisted of global data; therefore, some preprocessing work was necessary for this study. In order to obtain information about heavy industry heat sources in India, the VNP14IMG and NTL data were processed, as shown below (Figure 5). This processing consisted of two main parts: data preprocessing and a heavy industry heat source detection model.

2.3.1. NPP-VIIRS Active Fire/Hotspot Data Preprocessing

For the same reason in a previous paper [2], the long-term time series of VNP14IMG products was also needed to be divided. It was almost impossible to divide one area of heavy industry into two or more administrative taluks in India. So, according to the taluk-level administrative boundaries, the 3,998,465 fire hotspots were then divided according to the taluk-level administrative boundaries.

2.3.2. Preprocessing of NPP-VIIRS Night-time Light Data

For most heavy industrial production activities, the use of lighting is also necessary. Therefore, superimposed light data can be used to verify industrial heat sources and filter out false ones. Also, due to economic problems or policy decisions, including regional plans and environmental protection policies, only a small fraction of large, heavy enterprises worked continuously between 2012 and 2018: most enterprises operated for only a few years or months. Thus, some preprocessing of the data was needed. The main processing step was as follows.
Step 1: The annual and global ‘Flint’ night-time light data were clipped according to the Indian national boundary to obtain annual Indian ‘Flint’ night-time light data.
Step 2: The annual Indian ‘Flint’ night-time light data were re-sampled from 750m to 375 m in order to maintain the same spatial resolution as the NP14IMG products.
Step 3: Maximum night-time light data were produced by selecting the maximum value from the annual Indian night-time light data for 2012 to 2018.

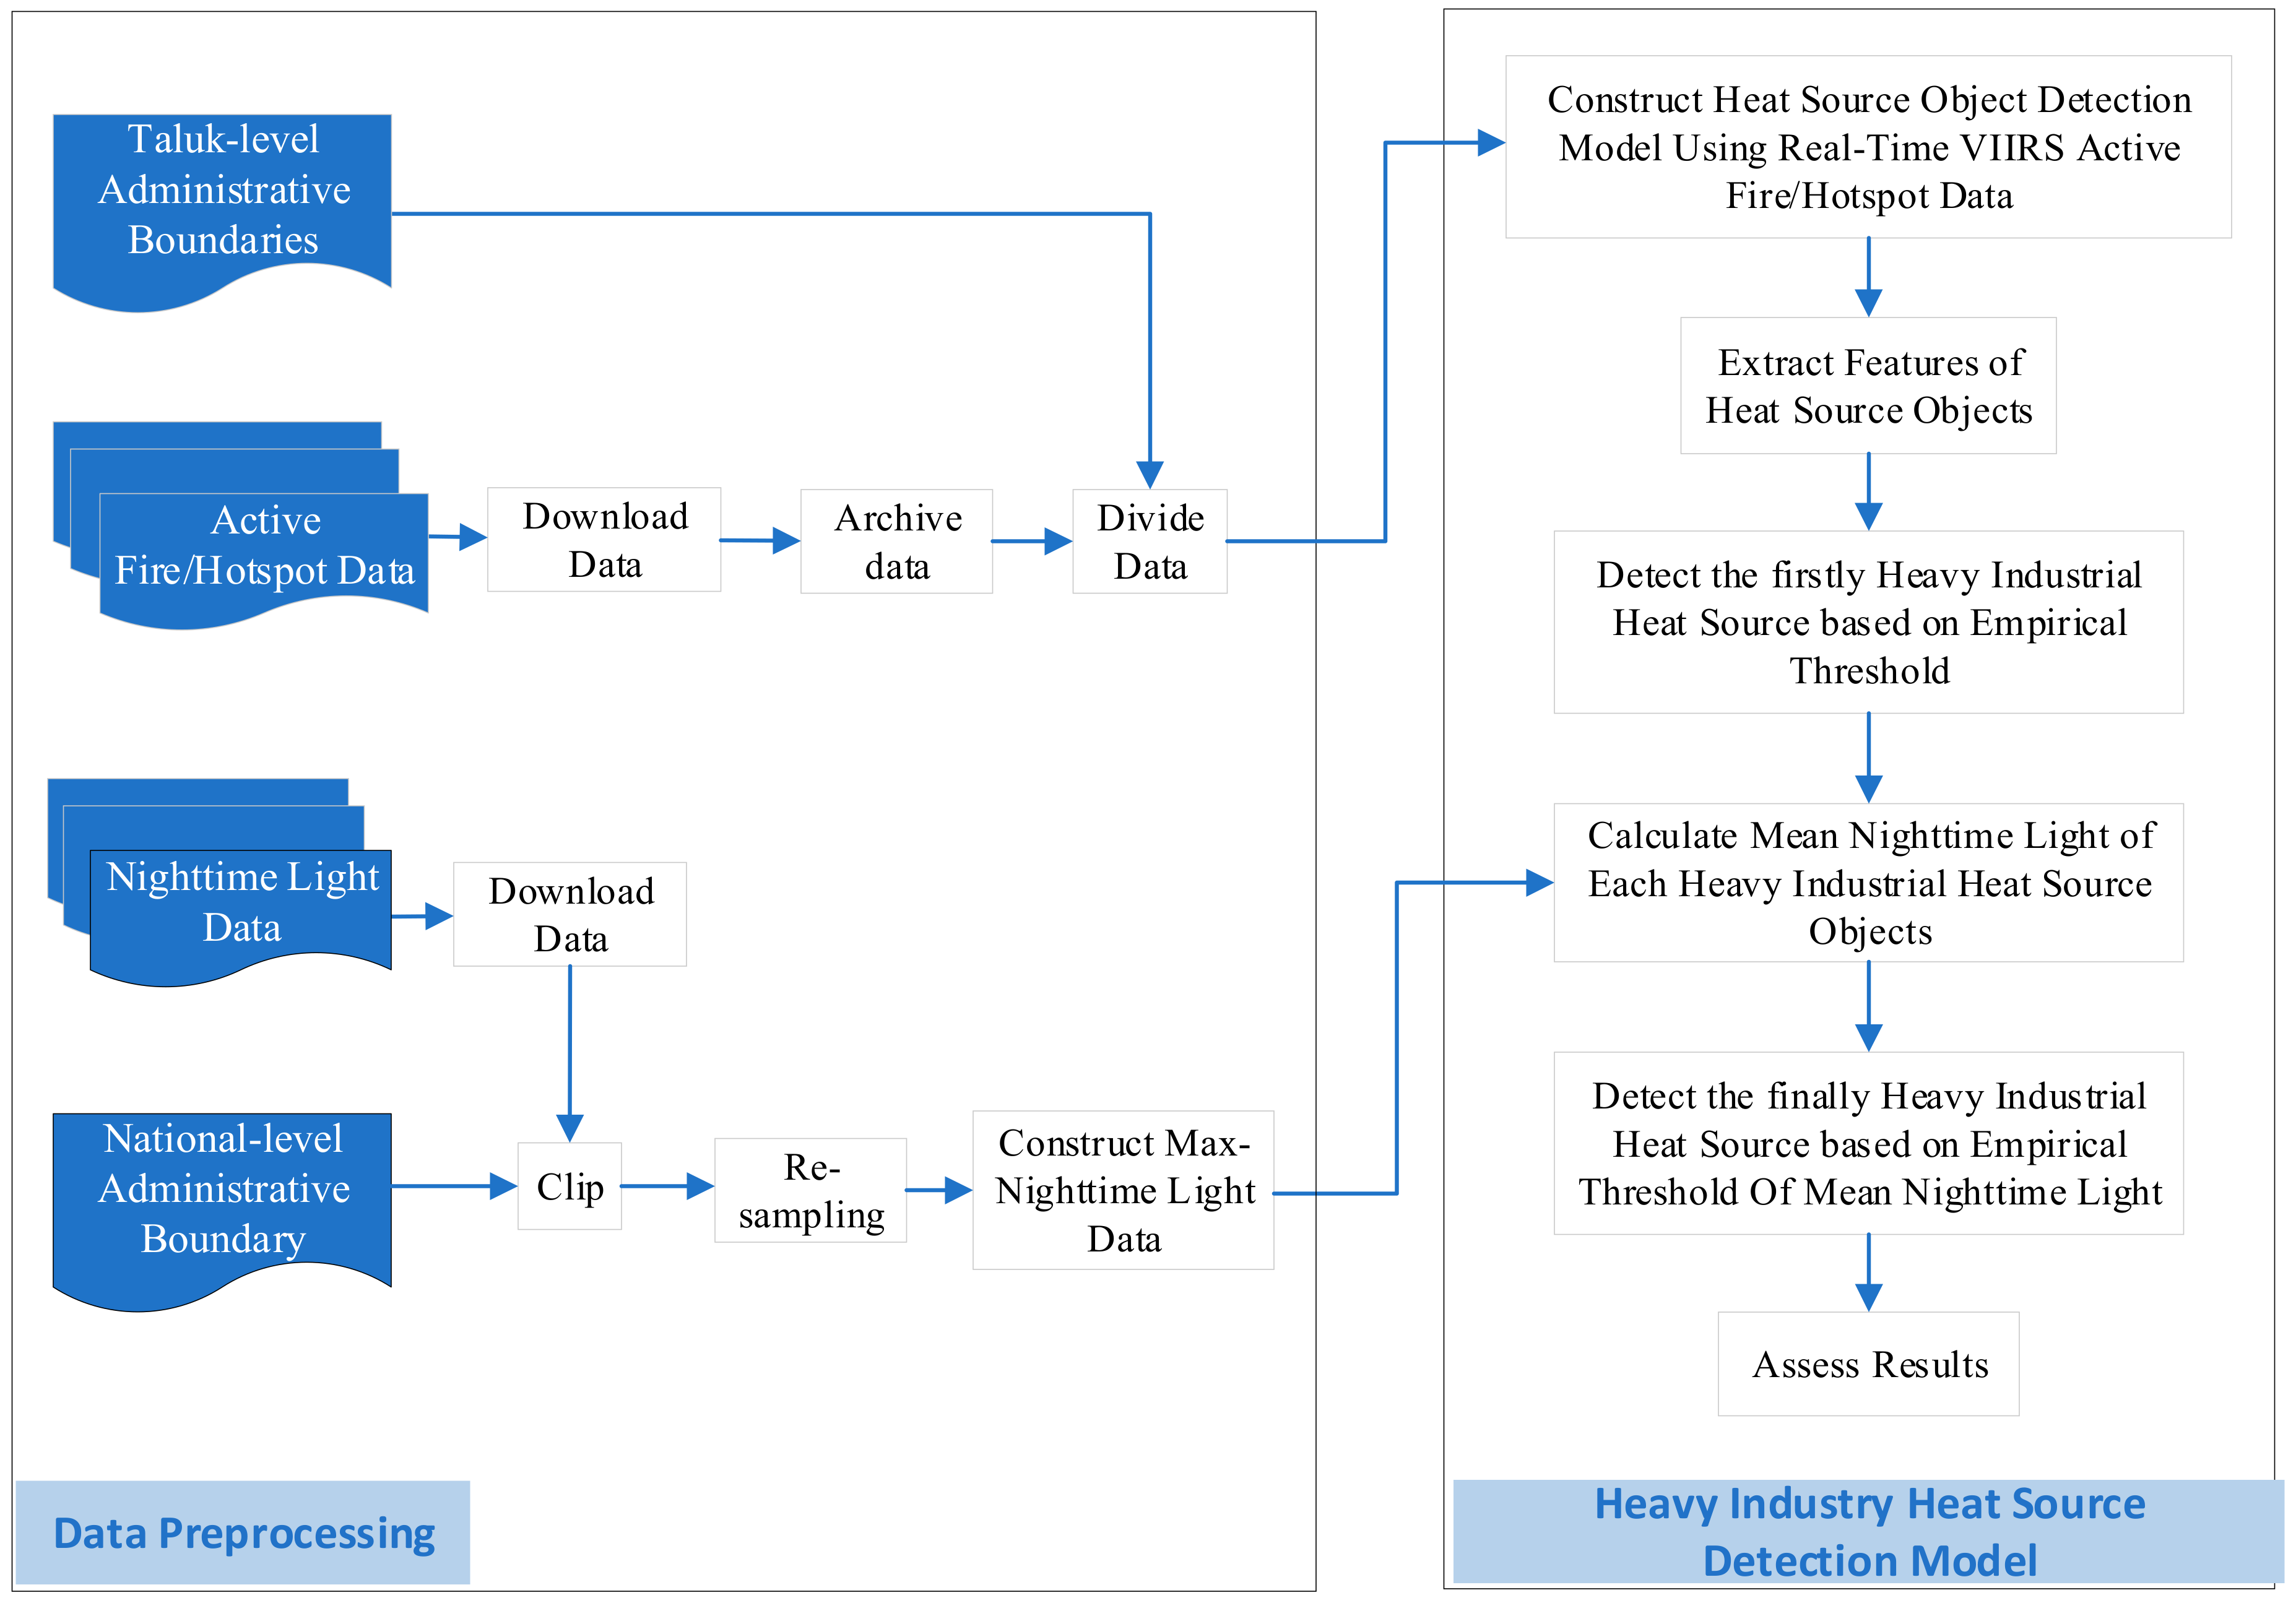
2.4. Heavy Industry Heat Source Detection Model

In this study, we propose an Indian heavy industry heat source detection model that uses VNP14IMG and NTL data. This model consists of six parts: constructing the heat source object detection model using real-time VNP14IMG data, extracting the hot features of the heat source objects, detecting the initial heavy industrial heat sources based on an empirical threshold, calculating the mean night-time light value for each heavy industrial heat source object, detecting the final heavy industrial heat sources based on the empirical threshold for the mean night-time light, and, finally, assessing the results. Details of the model are described in this section.
Step 1: Static and persistent industrial heat sources in the VNP14IMG time series were found to be concentrated around the hot centers due to the stability of their positions and temporal consistency. The heat source object detection model that used long-order VNP14IMG data based on an improved adaptive K-means algorithm was then implemented [2].
Step 2: Extraction of the hot features of heat source objects. In this study, geometric, statistical, and heat source attribute features were used. The central point of the heat source, as well as the width and the height of the max-circumscribed rectangle, were used as the geometric features. For the statistical feature extraction, the number of fires/hotspots, the density of fires/hotspots per unit area, the initial and final detection times of the heat source object, and the mean and variance of the time interval sorted by date were adopted. For the heat source attributes, the minimum, maximum, mean, and variance attribute information of the VIIRS I-4 band brightness temperature (bright_ti4), the I-5 band brightness temperature (bright_ti4), scan direction pixel size (scan), track direction pixel size (track), and fire point radiation Power (FRP) were extracted for each heat source object.
Step 3: Heavy industrial heat source objects are static and persistent, whereas biomass fires are usually sparsely distributed. The initial heavy industrial heat source identification was based on an empirical threshold [2]. Subsequently, the initial heavy industry heat sources were identified from heat-source objects.
Step 4: Once the initial vector data of the initial heavy industry heat sources had been registered to the raster data of the max night-time light data using the same WGS84 projection, the mean night-time light value was calculated for each initial heavy industrial heat source object.
Step 5: The final detection of the heavy industry heat sources was carried out by applying the empirical threshold algorithm to the mean night-time light data.
Step 6: Assessment of results. The number of working heavy industry heat sources (NWH), the total number of fire hotspots for each working heavy industry heat source area (NFHWH), as well as S l o p e _ N W H and S l o p e _ N F H W H [2], were used to analyze the distribution of the heavy industry heat sources in different statistical areas for different years.

3. Results and Discussion

3.1. Heavy Industrial Heat Source Distribution Characteristics at the National Level

The spatial distribution of 711 heavy industrial heat sources in Indian regions (Figure 6) revealed that heavy industrial heat sources were mainly concentrated in north-east Assam, east-central Jharkhand, the north of Chhattisgarh and Odisha, and coastal areas of Gujarat and Maharashtra. Another interesting phenomenon was that a large number of heavy industrial heat was found lying close to a line between Kolkata on the Eastern Indian Ocean and Mumbai on the Western Indian Ocean. The spatial distribution of the 711 heavy industrial heat sources across India was not the same as that shown by the spatial density distribution image for the 3,998,465 fire hotspots (Figure 2), especially in the case of Punjab and Madhya Pradesh. Further investigation revealed that most of the fire hotspots in Punjab and Madhya Pradesh were due to burning straw, especially in May, October, and November. Additionally, heavy industrial heat sources founded in regions 1, 2, and 3 were mainly connected to petroleum development, whereas in region 4, they were linked to coal mining and steel production. And, each heavy industrial heat source detected were verified using Google Earth Map one by one. Six hundred fifty-nine heat sources can be easily confirmed as heavy industrial factories by Google Earth images. The type of the other 52 results cannot be curtained due to the lack of more field measured data. So, the accuracy of this detection model was higher than 92.7%. As the database of real heavy industrial heat sources has not been obtained, the recall ration can be calculated.
Recent changes in working heavy industry heat sources were compared, and the values of the NWH and NFHWH for each year during the period 2012 to 2018 were calculated (Figure 7). The values of NWH, and in particular, the NFHWH increased during this period. The trends in GDP and total population in India (Figure 8) between 2012 and 2017 were similar [24], demonstrating that heavy industries developed along with the development of the Indian economy as a whole.
High-resolution images from Google Earth (Figure 9) were selected to verify the results of the model. Figure 9a,b are images of steel plants in Jharkhand and West Bengal. The two open-pit minefields shown in Figure 9c,d are located in Jharkhand and Chhattisgarh. Figure 9e–h,j all show facilities related to oil and gas production, processing, and storage in Andhra Pradesh, Gujarat, Rajasthan and Assam, respectively. Figure 9i is an image of cement work named Gagal in Himachal Pradesh.

3.2. Characteristics of Heavy Industrial Heat Source Distribution at the State Level

The heavy industrial heat source characteristics for the 36 states and administrative regions of India were analyzed using the NWH and NFHWH values. The boundaries of the administrative divisions of these states contained land regions only, meaning that no NWH and NFHWH values for sources at sea were included.
Figure 10a shows the NWH for the states with the 20 highest values. These included Jharkhand, Chhattisgarh, and Odisha, followed by Gujarat and West Bengal. Furthermore, the NWH in Jharkhand state accounted for nearly 13.8% of the total for Indian mainland sources. The sum of the NWH in Jharkhand, Chhattisgarh, Odisha, and Gujarat accounted for 43.38% of the total; the total NWH for the top 20 states accounted for 98.37%. In addition, the NWH for Jharkhand, which is one of the richest mineral zones in the world and boasts 40% and 29% of India’s mineral and coal reserves, respectively, increased continuously during the period 2012 to 2018 [34]. Chhattisgarh’s heavy industry also developed due to its rich natural resources, policy incentives, and good infrastructure [35].
The NFHWH values indicate that there has been a reduction in the total amount of heavy industrial production in the administrative areas studied (Figure 10b). The largest number of fire hotspots was in Jharkhand, the same as the NWH shown in Figure 10a. However, the order of the five highest NFHWH values in 2018 was different: the order was now, Jharkhand, Odisha, Chhattisgarh, West Bengal, and then Gujarat. Moreover, the average NFHWH in Jharkhand between 2012 and 2018 accounted for nearly 29.05% of the Indian mainland total; the total NWH in Jharkhand, Odisha, and Chhattisgarh accounted for 58.36%; and the total NWH for the top 20 states accounted for 99.78%. In addition, NFHWH values in most states increased continuously after 2012, in line with India’s economic development.
The distributions of S l o p e _ N W H and S l o p e _ N F H W H values were mapped to illustrate the changing trends for each statistical area during the seven-year period studied (Figure 11). The largest positive value of S l o p e _ N W H was in Jharkhand, followed by Chhattisgarh and Gujarat, indicating that the number of heavy industry heat sources in these three states increased quickly. The smallest negative S l o p e _ N W H value was found in Haryana, followed by Tripura and Andhra Pradesh. However, these negative values were all very small −0.49, −0.23, and −0.14, respectively. This means that the downward trends here were very slow. In addition, for 18 of the large states in mainland India, the values were positive and only four states had negative S l o p e _ N W H values. Therefore, it can be concluded that the total number of heavy industry heat sources in India increased, as confirmed by Figure 7.
The S l o p e _ N F H W H values are displayed in Figure 10b. These values reflect the scale of production associated with working heavy industry heat sources. The largest positive value of S l o p e _ N F H W H was the value for Odisha, followed by Chhattisgarh and Jharkhand. The S l o p e _ N F H W H value in Odisha was 1452.63 (the corresponding value of S l o p e _ N W H was only 1.11), which was double the value in Chhattisgarh. This means that the average scale of working heavy industry heat sources in Odisha increased. The smallest negative S l o p e _ N W H values were found in Haryana, followed by Gujarat and Arunachal Pradesh, showing that S l o p e _ N F H W H in Gujarat was the second most negative whereas it S l o p e _ N W H value was the third highest positive value. This shows that the average scale of the working heavy industry heat sources in this state was declining. It should be noted that this trend related only to the heavy industry heat sources in mainland Gujarat. In addition, there were 19 large states on the Indian mainland for which the S l o p e _ N F H W H values were positive and only nine states with negative values. It can be concluded that, overall, the scale of heavy industry heat sources in all of India increased, as supported by the details shown in Figure 6.
The distribution of heavy industry heat sources was then mapped to examine the heat source characteristics for the 36 state administrative regions of India in 2018 (Figure 12). The NWH values for 2018 (Figure 12a) indicate that Jharkhand, Chhattisgarh, and Odisha have relatively large numbers of heavy enterprises, with Gujarat following. In terms of NFHWH values (Figure 12b), Chhattisgarh is followed by Jharkhand and Odisha. In addition, both NWH and NFHWH values are highest in east-central India, followed by central India; in contrast, most of the northwest and south of the country have a small number of heavy industry heat sources and fire hotspots caused by heavy enterprises.

4. Conclusions

India has now emerged as a global player with one of the fastest-growing major economies and is considered a newly industrialized country. Its heavy industry has grown rapidly in the past few decades. This has exacerbated pressures on the Indian environment and has also had a great impact on the world economy. The NASA’s Land-SIPS VIIRS 375-m active fire product (VNP14IMG) and NPP-VIIRS night-time light data (NTL) can objectively reveal the spatiotemporal patterns of heavy industrial development in the study area. We, therefore, proposed a heavy industry heat source detection model that uses VNP14IMG and NTL. The spatial distribution and trends for heavy industry heat sources were analyzed for India at the national and state levels. The results suggest that the model is an accurate and effective means of monitoring heat sources produced by heavy industry. The accuracy of this detection model was higher than 92.7%. The following conclusions can be drawn from this study.
(1)
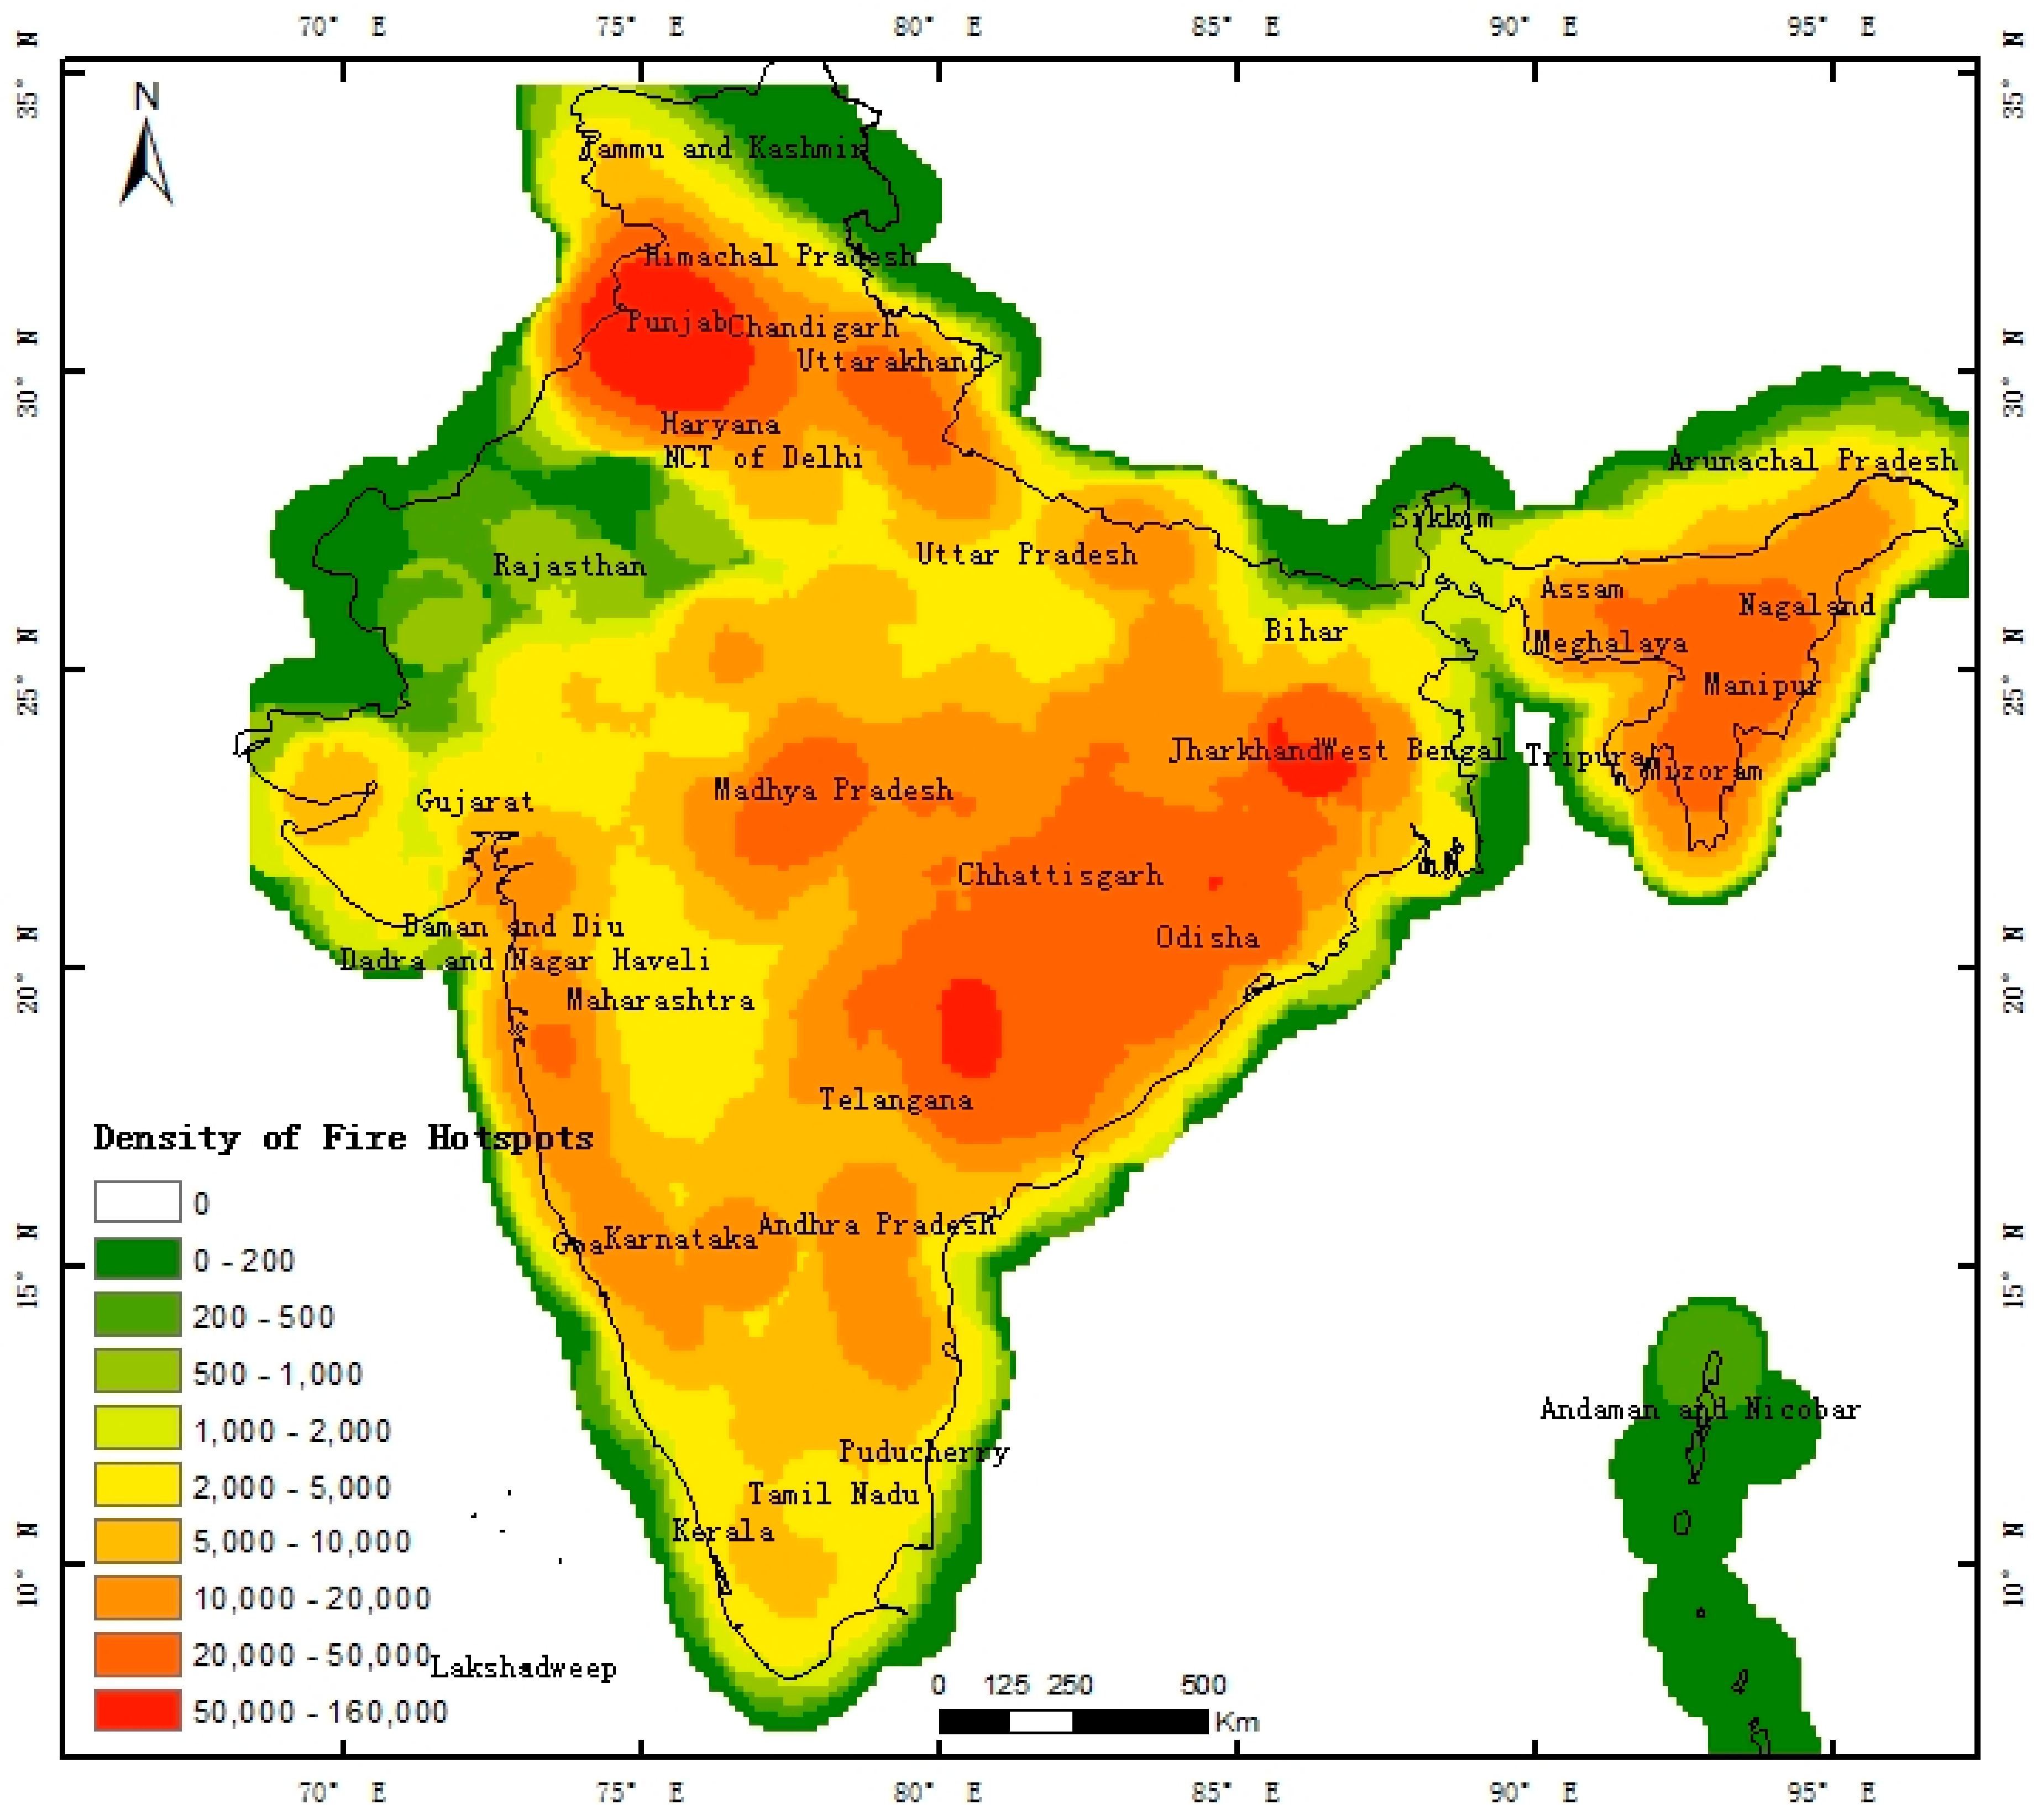
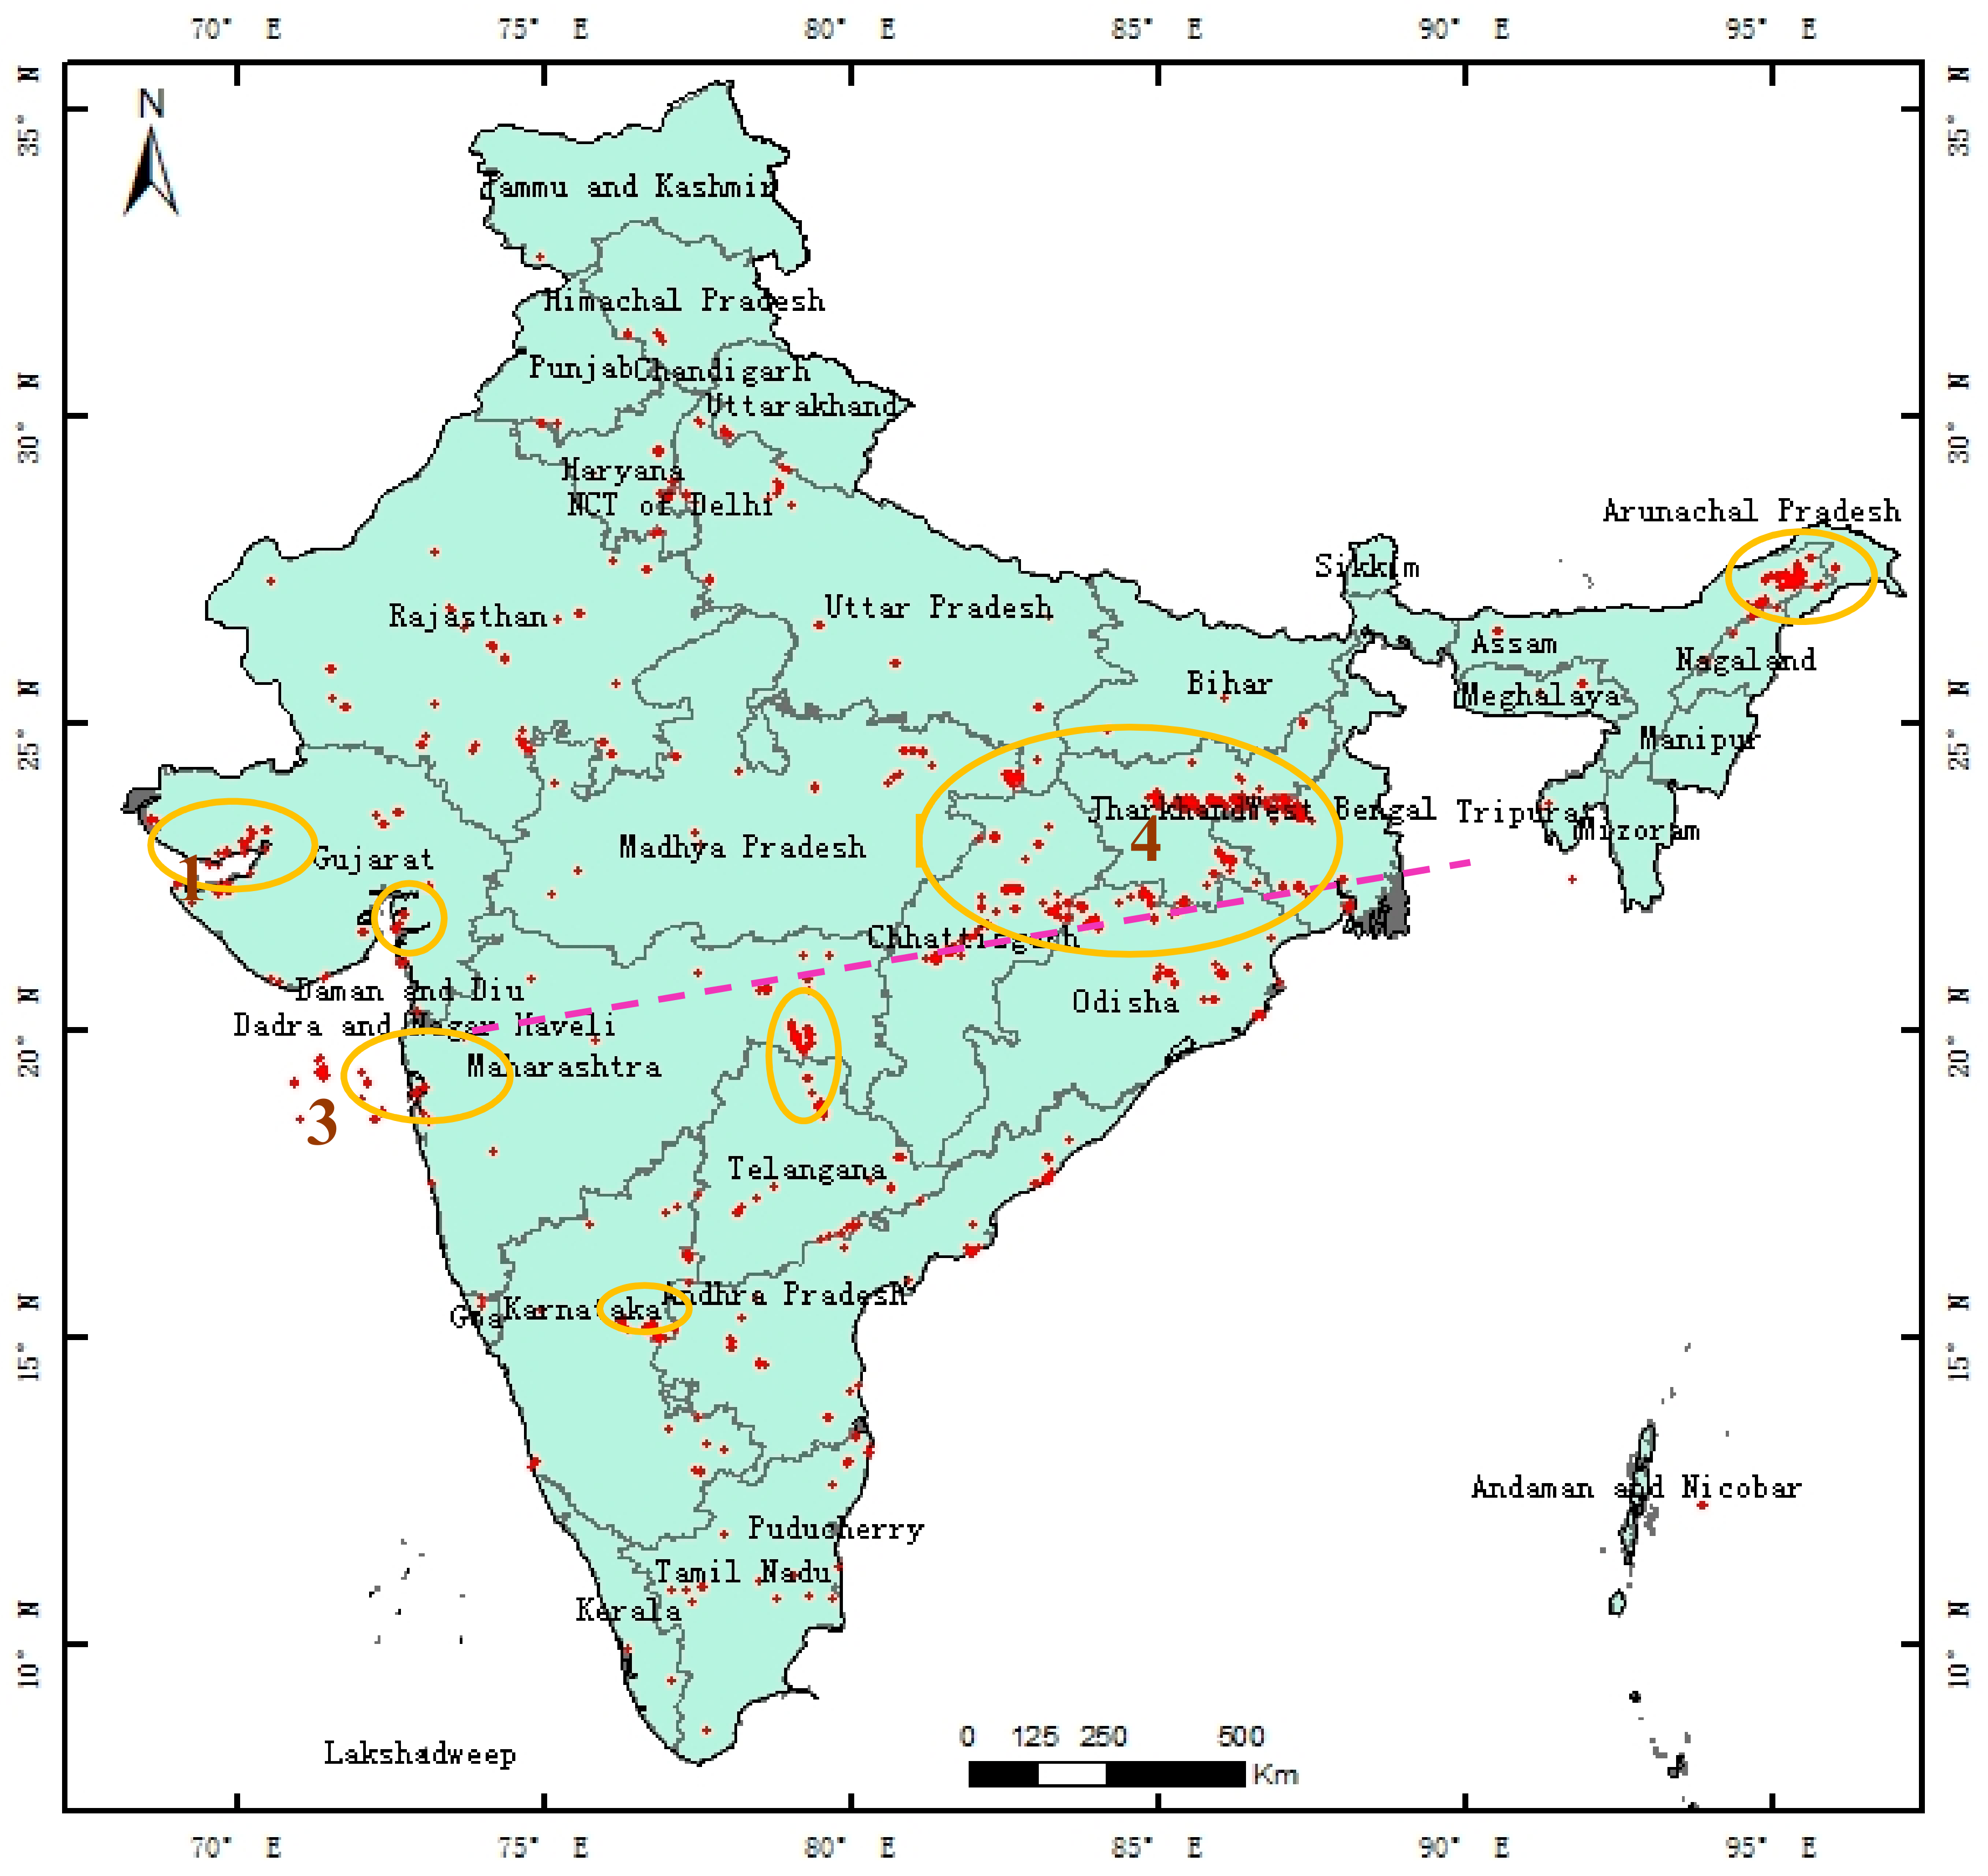
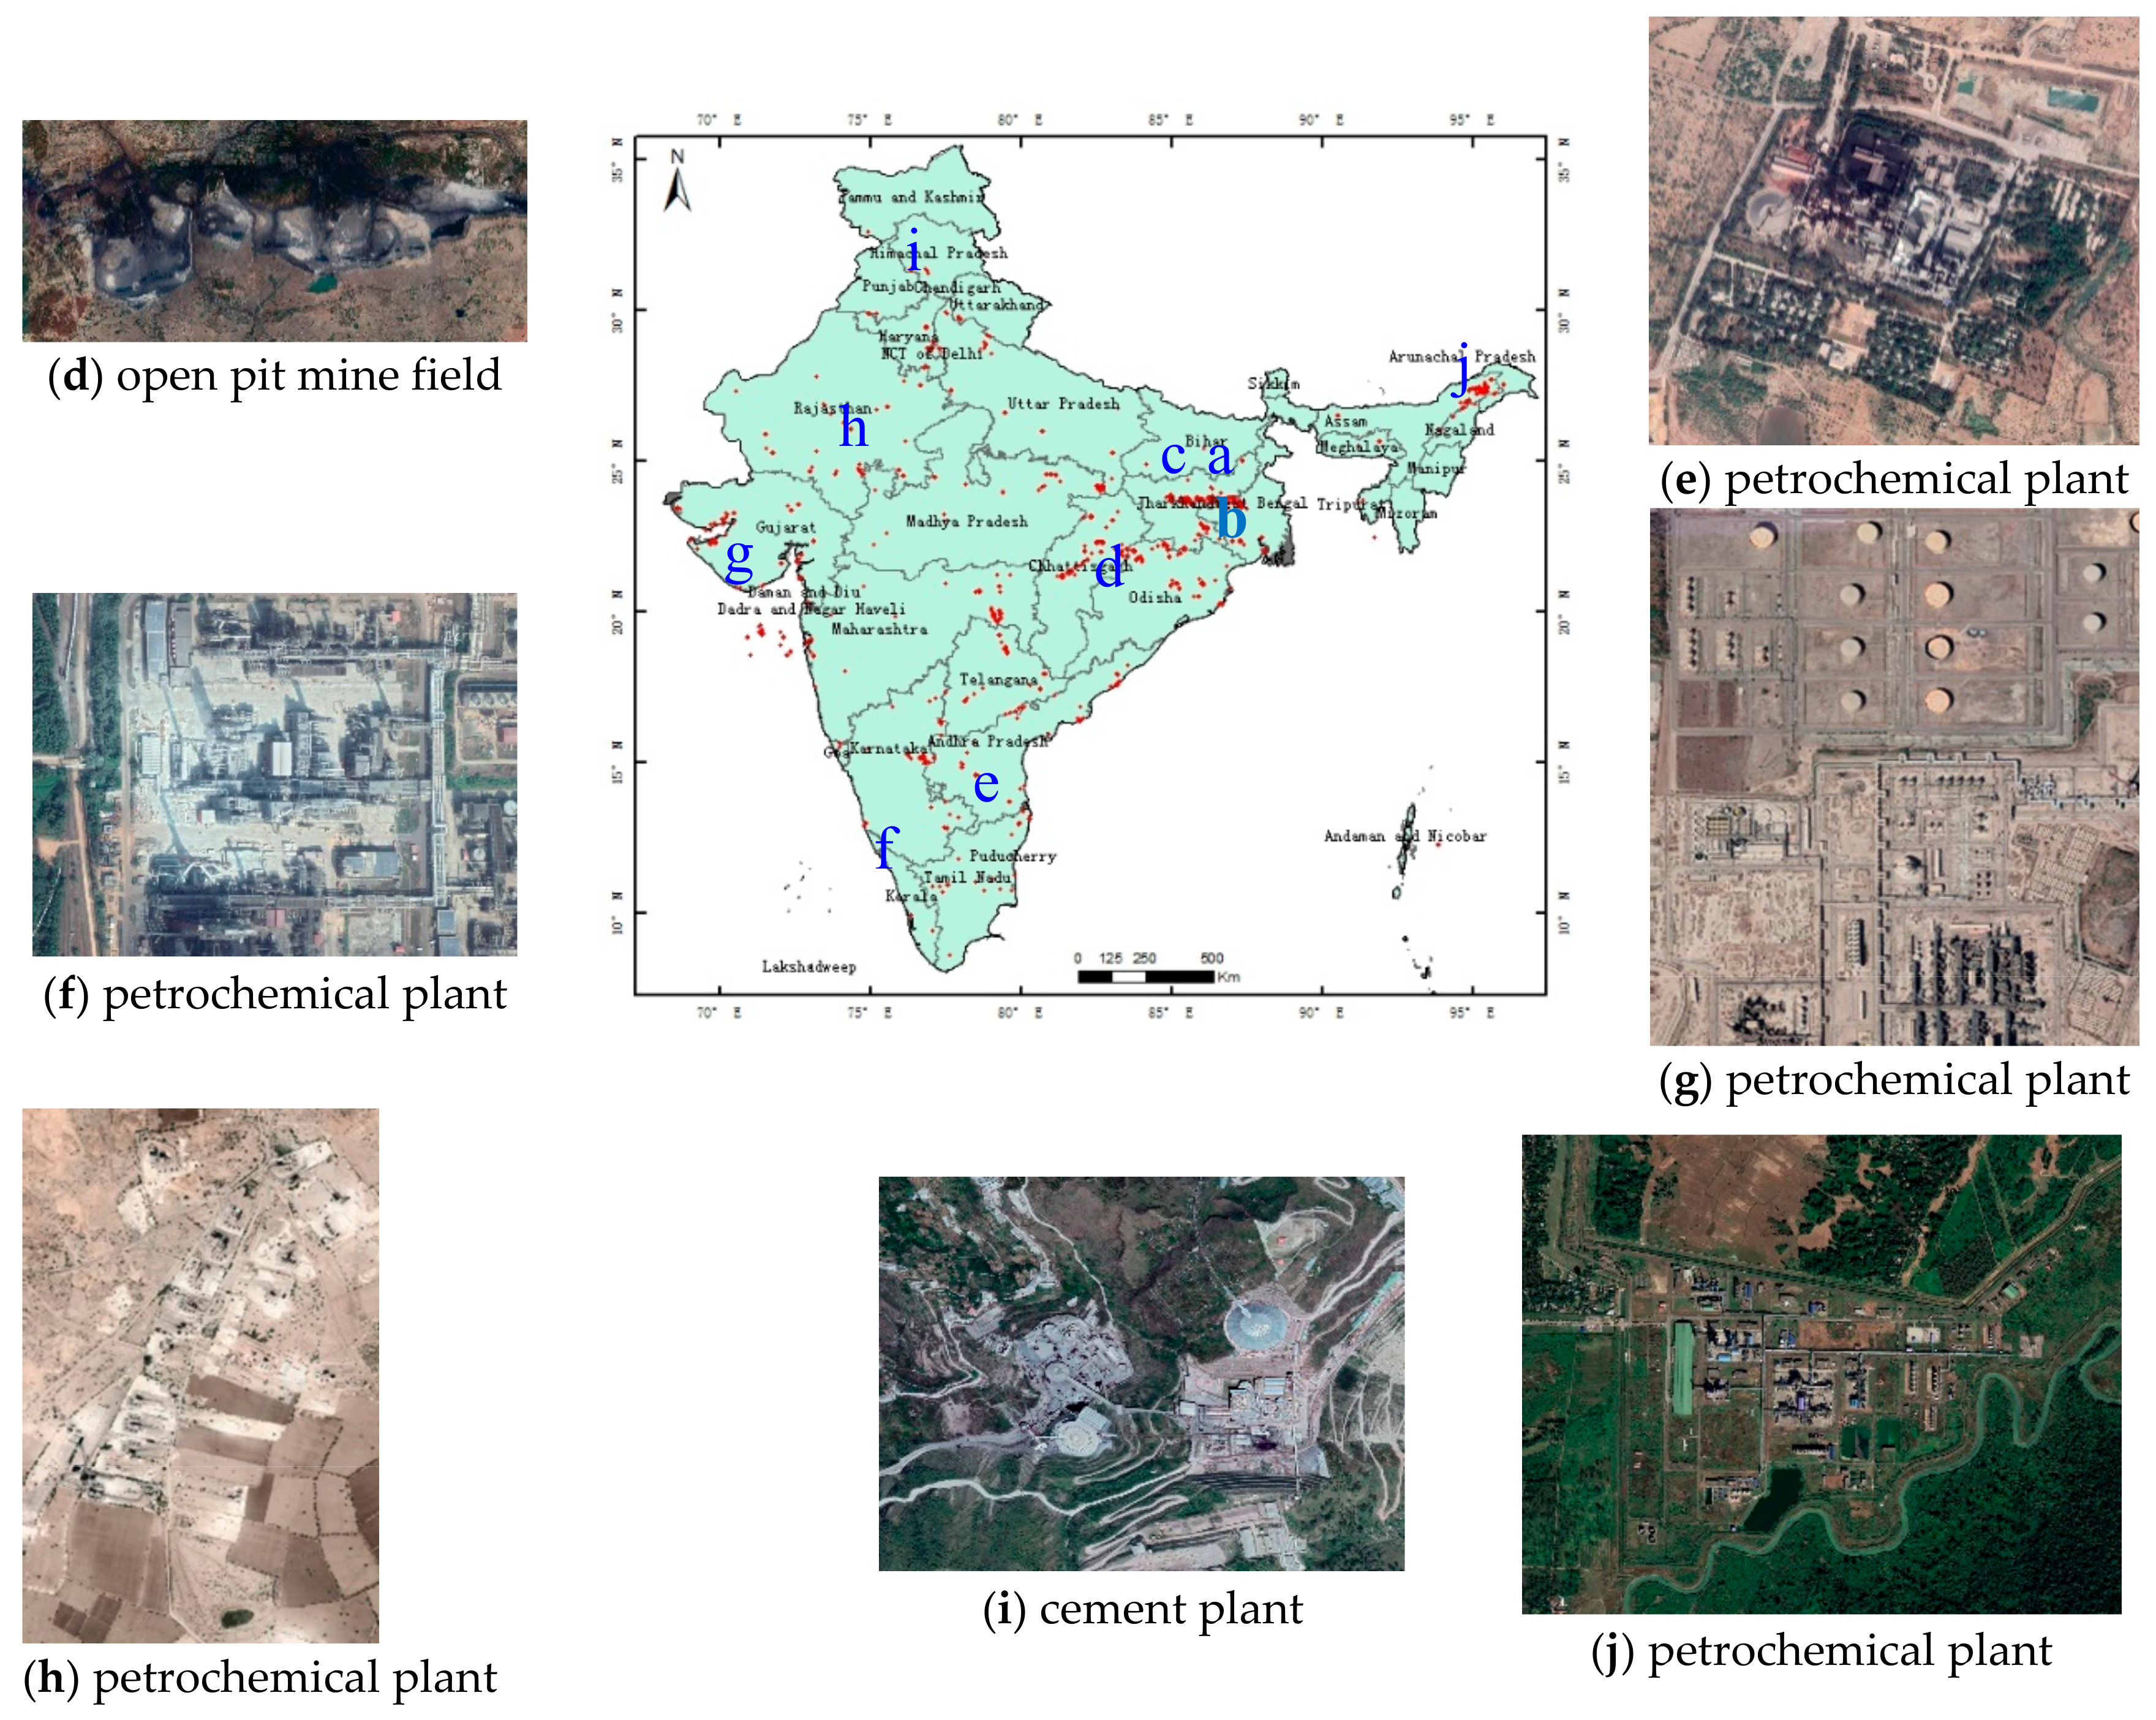
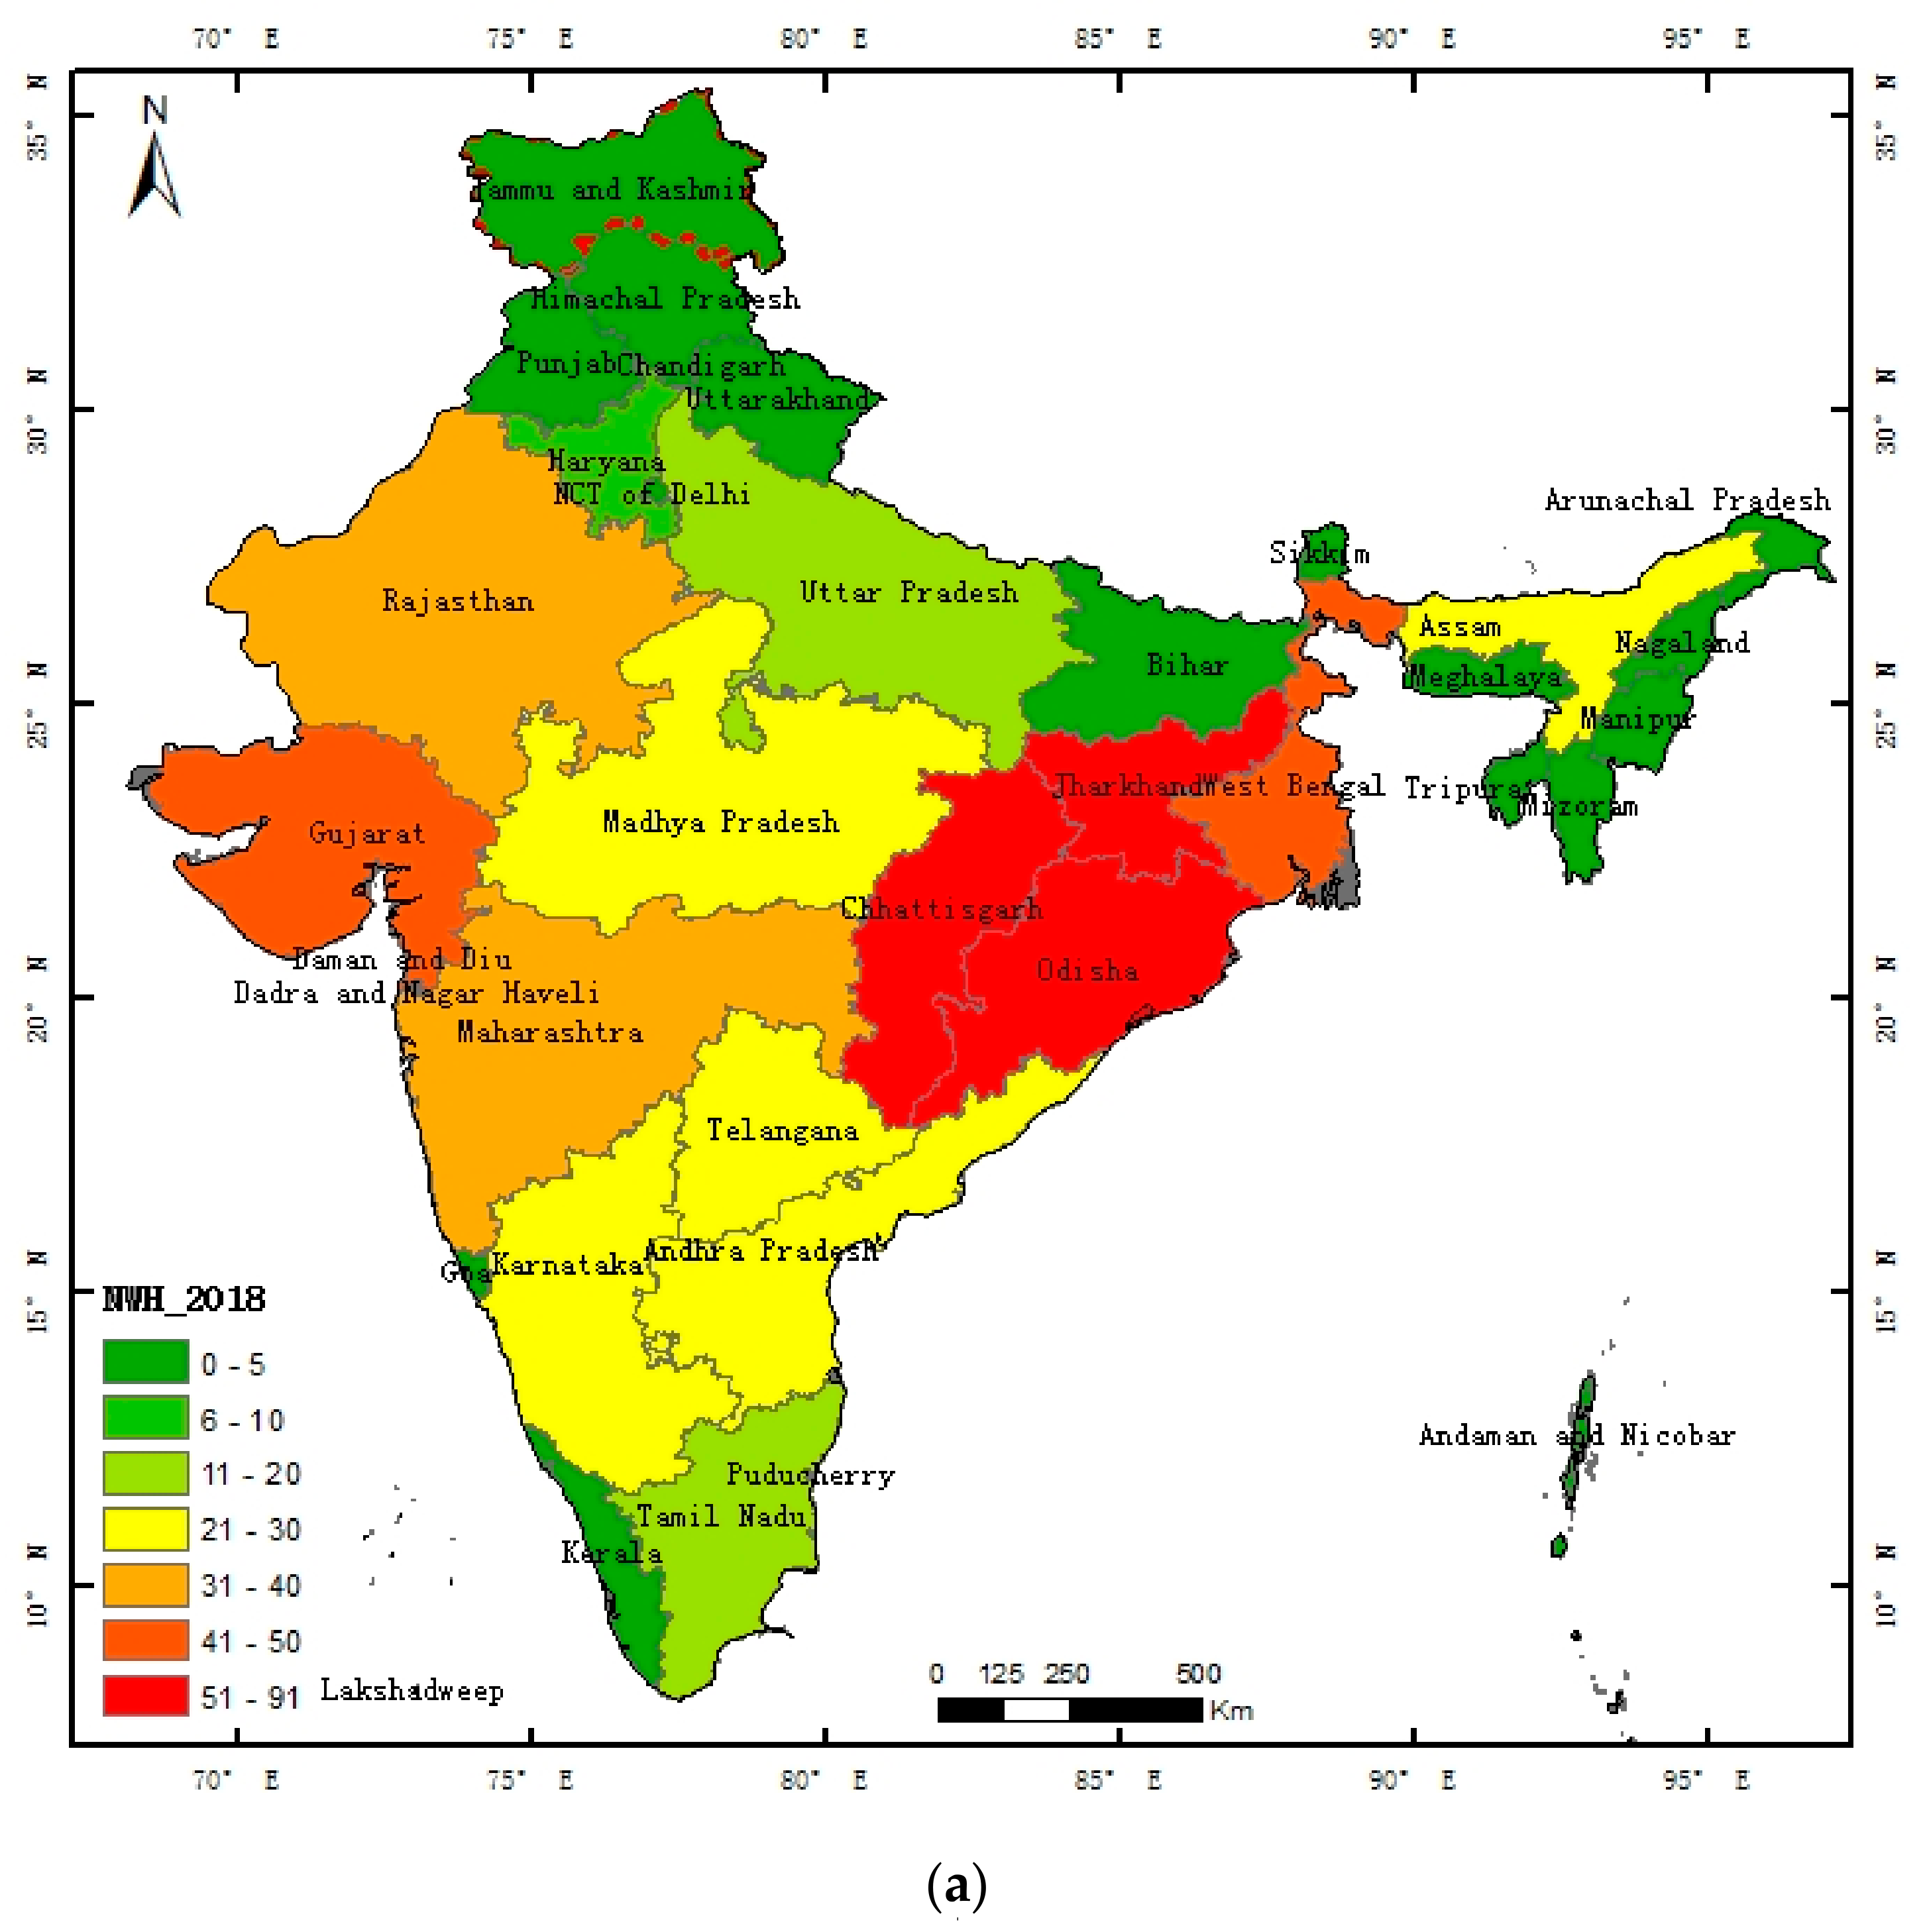
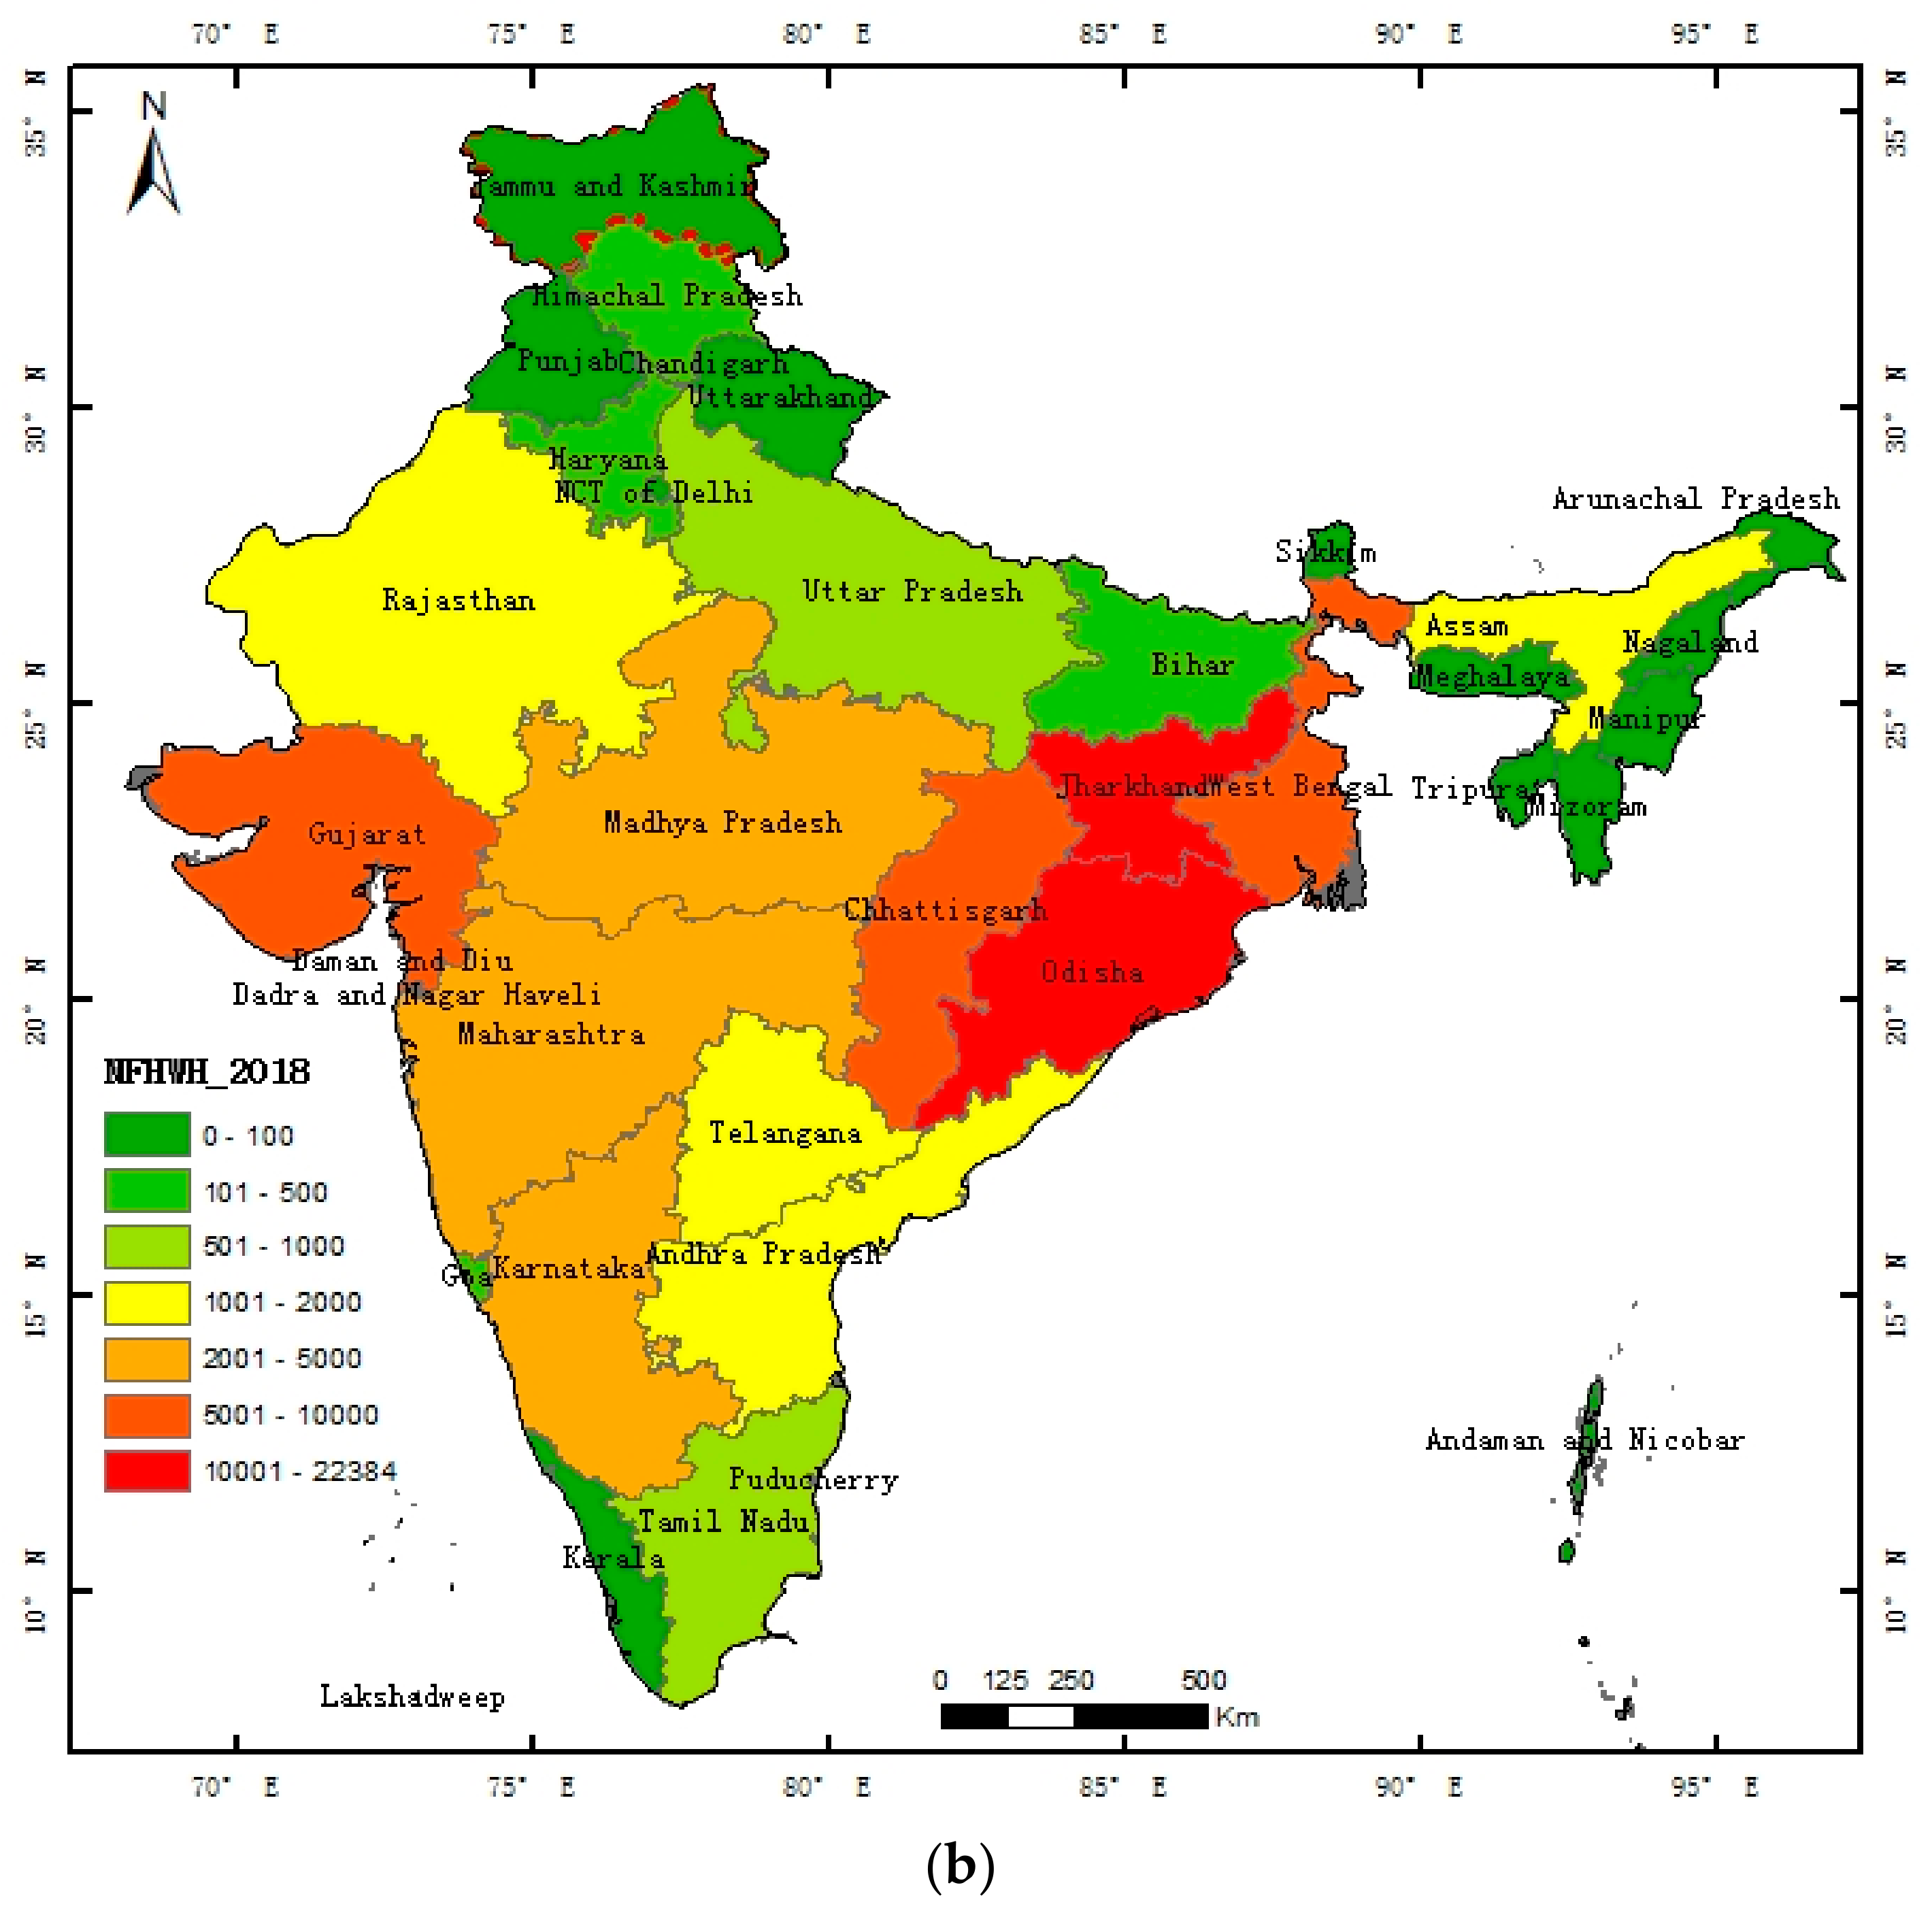
Overall, heavy industry heat sources were found to be mainly concentrated in the north-east Assam state, ease central Jharkhand, north Chhattisgarh, and Odisha, and the coastal areas of Gujarat and Maharashtra. It is also interesting to note that a large number of heavy industrial heat sources were found concentrated around a line between Kolkata on the Eastern Indian Ocean and Mumbai on the Western Indian Ocean.
(2)
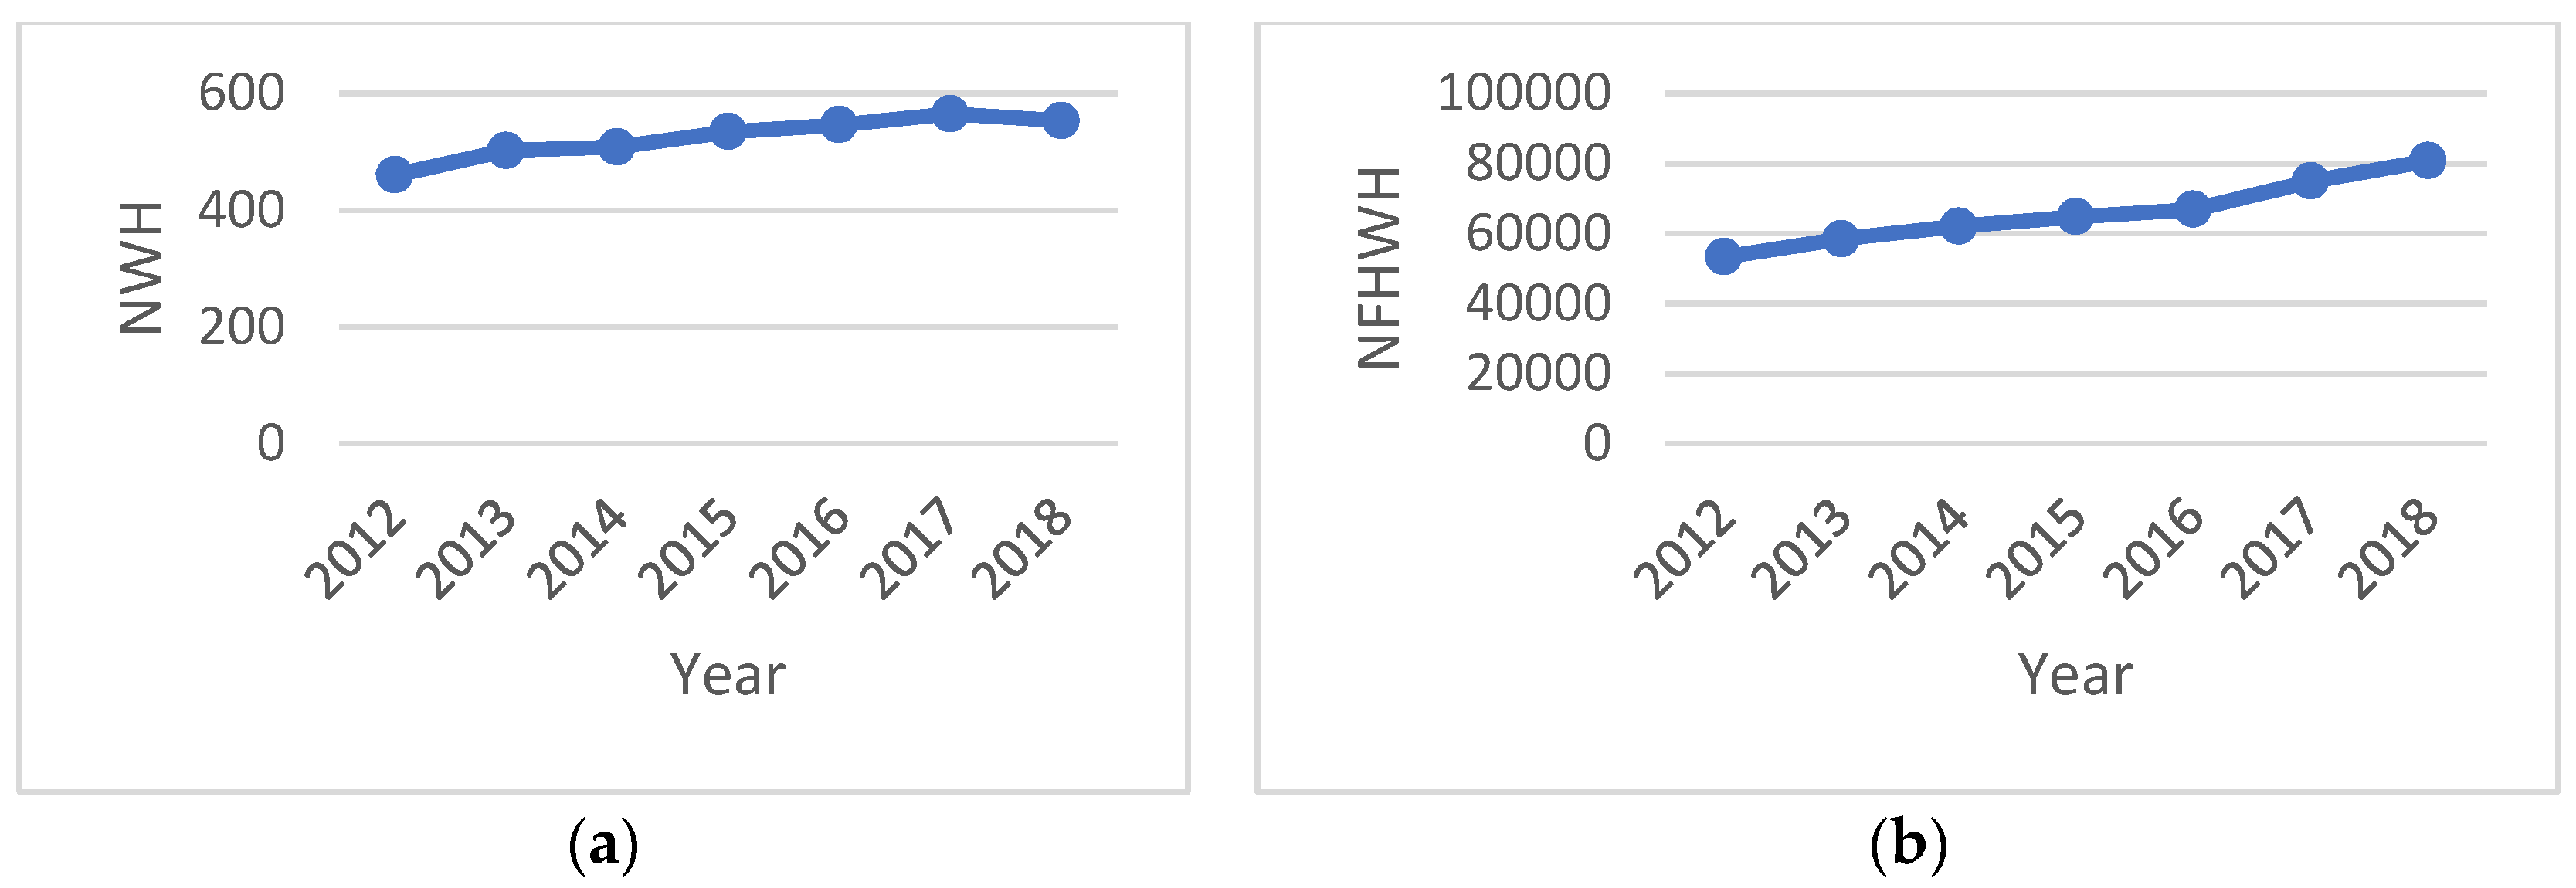
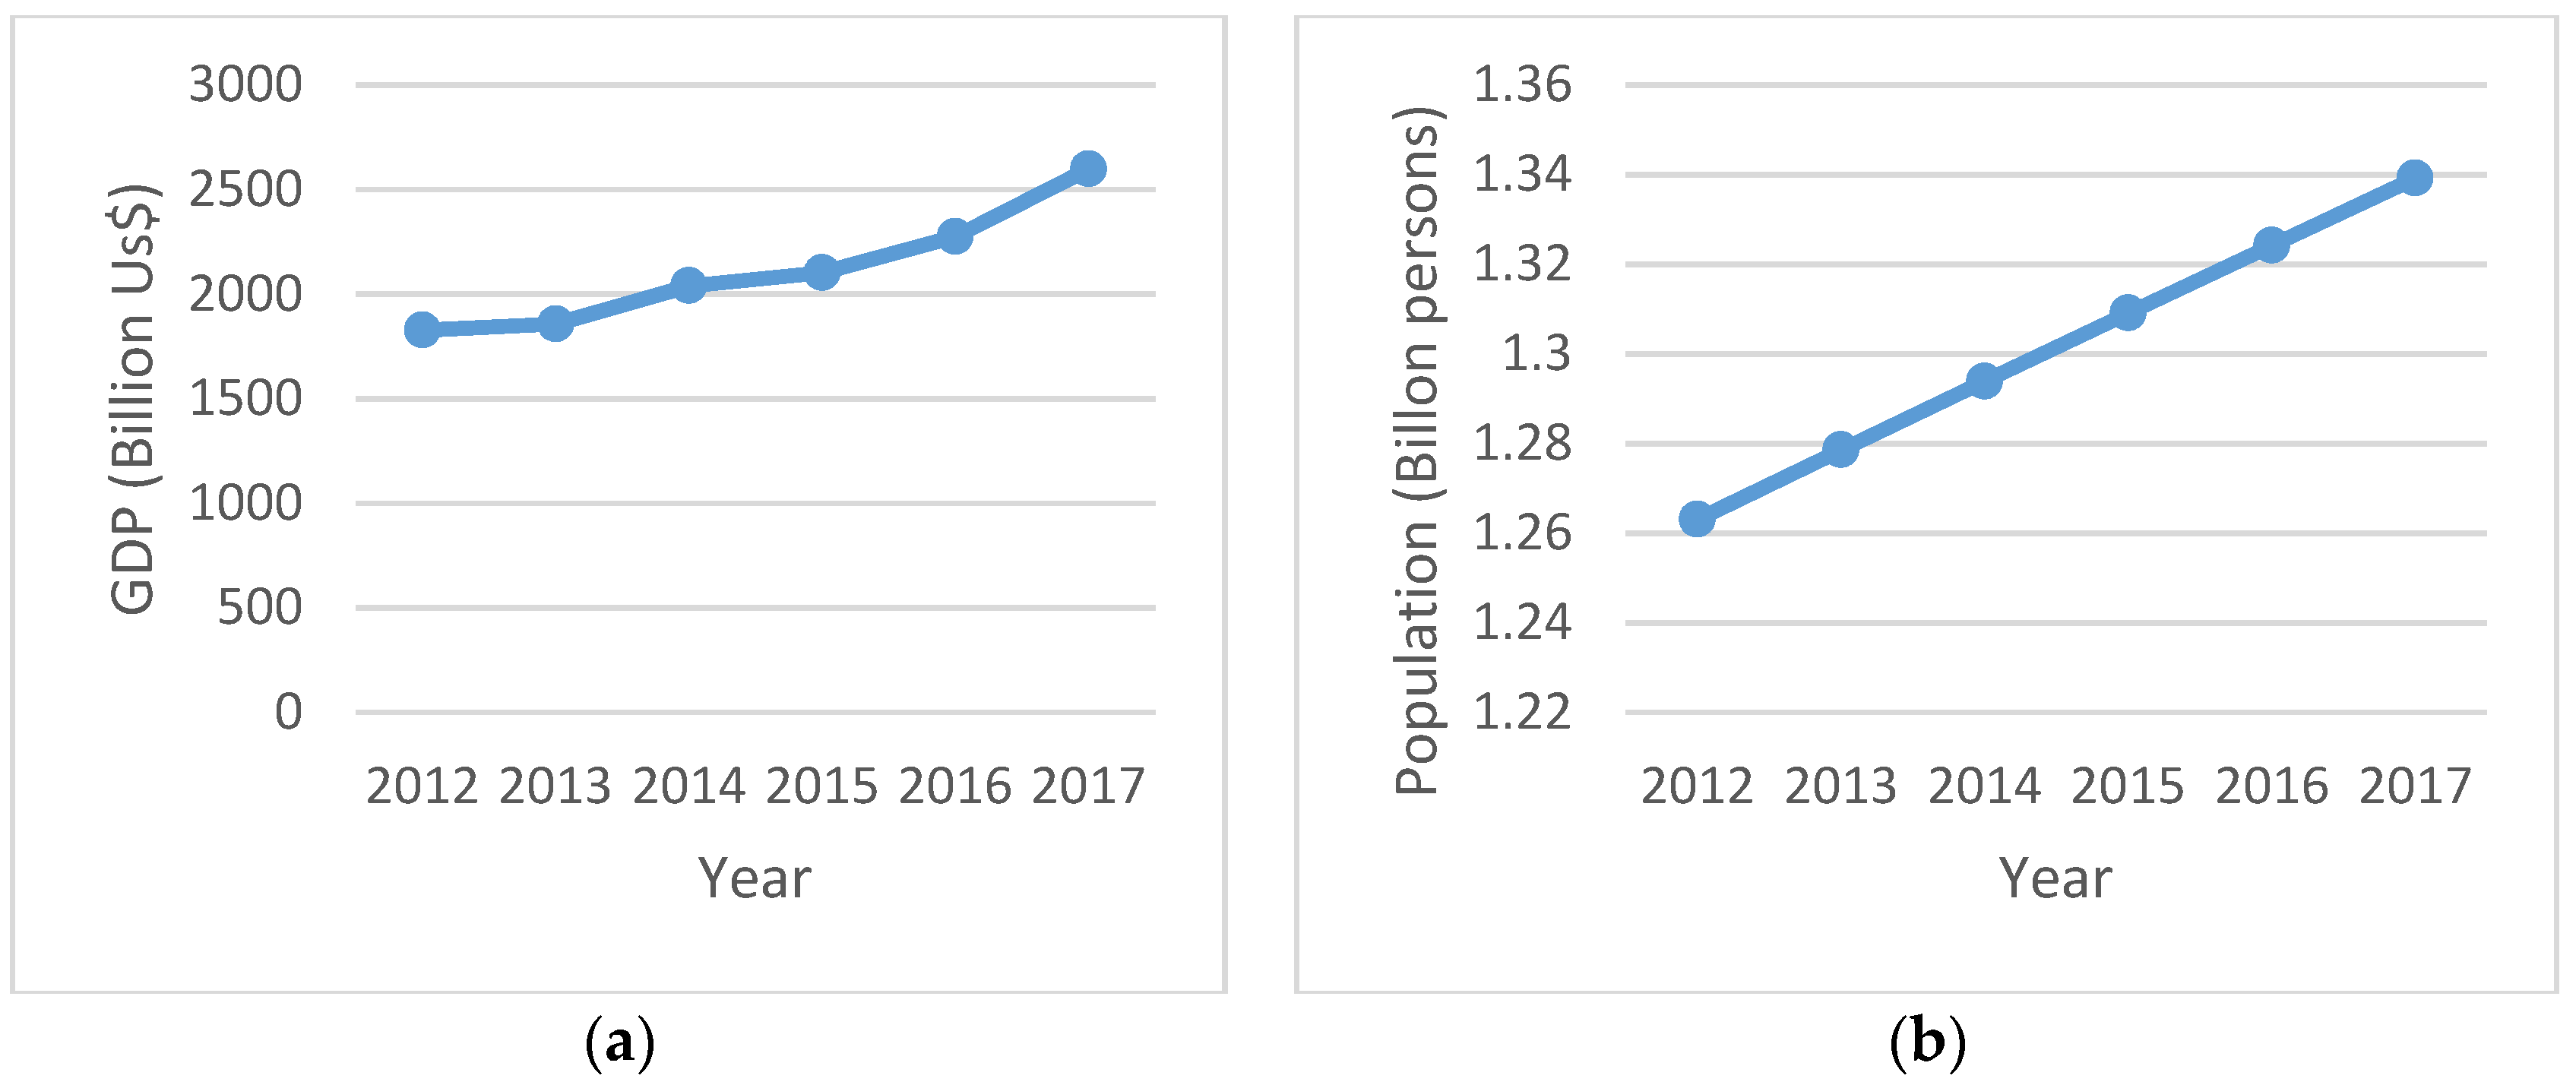
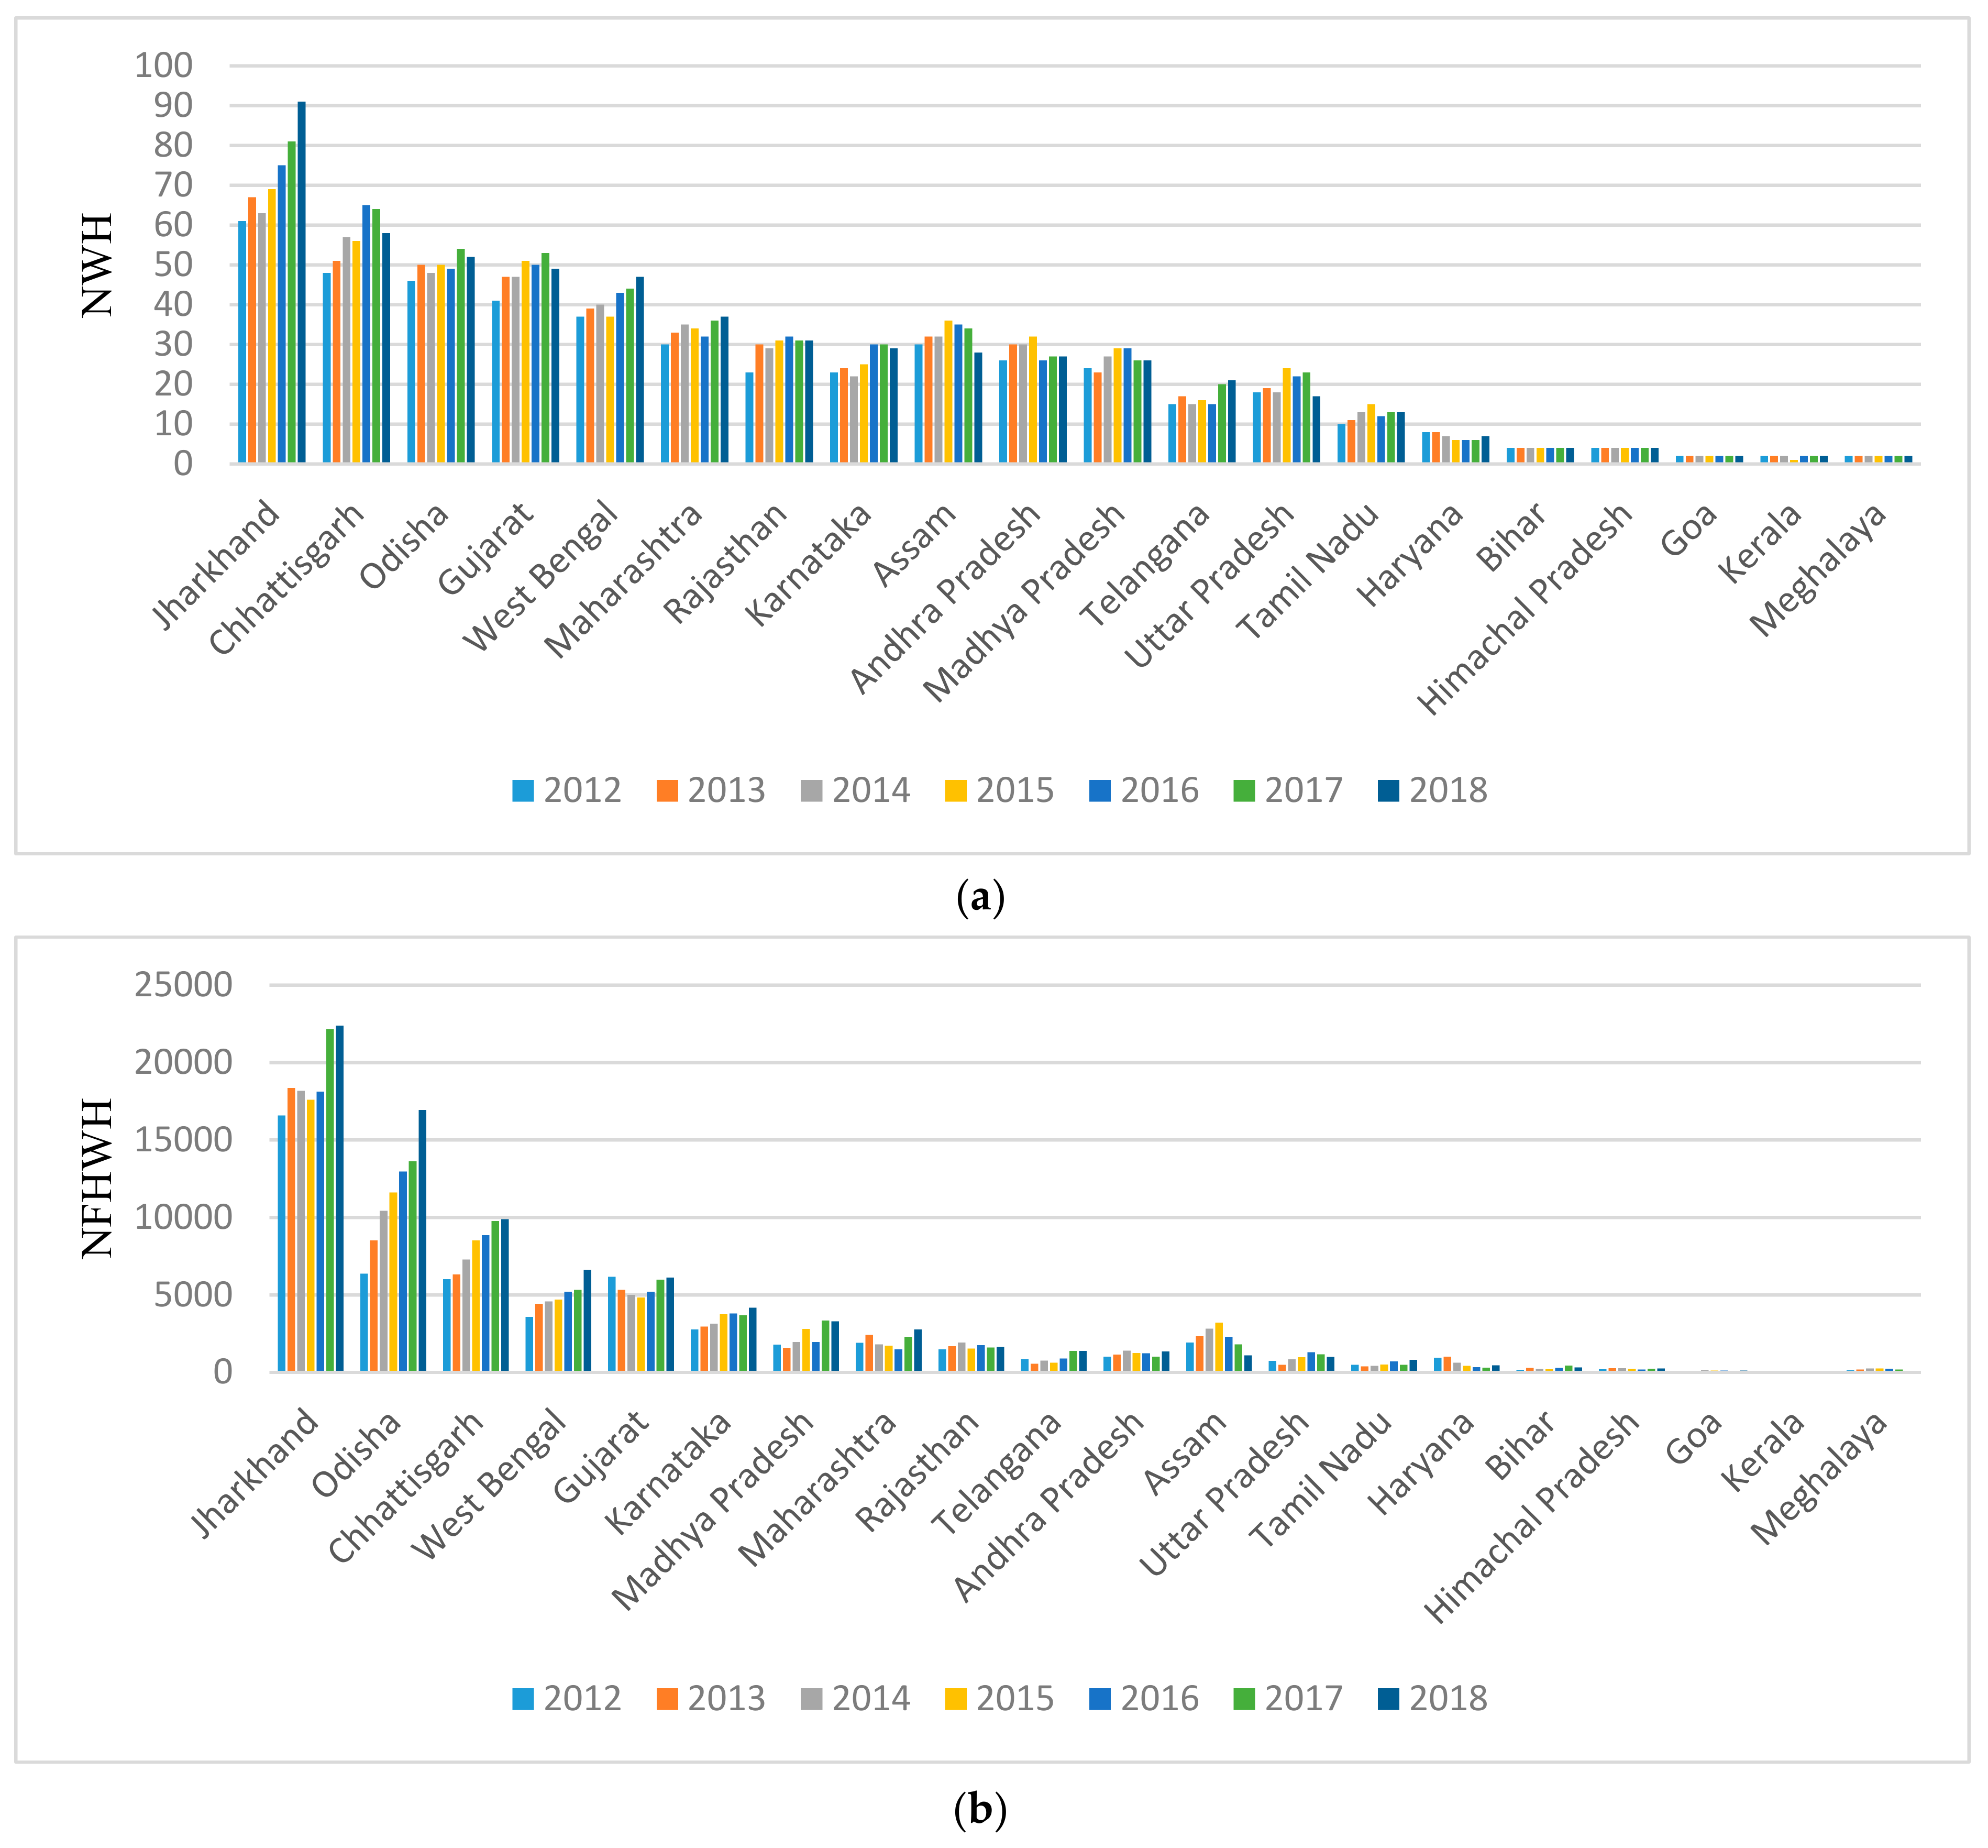
The total NWH and NFHWH values for India increased throughout the period studied, especially in the case of the NFHWH. These trends were similar to those for the GDP and total population of India (Figure 7) between 2012 and 2017.
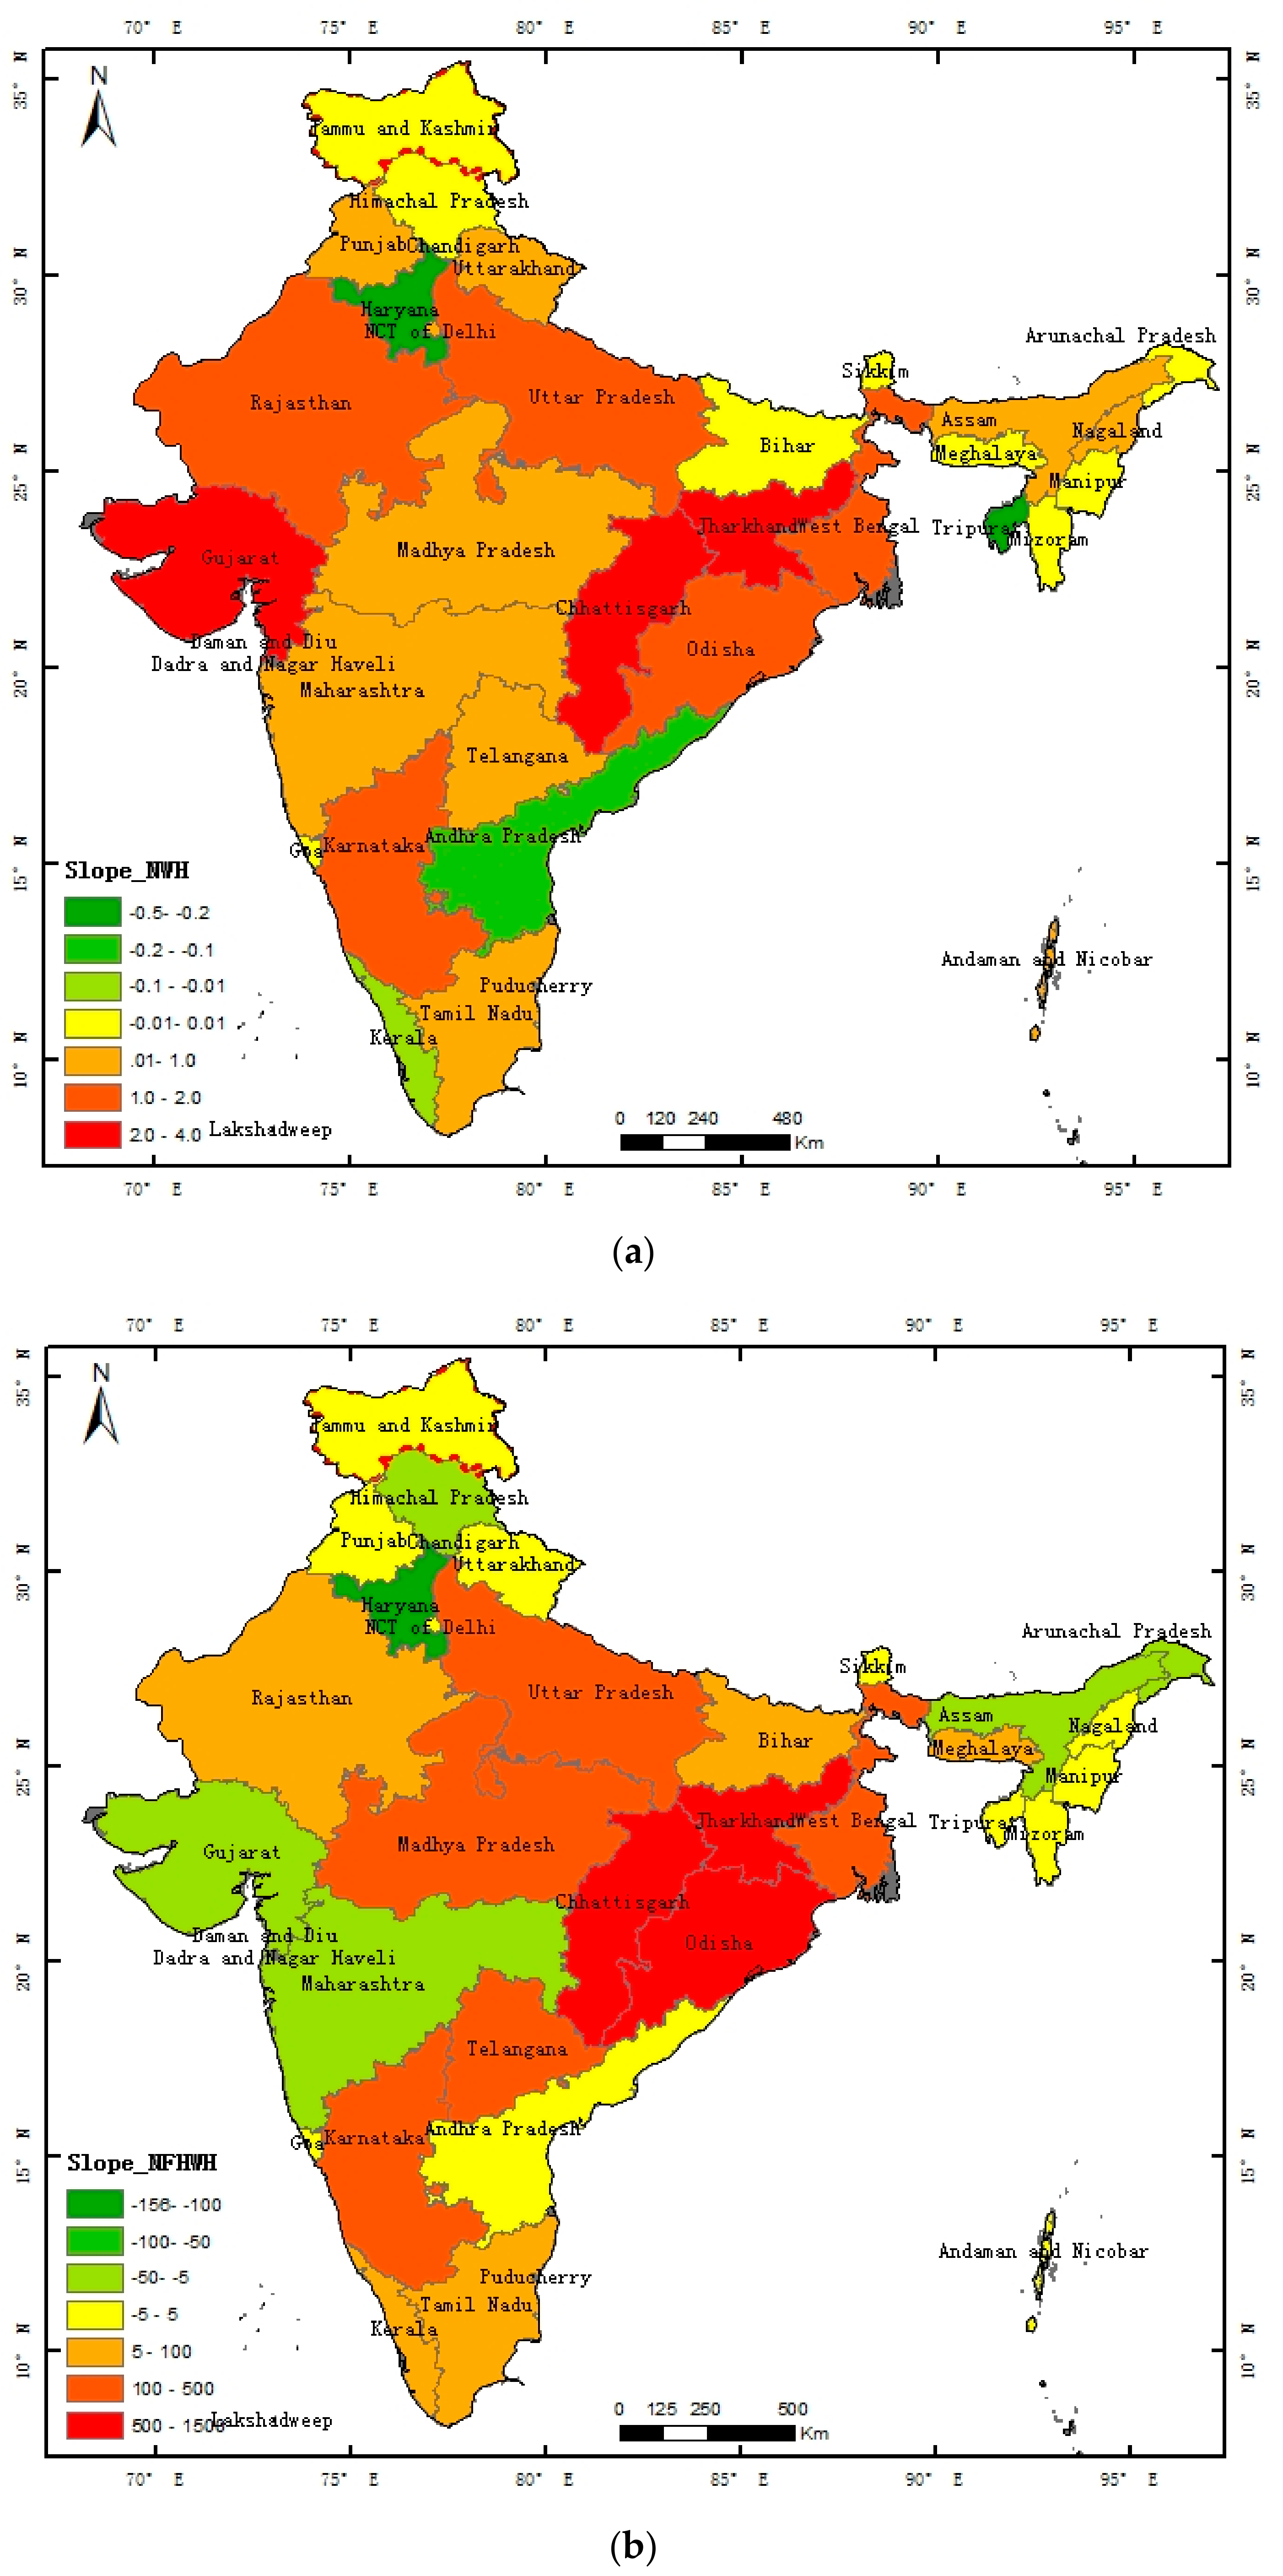
(3)
The largest values of NWH and NFHWH were in Jharkhand, Chhattisgarh, and Odisha. The two largest values of S l o p e _ N W H were in Jharkhand and Chhattisgarh. The smallest negative values of S l o p e _ N W H and S l o p e _ N F H W H were in Haryana. In addition, the S l o p e _ N F H W H value for mainland Gujarat was the second most negative value, whereas it’s S l o p e _ N W H was the third highest positive one.
The results of this study suggest that real-time VIIRS active fire/hotspot data and NPP-VIIRS night-time light data can successfully be used for monitoring Indian heavy industrial economic development. This could be beneficial for Indian policy-makers and heavy industry regulation. Future studies should focus on distinguishing biomass fires/hotspots from other fires/hotspots, which would allow the monitoring of biomass burning related to agriculture and forest fires. Finally, we plan to add much more fire data from different satellite sensors in order to improve temporary and spatial resolutions.

Author Contributions

F.C. and J.Y. conceived and designed the experiments; Y.M. built the experimental platform, and prepared and processed the remote sensing data; C.M. designed and performed the experiments, analyzed the data and wrote the paper; J.L. and Z.N. supervised the research, and also gave comments and revised the manuscript.

Funding

Supported by Open Fund of State Key Laboratory of Remote Sensing Science (Grant No. OFSLRSS201908); Youth Innovation Promotion Association of the Chinese Academy of Sciences (No. Y6YR0300QM); National Natural Science Funds for Key Projects of China (Grant No.61731022); Hainan Provincial Natural Science Foundation of China (Grant No.618QN303).

Acknowledgments

The VNP14IMG was downloaded from the FIRMS website. The authors thank the editors and the three anonymous reviewers for their valuable comments that helped to improve our manuscript.

Conflicts of Interest

The authors declare no conflict of interest.

References

  1. The World Bank. World Bank Open Data. Available online: https://data.worldbank.org/country/russian-federation (accessed on 9 December 2019).
  2. Ma, C.; Yang, J.; Chen, F.; Ma, Y.; Liu, J.; Li, X.; Duan, J.; Guo, R. Assessing Heavy industry heat source Distribution in China Using Real-Time VIIRS Active Fire/Hotspot Data. Sustainability 2018, 10, 4419. [Google Scholar] [CrossRef] [Green Version]
  3. Tong, D.; Zhang, Q.; Davis, S.J.; Liu, F.; Zheng, B.; Geng, G.; Xue, T.; Li, M.; Hong, C.; Lu, Z.; et al. Targeted emission reductions from global super-polluting power plant units. Nat. Sustain. 2018, 1, 59–68. [Google Scholar] [CrossRef] [Green Version]
  4. Zhou, Y.; Zhao, F.; Wang, S.; Liu, W.; Wang, L. A Method for Monitoring Iron and Steel Factory Economic Activity Based on Satellites. Sustainability 2018, 10, 1935. [Google Scholar] [CrossRef] [Green Version]
  5. BP (British Petroleum). BP Home-Page. Available online: https://www.bp.com/ (accessed on 9 December 2019).
  6. International Energy Agency (IEA). Shaping a Secure and Sustainable Energy Future for All. Available online: https://www.iea.org/#statistics-data (accessed on 9 December 2019).
  7. MEIC. Global Power Emissions Database(GPED). Available online: http://meicmodel.org/dataset-gped.html (accessed on 9 December 2019). (In Chinese).
  8. Lu, Z.; Streets, D.G. Increase in NOx emissions from Indian thermal power plants during 1996–2010: Unit-based inventories and multisatellite observations. Environ. Sci. Technol. 2012, 46, 7463–7470. [Google Scholar] [CrossRef]
  9. Deilami, B.R.; Ahmad, B.B.; Saffar, M.R.A.; Umar, H.Z. Review of change detection techniques from remotely sensed images. Res. J. Appl. Sci. Eng. Technol. 2015, 10, 221–229. [Google Scholar]
  10. Roy, M.; Ghosh, S.; Ghosh, A. A novel approach for change detection of remotely sensed images using semi-supervised multiple classifier system. Inf. Sci. 2014, 269, 35–47. [Google Scholar] [CrossRef]
  11. Liu, Y.; Hu, C.; Zhan, W.; Sun, C.; Murch, B.; Ma, L. Identifying industrial heat sources using time-series of the VIIRS Nightfire product with an object-oriented approach. Remote Sens. Environ. 2018, 204, 347–365. [Google Scholar] [CrossRef]
  12. Paltridge, G.W.; Barber, J. Monitoring grassland dryness and fire potential in Australia with NOAA/AVHRR data. Remote Sens. Environ. 1998, 25, 381–394. [Google Scholar] [CrossRef]
  13. Morisette, J.T.; Giglio, L.; Csiszar, I.; Justice, C.O. Validation of the MODIS active fire product over Southern Africa with ASTER data. Int. J. Remote Sens. 2005, 26, 4239–4264. [Google Scholar] [CrossRef]
  14. Zhao, W. Research and evaluation of the algorithm of land surface fire detection based on FY3-VIRR data. Fire Saf. Sci. 2011, 3, 004. [Google Scholar] [CrossRef]
  15. Vogeler, J.C.; Yang, Z.; Cohen, W.B. Mapping post-fire habitat characteristics through the fusion of remote sensing tools. Remote Sens. Environ. 2016, 173, 294–303. [Google Scholar] [CrossRef]
  16. Schroeder, W.; Oliva, P.; Giglio, L.; Quayle, B.; Lorenz, E.; Morelli, F. Active fire detection using Landsat-8/OLI data. Remote Sens. Environ. 2016, 185, 210–220. [Google Scholar] [CrossRef] [Green Version]
  17. Trifonov, G.M.; Zhizhin, M.N.; Melnikov, D.V.; Poyda, A.A. VIIRS Nightfire Remote Sensing Volcanoes. Procedia Comput. Sci. 2017, 119, 307–314. [Google Scholar] [CrossRef]
  18. Baugh, K. Characterization of Gas Flaring in North Dakota using the Satellite Data Product, VIIRS Nightfire. In Proceedings of the AGU Fall Meeting 2015, San Francisco, CA, USA, 14–18 December 2015. [Google Scholar]
  19. Sun, J.Q.; Liu, Y.X.; Dong, Y.Z. Classification of Urban Industrial Heat Sources Based on Suomi-NPP VIIRS Night-time Thermal Anomaly Products: A Case Study of the Beijing-Tianjin-Hebei Region. Geogr. Geo-Inf. Sci. 2018, 34, 13–19. [Google Scholar]
  20. Schroeder, W.; Oliva, P.; Giglio, L.; Csiszar, I. The new VIIRS 375 m activefire detection data product: Algorithm description and initial assessment. Remote Sens. Environ. 2014, 143, 85–96. [Google Scholar] [CrossRef]
  21. Giglio, L.; Schroeder, W.; Justice, C.O. The collection 6 MODIS active fire detection algorithm and fire products. Remote Sens. Environ. 2016, 178, 31–41. [Google Scholar] [CrossRef] [Green Version]
  22. Dai, Z.; Hu, Y.; Zhao, G. The Suitability of Different Night-time Light Data for GDP Estimation at Different Spatial Scales and Regional Levels. Sustainability 2017, 9, 305. [Google Scholar] [CrossRef] [Green Version]
  23. Wu, W.; Zhao, H.; Jiang, S. A Zipf’s Law-Based Method for Mapping Urban Areas Using NPP-VIIRS Night-time Light Data. Remote Sens. 2018, 10, 130. [Google Scholar] [CrossRef] [Green Version]
  24. The World Bank. The World Bank In India. Available online: http://www.worldbank.org/en/country/india (accessed on 9 December 2019).
  25. Liu, F.; Zhang, Q.; Tong, D.; Zheng, B.; Li, M.; Huo, H.; He, K.B. High-resolution inventory of technologies, activities, and emissions of coal-fired power plants in China from 1990 to 2010. Atmos. Chem. Phys. 2015, 15, 13299–13317. [Google Scholar] [CrossRef] [Green Version]
  26. VIIRS I-Band 375 m Active Fire Data. Available online: https://earthdata.nasa.gov/earth-observation-data/near-real-time/firms/viirs-i-band-active-fire-data (accessed on 18 April 2019).
  27. Elvidge, C.D.; Zhizhin, M.; Baugh, K.; Hsu, F.C.; Ghosh, T. Extending Nighttime Combustion Source Detection Limits with Short Wavelength VIIRS Data. Remote Sens. 2019, 11, 395. [Google Scholar] [CrossRef] [Green Version]
  28. VIIRS DNB Nighttime Imagery. Available online: https://maps.ngdc.noaa.gov/viewers/VIIRS_DNB_nighttime_imagery/index.html (accessed on 9 December 2019).
  29. Zhu, X.; Ma, M.; Yang, H.; Ge, W. Modeling the Spatiotemporal Dynamics of Gross Domestic Product in China Using Extended Temporal Coverage Night-time Light Data. Remote Sens. 2017, 9, 626. [Google Scholar] [CrossRef] [Green Version]
  30. Version 1 VIIRS Day/Night Band Nighttime Lights. Available online: https://eogdata.mines.edu/download_dnb_composites.html (accessed on 18 April 2019).
  31. The Chinese Academy of Sciences version of the Earth Luminous Data Set (codenamed “Flint”) Provides Annual Data Download Service. Available online: https://www.jianshu.com/p/5fde55a4d267?tdsourcetag=s_pcqq_aiomsg (accessed on 9 December 2019).
  32. NPP_NIGHT_LIGHT. Available online: https://pan.baidu.com/s/17UqS7P66_6AMdr-a4sfUXA#list/path=%2F (accessed on 9 December 2019).
  33. GADM Data. Available online: https://gadm.org/data.html (accessed on 18 April 2019).
  34. India Brand Equity Foundation (IBEF). About Jharkhand: Information on Mining Industries, Economy, Agriculture & Geography. Available online: https://www.ibef.org/states/jharkhand.aspx (accessed on 9 December 2019).
  35. Industrial Development & Economic Growth in Chhattisgarh. Available online: https://www.ibef.org/industry/chhattisgarh-presentation (accessed on 18 April 2019).
Figure 1. The 36 States and Union Territories of India.
Ijgi 08 00568 g001
Figure 2. Spatial density of the 3,998,465 fire hotspots in Indian regions (including Jammu and Kashmir state).
Ijgi 08 00568 g002
Figure 3. Spatial distribution comparison of VIIRS Nightfire product (VNF) and NPP VIIRS active fire product (VNP14IMG) on 01/01/2018. (a) The spatial distribution comparison of 301 VNF on 01/01/2018. (b) The spatial distribution comparison of the 1760 VNP14IMG hotspot.
Ijgi 08 00568 g003
Figure 4. ‘Flint’ India light data for 2018 (including Jammu and Kashmir state).
Ijgi 08 00568 g004
Figure 5. The architecture of the heavy industry heat source detection model using the active fire/hotspot data and night-time light data for India.
Ijgi 08 00568 g005
Figure 6. Spatial distribution of 711 heavy industrial heat sources in Indian regions (including Jammu and Kashmir state).
Ijgi 08 00568 g006
Figure 7. Changes for heavy industrial heat sources in India. (a) The number of working heavy industrial heat sources (NWH) during the period 2012 to 2018. (b) The number of fire hotspots in working heavy industrial heat sources areas (NFHWH) during the period 2012 to 2018.
Ijgi 08 00568 g007
Figure 8. Changes in GDP and in the total population of India during the period 2012 to 2017. (a) GDP current Billion US$ between 2012 and 2017. (b) Population total billion persons between 2012-2017.
Ijgi 08 00568 g008
Figure 9. High-resolution imagery used to validate the model.
Ijgi 08 00568 g009aIjgi 08 00568 g009b
Figure 10. Changes in heavy industrial heat sources at the state level. (a) NWH for the top 20 states between 2012 and 2018. (b) NFHWH for the top 20 states between 2012 and 2018.
Ijgi 08 00568 g010
Figure 11. Changes in heavy industry heat sources at the state level from 2012 to 2018 (including Jammu and Kashmir state). (a) The S l o p e _ N W H values for different states. (b) The S l o p e _ N F H W H values for different states.
Ijgi 08 00568 g011
Figure 12. Distribution of heavy industry heat sources at the state level (2018) (including Jammu and Kashmir state). (a) The NWH values for different states (2018). (b) The NFHWH values for different states (2018).
Ijgi 08 00568 g012aIjgi 08 00568 g012b

