Article

An Integrated Framework Combining Multiple Human Activity Features for Land Use Classification

1
School of Geography and Ocean Science, Jiangsu Provincial Key Laboratory of Geographic Information Science and Technology, Nanjing University, Nanjing 210023, China
2
Nanjing Municipal Commission of Development and Reform, Nanjing 210019, China
3
Collaborative Innovation Center of Novel Software Technology and Industrialization, Nanjing University, Nanjing 210023, China
*
Author to whom correspondence should be addressed.
ISPRS Int. J. Geo-Inf. 2019, 8(2), 90; https://0-doi-org.brum.beds.ac.uk/10.3390/ijgi8020090
Submission received: 8 January 2019 / Revised: 10 February 2019 / Accepted: 13 February 2019 / Published: 15 February 2019

Abstract

:
Urban land use information is critical to urban planning, but the increasing complexity of urban systems makes the accurate classification of land use extremely challenging. Human activity features extracted from big data have been used for land use classification, and fusing different features can help improve the classification. In this paper, we propose a framework to integrate multiple human activity features for land use classification. Features were fused by constructing a membership matrix reflecting the fuzzy relationship between features and land use types using the fuzzy c-means (FCM) clustering method. The classification results were obtained by the fuzzy comprehensive evaluation (FCE) method, which regards the membership matrix as the fuzzy evaluation matrix. This framework was applied to a case study using taxi trajectory data from Nanjing, and the outflow, inflow, net flow and net flow ratio features were extracted. A series of experiments demonstrated that the proposed framework can effectively fuse different features and increase the accuracy of land use classification. The classification accuracy achieved 0.858 (Kappa = 0.810) when the four features were fused for land use classification.

1. Introduction

Urban land use information is the foundation of urban planning, and it plays an important role in government management, policy formulation and resource allocation [1,2,3,4,5,6]. Although the government has land use registration information, it is difficult to update and acquire land use information in a timely manner because urban land use and spatial structure are changing rapidly in developing countries such as China [7,8,9]. To solve this problem, a fast and accurate method for urban land use classification needs to be developed.
Remote sensing techniques classify urban land use with spectral and texture information, and they have a good ability to reveal the physical characteristics of the earth’s surface, such as water and buildings [10,11,12,13]. However, it is hard to distinguish land use types in more detail relying solely on remote sensing images [14,15,16], such as identifying residential and commercial land from buildings, whereas detailed urban land use is usually associated with social functions [17,18,19]. Human activities interact with social functions of distinct regions [20]. Many scholars have studied the impact of urban land use on human activities, such as traffic demand forecasting and commuting patterns research [21,22,23,24,25]. Conversely, it is also feasible to identify social functions and infer urban land use based on human activities [26,27,28,29,30,31,32]. The traditional sources of human activity information rely on travel surveys [33,34]. The survey data record the activities of subjects during the observation period and play a major role in classical urban studies, but data acquisition is time-consuming, which has limited the development of related studies [35,36,37].
With the rapid development of information and communication technologies (ICT), massive amounts of crowdsourced data (e.g., mobile phone record data, taxi trajectory data and social media check-in data) are well captured. These data are plentiful and accessible, and they contain a wealth of information about human activities and socioeconomics, providing strong support for understanding urban land use [38,39,40]. Reades et al. [41] analyzed the relationship between mobile phone data and business land and identified different mobile phone usage patterns between business and residential land. Calabrese et al. [42] successfully classified the campus environment based on the Wi-Fi network. Qi et al. [43] qualitatively analyzed the relationship between taxi trajectory data and the social functions of a city. These studies demonstrate that the time series representing human activity variations are very useful for land use classification. After that, Soto and Frias-Martinez [44,45] built a time series of hourly calling volume feature on weekdays and weekends and introduced clustering methods to classify urban land use. Liu et al. [26] constructed a time series of the differences between the volumes of pick-up and drop-off points and classified land use in Shanghai using the k-means clustering method. Time series of human activity features have been widely applied to land use classification [46,47,48,49].
Integrating human activity features can capture different aspects of human activities and provide more information for land use classification. Toole et al. [50] constructed a new time series by adding the total calling volume feature to the time series of hourly calling volume feature. Pei et al. [51] extended the new time series by introducing more information on the hourly calling volume feature and proved that the classification accuracy based on the new time series is better than the hourly calling volume feature and total calling volume feature used alone. These studies demonstrate the feasibility and advantages of fusing human activity characteristics in land use classification, but the feature combination is limited to two features. Therefore, it is meaningful to explore the performance of integrating more features in land use classification. Feature combination is often implemented by connecting the time series of each feature. Pan et al. [52] fused the outflow and inflow features of the taxi trajectory data by splicing the outflow time series and inflow time series. Liu et al. [53] also spliced the time series of the outflow and inflow features in the land use classification of Shanghai. However, a high-dimensional time series will be formed when more features are fused. In many cases, the similarity between time series is closely related to classification results. When the time series is of high dimensions, the traditional distance functions (e.g., Euclidean distance) are invalid, which will affect the classification accuracy [54,55,56]. Therefore, it is necessary to find a new method of combining multiple features for land use classification.
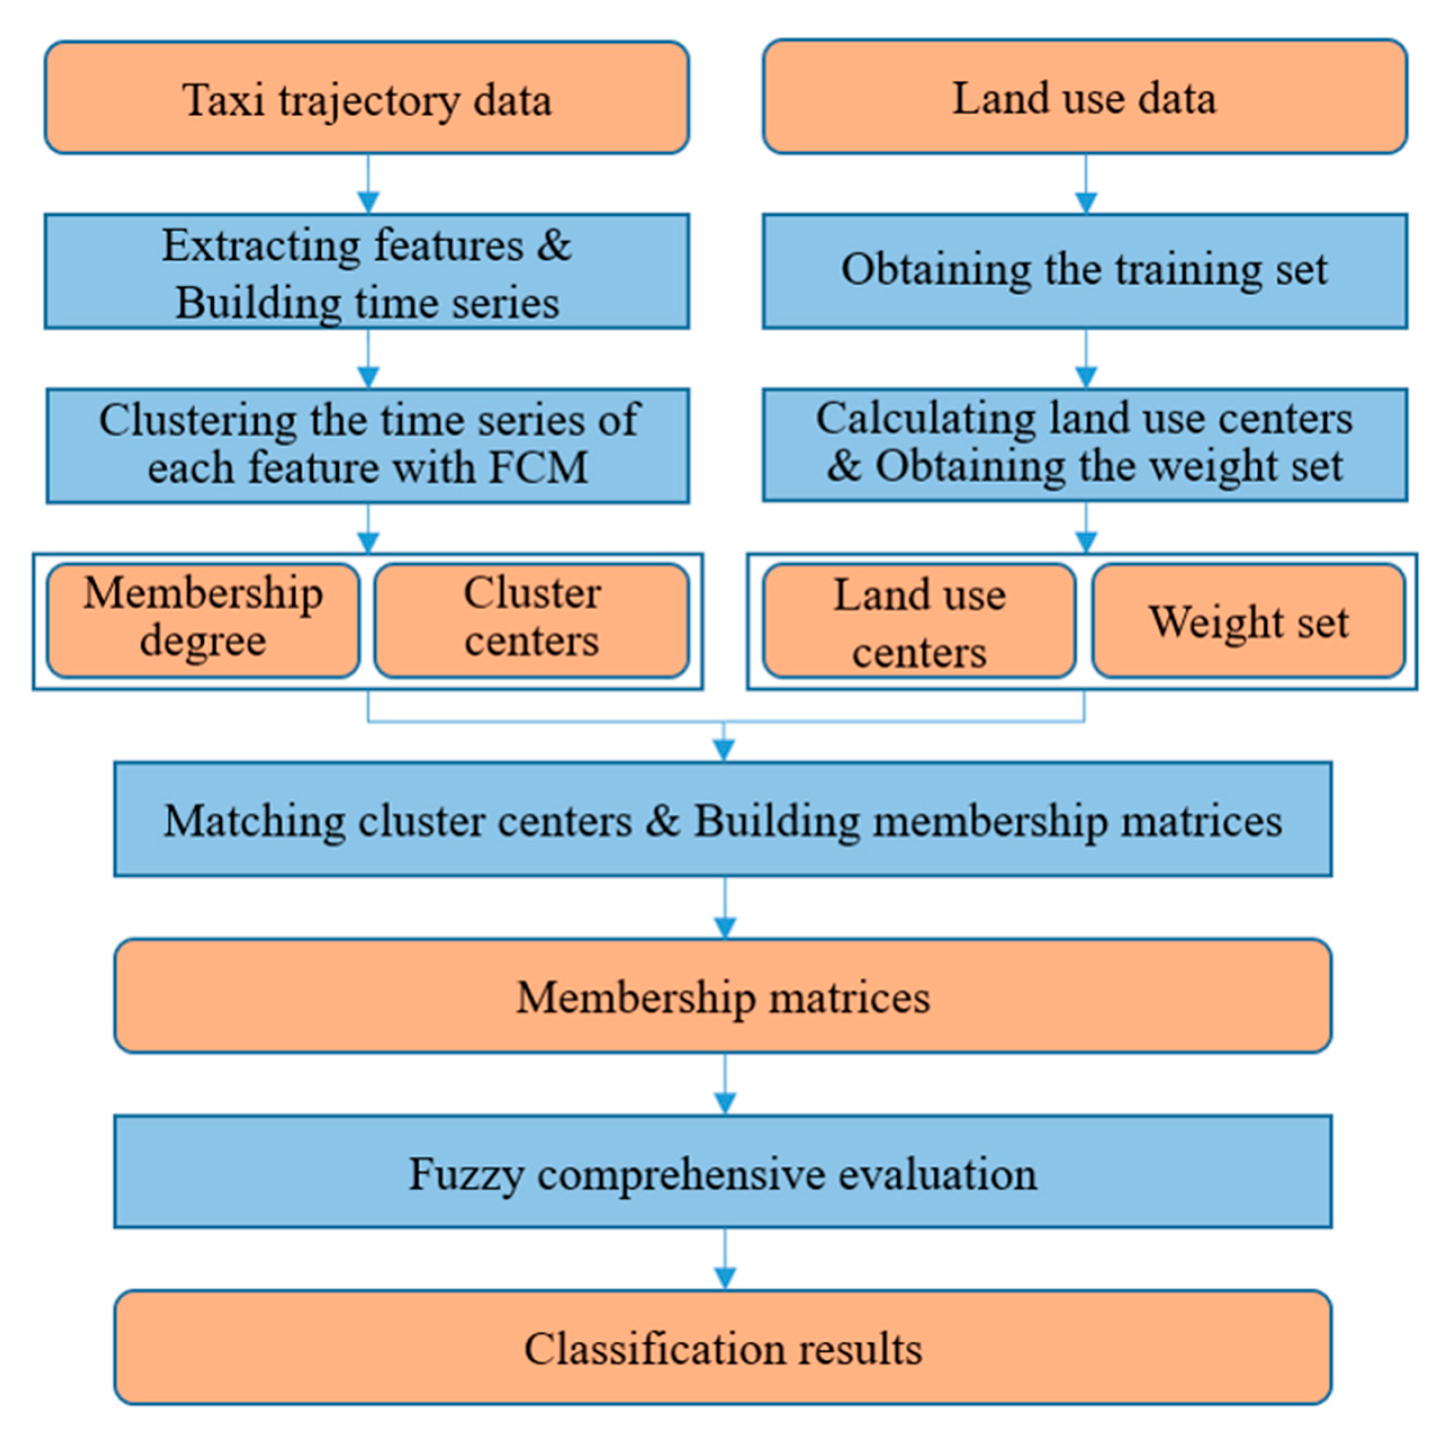
In this study, we propose an integrated framework to fuse features for land use classification, and it was inspired by the fuzzy comprehensive evaluation (FCE) method. Time series were built for each feature and clustered by the fuzzy c-means (FCM) clustering method. A membership matrix was constructed to fuse features based on the clustering results, and the FCE method was utilized to determine the land use type based on this matrix. The proposed framework can combine multiple human activity features without generating a high-dimensional time series, and it has been applied in the land use classification of Nanjing.
The remainder of this paper is organized as follows. Section 2 introduces the framework that combines multiple human activity features for land use classification. 
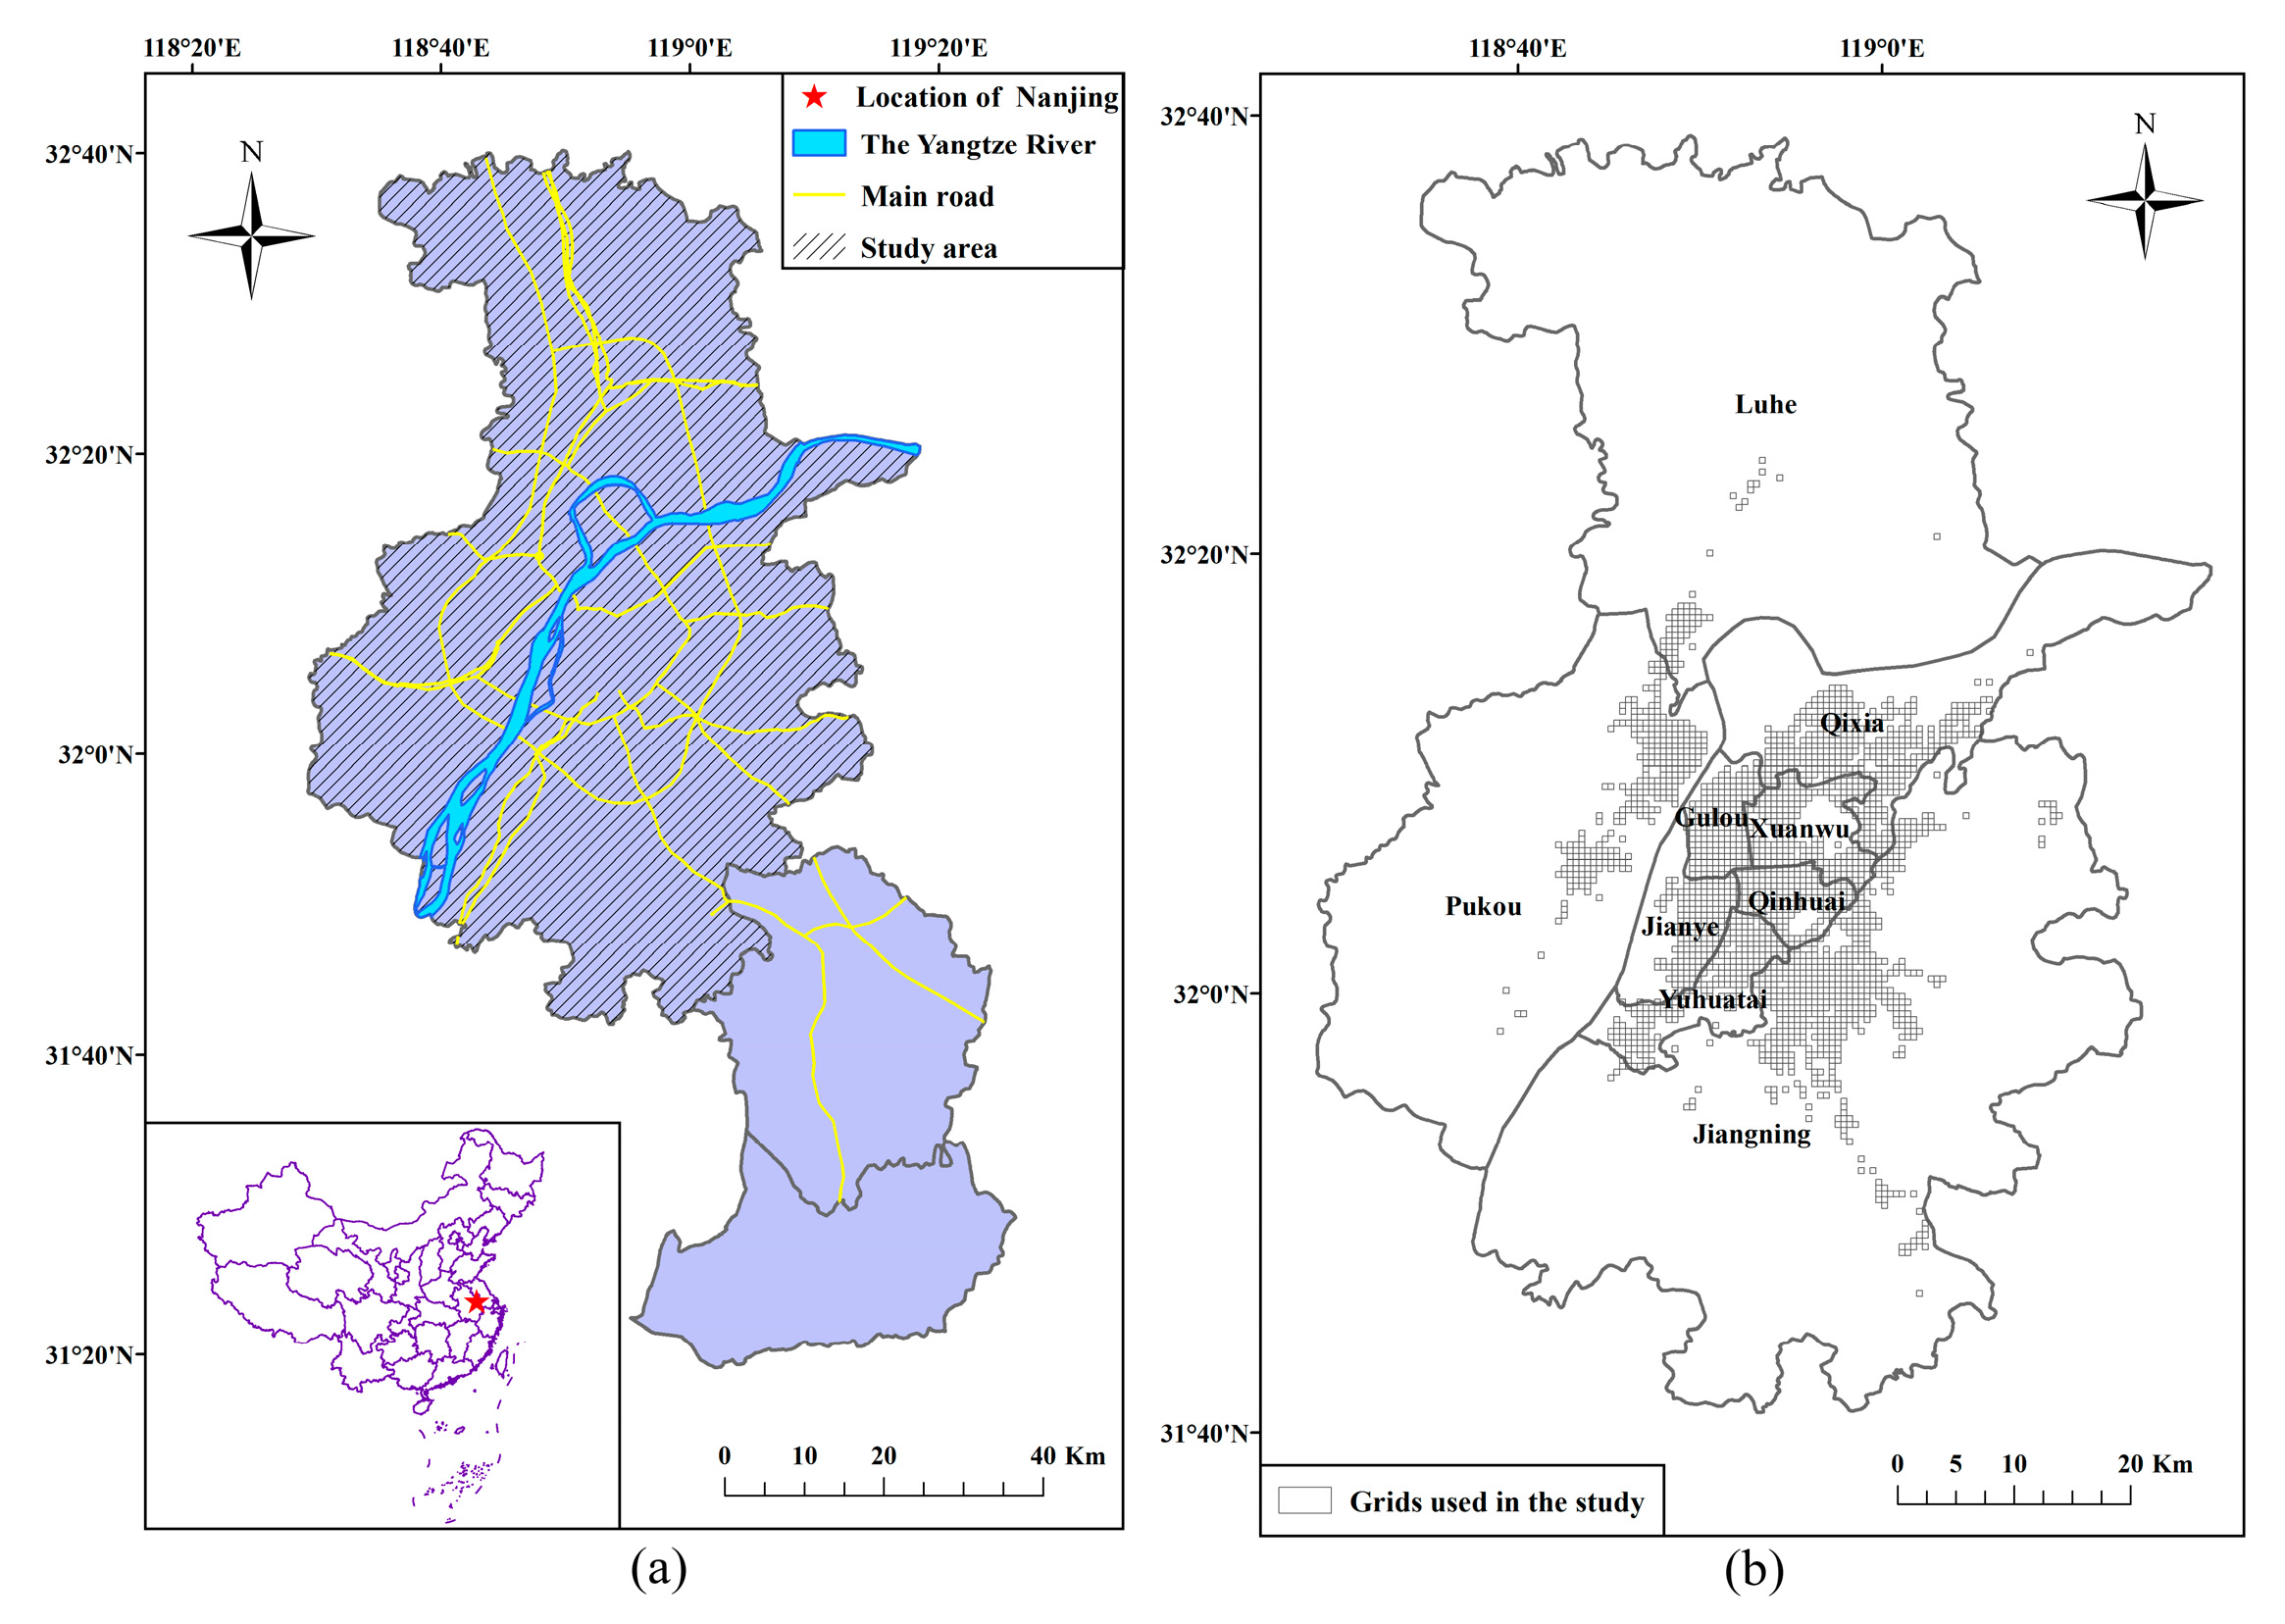
Section 3 introduces a case study using taxi trajectory data from Nanjing. The framework is discussed in Section 4. Section 5 summarizes our study and discusses future work.

2. Method

A flowchart of the framework is shown in Figure 1, and it includes the following three steps and a training process. First, human activity features were extracted from the taxi trajectory data, and then the time series of each feature were built. Next, the FCM method was utilized to cluster the time series of each feature. The centers of land use types were calculated to match cluster centers with land use types, and membership degree was used to construct the membership matrix, which is regarded as the fuzzy evaluation matrix in the FCE method. Finally, the classification results were obtained based on the FCE method. A training process was performed to determine the weight set in the FCE method. The specific implementation was as follows.

2.1. Extracting Features and Constructing Time Series

Different human activity features can be extracted from the same data source. We regard a journey of passengers as a flow from the pick-up point to the drop-off point; then, the pick-up point and drop-off point can represent the outflow and inflow of the region, respectively. The outflow, inflow, net flow ( inflow outflow ) and net flow ratio ( inflow outflow inflow + outflow ) features can be extracted from the taxi trajectory data [43,57]. The construction of the time series is flexible. We can not only aggregate the data into a week or a day [41,42] but also divide a week to obtain greater detail, such as distinguishing human activity patterns on weekdays and weekends [58] and distinguishing human activity patterns on normal workdays, Fridays, Saturdays and Sundays [51]. In addition, the interval of time series can be set as needed, such as 10 minutes or one hour [59,60].
The study area should be divided into various unclassified areas, but the division method can be flexibly selected, such as dividing based on grids or traffic analysis zones (TAZs). For each unclassified region, if F human activity features are extracted, the time series of each feature can be built as
z i 0 = [ N i 1 , N i t , , N i H ] ,
where z i 0 is the unnormalized time series of feature i ( i = 1 , 2 , , F ). N i t is the value of feature i over the period t . H is the dimension. Normalization of the time series is key to ensuring that the classification results correspond well to the land use types [53]. Thus, z i 0 is normalized using Z-score.
z i = z i 0 μ i σ i ( i = 1 , 2 , , F ) ,
where   μ i and σ i are the mean and standard deviation of the time series of feature i , respectively.

2.2. Constructing the Membership Matrix

The time series of each feature are clustered by the FCM algorithm after the construction of time series. The FCM algorithm is chosen because it introduces fuzzy partitioning and membership degree theory in clustering, which allows the unclassified area to simultaneously belong to different land use types [61]. At the same time, the FCM algorithm has a solid theoretical foundation and broad applications [62,63,64].
Given the time series of feature i , the FCM algorithm returns a list of cluster centers v i , j and membership degree u i , j . v i , j is the cluster center j ( j = 1 , , L ), and u i , j is the membership degree of the unclassified area to cluster center j .   L is the number of clusters, which is set to the number of land use types that can be obtained from the land use data of the study area. For each unclassified area, u i , j satisfies the conditions in Equation (3).
j = 1 L u i , j = 1 ( u i , j [ 0 , 1 ] ;   i = 1 , 2 , , F )
To construct the membership matrix for each unclassified region, cluster centers need to be matched with land use types. In this case, u i , j can represent the membership degree of the unclassified region to land use type j when the feature i is utilized for land use classification, and the membership matrix U can be constructed using the membership degree in the clustering results of each feature.
U = ( u 11 u 1 j u i 1 u i j u 1 L u i L u F 1 u F j u F L )
The following steps are achieved to match the cluster centers to land use types. First, the land use data of the study area are divided into a training set and a test set at a ratio of 3:1. The same land use type occupies the same proportion in the two sets. If there are S unclassified areas in the training set, and the number of unclassified areas belonging to land use type j is M j , then S = j = 1 L M j . Next, the center of land use type j is calculated according to Equation (5).
c i , j = 1 M j k = 1 M j z i , j , k ( i = 1 , 2 , , F ; j = 1 , , L ) ,
where z i , j , k is the time series of feature i extracted from the unclassified region   k belonging to land use type j . Finally, the land use type of each cluster center is determined by locating the minimum distance between c i , j and v i , j when the feature i is applied to land use classification.

2.3. Determining land use types

In this step, F features are considered evaluation indices, and L land use types are considered remarks. The evaluation of the unclassified area based on each index constitutes the fuzzy evaluation matrix in the FCE method, and the membership matrix U built in Section 2.2 is used as the fuzzy evaluation matrix to determine the land use type of the unclassified area. The FCE method uses membership degree theory and can comprehensively evaluate objects affected by multiple factors [65], and it has been applied to address classification uncertainty in mineral prospectivity mapping, quality analysis and other fields [66,67,68]. The model of the FCE method can be expressed as
E = W ° U = ( e 1 , e j , , e L ) ,
where E is the evaluation result, and W is the weight set.   W = ( w 1 , w i , , w F ) and satisfies i = 1 F w i = 1 .   w i is the weight of feature i . F is the number of features.   ° is an operator.
The operators often employed in the FCE method include M ( ,   ) , M ( ,   · ) , M ( ,   ) and M ( + ,   · ) . We calculated Equation (6) with M ( + ,   · ) because it can make full use of all evaluation information, and it is a relatively ideal operator [69]. Thus, the evaluation result can be acquired according to Equation (7).
e j = i = 1 F w i u i , j ( j = 1 , , L ) ,
where e j is the membership degree of the unclassified region to land use type j . The land use type is determined according to the principle of maximum membership [70], so the land use type of the unclassified region is set to the land use type corresponding to the largest e j .
The weight set W = ( w 1 , w i , , w F ) is determined by a training process, and the training set has been divided in Section 2.2. If Z n is the nth unclassified area in the training set, G n is the classification result of Z n , and G n is the real land use type, the weight set can be acquired by minimizing the objective function of Equation (8).
f ( W ) = n = 1 S I ( Z n ) ,   and
I ( Z n ) = { 1 , G n G n 0 ,   G n = G n ( n = 1 , , S ) ,
where S is the number of Z n . I ( Z n ) is an indicator function, and I ( Z n ) = 0 when Z n is correctly classified. Otherwise, I ( Z n ) = 1 .

3. Case Study Using Taxi Trajectory Data from Nanjing

The proposed framework was applied to classify land use in Nanjing. The outflow, inflow, net flow and net flow ratio features were extracted from the taxi trajectory data. In studies based on taxi trajectory data, the outflow and inflow features have been integrated for land use classification, but they are rarely combined with other features. In this study, we not only integrated the outflow and inflow features but also fused the net flow and net flow ratio features, respectively, with them. At the same time, the four features were also fused for the land use classification. In the results section, the classification results of the framework based on different feature combinations were compared. A comparative experiment was also conducted to compare the classification results of the framework with other methods.

3.1. Study Area and Data Preparation

Nanjing, a megacity in the Yangtze River Delta, covers an area of 6,587 km2 and governs 11 districts (Figure 2a). In 2016, the resident population was approximately 8.27 million, and the urbanization rate reached 82%. In this study, nine districts (Gulou, Jianye, Qinhuai, Xuanwu, Jiangning, Luhe, Pukou, Qixia and Yuhuatai) were selected as the study area.
The taxi trajectory data (5 December to 25 December 2016) come from the Nanjing Information Center (http://www.njinfo.gov.cn/). Each data entry includes the plate number, record time, longitude and latitude of the taxi location, status (whether carrying passengers) and speed. The record interval is approximately 10–30 s. We extracted pick-up and drop-off points based on the change of status and divided the study area into 500 m × 500 m cells. The resolution was determined through comparative experiments at different resolutions. To ensure that the features in the cells were stable and had statistical significance, cell filtering was necessary. In this study, the total number of pick-up and drop-off points in the reserved cells exceeded 50, and 2114 cells were obtained in Figure 2b. We aggregated the taxi trajectory data to one week and distinguished between weekdays and weekends because human dynamics differ greatly between weekdays and weekends [44,45]. The 1-hour interval, which has been widely used in many studies, was chosen [26,37]. Time series of each feature were also built.
The land use data for 2016 was obtained from the Geographical Information Monitoring Cloud Platform (http://www.dsac.cn/), and it was divided into five land use types: commercial land, residential land, industrial land, open space and others. To facilitate the comparison of the land use data and classification results, the land use data was mapped to cells (Figure 3). The proportion and number of cells per land use type are shown in Table 1. Note that open space includes parks, scenic spots, and occupies a large area, but taxis are not allowed to enter it in most cases. Consequently, the cells located in the open space were deleted because the total number of pick-up points and drop-off points in these cells was too small, meaning that only a small number of open space cells can be used. The land use data was divided into a training set and a test set at a ratio of 3:1, and 528 cells belonging to the test set were used to evaluate the classification results.

3.2. Results

Table 2 shows the classification accuracy of each feature combination. The combination of the outflow and inflow features had an overall accuracy of 0.742, and the kappa coefficient was 0.659. When the net flow and net flow ratio features were added separately, the overall accuracy was enhanced by 0.061 and 0.042, and the kappa coefficient was increased by 0.079 and 0.053, respectively. The classification accuracy achieved 0.858 (Kappa = 0.810) when four features were fused. The classification results were significantly improved. These results demonstrate that the proposed framework can effectively fuse features, and combining the four features can significantly enhance the overall accuracy of land use classification.
The classification results of the feature combinations are displayed in Figure 4. Differences can be seen in the three highlighted typical areas. The confusion matrices are shown in Figure 5. Region #1 belongs to industrial land, but it was misidentified by the combination of the outflow and inflow features (Figure 4a) and the combination of the outflow, inflow and net flow features (Figure 4b). When the net flow ratio feature was combined with the two feature combinations separately, region #1 was correctly classified in Figure 4c,d. Region #2 is a typical open space, and region #3 belongs to others, but both regions were misidentified in Figure 4a,c when applying the outflow and inflow features and applying the outflow, inflow and net flow ratio features. The mixing of open space with others was also obvious in Figure 5a,c. However, this situation was improved in Figure 5b,d when the net flow feature was fused with the two feature combinations separately. Region #2 and region #3 were also correctly identified in Figure 4b,d. As shown in Figure 4d, the classification results based on the four features accurately classified the three typical areas, and the confusion matrix shown in Figure 5d was significantly better than those of the other feature combinations. Thus, it is reasonable to fuse distinct human activity features for land use classification, and fusing the four features based on the proposed framework can improve land use classification.
Table 3 shows the classification accuracies of land use types. Producer’s accuracy indicates the probability that the real land use types in land use data are correctly identified, and user’s accuracy is the probability that the land use types in the classification results are correctly classified. Regarding all the land use types, both the producer’s and user’s accuracies were enhanced when the net flow feature and the net flow ratio feature were combined with the outflow and inflow features, respectively. The highest producer’s and user’s accuracies for each land use type were obtained when applying all the features to the land use classification. The producer’s accuracies of all land use types were higher than 0.735, and the user’s accuracies were above 0.700. The residential and industrial land had higher accuracies than those for commercial land, open space and others, and both the producer’s and user’s accuracies for residential and industrial land exceeded 0.870. The reasons for the differences among the accuracies of the land use types will be discussed in the next section.
The above results prove that the proposed framework can effectively fuse different features and obtain an overall accuracy of 0.858 (Kappa = 0.810). However, the advantages of the framework in land use classification remain to be verified. Thus, we conducted the next experiment. The expectation-maximization (EM) algorithm and a time series spliced by the outflow time series and inflow time series were used to classify land use in Nanjing, referring to the aggregated IS method in the study of Liu et al. [53]. This method was named OI_EM in this study, and it obtained an overall accuracy of 0.720 (Kappa = 0.632), which was lower than the classification accuracy of the proposed framework. Figure 6 shows the classification results based on the OI_EM method and the framework. Differences can be seen in the three highlighted typical areas. The confusion matrix of the OI_EM method is displayed in Figure 7. Table 4 shows the accuracies of the land use types.
As shown in Figure 6, region #1 and region #2 are typical residential land, and region #3 belongs to open space. They were correctly identified by the proposed framework in Figure 6b. Figure 7 shows that residential land was easily confused with commercial land and others when applying the OI_EM method, similar to region #1 and region #2, which were both misidentified in Figure 6a. Many cells were also misclassified as commercial land by the OI_EM method, such as region #3, which belongs to open space. Compared with Figure 7, the mixing of land use types in the confusion matrix of the framework (Figure 5d) was significantly weaker than that of the OI_EM method. For all the land use types, the framework (Experiment D in Table 3) also had higher accuracy than the OI_EM method (Table 4). These comparisons demonstrate the advantages of the framework in land use classification.

4. Discussion

Combining human activity features can help increase the accuracy of urban land use classification [71]. However, feature combination in many studies is limited to two features, and few studies have effectively combined multiple human activity features [50,
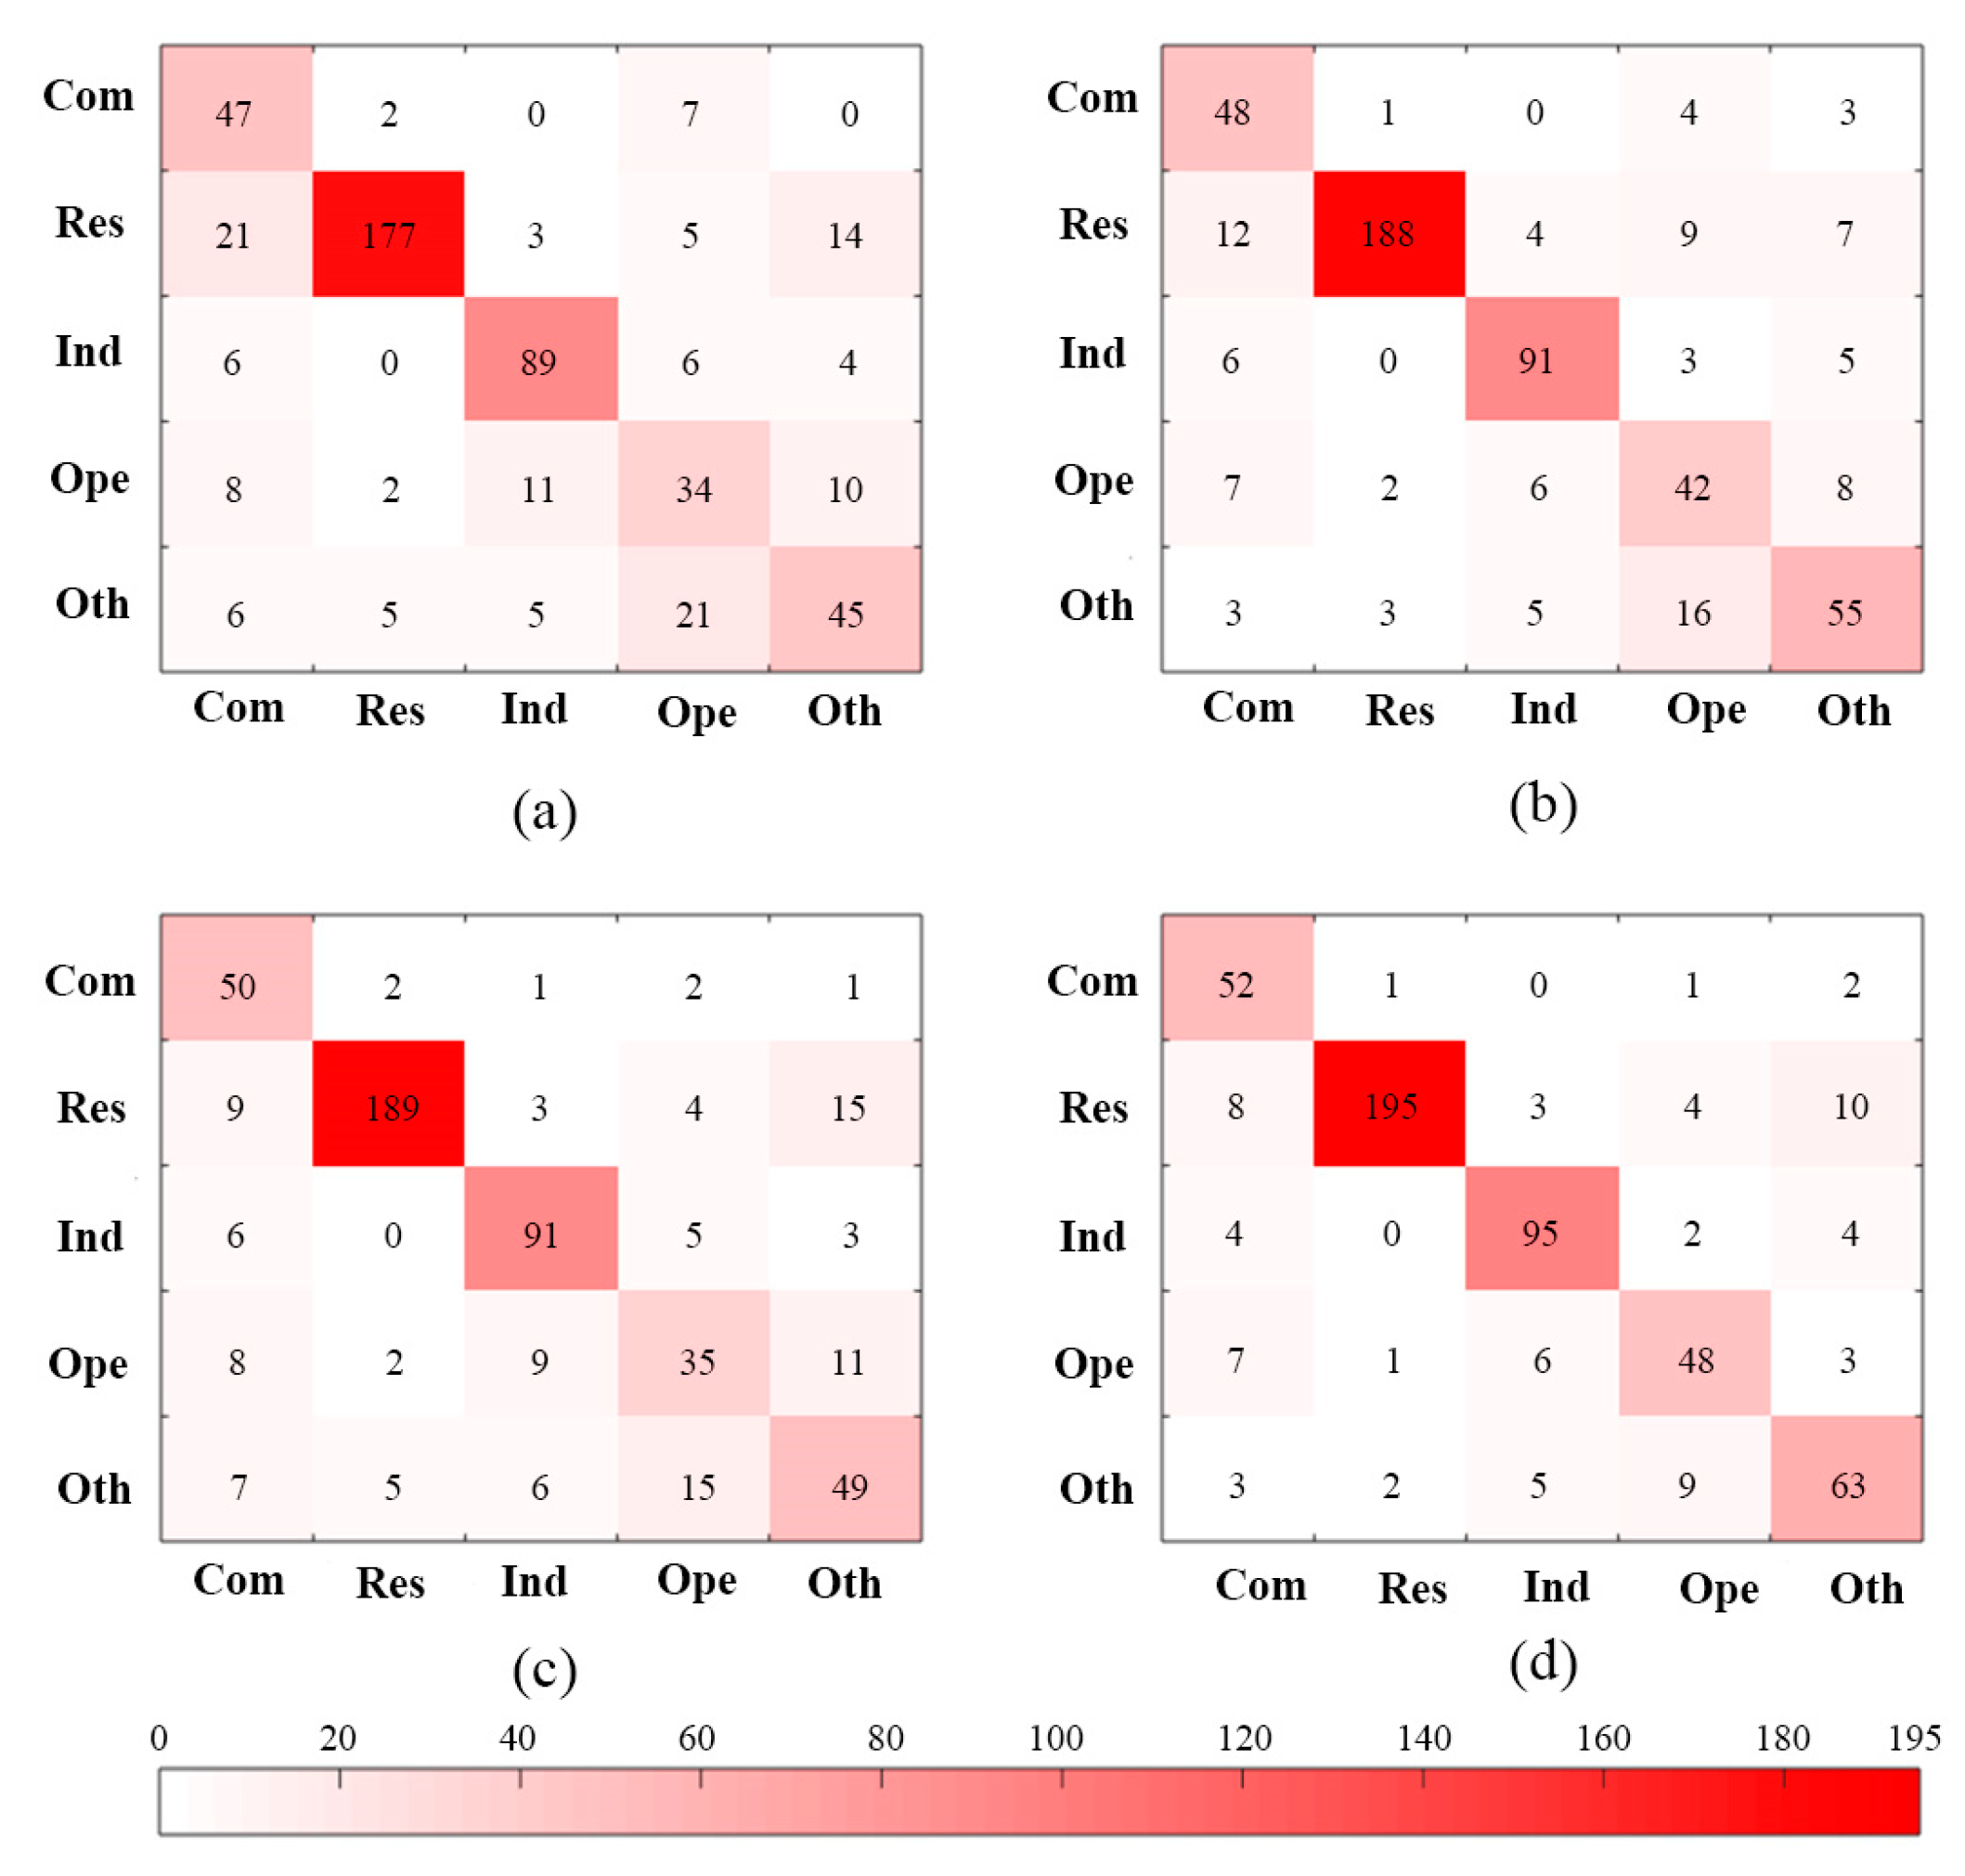
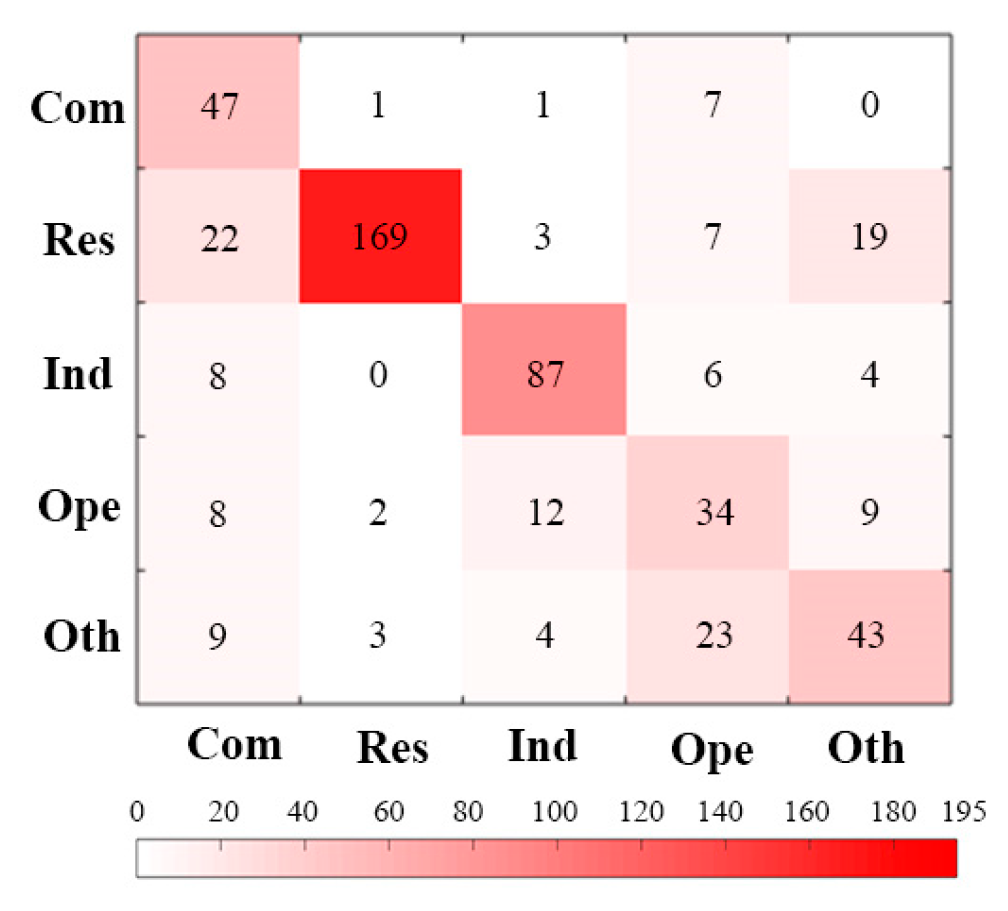
51]. The framework proposed in this paper can provide more information for land use classification by combining multiple human activity features based on the FCM algorithm and the fuzzy comprehensive evaluation (FCE) method, which can obtain better accuracy than the method fusing two features. The classification results in Nanjing indicated that the framework can effectively integrate the outflow, inflow, net flow and net flow ratio features of taxi trajectory data and achieve an accuracy of 0.858 (Kappa = 0.810). At the same time, the framework had higher accuracy than the OI_EM method (OA = 0.720, Kappa = 0.632) that integrated the outflow and inflow features. Therefore, the proposed framework can effectively integrate multiple human activity features and improve land use classification.
In the framework, features participated in the classification process with different weights. The weight sets of feature combinations (Table 5) show that the weights for the inflow feature were larger than those of the outflow feature in all the experiments. In Experiments B and D, using the net flow feature, the weights of the net flow feature exceeded 0.300. To determine the reasons for the different feature weights, we input the four features into the proposed framework, respectively. The classification accuracies of the features in Table 6 show that each feature can be used to identify urban land use types. This finding agrees with previous studies that we can inform the social function of urban areas by using passengers’ pick-up/set-down dynamics [26,52]. The four features had different land use classification accuracies. The net flow feature had the highest accuracy, which was followed by those of the inflow and net flow ratio features, whereas the outflow feature exhibited the poorest accuracy. Therefore, features with high accuracies, such as the inflow and net flow features, almost had large weights in the feature combinations.
By comparing the classification accuracies of features (Table 6) and feature combinations (Table 2 in Section 3.2), the feature combinations were found to have higher accuracies than each feature fused in the combinations, such as Experiment D, which fused the four features (OA = 0.858, Kappa = 0.810) and had a higher accuracy than the outflow (OA = 0.563, Kappa = 0.440), inflow (OA = 0.691, Kappa = 0.593), net flow (OA = 0.741, Kappa = 0.655) and net flow ratio features (OA = 0.636, Kappa = 0.517). This indicates that fusing features based on the proposed framework can increase land use classification accuracy.
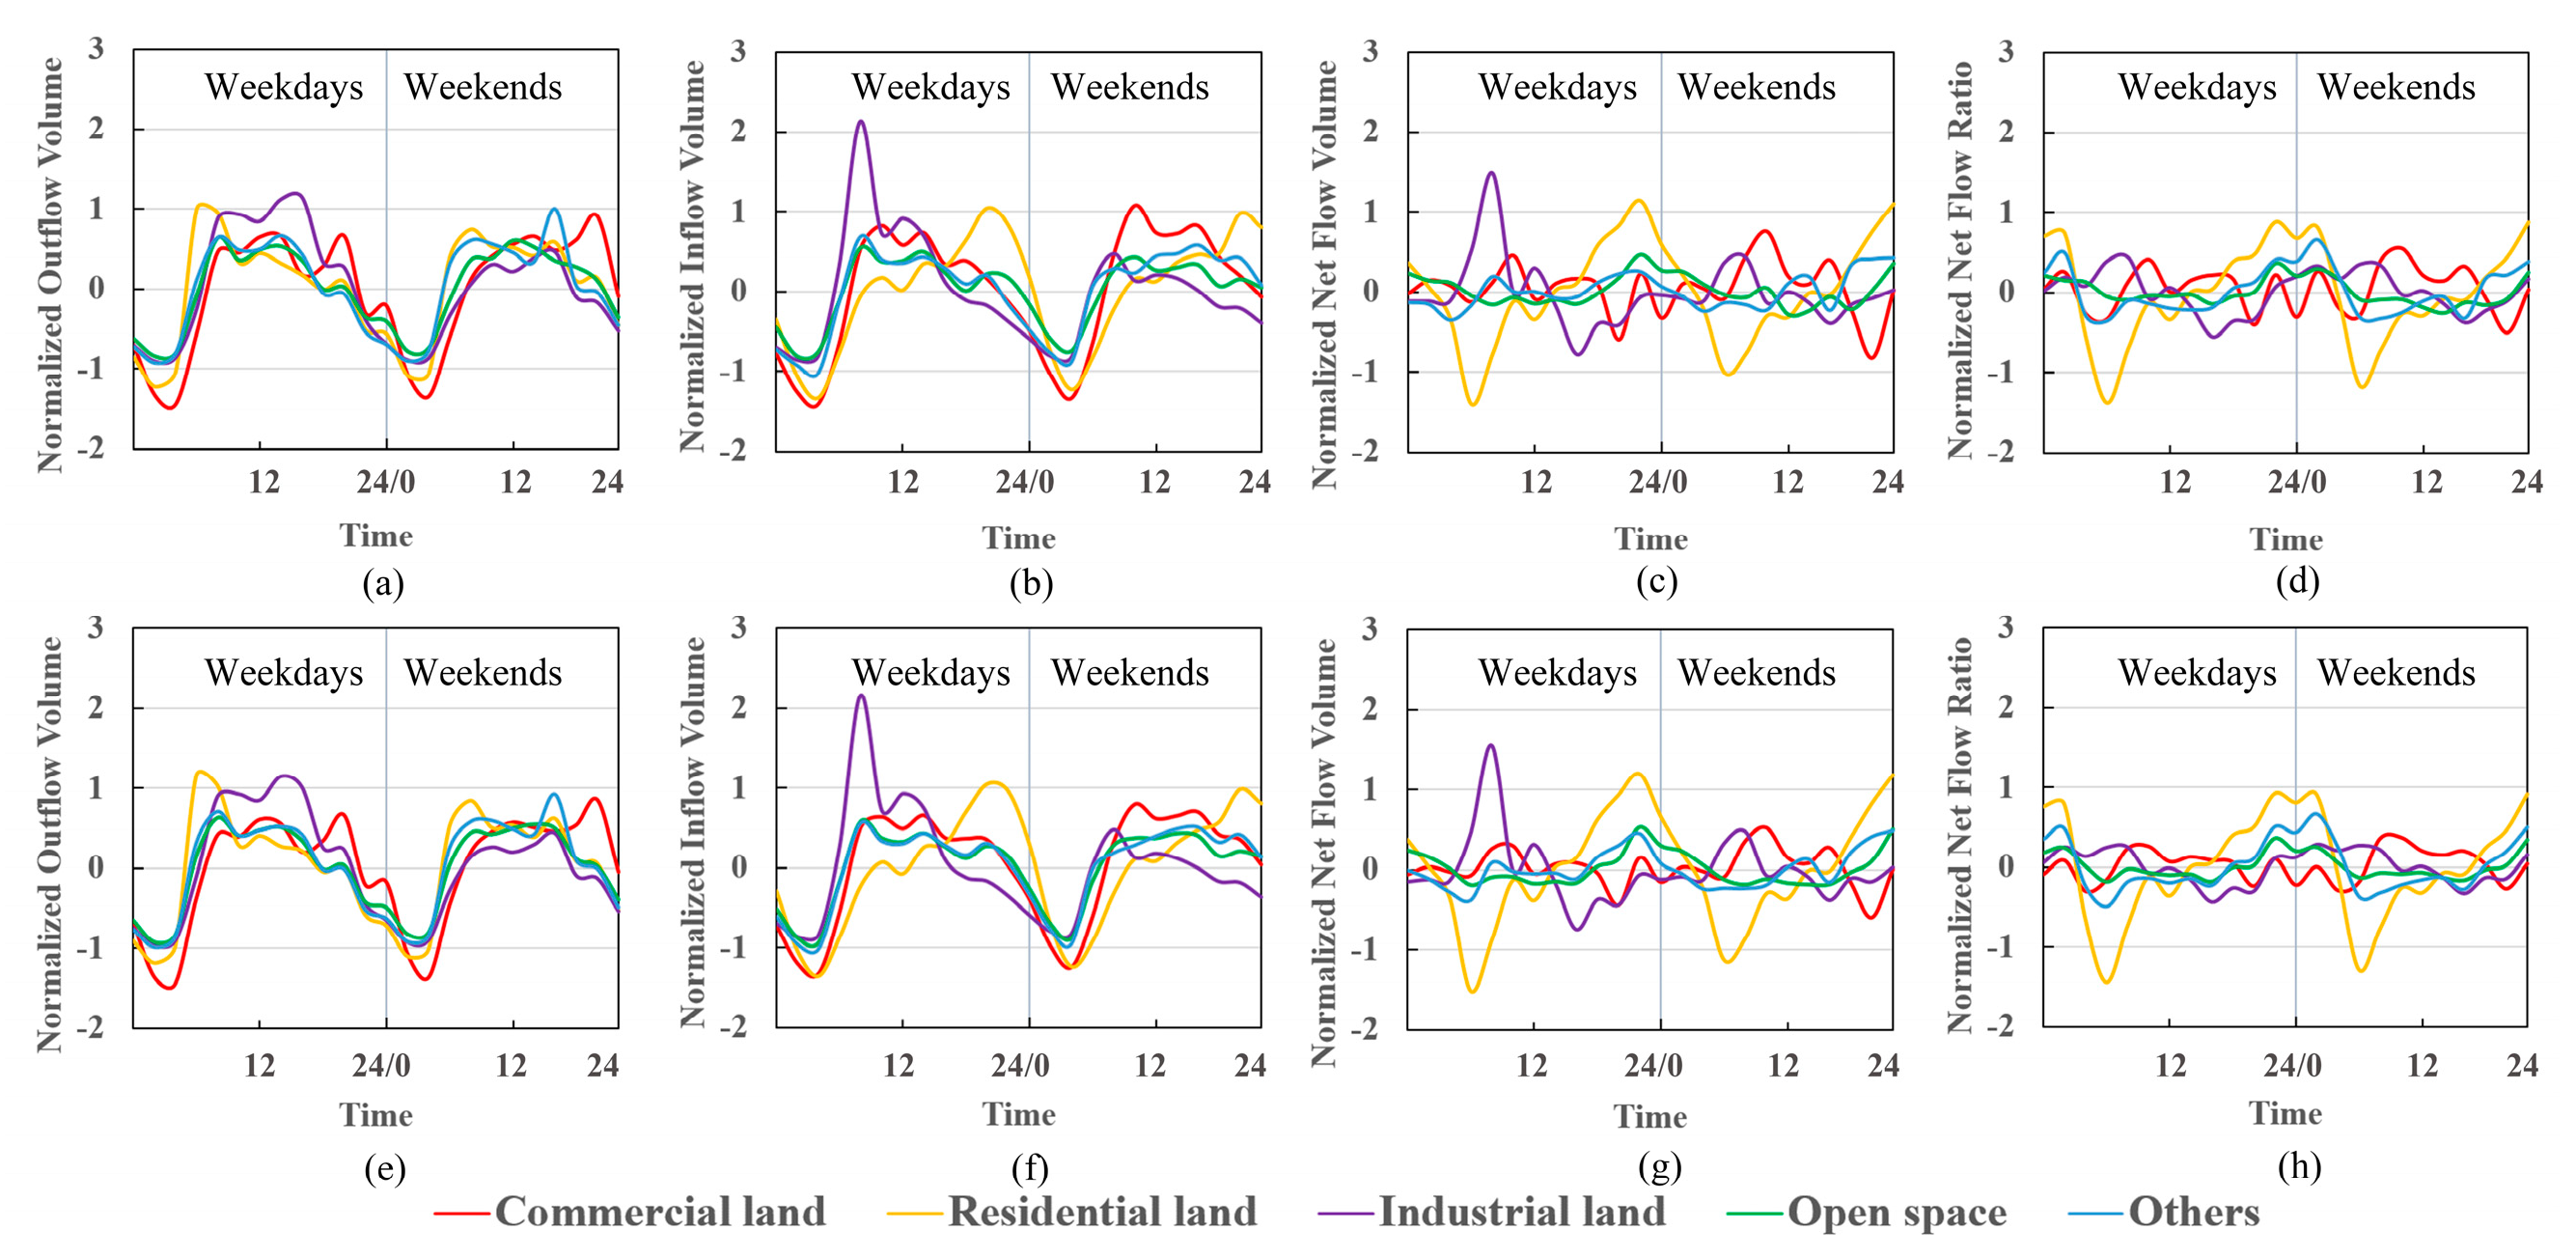
The accuracies of land use types (Table 3 in Section 3.2) show that the framework produced higher classification accuracies for residential and industrial land than for commercial land, open space and others. To determine the reasons, we drew the centers of the land use types and the cluster centers of each feature in Figure 8. Regarding residential and industrial land, the cluster centers are similar to the centers of land use types, and peaks of these curves are obvious. Regarding commercial land, open space and others, the cluster centers are different from the centers of land use types, and the characteristics of these curves are not prominent. At the same time, the curves of open space and others have small differences. Thus, it is difficult to correctly identify commercial land, open space and others.
In addition, some factors affecting the classification accuracy of the framework need to be discussed. First, the FCM algorithm was utilized to cluster the time series of each feature, and its classification accuracy has an important impact on the framework. At present, many studies have improved the FCM algorithm [72,
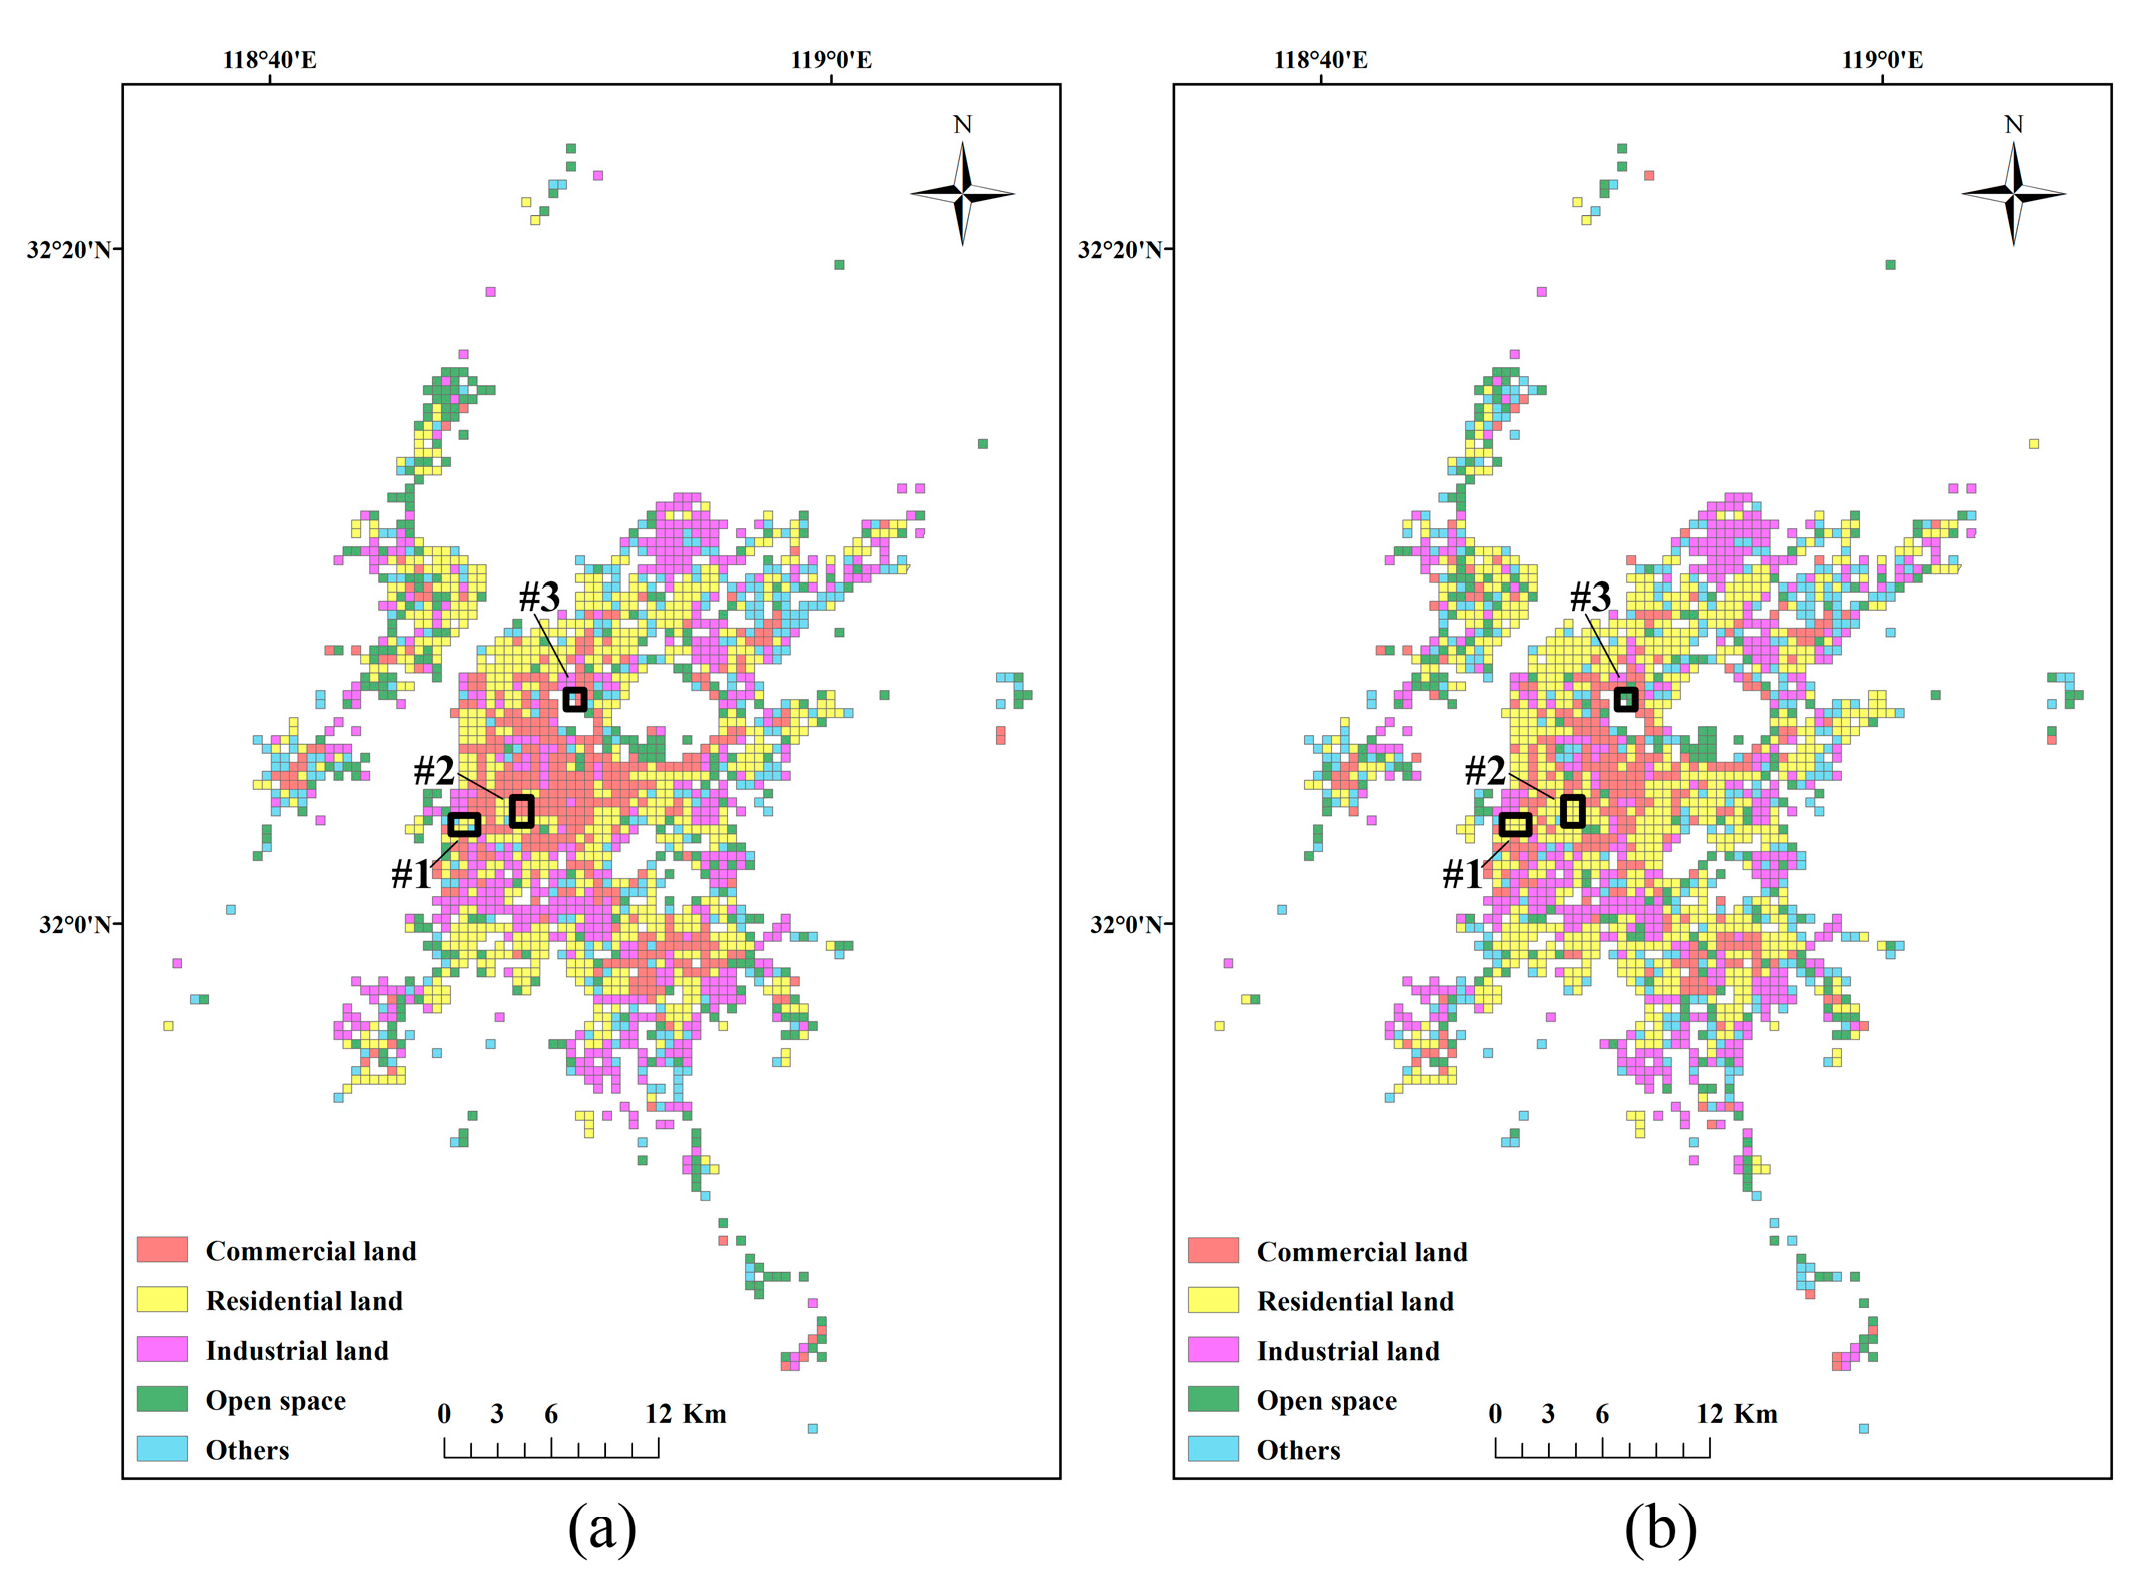
73] and using the improved FCM method, therefore, can help increase the classification accuracy of the framework. Second, the study area was divided into 500 m × 500 m cells in this study, but this division method cannot guarantee the continuity of land use types in cells. The land use types in the cells at the junction of different land use types are highly mixed, which makes it difficult to identify the land use types of these cells. At the same time, we mapped the land use data to cells by calculating the proportion of land use types in the cell and assigning the land use type with the largest proportion to the cell. Highly mixed cells also affect the determination of real land types. The framework supports different division methods, so choosing a better division method can help increase the classification accuracy of the framework.

5. Conclusions

Big data records human activities in urban areas and enables us to infer land use types by considering collective activity features. Fusing different human activity features can provide more information on land use classification. In this study, we proposed an integrated framework to combine multiple features for land use classification. By clustering the time series of each feature with the fuzzy c-means (FCM) clustering method, a membership matrix reflecting the fuzzy relationship between features and land use types was built for each unclassified area. The fuzzy comprehensive evaluation (FCE) method was used to determine the land use type of each unclassified area based on the membership matrix. The results of the case study in Nanjing indicated that the proposed framework can effectively fuse different features and increase the accuracy of land use classification. When applying the outflow, inflow, net flow and net flow ratio features to land use classification, the classification results achieved an overall accuracy of 0.858 (Kappa = 0.810). For all the land use types, the producer’s accuracies were higher than 0.735, and the user’s accuracies exceeded 0.700. Both the producer’s and user’s accuracies for residential and industrial land were higher than 0.870.
The human activity features fused in the framework can come from different data sources, and we can build a membership matrix for each unclassified area based on multisource big data. Some studies have applied multisource data to land use classification and building function identification [74,75,76], so integrating multisource data contributes to land use classification. In the future, we will explore the performance of the framework in fusing multisource data for land use classification.

Author Contributions

Conceptualization, Panpan Ge; Data curation, Panpan Ge and Liwei Zhang; Formal analysis, Panpan Ge, Shuhua Zhang and Liwei Zhang; Funding acquisition, Jiangfeng She; Methodology, Panpan Ge, Jun He, Shuhua Zhang and Jiangfeng She; Resources, Jun He; Supervision, Jun He, Shuhua Zhang and Jiangfeng She; Validation, Panpan Ge and Shuhua Zhang; Visualization, Panpan Ge and Liwei Zhang; Writing – original draft, Panpan Ge; Writing – review & editing, Panpan Ge, Jun He, Shuhua Zhang, Liwei Zhang and Jiangfeng She.

Funding

This research was supported by the National Natural Science Foundation of China under Grant No. 41871293 and Grant No. 41371365.

Acknowledgments

Thanks to Nanjing Information Center, and to Geographical Information Monitoring Cloud Platform, for their valuable data support to our research work. Thanks to the editors and anonymous reviewers for their valuable comments on the manuscript.

Conflicts of Interest

The authors declare no conflicts of interest.

References

  1. Herold, M.; Liu, X.H.; Clarke, K.C. Spatial metrics and image texture for mapping urban land use. Photogramm. Eng. Remote Sens. 2003, 69, 991–1001. [Google Scholar] [CrossRef]
  2. Arsanjani, J.J.; Helbich, M.; Bakillah, M.; Hagenauer, J.; Zipf, A. Toward mapping land-use patterns from volunteered geographic information. Int. J. Geogr. Inf. Sci. 2013, 27, 2264–2278. [Google Scholar] [CrossRef]
  3. Bakillah, M.; Liang, S.H.L.; Zipf, A.; Arsanjani, J.J. Semantic interoperability of sensor data with volunteered geographic information: A unified model. ISPRS Int. J. Geo-Inf. 2013, 2, 766–796. [Google Scholar] [CrossRef]
  4. Arsanjani, J.J. Characterizing, monitoring, and simulating land cover dynamics using GlobeLand30: A case study from 2000 to 2030. J. Environ. Manag. 2018, 214, 66–75. [Google Scholar] [CrossRef] [PubMed]
  5. Brovelli, M.A.; Celino, I.; Fiano, A.; Molinari, M.E.; Venkatachalam, V. A crowdsourcing-based game for land cover validation. Appl. Econ. 2018, 10, 1–11. [Google Scholar] [CrossRef]
  6. Oxoli, D.; Ronchetti, G.; Minghini, M.; Molinari, M.E.; Lotfian, M.; Sona, G.; Brovelli, M.A. Measuring urban land cover influence on air temperature through multiple geo-data-the case of Milan, Italy. ISPRS Int. J. Geo-Inf. 2018, 7, 421. [Google Scholar] [CrossRef]
  7. Liu, Y.; Sui, Z.W.; Kang, C.G.; Gao, Y. Uncovering patterns of inter-urban trip and spatial interaction from social media check-in data. PLoS ONE 2014, 9. [Google Scholar] [CrossRef] [PubMed]
  8. Long, Y.; Shen, Z.J. V-BUDEM: A vector-based Beijing urban development model for simulating urban growth. In Geospatial Analysis to Support Urban Planning in Beijing; Springer International Publishing: Cham, Switzerland, 2015; pp. 91–112. [Google Scholar]
  9. Zhang, X.Y.; Du, S.H. A linear dirichlet mixture model for decomposing scenes: Application to analyzing urban functional zonings. Remote Sens. Environ. 2015, 169, 37–49. [Google Scholar] [CrossRef]
  10. Gong, P.; Howarth, P.J. The use of structural information for improving land-cover classification accuracies at the rural-urban fringe. Photogramm. Eng. Remote Sens. 1990, 56, 67–73. [Google Scholar] [CrossRef]
  11. Fisher, P. The pixel: A snare and a delusion. Int. J. Remote Sens. 1997, 18, 679–685. [Google Scholar] [CrossRef]
  12. Shaban, M.A.; Dikshit, O. Improvement of classification in urban areas by the use of textural features: The case study of Lucknow City, Uttar Pradesh. Int. J. Remote Sens. 2001, 22, 565–593. [Google Scholar] [CrossRef]
  13. Lu, D.S.; Weng, Q.H. Use of impervious surface in urban land-use classification. Remote Sens. Environ. 2006, 102, 146–160. [Google Scholar] [CrossRef]
  14. Wu, S.S.; Qiu, X.M.; Usery, E.L.; Wang, L. Using geometrical, textural, and contextual information of land parcels for classification of detailed urban land use. Ann. Assoc. Am. Geogr. 2009, 99, 76–98. [Google Scholar] [CrossRef]
  15. Weng, Q.H. Remote sensing of impervious surfaces in the urban areas: Requirements, methods, and trends. Remote Sens. Environ. 2012, 17, 34–49. [Google Scholar] [CrossRef]
  16. Hu, T.Y.; Yang, J.; Li, X.C.; Gong, P. Mapping urban land use by using landsat images and open social data. Remote Sens. 2016, 8, 151. [Google Scholar] [CrossRef]
  17. Vanderhaegen, S.; Canters, F. Mapping urban form and function at city block level using spatial metrics. Landsc. Urban Plan. 2017, 167, 399–409. [Google Scholar] [CrossRef]
  18. Zhang, X.Y.; Du, S.H.; Wang, Q. Hierarchical semantic cognition for urban functional zones with VHR satellite images and POI data. ISPRS J. Photogramm. Remote Sens. 2017, 132, 170–184. [Google Scholar] [CrossRef]
  19. Xing, H.F.; Meng, Y. Integrating landscape metrics and socioeconomic features for urban functional region classification. Comput. Environ. Urban Syst. 2018, 72, 134–145. [Google Scholar] [CrossRef]
  20. Boarnet, M.; Crane, R. The influence of land use on travel behavior: Specification and estimation strategies. Transp. Res. A Pol. 2001, 35, 823–845. [Google Scholar] [CrossRef]
  21. Small, K. A.; Song, S. Wasteful commuting: A resolution. J. Polit. Econ. 1992, 100, 888–898. [Google Scholar] [CrossRef]
  22. Giuliano, G.; Small, K.A. Is the journey to work explained by urban structure. Urban Stud. 1993, 30, 1485–1500. [Google Scholar] [CrossRef]
  23. Wang, F.H. Modeling commuting patterns in Chicago in a GIS environment: A job accessibility perspective. Prof. Geogr. 2000, 52, 120–133. [Google Scholar] [CrossRef]
  24. Kim, T.J. Transportation: A Geographical Analysis. J. Am. Plan. Assoc. 2005, 71, 457–458. [Google Scholar]
  25. Gao, S.; Wang, Y.L.; Gao, Y.; Liu, Y. Understanding urban traffic-flow characteristics: A rethinking of betweenness centrality. Environ. Plan. B Urban Anal. City Sci. 2013, 40, 135–153. [Google Scholar] [CrossRef]
  26. Liu, Y.; Wang, F.H.; Xiao, Y.; Gao, S. Urban land uses and traffic ‘source-sink areas’: Evidence from GPS-enabled taxi data in shanghai. Landsc. Urban Plan. 2012, 106, 73–87. [Google Scholar] [CrossRef]
  27. Yuan, J.; Zheng, Y.; Xie, X. Discovering regions of different functions in a city using human mobility and POIs. In Proceedings of the 18th ACM SIGKDD International Conference on Knowledge Discovery and Data Mining, Beijing, China, 12–16 August 2012; pp. 186–194. [Google Scholar] [CrossRef]
  28. Crooks, A.; Pfoser, D.; Jenkins, A.; Croitoru, A.; Stefanidis, A.; Smith, D.; Karagiorgou, S.; Efentakis, A.; Lamprianidis, G. Crowdsourcing urban form and function. Int. J. Geogr. Inf. Sci. 2015, 29, 720–741. [Google Scholar] [CrossRef]
  29. Jiang, S.; Alves, A.; Rodrigues, F.; Ferreira, J.; Pereira, F.C. Mining point-of-interest data from social networks for urban land use classification and disaggregation. Comput. Environ. Urban Syst. 2015, 53, 36–46. [Google Scholar] [CrossRef] [Green Version]
  30. Jenkins, A.; Croitoru, A.; Crooks, A.T.; Stefanidis, A. Crowdsourcing a collective sense of place. PLoS ONE 2016, 11. [Google Scholar] [CrossRef]
  31. Caceres, N.; Benitez, F.G. Supervised land use inference from mobility patterns. J. Adv. Transp. 2018. [Google Scholar] [CrossRef]
  32. Wang, Y.D.; Gu, Y.Y.; Dou, M.X.; Qiao, M.L. Using spatial semantics and interactions to identify urban functional regions. ISPRS Int. J. Geo-Inf. 2018, 7, 130. [Google Scholar] [CrossRef]
  33. Kwan, M.P. Space-time and integral measures of individual accessibility: A comparative analysis using a point-based framework. Geogr. Anal. 1998, 30, 191–216. [Google Scholar] [CrossRef]
  34. Krosche, J.; Boll, S. The xPOI Concept. In Proceedings of the First International Workshop on Location and Context Awareness, Oberpfaffenhofen, Germany, 12–13 May 2005; Springer: Berlin/Heidelberg, Germany, 2005; pp. 113–119. [Google Scholar] [CrossRef]
  35. Yang, Y.; Tian, L.; Anthony, G.O.Y. Zooming into individuals to understand the collective: A review of trajectory-based travel behaviour studies. Travel Behav. Soc. 2014, 1, 69–78. [Google Scholar] [CrossRef]
  36. Liu, Y.; Liu, X.; Gao, S.; Gong, L.; Kang, C.G.; Zhi, Y.; Chi, G.H.; Shi, L. Social sensing: A new approach to understanding our socio-economic environments. Ann. Assoc. Am. Geogr. 2015, 105, 512–530. [Google Scholar] [CrossRef]
  37. Soliman, A.; Soltani, K.; Yin, J.J.; Padmanabhan, A.; Wang, S.W. Social sensing of urban land use based on analysis of Twitter users’ mobility patterns. PLoS ONE 2017, 12. [Google Scholar] [CrossRef] [PubMed]
  38. Mou, N.X.; Zhang, H.C.; Chen, J.; Zhang, L.X.; Dai, H.L. A review on the application research of trajectory data mining in urban cities. J. Geo-Inf. Sci. 2015, 17, 1136–1142. [Google Scholar]
  39. Tang, L.L.; Gao, J.; Ren, C.; Zhang, X.; Yang, X.; Kan, Z.H. Detecting and evaluating urban clusters with spatiotemporal big data. Sensors 2019, 19, 461. [Google Scholar] [CrossRef] [PubMed]
  40. Tang, L.L.; Zou, Q.Q.; Zhang, X.; Ren, C.; Li, Q.Q. Spatio-temporal behavior analysis and pheromone-based fusion model for big trace data. ISPRS Int. J. Geo-Inf. 2017, 6, 151. [Google Scholar] [CrossRef]
  41. Reades, J.; Calabrese, F.; Ratti, C. Eigenplaces: Analysing cities using the space-time structure of the mobile phone network. Environ. Plan. B Plan. Des. 2009, 36, 824–836. [Google Scholar] [CrossRef]
  42. Calabrese, F.; Reades, J.; Ratti, C. Eigenplaces: Segmenting space through digital signatures. IEEE Pervasive Comput. 2010, 9, 78–84. [Google Scholar] [CrossRef]
  43. Qi, G.D.; Li, X.L.; Li, S.J.; Pan, G.; Wang, Z.H.; Zhang, D.Q. Measuring social functions of city regions from large-scale taxi behaviors. IEEE Int. Conf. Pervasive Comput. Commun. Workshops 2011, 384–388. [Google Scholar] [CrossRef]
  44. Soto, V.; Frias-Martinez, E. Automated land use identification using cell-phone records. In Proceedings of the 3rd ACM international workshop on MobiArch, HotPlanet 11, Bethesda, MD, USA, 28 June 2011; pp. 17–22. [Google Scholar] [CrossRef]
  45. Soto, V.; Frias-Martinez, E. Robust land use characterization of urban landscapes using cell phone data. In Proceedings of the 1st Workshop on Pervasive Urban Applications, in Conjunction with 9th International Conference on Pervasive Computing, San Francisco, CA, USA, 12–15 June 2011; pp. 1–8. [Google Scholar]
  46. Frias-Martinez, V.; Frias-Martinez, E. Spectral clustering for sensing urban land use using Twitter activity. Eng. Appl. Artif. Intell. 2014, 35, 237–245. [Google Scholar] [CrossRef] [Green Version]
  47. Zhan, X.Y.; Ukkusuri, S.V.; Zhu, F. Inferring urban land use using large-scale social media check-in data. Netw. Spat. Econ. 2014, 14, 647–667. [Google Scholar] [CrossRef]
  48. Chen, S.L.; Tao, H.Y.; Li, X.L.; Zhuo, L. Discovering urban functional regions using latent semantic information: Spatiotemporal data mining of floating cars GPS data of Guangzhou. Act. Geogr. Sin. 2016, 71, 471–483. [Google Scholar] [CrossRef]
  49. Wang, Y.D.; Wang, T.; Tsou, M.H.; Li, H.; Jiang, W.; Guo, F.Q. Mapping dynamic urban land use patterns with crowdsourced geo-tagged social media (Sina-Weibo) and commercial points of interest collections in Beijing, China. Sustainability 2016, 8, 1202. [Google Scholar] [CrossRef]
  50. Toole, J.L.; Ulm, M.; Bauer, D.; Gonzalez, M.C. Inferring land use from mobile phone activity. In Proceedings of the ACM SIGKDD International Workshop on Urban Computing, Beijing, China, 12 August 2012; pp. 1–8. [Google Scholar] [CrossRef]
  51. Pei, T.; Sobolevsky, S.; Ratti, C.; Shaw, S.L.; Li, T.; Zhou, C. A new insight into land use classification based on aggregated mobile phone data. Int. J. Geogr. Inf. Sci. 2014, 28, 1988–2007. [Google Scholar] [CrossRef] [Green Version]
  52. Pan, G.; Qi, G.D.; Wu, Z.H.; Zhang, D.Q.; Li, S.J. Land-use classification using taxi GPS traces. IEEE Trans. Intell. Transp. Syst. 2013, 14, 113–123. [Google Scholar] [CrossRef]
  53. Liu, X.; Kang, C.G.; Gong, L.; Liu, Y. Incorporating spatial interaction patterns in classifying and understanding urban land use. Int. J. Geogr. Inf. Sci. 2016, 30, 334–350. [Google Scholar] [CrossRef]
  54. Bench-Capon, T.J.M.; Dunne, P.E. Argumentation in artificial intelligence. Artif. Intell. 2007, 171, 619–641. [Google Scholar] [CrossRef] [Green Version]
  55. Wang, X.Q.; Sloan, I.H. Brownian bridge and principal component analysis: Towards removing the curse of dimensionality. IMA J. Numer. Anal. 2007, 27, 631–654. [Google Scholar] [CrossRef]
  56. Muja, M.; Lowe, D.G. Scalable nearest neighbor algorithms for high dimensional data. IEEE Trans. Pattern Anal. Mach. Intell. 2014, 36, 2227–2240. [Google Scholar] [CrossRef]
  57. Guo, D.S.; Zhu, X.; Jin, H.; Gao, P.; Andris, C. Discovering spatial patterns in origin-destination mobility data. Trans. GIS 2012, 16, 411–429. [Google Scholar] [CrossRef]
  58. Reades, J.; Calabrese, F.; Sevtsuk, A.; Ratti, C. Cellular census: Explorations in urban data collection. IEEE Pervasive Comput. 2007, 6, 30–38. [Google Scholar] [CrossRef]
  59. Calegari, G.R.; Carlino, E.; Peroni, D.; Celino, I. Filtering and windowing mobile traffic time series for territorial land use classification. Comput. Commun. 2016, 95, 15–28. [Google Scholar] [CrossRef]
  60. Calegari, G.R.; Celino, I.; Peroni, D. City data dating: Emerging affinities between diverse urban datasets. Inf. Syst. 2016, 57, 223–240. [Google Scholar] [CrossRef]
  61. Bezdek, J.C. Pattern-recognition with fuzzy objective function algorithms. Adv. Appl. Pattern Recognit. 1981, 22, 203–239. [Google Scholar]
  62. Bezdek, J.C.; Ehrlich, R.; Full, W. FCM: The fuzzy c-means clustering algorithm. Comput. Geosci. 1984, 10, 191–203. [Google Scholar] [CrossRef]
  63. Demissie, M.G.; Correia, G.; Bento, C. Analysis of the pattern and intensity of urban activities through aggregate cellphone usage. Transportmetrica A 2015, 11, 502–524. [Google Scholar] [CrossRef]
  64. Wang, G.; Wang, Y.; Liu, L.; Jin, Y.; Zhu, N.; Li, X.; Wang, G.Q.; Chen, G.W. Comprehensive assessment of microbial aggregation characteristics of activated sludge bioreactors using fuzzy clustering analysis. Ecotoxicol. Environ. Saf. 2018, 162, 296–303. [Google Scholar] [CrossRef] [PubMed]
  65. Hounek, L.; Cintula, P. From fuzzy logic to fuzzy mathematics: A methodlological manifesto. Fuzzy Sets Syst. 2006, 157, 642–646. [Google Scholar] [CrossRef]
  66. Zuo, R.G.; Cheng, Q.M.; Agterberg, F.P. Application of a hybrid method combining multilevel fuzzy comprehensive evaluation with asymmetric fuzzy relation analysis to mapping prospectivity. Ore Geol. Rev. 2009, 35, 101–108. [Google Scholar] [CrossRef]
  67. Zhang, Q.W.; Zhang, Y.Z.; Zhong, M. A cloud model based approach for multi-hierarchy fuzzy comprehensive evaluation of reservoir-induced seismic risk. J. Hydraul. Eng. 2014, 45, 87–95. [Google Scholar] [CrossRef]
  68. Wei, X.; Luo, X.F.; Li, Q.; Zhang, J.; Xu, Z. Online comment-based hotel quality automatic assessment using improved fuzzy comprehensive evaluation and fuzzy cognitive map. IEEE Trans. Fuzzy Syst. 2015, 23, 72–84. [Google Scholar] [CrossRef]
  69. Liu, P.Y.; Wu, M.D. Fuzzy Theory and Its Application; National University of Defence Technology Press: Changsha, China, 1998. [Google Scholar]
  70. Jia, X.; Lu, Y. Fuzzy Information Processing; National University of Defence Technology Press: Changsha, China, 1996. [Google Scholar]
  71. Liu, X.P.; Niu, N.; Liu, X.J.; Jin, H.; Ou, J.P.; Jiao, L.M.; Liu, Y.L. Characterizing mixed-use buildings based on multi-source big data. Int. J. Geogr. Inf. Sci. 2018, 32, 738–756. [Google Scholar] [CrossRef]
  72. Shamshirband, S.; Amini, A.; Anuar, N.B.; Kiah, M.L.M.; Teh, Y.W.; Furnell, S. D-FICCA: A density-based fuzzy imperialist competitive clustering algorithm for intrusion detection in wireless sensor networks. Measurement 2014, 55, 212–226. [Google Scholar] [CrossRef]
  73. Guo, Q.; Li, C.; Quan, G.Q. Mixing matrix estimation of underdetermined blind source separation based on data field and improved FCM clustering. Symmetry 2018, 10, 21. [Google Scholar] [CrossRef]
  74. Jendryke, M.; Balz, T.; Mcclure, S.C.; Liao, M. Putting people in the picture: Combining big location-based social media data and remote sensing imagery for enhanced contextual urban information in Shanghai. Comput. Environ. Urban Syst. 2017, 62, 99–112. [Google Scholar] [CrossRef] [Green Version]
  75. Liu, X.P.; He, J.L.; Yao, Y.; Zhang, J.B.; Liang, H.L.; Wang, H.; Hong, Y. Classifying urban land use by integrating remote sensing and social media data. Int J Geogr Inf Sci. 2017, 31, 1675–1696. [Google Scholar] [CrossRef]
  76. Niu, N.; Liu, X.P.; Jin, H.; Ye, X.Y.; Liu, Y.; Li, X.; Chen, Y.M.; Li, S.Y. Integrating multi-source big data to infer building functions. Int. J. Geogr. Inf. Sci. 2017, 31, 1871–1890. [Google Scholar] [CrossRef]
Figure 1. Flowchart of the proposed framework.
Ijgi 08 00090 g001
Figure 2. Study area. (a) Geographical location of Nanjing; (b) Study area divided into 500 m × 500 m cells.
Ijgi 08 00090 g002
Figure 3. Land use in Nanjing.
Ijgi 08 00090 g003
Figure 4. Classification results of feature combinations. (a) Outflow and inflow features; (b) outflow, inflow and net flow features; (c) outflow, inflow and net flow ratio features; (d) outflow, inflow, net flow and net flow ratio features.
Ijgi 08 00090 g004
Figure 5. Confusion matrices of feature combinations. (a) Outflow and inflow features; (b) outflow, inflow and net flow features; (c) outflow, inflow and net flow ratio features; (d) outflow, inflow, net flow and net flow ratio features.
Ijgi 08 00090 g005
Figure 6. Classification results based on different methods. (a) The method using the EM algorithm and the time series that integrates the outflow and inflow features (OI_EM method); (b) framework in this study.
Ijgi 08 00090 g006
Figure 7. Confusion matrix of the OI_EM method.
Ijgi 08 00090 g007
Figure 8. Centers of land use types and clusters centers. (a)–(d) Centers of land use types; (e)–(h) cluster centers.
Ijgi 08 00090 g008
Table 1. Proportion and number of cells per land use type.
Commercial landResidential landIndustrial landOpen spaceOthers
Number226878421261328
Proportion0.1070.4150.1990.1240.155
Table 2. Classification accuracy of feature combinations.
Exp.Outflow Inflow Net flowNet flow ratioOAKappa
A 0.7420.659
B 0.8030.738
C 0.7840.712
D0.8580.810
1 OA is overall accuracy
Table 3. Classification accuracies of land use types based on different feature combinations.
Land use types Feature combinations
ABCD
Commercial landPA0.8390.8570.8930.929
UA0.5340.6320.6250.703
Residential landPA0.8050.8550.8590.886
UA0.9520.9690.9550.980
Industrial landPA0.8480.8670.8670.905
UA0.8240.8580.8270.872
Open spacePA0.5230.6460.5380.738
UA0.4660.5680.5740.750
OthersPA0.5490.6710.5980.768
UA0.6160.7050.6200.768
1 PA represents the producer’s accuracy; UA represents the user’s accuracy.
Table 4. Classification accuracy of land use types based on the OI_EM method.
Commercial landResidential landIndustrial landOpen spaceOthers
PA0.8390.7680.8290.5230.524
UA0.5000.9660.8130.4420.573
1 PA represents the producer’s accuracy; UA represents the user’s accuracy.
Table 5. Weight sets of feature combinations.
Exp.Feature combinationsWeight sets
OutflowInflowNet flowNet flow ratio w o u t w i n w n e t w n r
A 0.3500.650
B 0.2300.4000.370
C 0.2400.380 0.380
D0.2100.3200.3100.160
Table 6. Classification accuracies of features.
Outflow Inflow Net flow Net flow ratio
OA0.5630.6910.7410.636
Kappa0.4400.5930.6550.517
1 OA is overall accuracy.

