Using Social Media to Mine and Analyze Public Sentiment during a Disaster: A Case Study of the 2018 Shouguang City Flood in China


Abstract
:1. Introduction
2. Data and Methods
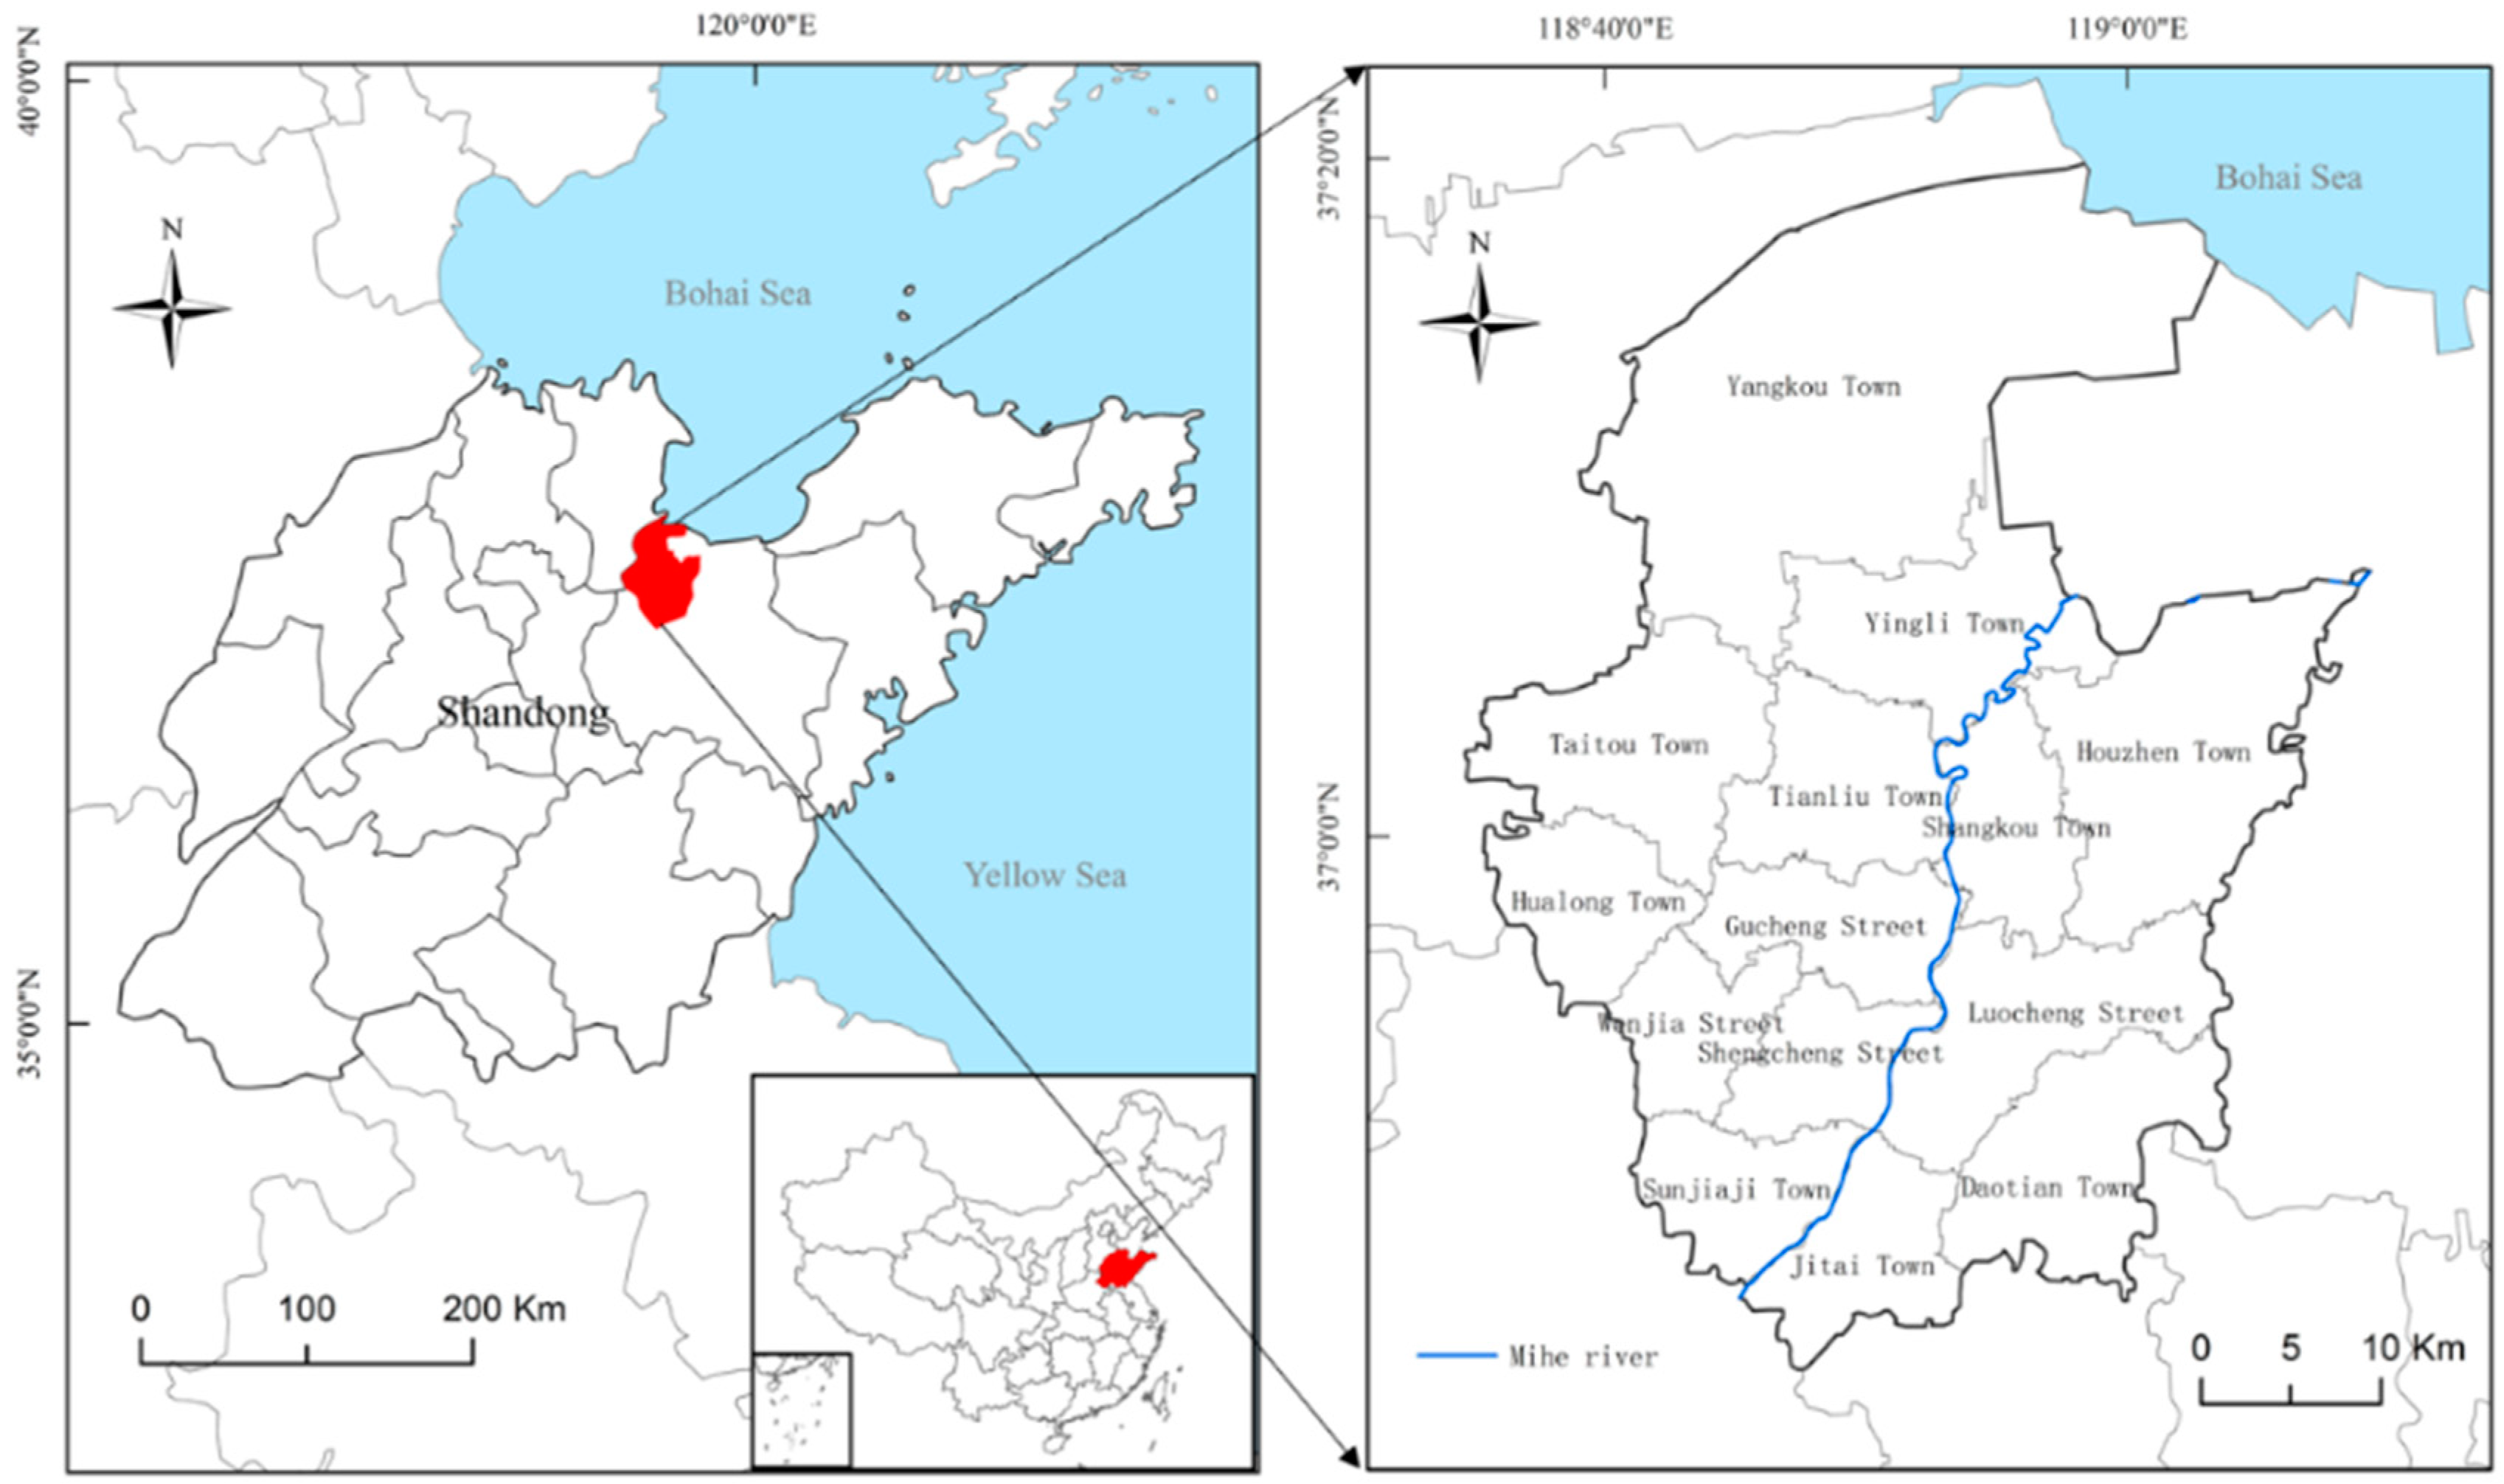
2.1. Study Area
2.2. Data and Pre-Processing
2.3. Method
2.3.1. Time Series Analysis
2.3.2. Topic Extraction and Classification
2.3.3. Evaluation of Results
3. Results
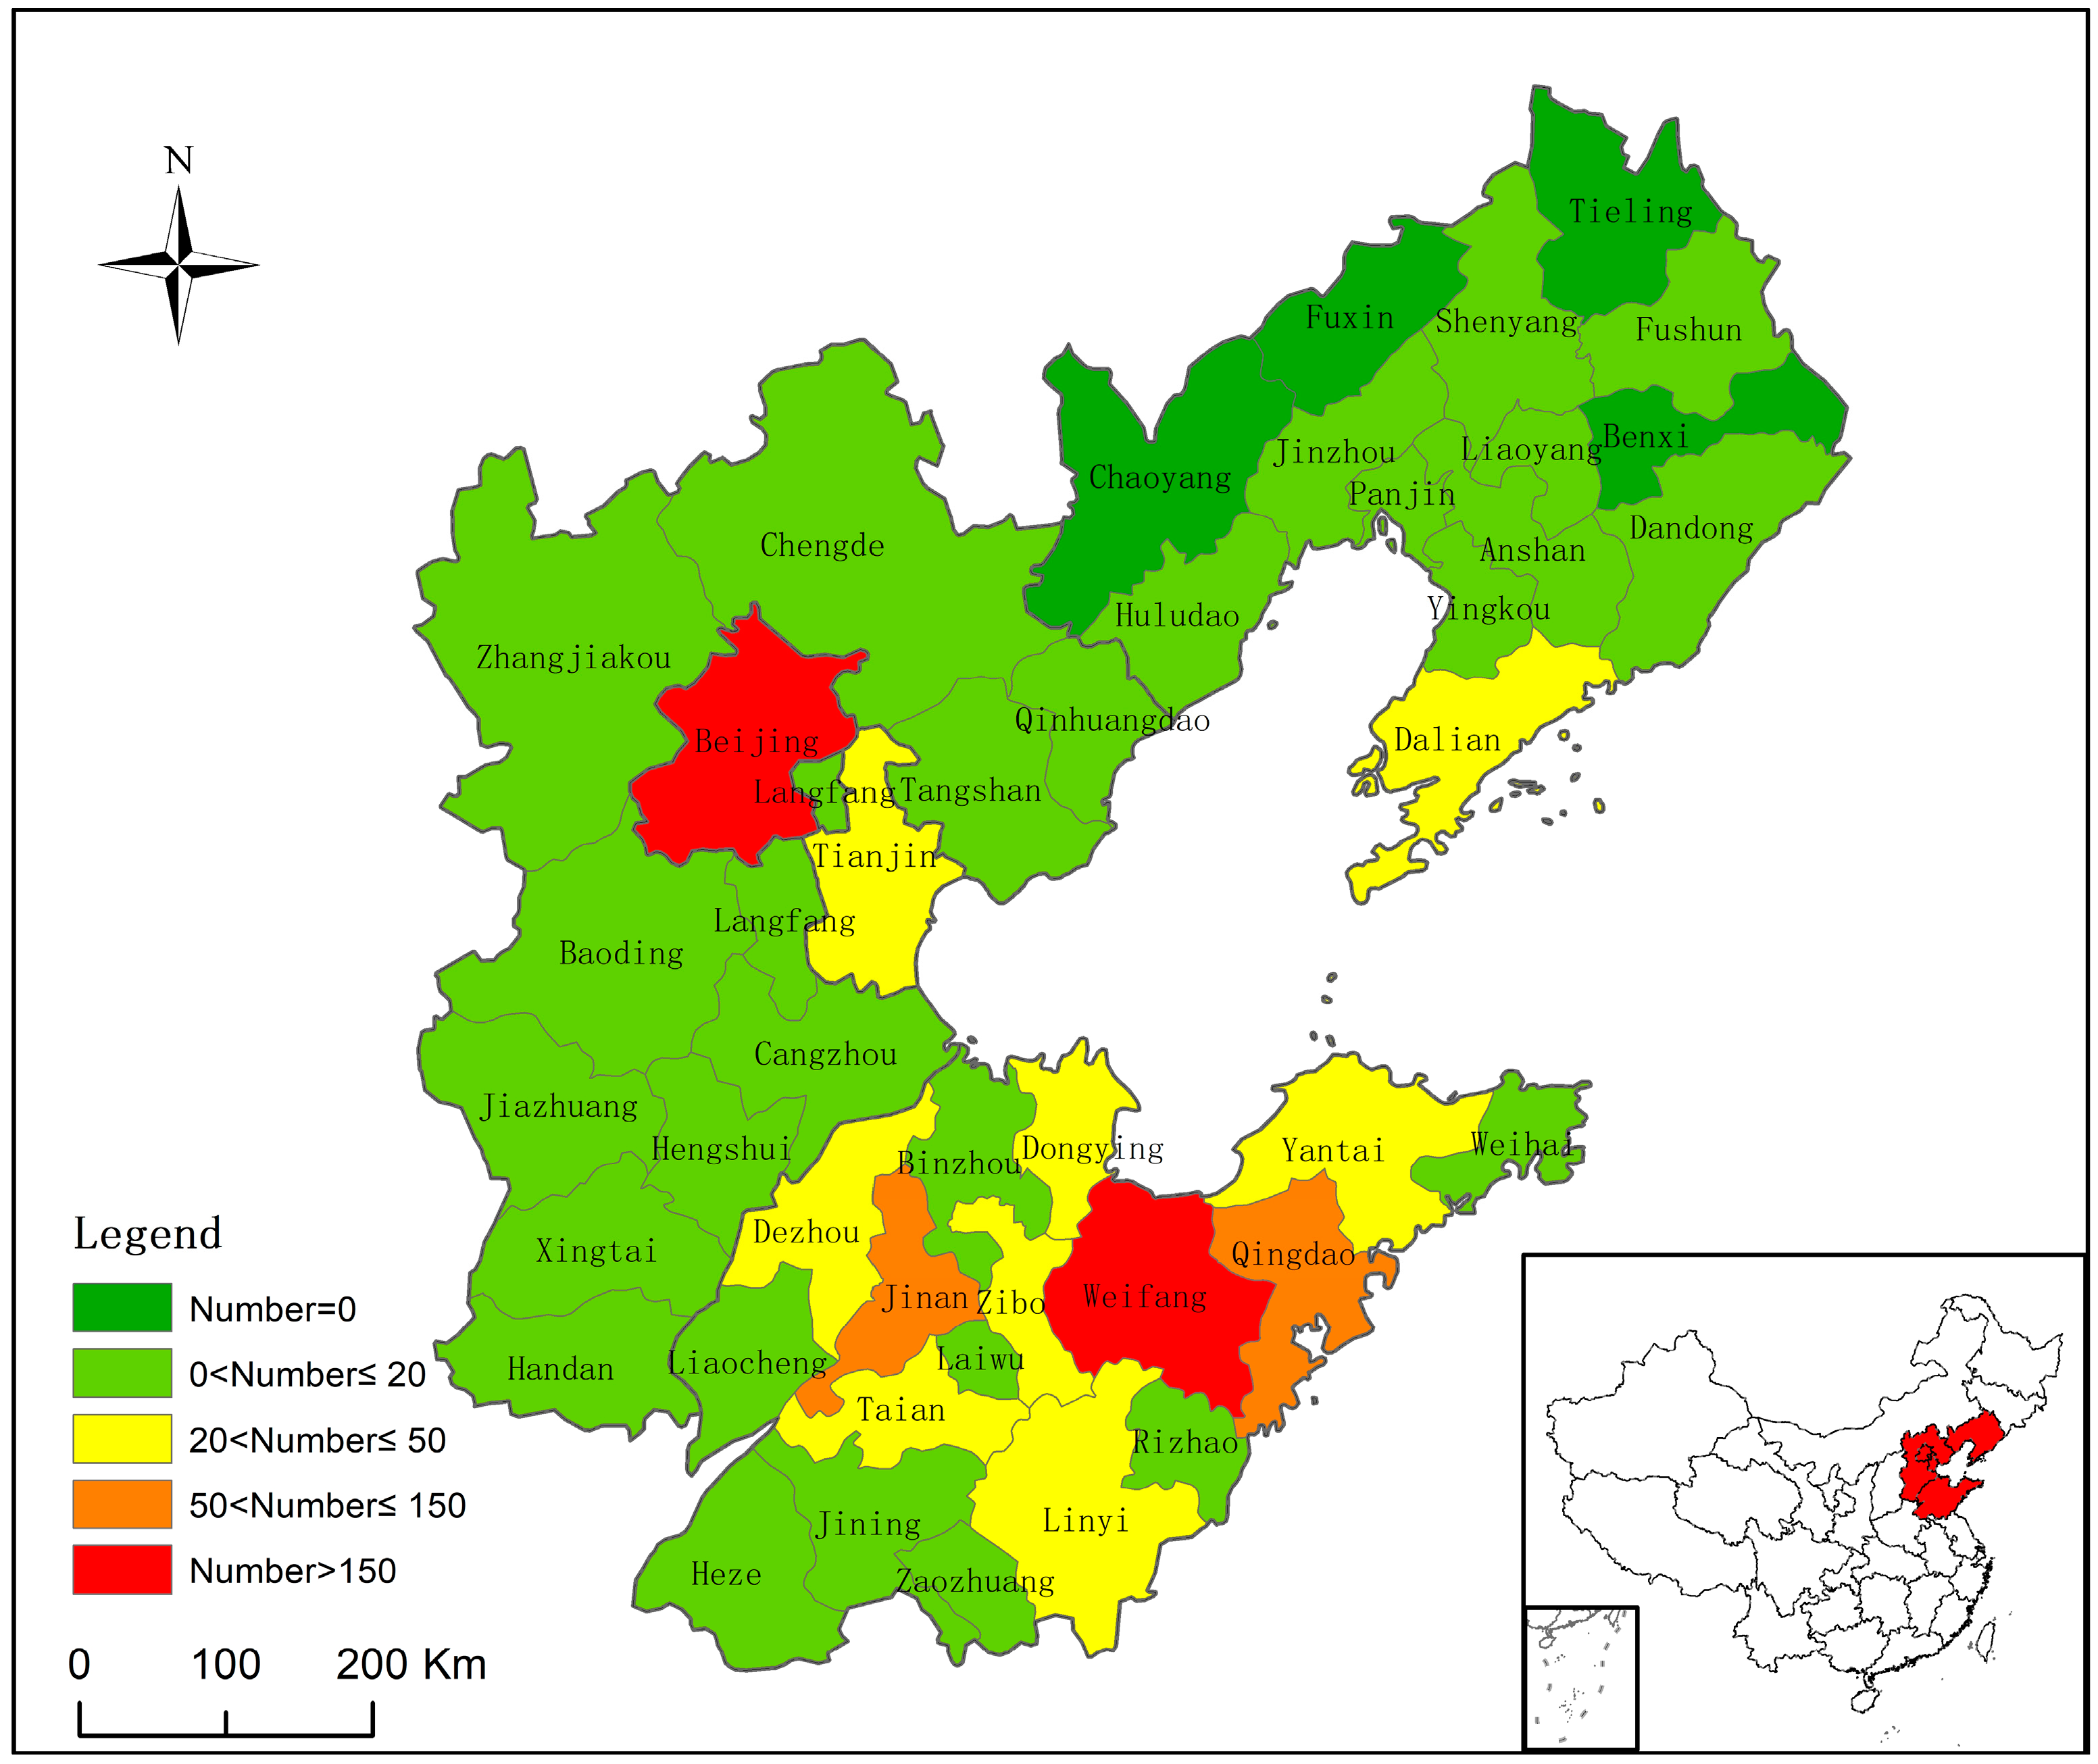
3.1. Spatial-Temporal Analysis
3.2. Topic Analysis
3.2.1. Topic description
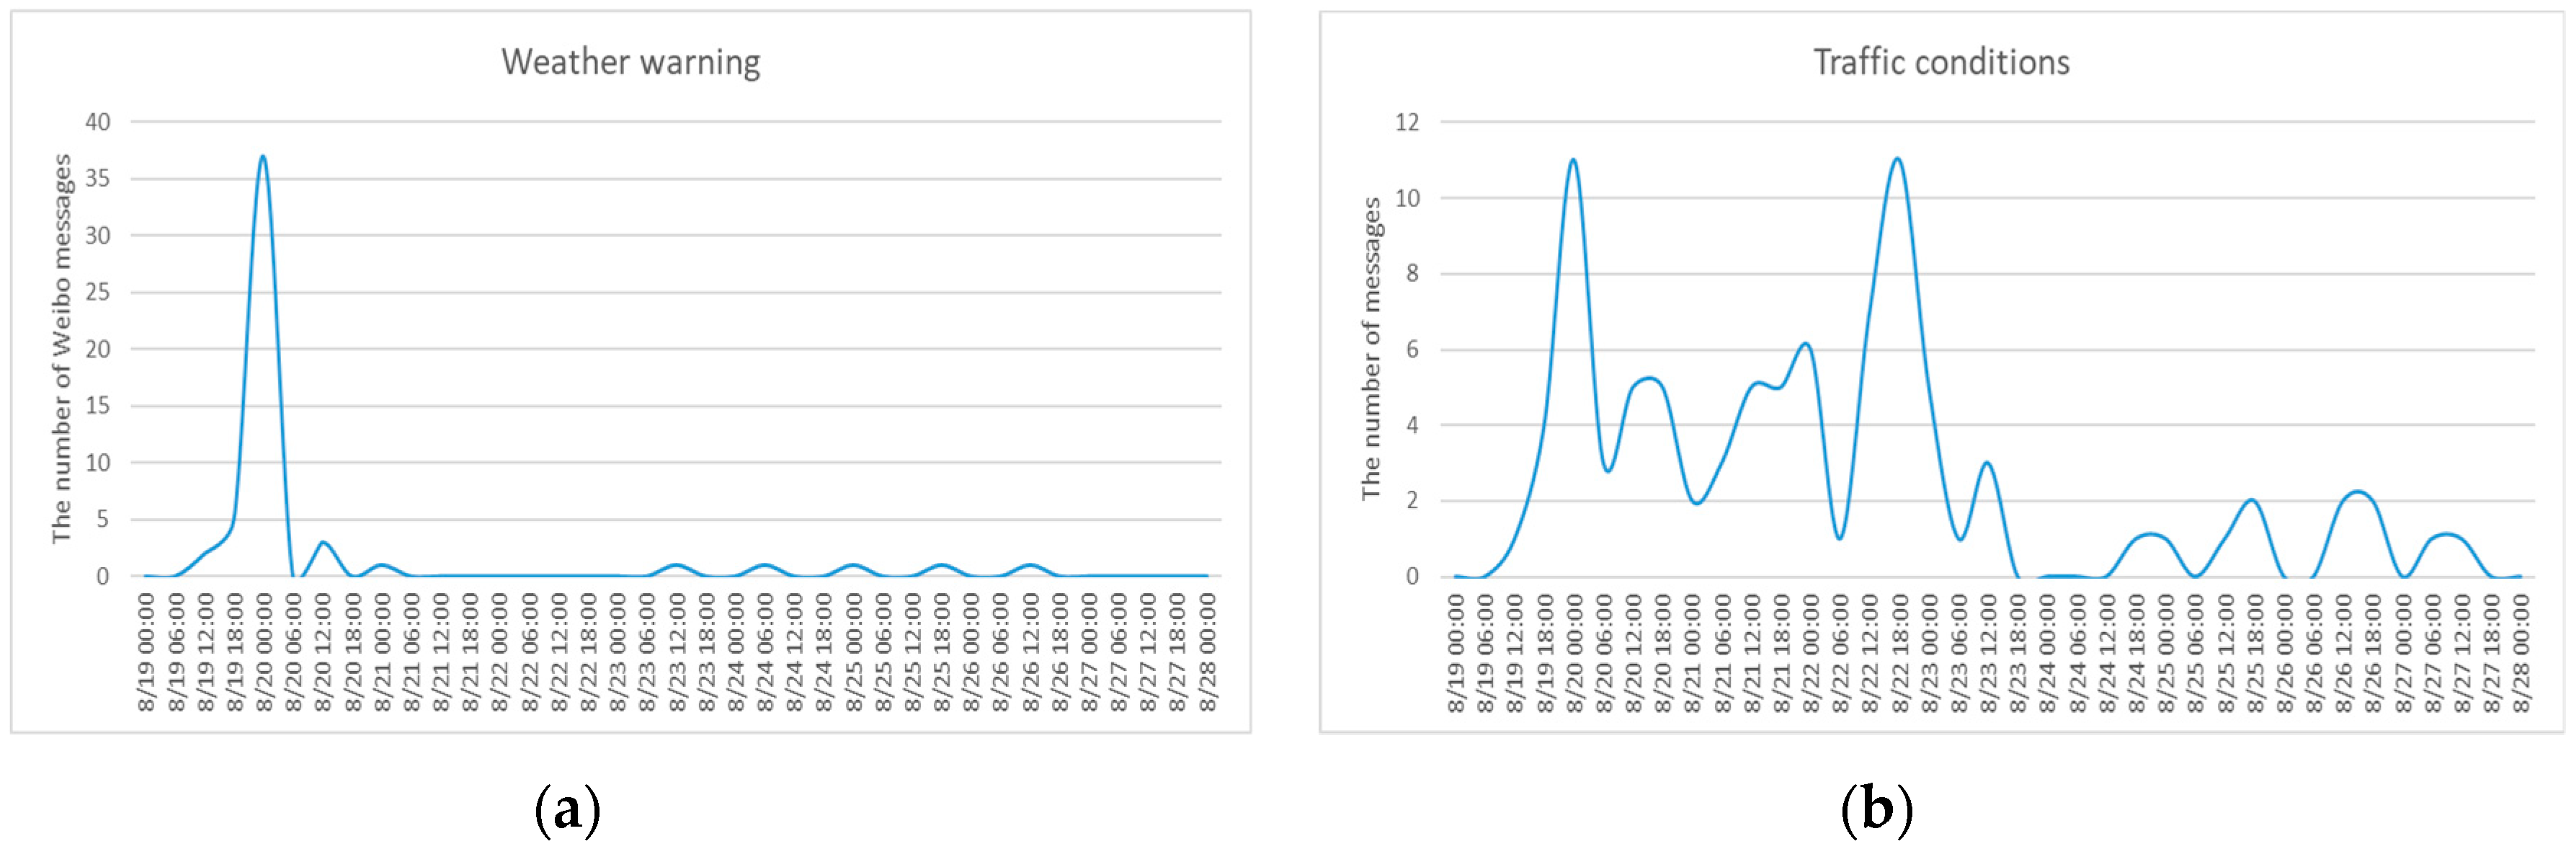
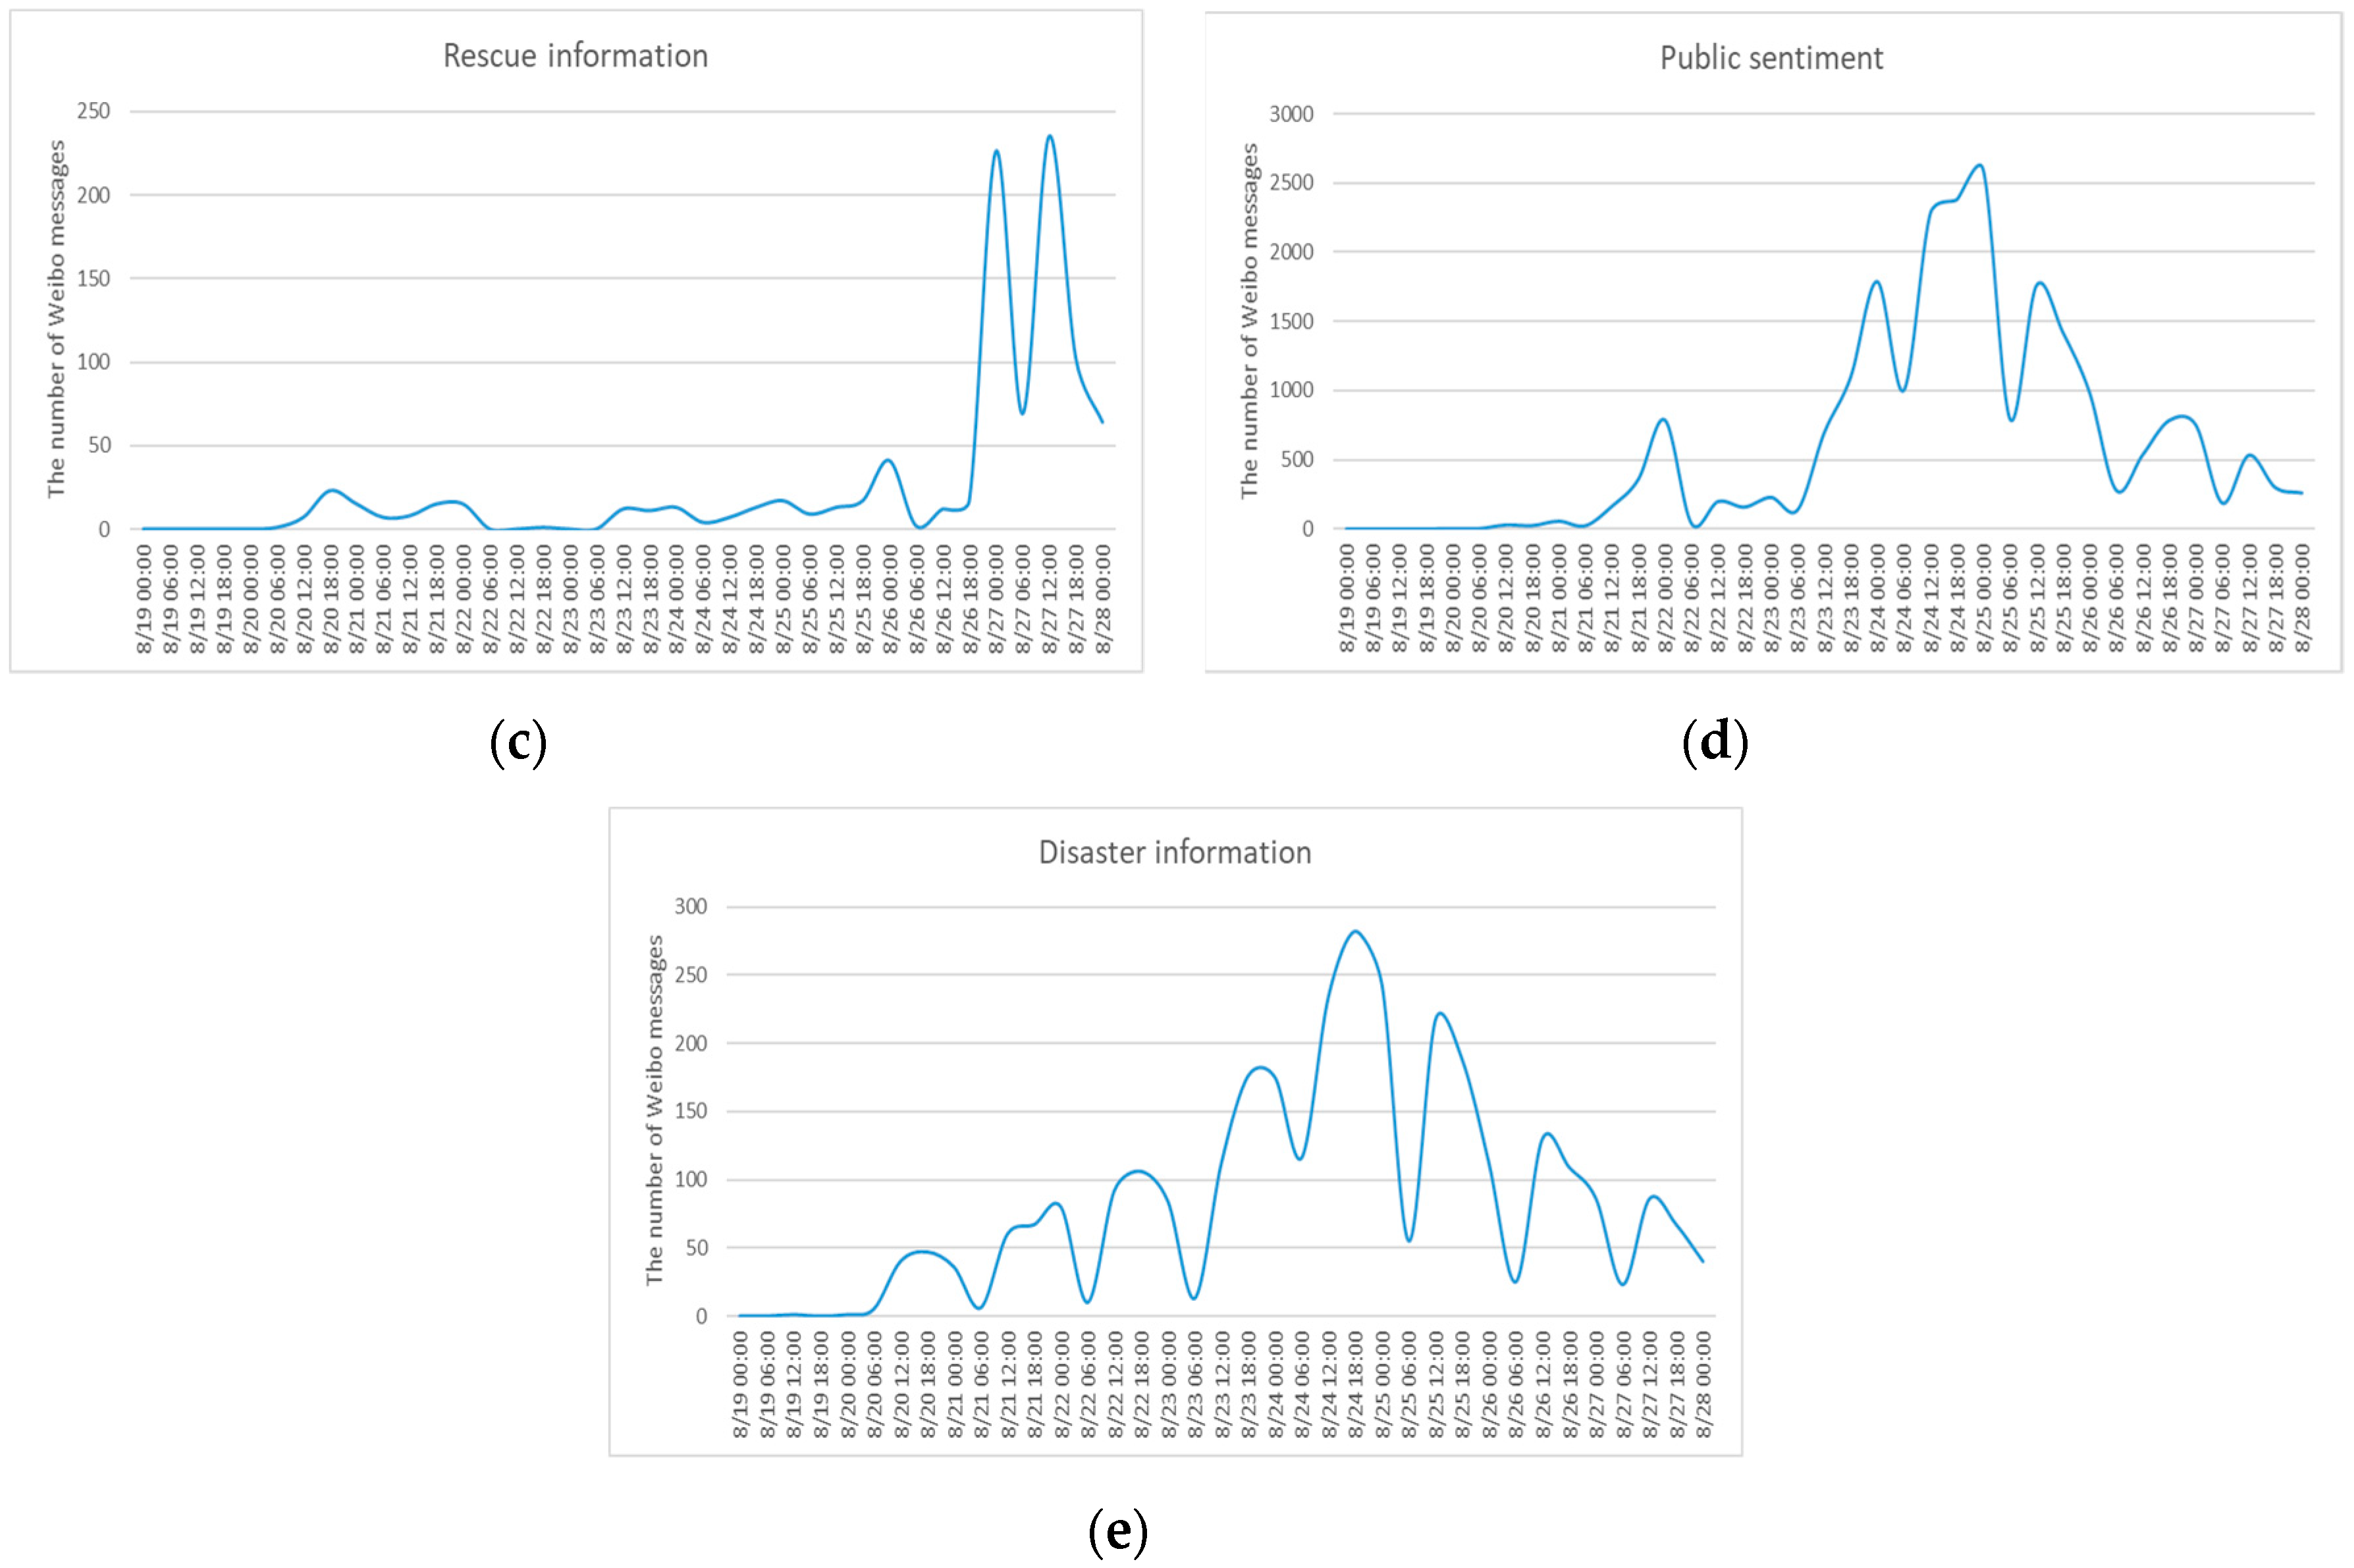
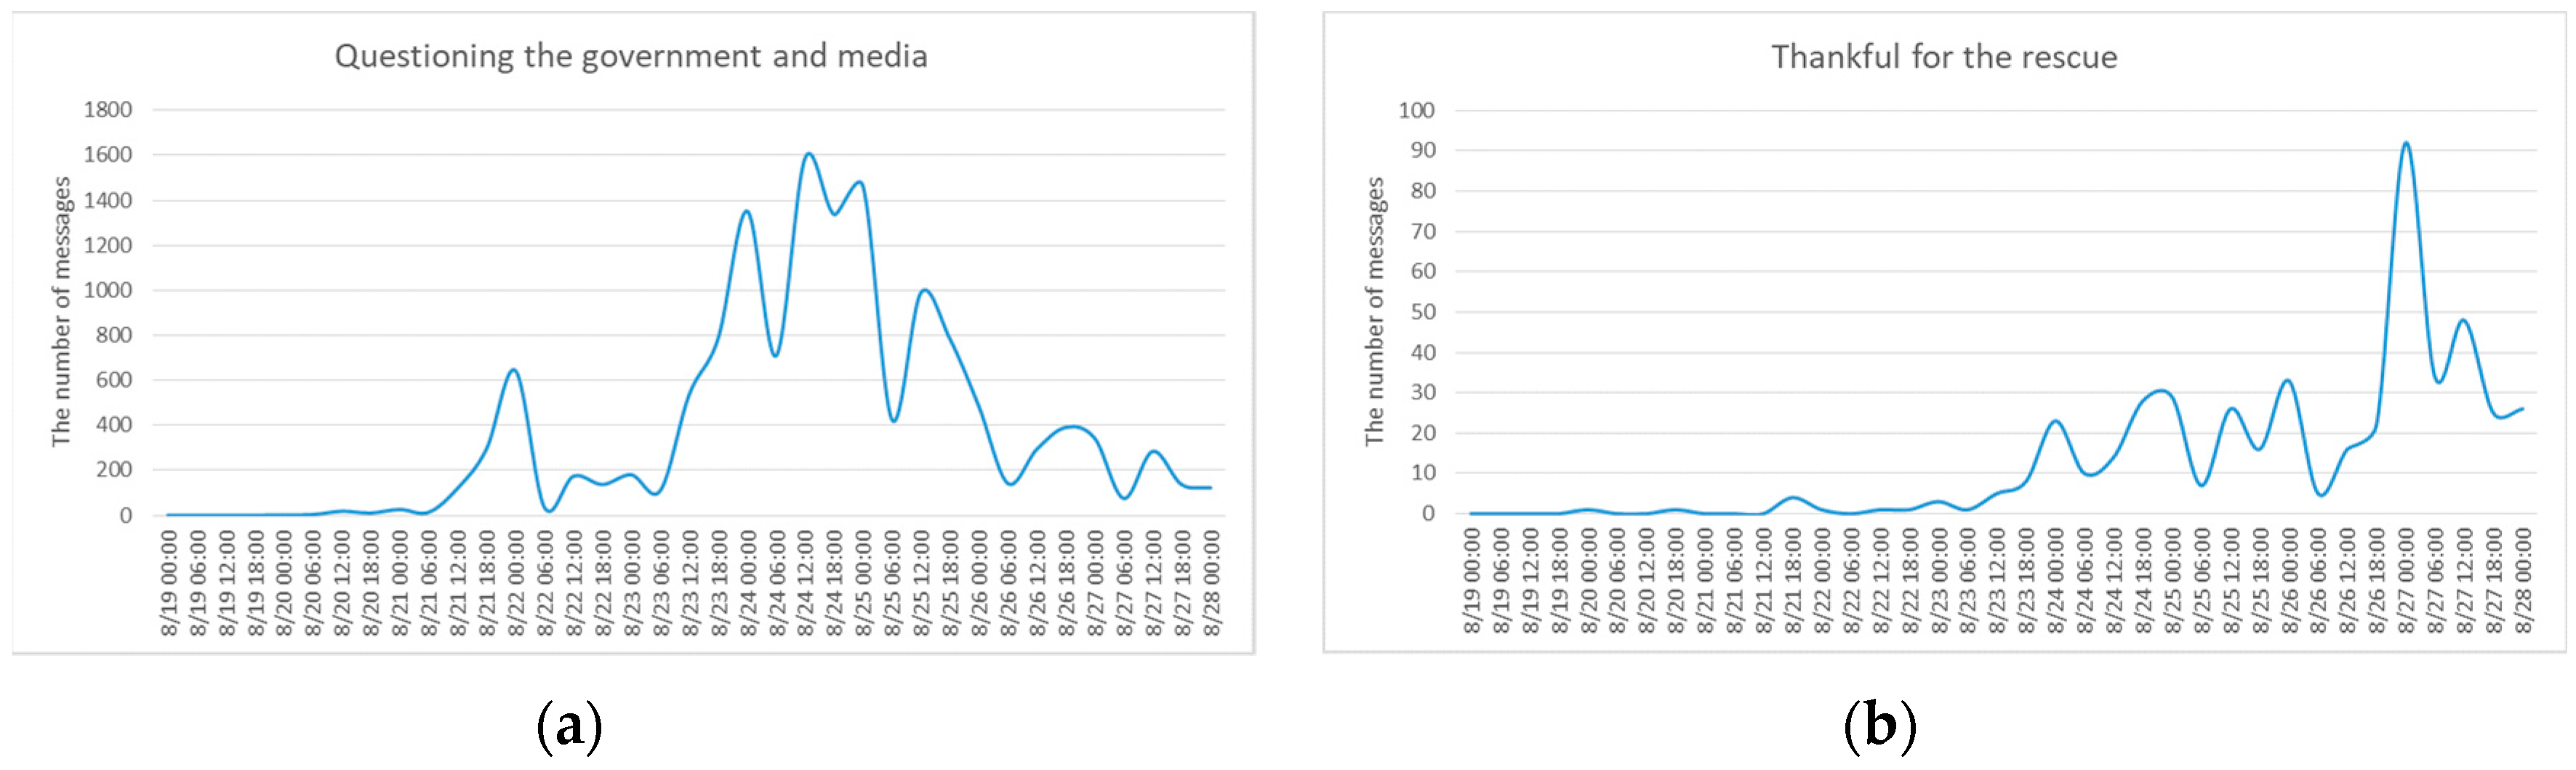
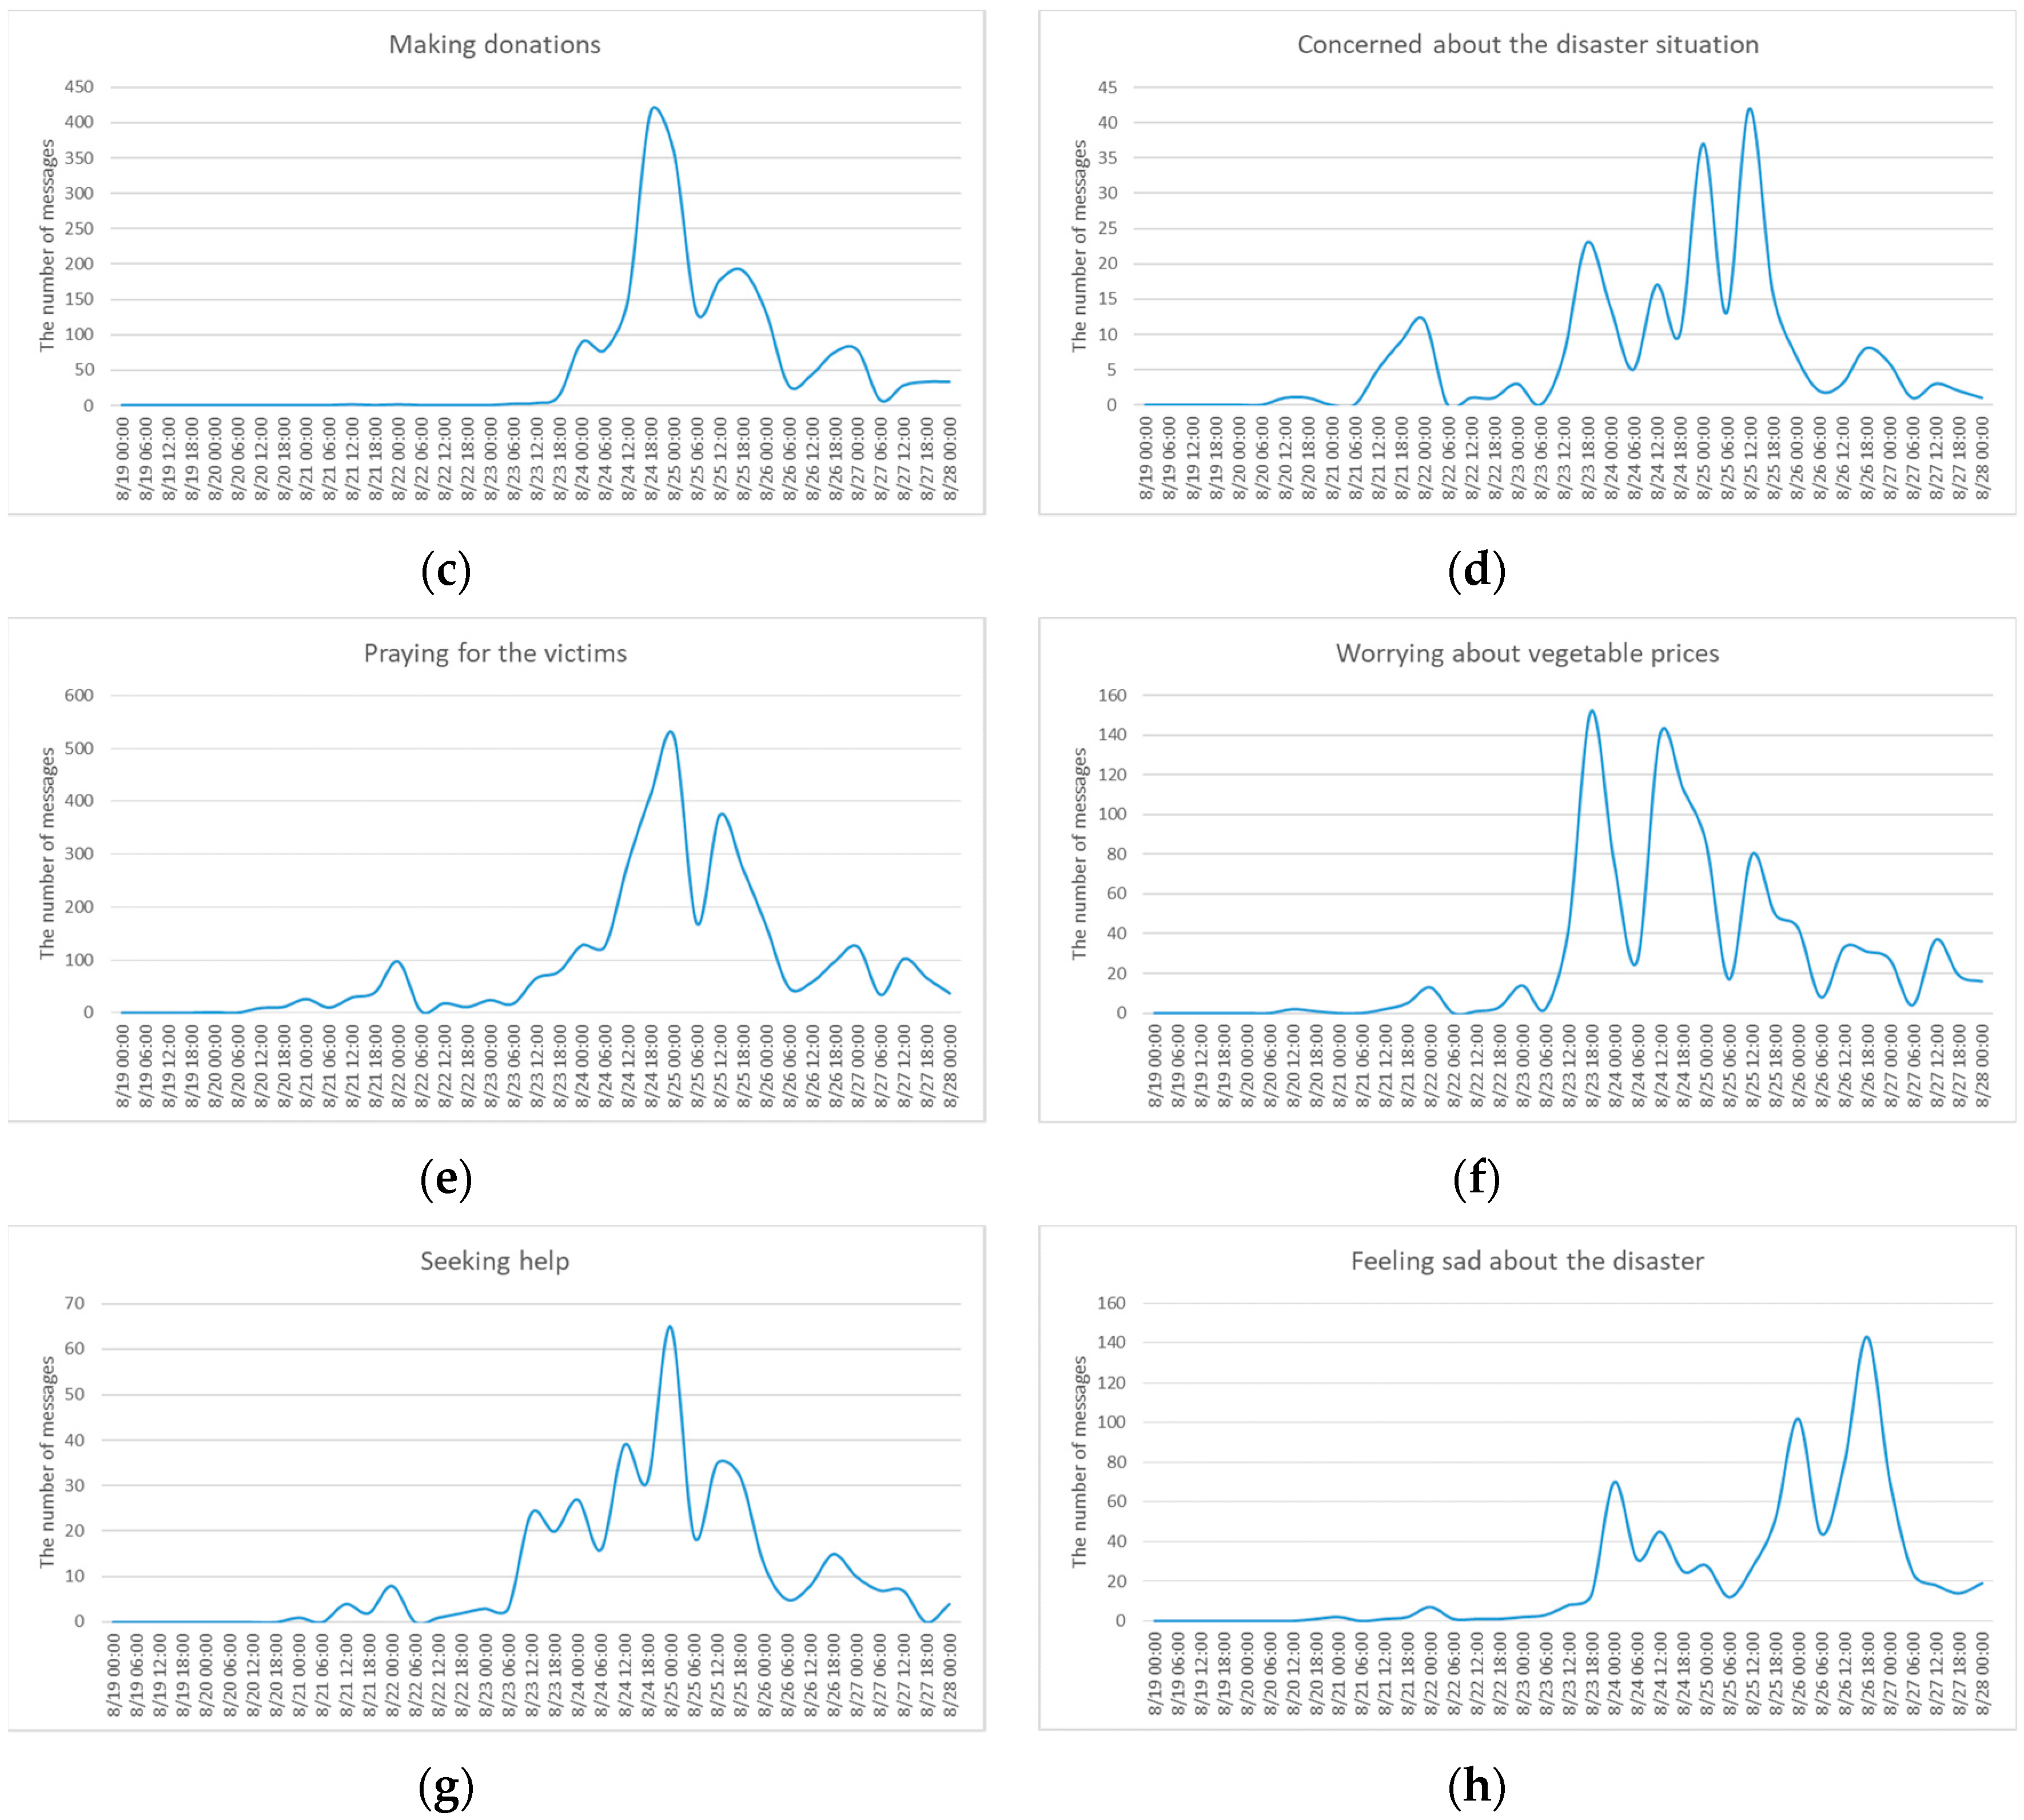
3.2.2. Temporal Trend of Topics
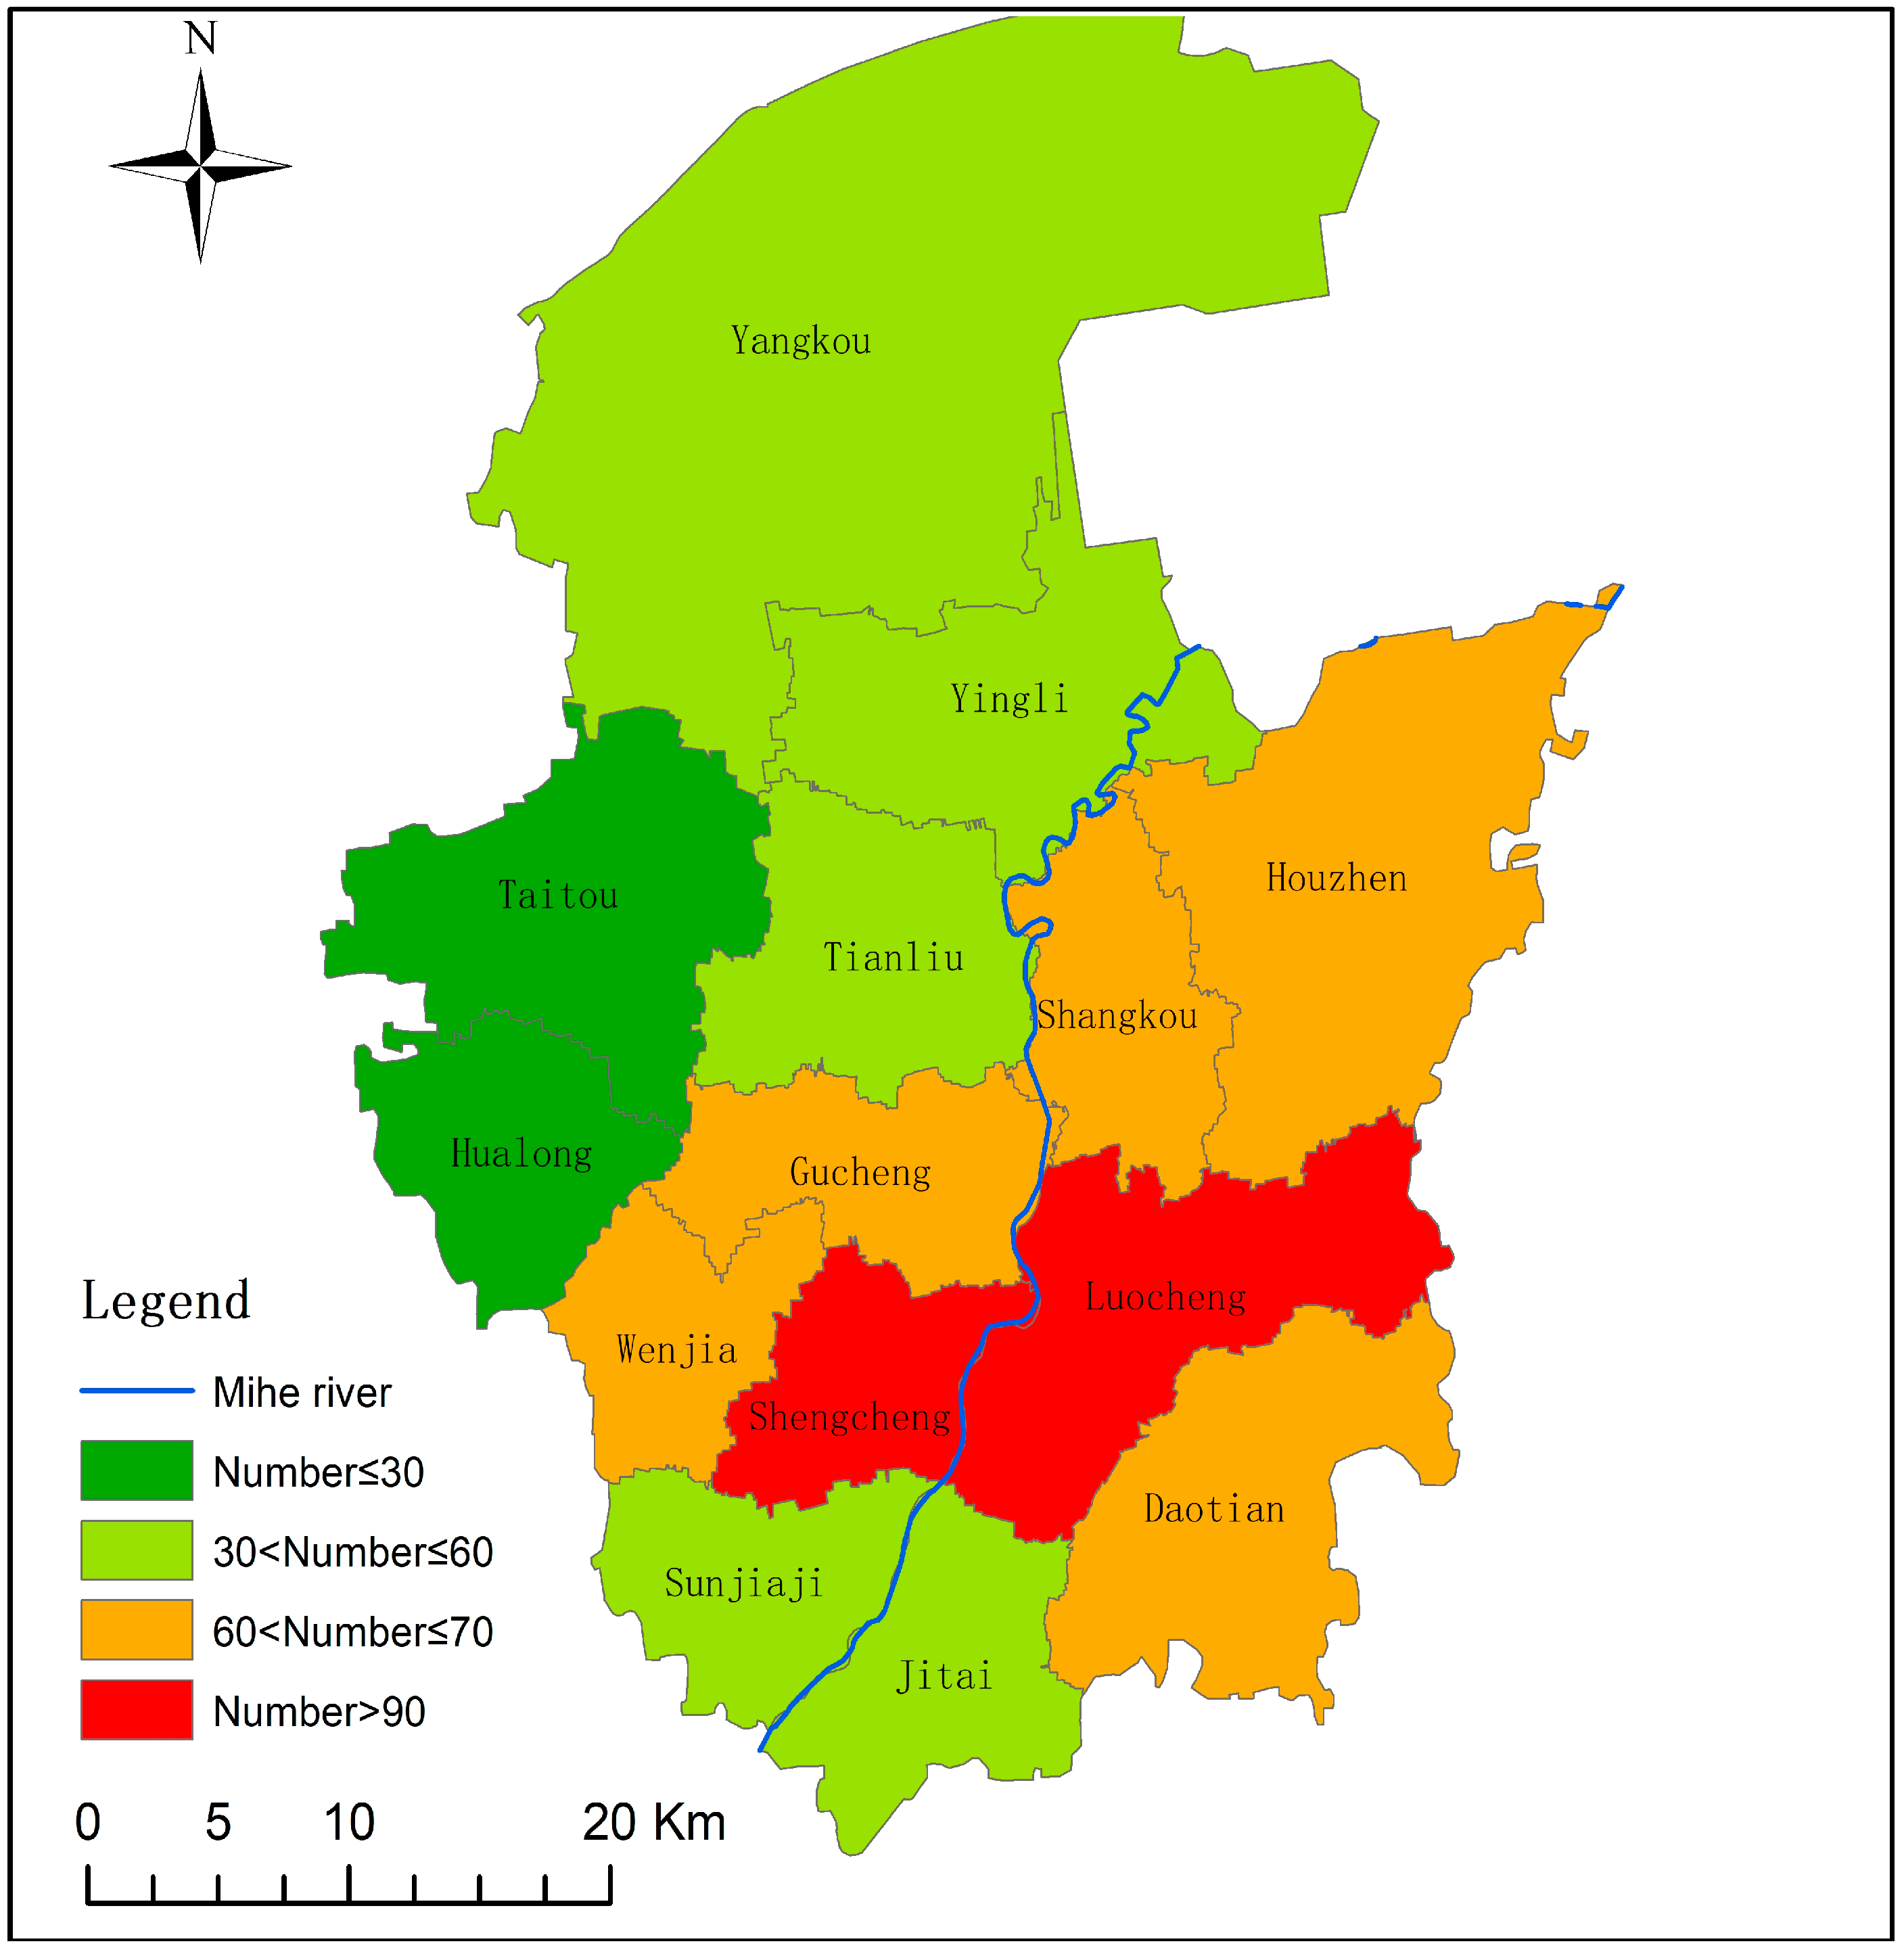
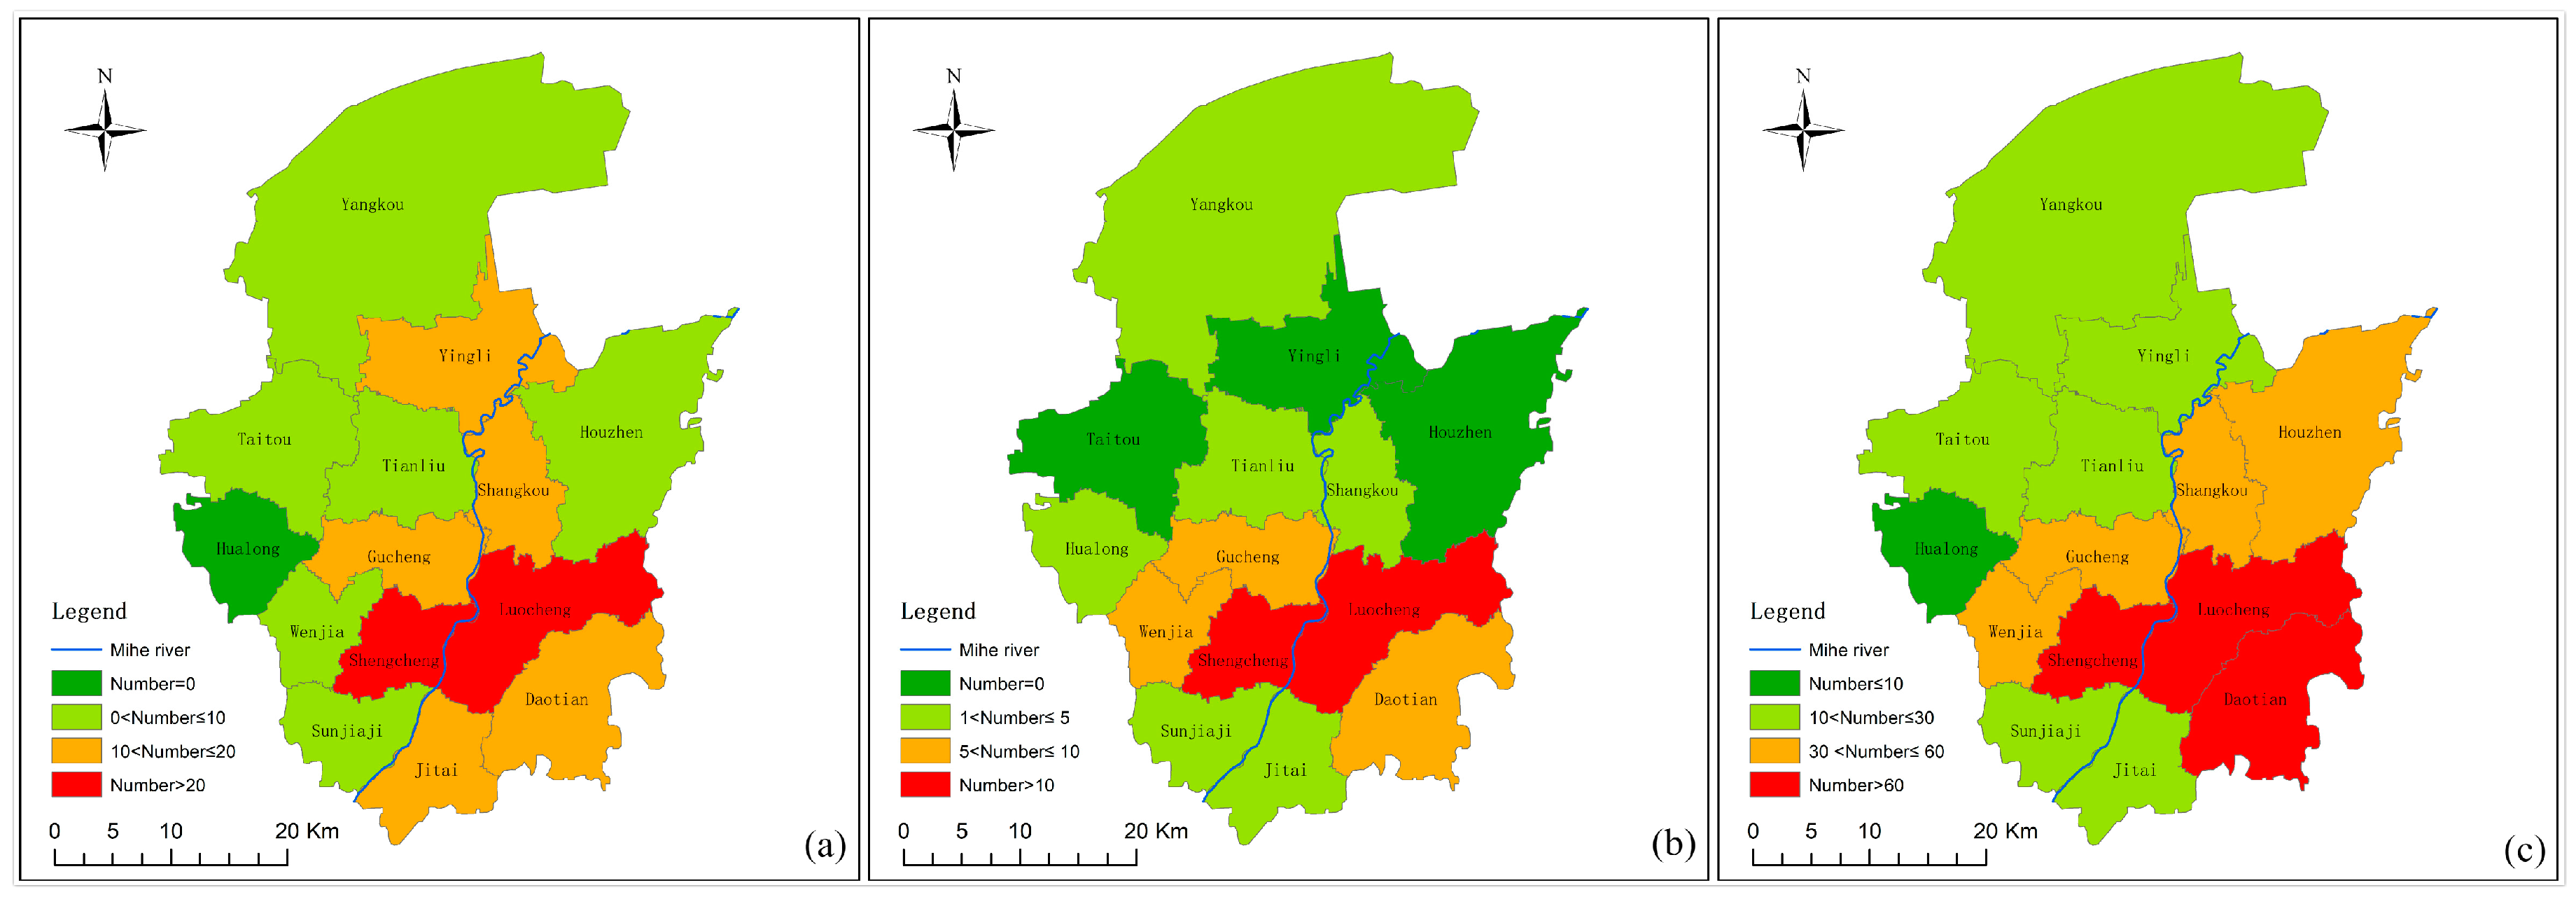
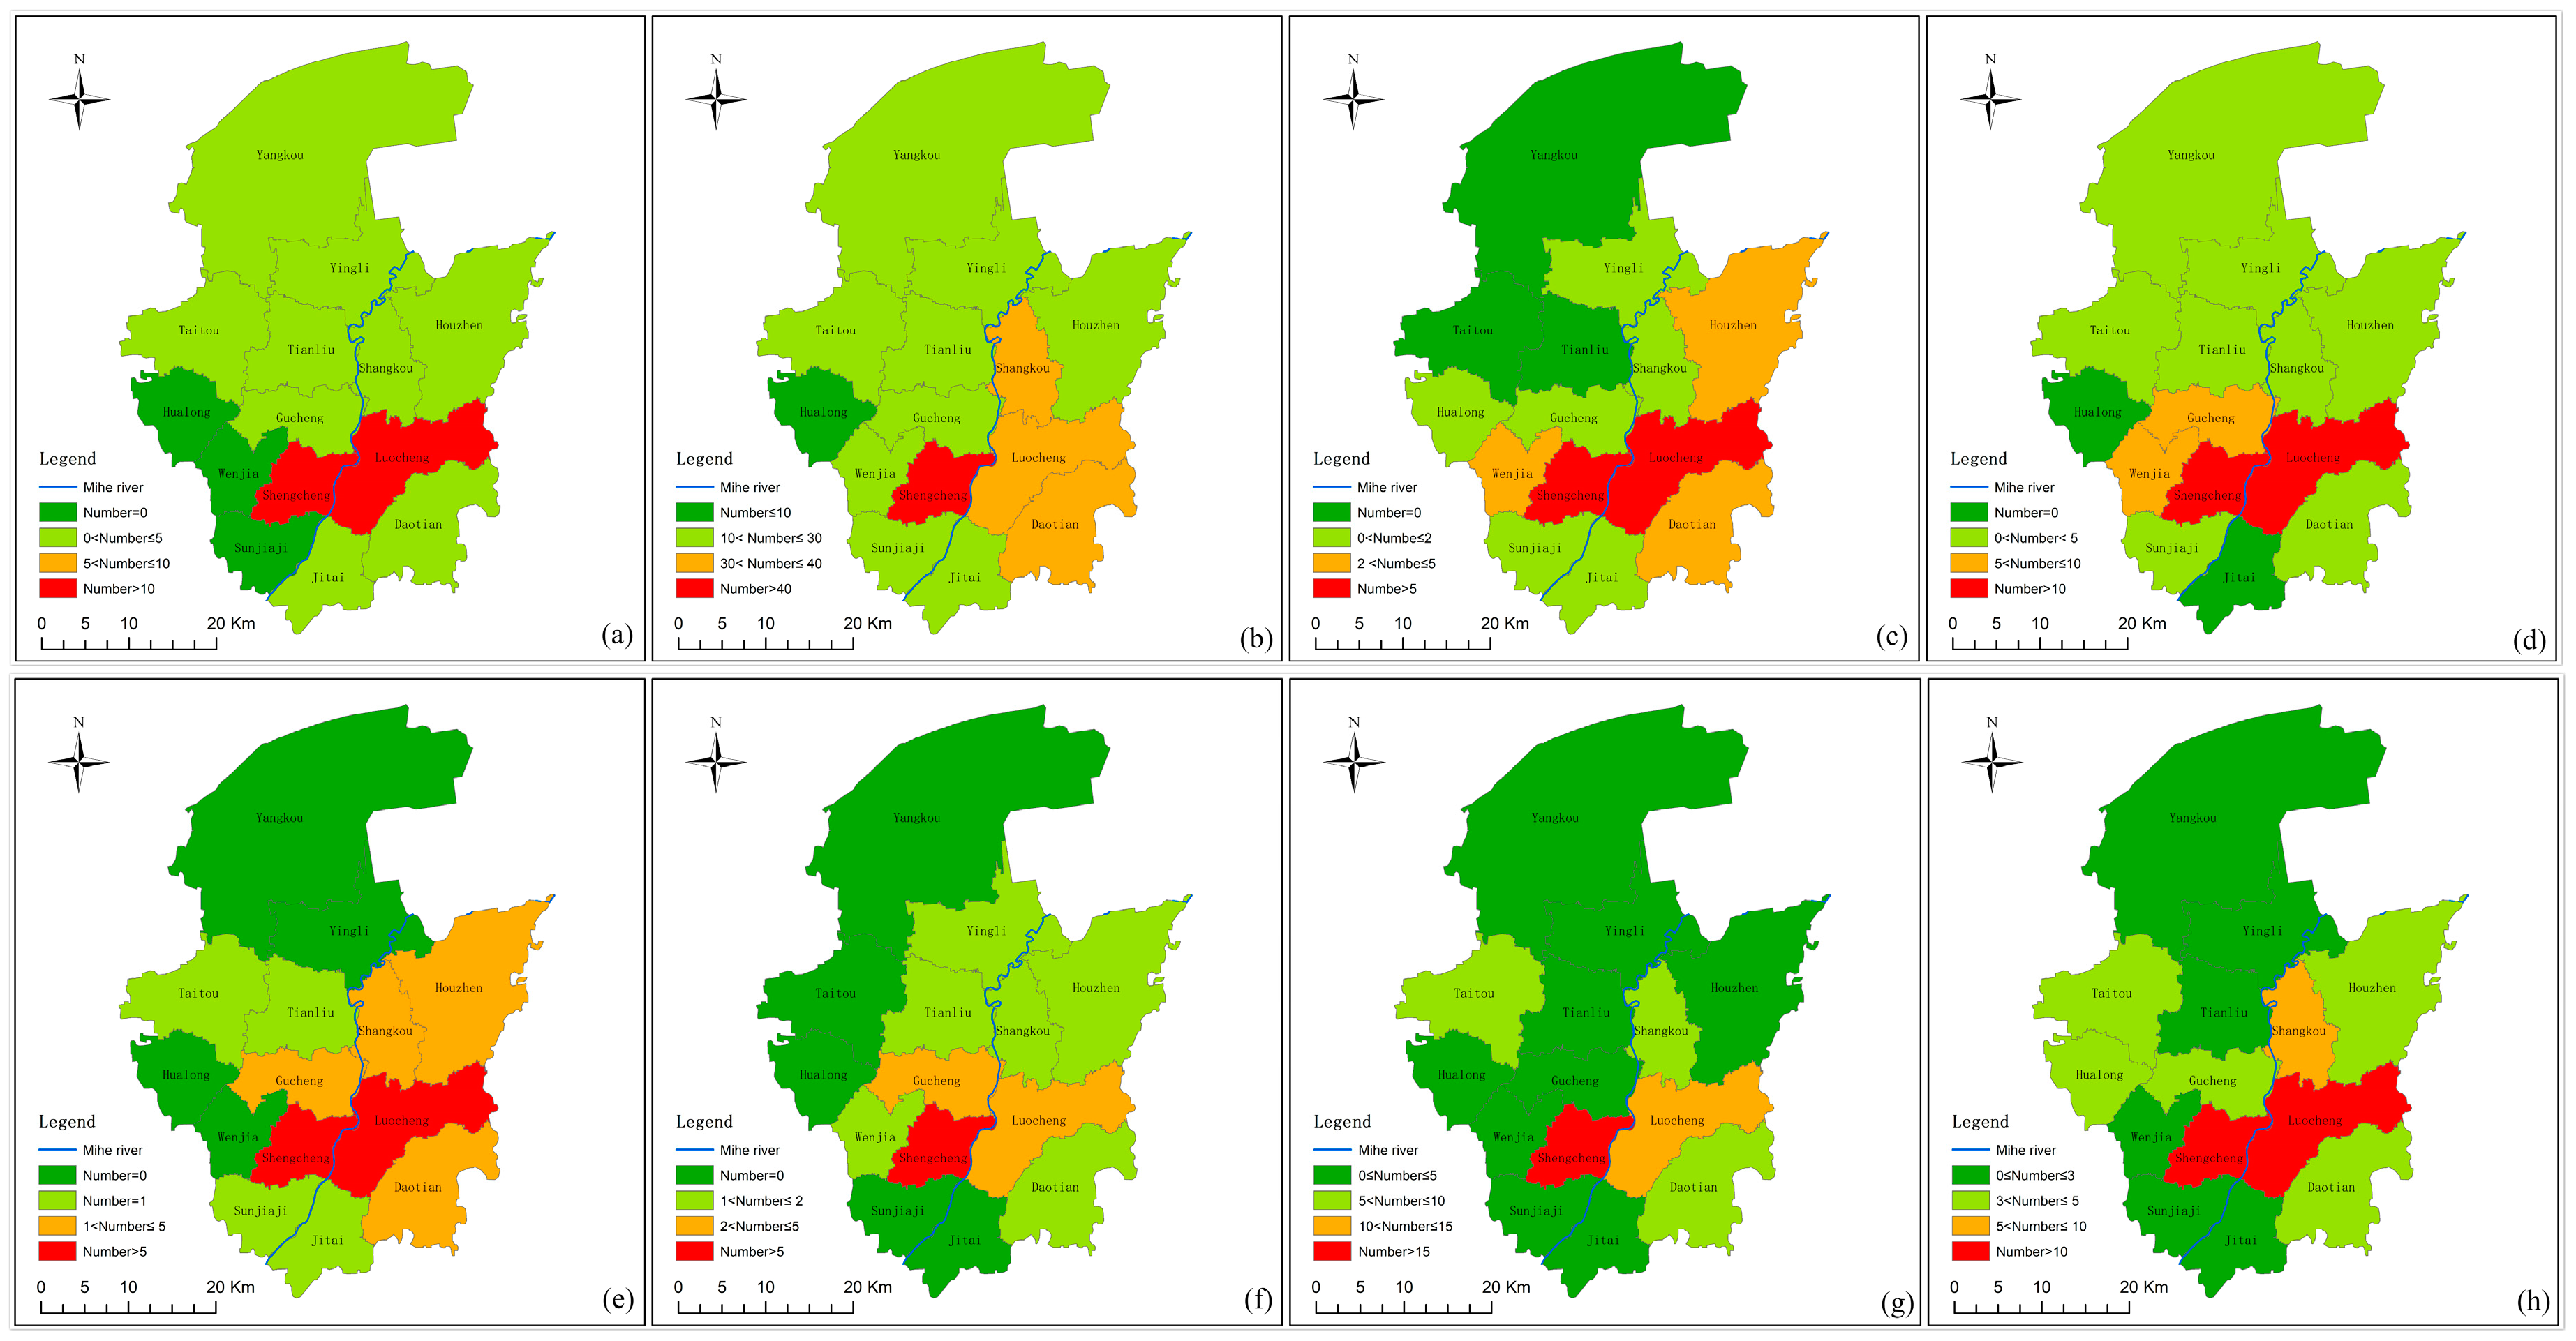
3.2.3. Spatial Distribution of Topics
4. Discussion
5. Conclusions
Author Contributions
Funding
Acknowledgments
Conflicts of Interest
References
- Klonner, C.; Marx, S.; Usón, T.; De Albuquerque, J.P.; Höfle, B. Volunteered Geographic Information in Natural Hazard Analysis: A Systematic Literature Review of Current Approaches with a Focus on Preparedness and Mitigation. ISPRS Int. J. Geo-Inf. 2016, 5, 103. [Google Scholar] [Green Version]
- Kryvasheyeu, Y.; Chen, H.; Obradovich, N.; Moro, E.; Van Hentenryck, P.; Fowler, J.; Cebrian, M. Rapid assessment of disaster damage using social media activity. Sci. Adv. 2016, 2, e1500779. [Google Scholar] [CrossRef] [PubMed] [Green Version]
- Shklovski, I.; Burke, M.; Kiesler, S.; Kraut, R. Technology Adoption and Use in the Aftermath of Hurricane Katrina in New Orleans. Am. Behav. Sci. 2010, 53, 1228–1246. [Google Scholar] [Green Version]
- Sui, D.; Goodchild, M. The convergence of GIS and social media: challenges for GIScience. Int. J. Geogr. Inf. Sci. 2011, 25, 1737–1748. [Google Scholar] [CrossRef]
- De Albuquerque, J.P.; Herfort, B.; Brenning, A.; Zipf, A. A geographic approach for combining social media and authoritative data towards identifying useful information for disaster management. Int. J. Geogr. Inf. Sci. 2015, 29, 1–23. [Google Scholar] [CrossRef] [Green Version]
- Li, Z.; Wang, C.; Emrich, C.T.; Guo, D. A novel approach to leveraging social media for rapid flood mapping: a case study of the 2015 South Carolina floods. Cartogr. Geogr. Inf. Sci. 2018, 45, 97–110. [Google Scholar] [CrossRef]
- Zhu, R.; Lin, D.; Jendryke, M.; Zuo, C.; Ding, L.; Meng, L. Geo-Tagged Social Media Data-Based Analytical Approach for Perceiving Impacts of Social Events. ISPRS Int. J. Geo-Inf. 2019, 8, 15. [Google Scholar] [CrossRef]
- Wang, Z.; Ye, X. Social media analytics for natural disaster management. Int. J. Geogr. Inf. Sci. 2018, 32, 49–72. [Google Scholar] [CrossRef]
- Zhang, S.; Feick, R.; Feick, R. Understanding Public Opinions from Geosocial Media. ISPRS Int. J. Geo-Inf. 2016, 5, 74. [Google Scholar] [CrossRef]
- Innes, J.E.; Booher, D.E. Reframing public participation: strategies for the 21st century. Plan. Theory Pract. 2004, 5, 419–436. [Google Scholar] [CrossRef] [Green Version]
- Balaji, S.; Gelernter, J. An algorithm for local geoparsing of microtext. Geoinformatica 2013, 17, 635–667. [Google Scholar]
- Bakillah, M.; Li, R.Y.; Liang, S.H.L. Geo-located community detection in Twitter with enhanced fast-greedy optimization of modularity: the case study of typhoon Haiyan. Int. J. Geogr. Inf. Sci. 2015, 29, 258–279. [Google Scholar] [CrossRef]
- Crooks, A.; Croitoru, A.; Stefanidis, A.; Radzikowski, J. # Earthquake: Twitter as a distributed sensor system. Trans. GIS 2013, 17, 124–147. [Google Scholar]
- Blanford, J.I. Tweeting and tornadoes. In Proceedings of the 11th International ISCRAM Conference, State College, PA, USA, 19–21 May 2014; pp. 319–323. [Google Scholar]
- Fohringer, J.; Dransch, D.; Kreibich, H.; Schröter, K. Social media as an information source for rapid flood inundation mapping. Nat. Hazards Earth Syst. Sci. Discuss. 2015, 3, 4231–4264. [Google Scholar] [CrossRef]
- Rosser, J.F.; Leibovici, D.; Jackson, M.J. Rapid flood inundation mapping using social media, remote sensing and topographic data. Nat. Hazards 2017, 87, 103–120. [Google Scholar] [CrossRef] [Green Version]
- Tom, B.; Dirk, E.; Arnejan, V.L. Probabilistic flood extent estimates from social media flood observations. Nat. Hazard Earth Syst. 2017, 17, 735–747. [Google Scholar] [Green Version]
- Imran, M.; Mitra, P.; Castillo, C. Twitter as a Lifeline: Human-annotated Twitter Corpora for NLP of Crisis-related Messages. In Proceedings of the 10th Language Resources and Evaluation Conference (LREC), Portorož, Slovenia, 23–28 May 2016; pp. 1638–1643. [Google Scholar]
- Imran, M.; Elbassuoni, S.; Castillo, C.; Diaz, F.; Meier, P. Practical extraction of disaster-relevant information from social media. In Proceedings of the 22nd International Conference on World Wide Web, Rio de Janeiro, Brazil, 13–17 May 2013; pp. 1021–1024. [Google Scholar]
- Wang, Z.; Ye, X.; Tsou, M.-H. Spatial, temporal, and content analysis of Twitter for wildfire hazards. Nat. Hazards 2016, 83, 523–540. [Google Scholar] [CrossRef]
- Ye, X.; Li, S.; Yang, X.; Qin, C. Use of Social Media for the Detection and Analysis of Infectious Diseases in China. ISPRS Int. J. Geo-Inf. 2016, 5, 156. [Google Scholar] [CrossRef]
- Wang, Y.; Wang, T.; Ye, X.; Zhu, J.; Lee, J. Using Social Media for Emergency Response and Urban Sustainability: A Case Study of the 2012 Beijing Rainstorm. Sustainability 2015, 8, 25. [Google Scholar] [CrossRef]
- Griffiths, T.L.; Steyvers, M. Finding scientific topics. Proc. Natl. Acad. Sci. USA 2004, 101, 5228–5235. [Google Scholar] [CrossRef] [PubMed] [Green Version]
- Blei, D.M.; Ng, A.Y.; Jordan, M.I. Latent dirichlet allocation. J. Mach. Learn. Res. 2012, 3, 993–1022. [Google Scholar]
- Breiman, L. Random forests. Mach. Learn. 2001, 45, 5–32. [Google Scholar] [CrossRef]
- Thiago, S.; Marcos, G.; Victor, R. Improving Random Forests by Neighborhood Projection for Effective Text Classification. Inf. Syst. 2018, 77, 1–21. [Google Scholar]
- Provincial Disaster Reduction Center Emergency Allocation of Relief Material to Guarantee the Resettlement of the Disaster-stricken Areas. Available online: http://www.sdjianzai.gov.cn/gzdt/6165.jhtml (accessed on 22 August 2018). (In Chinese)


| All Texts | Weather Warning | Traffic Conditions | Rescue Information | Public Sentiment | Disaster Information | Other | |
|---|---|---|---|---|---|---|---|
| Number | 26,963 | 53 | 89 | 976 | 22,662 | 3124 | 59 |
| Percent | 100% | 0.20% | 0.33% | 3.62% | 84.05% | 11.59% | 0.22% |
| Topic | Number | Percent |
|---|---|---|
| Concerned about the disaster situation | 250 | 1.10% |
| Questioning the government and media | 14,007 | 61.81% |
| Seeking help | 401 | 1.77% |
| Praying for the victims | 3461 | 15.27% |
| Feeling sad about the disaster | 844 | 3.72% |
| Making donations | 2068 | 9.13% |
| Thankful for the rescue | 480 | 2.12% |
| Worrying about vegetable prices | 1042 | 4.60% |
| Other | 109 | 0.48% |
| Total | 22,662 | 100.00% |
| Topics | Sentiments | |
|---|---|---|
| Precision (P) | 89% | 78% |
| Recall (R) | 88% | 75% |
| F1 | 88% | 72% |
© 2019 by the authors. Licensee MDPI, Basel, Switzerland. This article is an open access article distributed under the terms and conditions of the Creative Commons Attribution (CC BY) license (http://creativecommons.org/licenses/by/4.0/).
Share and Cite
Han, X.; Wang, J. Using Social Media to Mine and Analyze Public Sentiment during a Disaster: A Case Study of the 2018 Shouguang City Flood in China. ISPRS Int. J. Geo-Inf. 2019, 8, 185. https://0-doi-org.brum.beds.ac.uk/10.3390/ijgi8040185
Han X, Wang J. Using Social Media to Mine and Analyze Public Sentiment during a Disaster: A Case Study of the 2018 Shouguang City Flood in China. ISPRS International Journal of Geo-Information. 2019; 8(4):185. https://0-doi-org.brum.beds.ac.uk/10.3390/ijgi8040185
Chicago/Turabian StyleHan, Xuehua, and Juanle Wang. 2019. "Using Social Media to Mine and Analyze Public Sentiment during a Disaster: A Case Study of the 2018 Shouguang City Flood in China" ISPRS International Journal of Geo-Information 8, no. 4: 185. https://0-doi-org.brum.beds.ac.uk/10.3390/ijgi8040185