A Landslide Susceptibility Assessment Method Based on GIS Technology and an AHP-Weighted Information Content Method: A Case Study of Southern Anhui, China


Abstract
:1. Introduction
2. Methodology
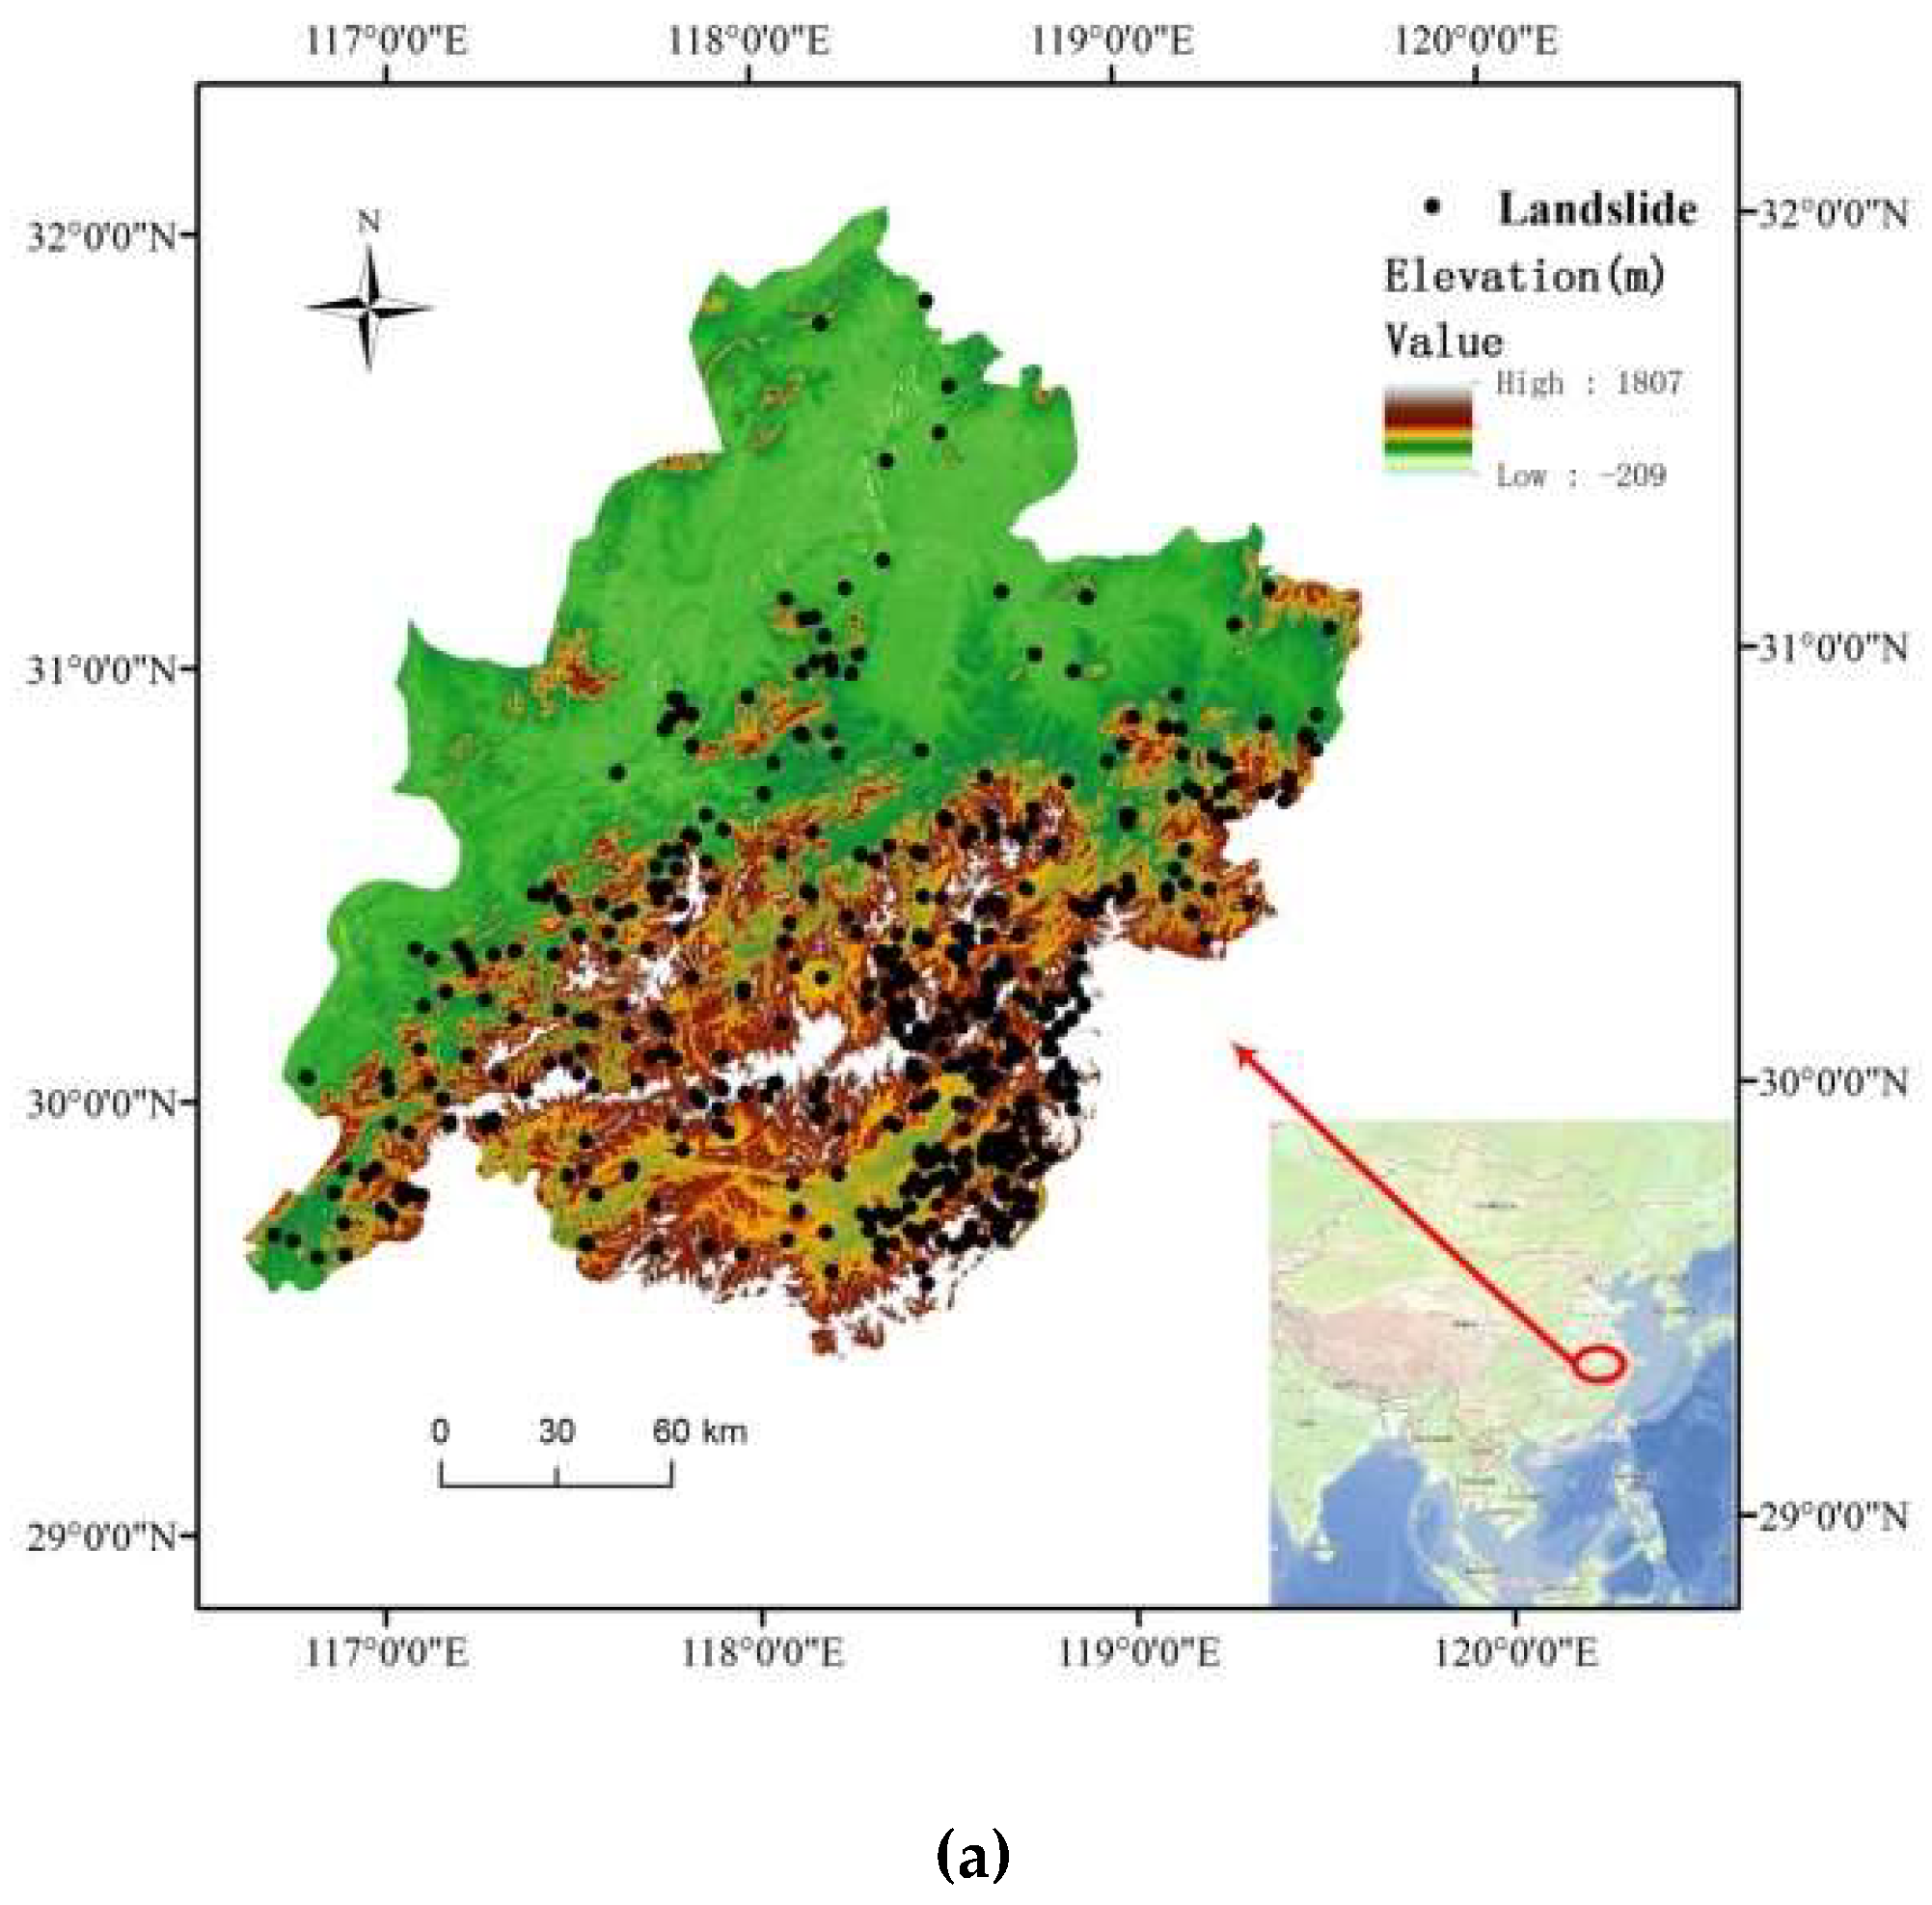
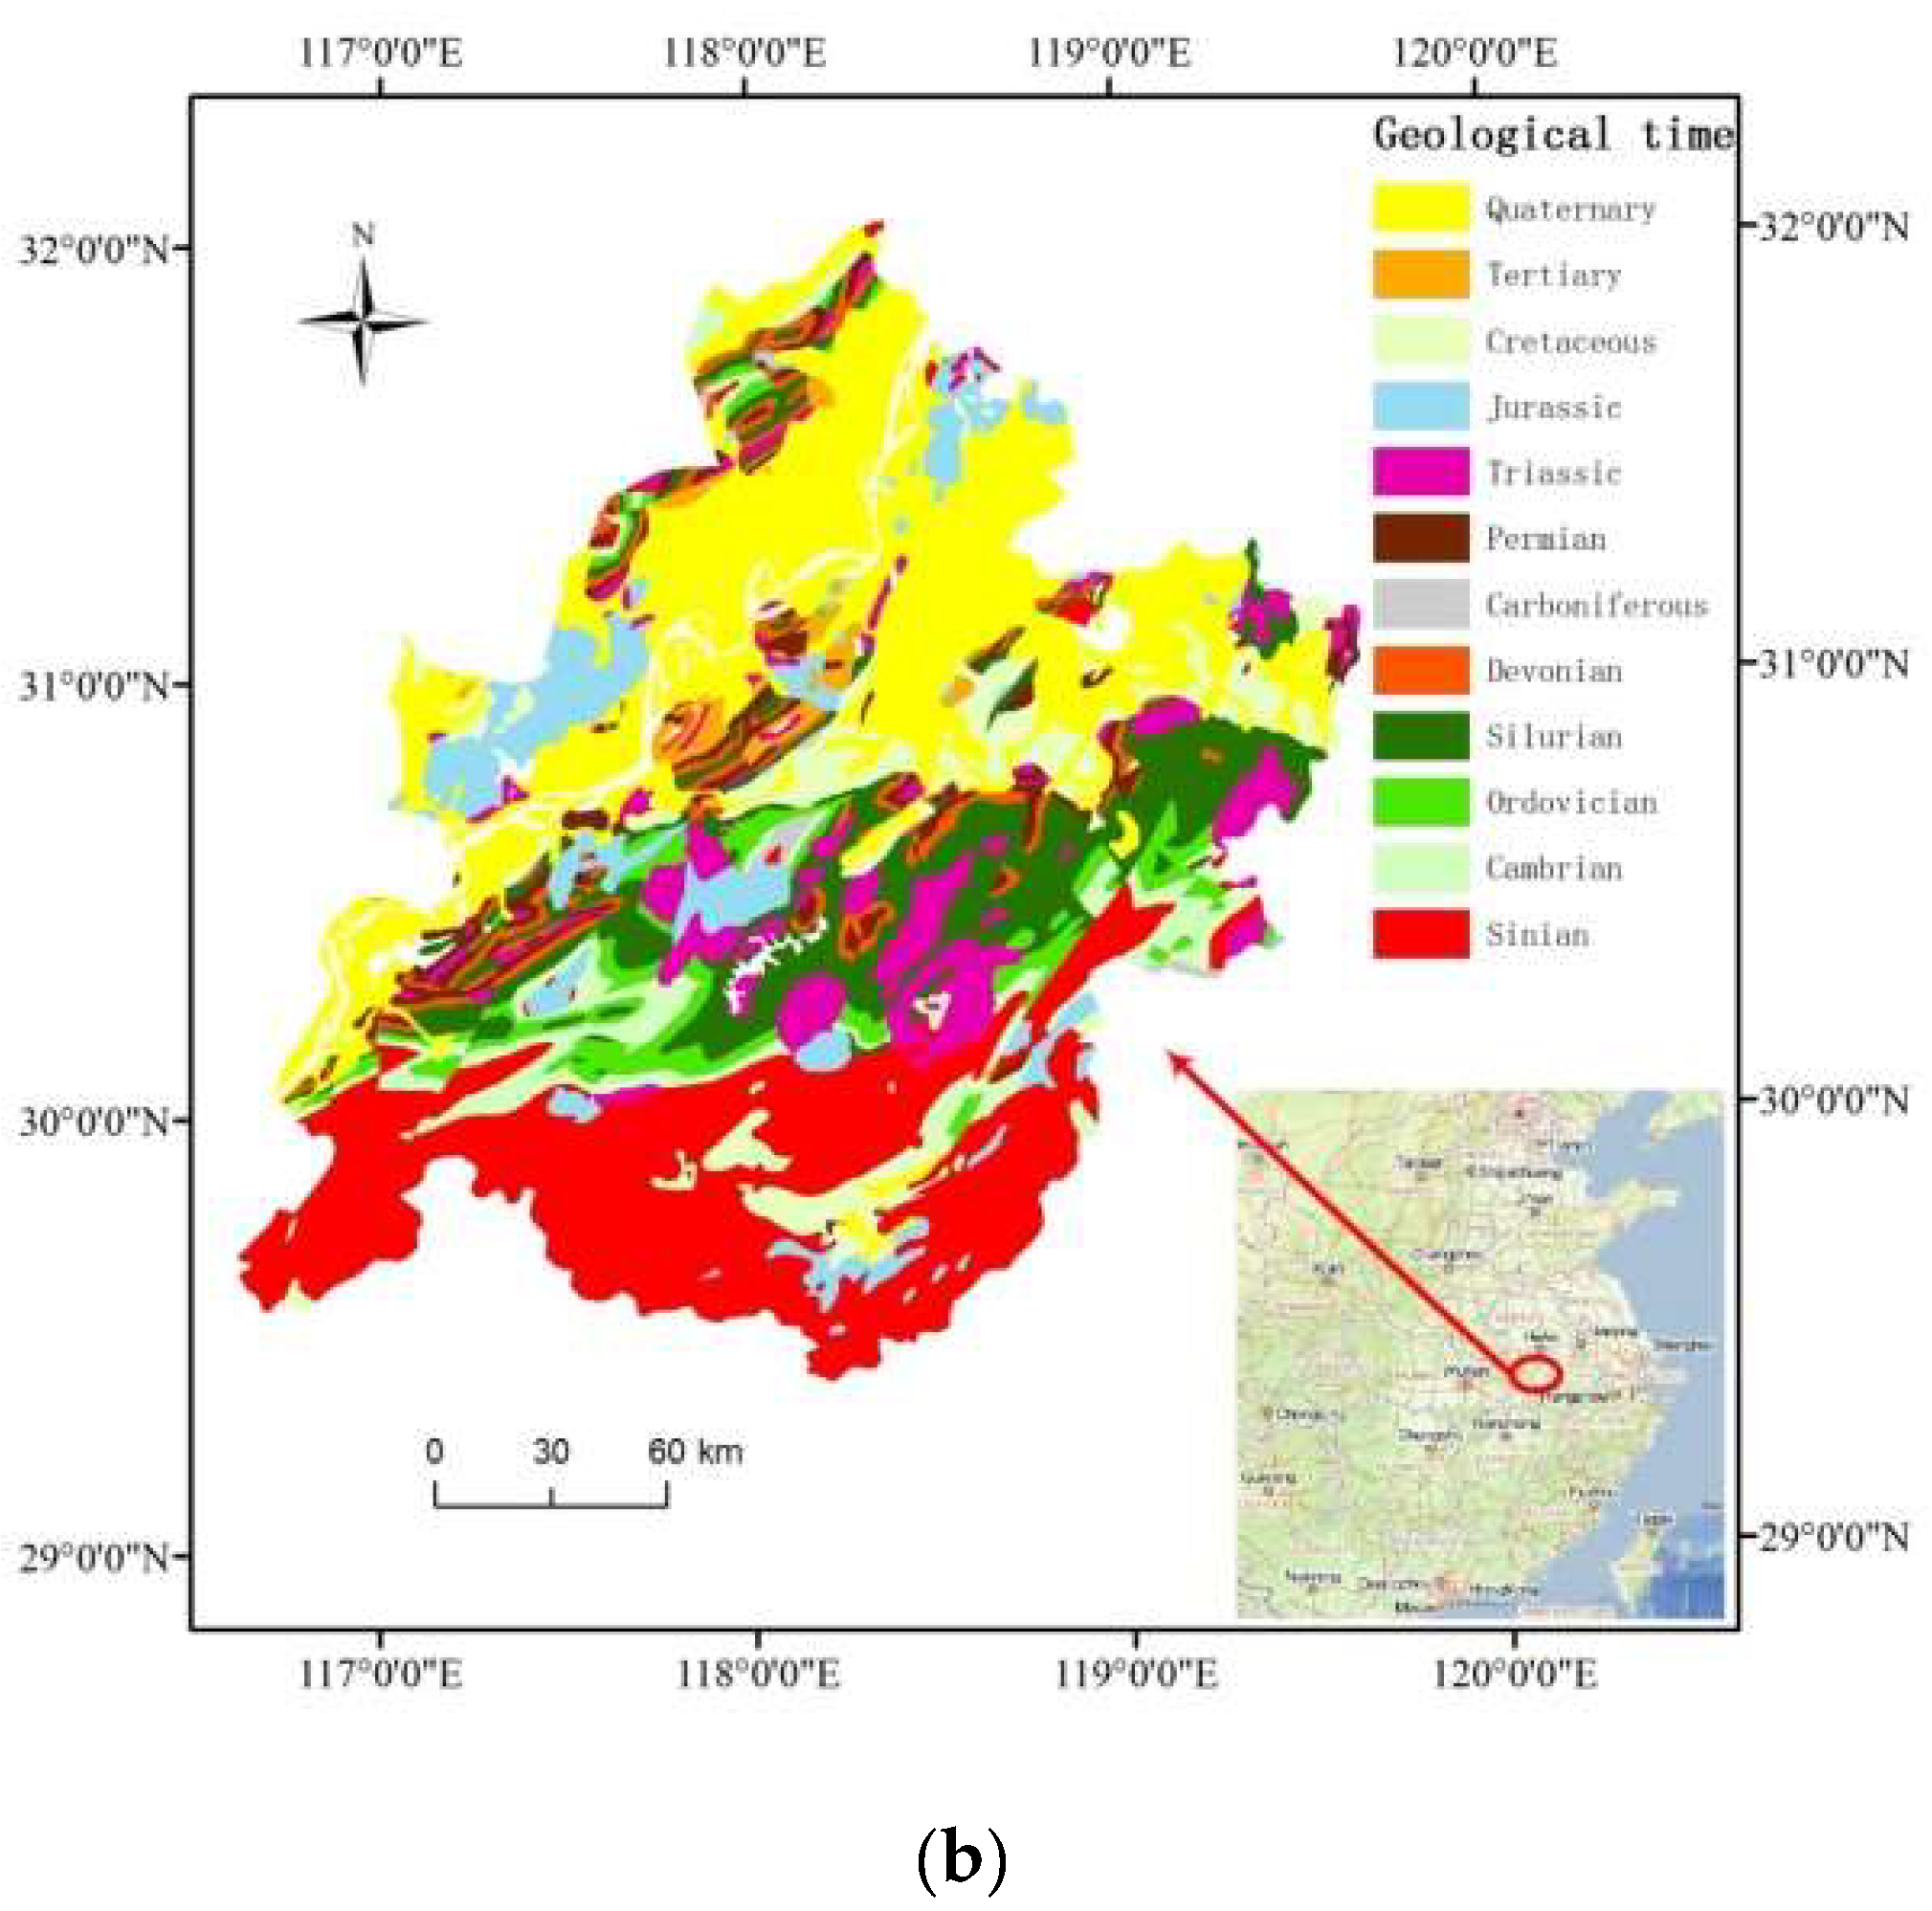
2.1. Information for the Study Area
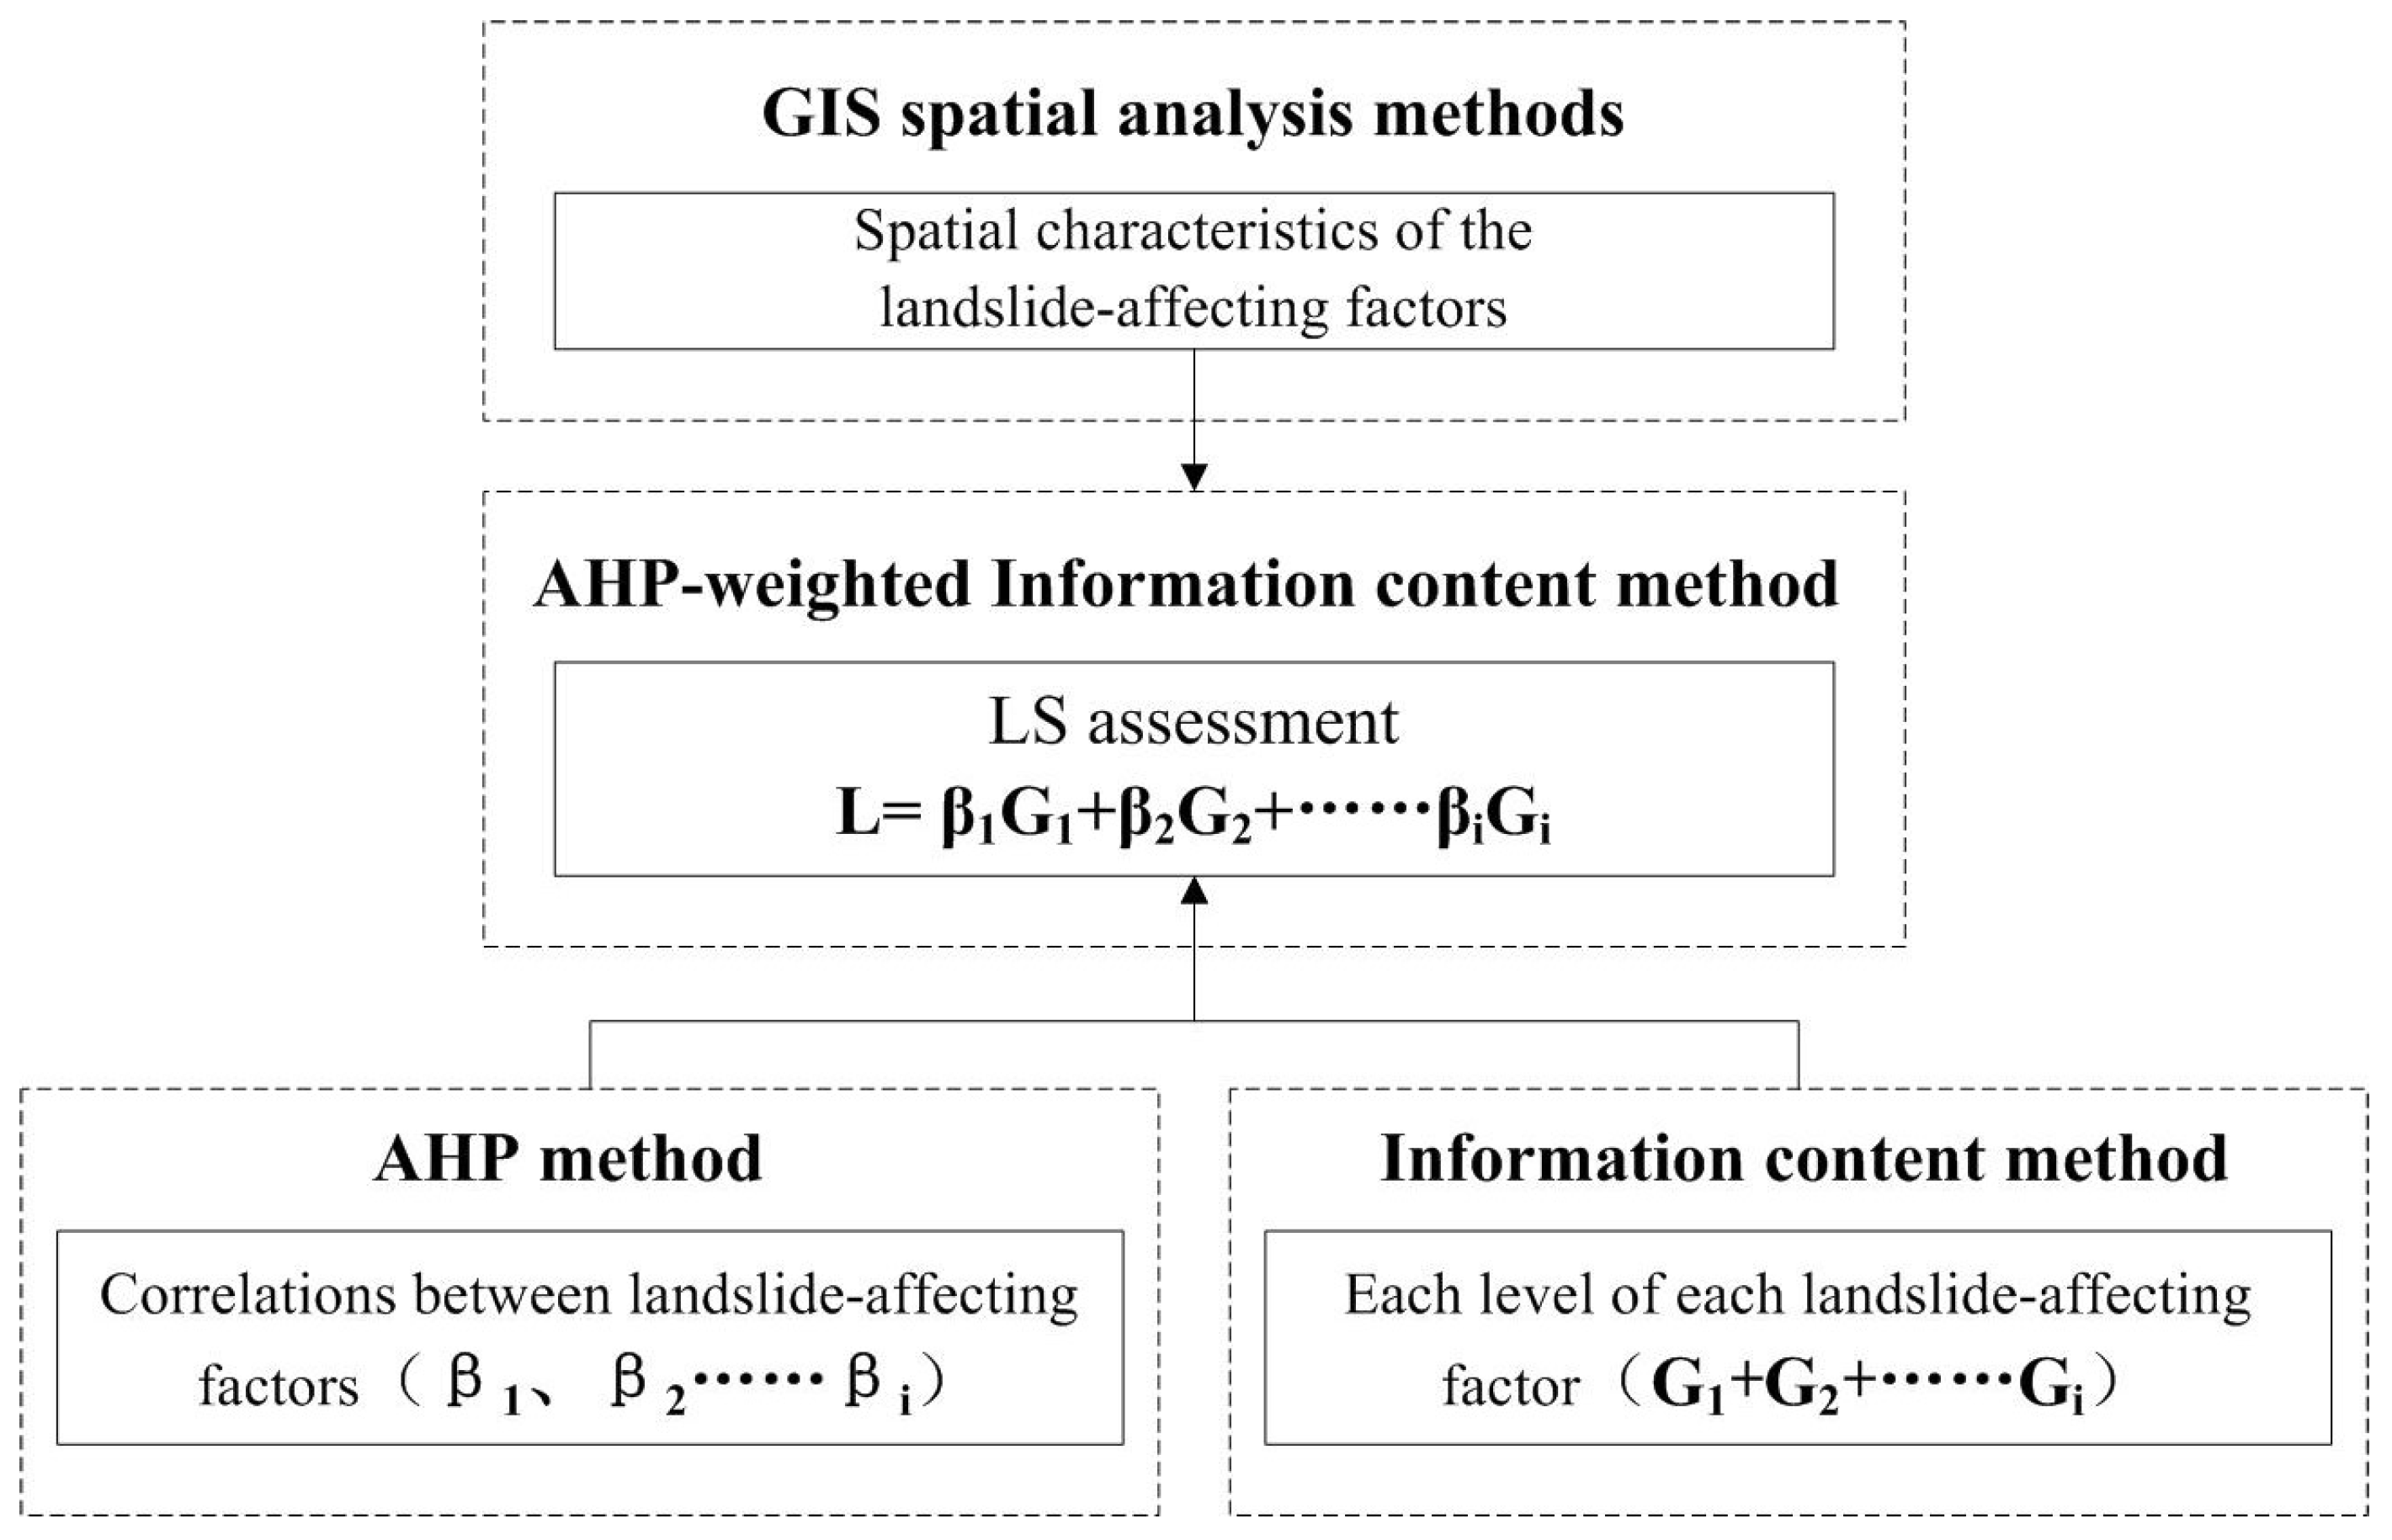
2.2. AHP-Weighted Information Content Method
2.3. Preparation of the AHP-Weighted Information Content Method
2.3.1. AHP Method
2.3.2. Information Content Method
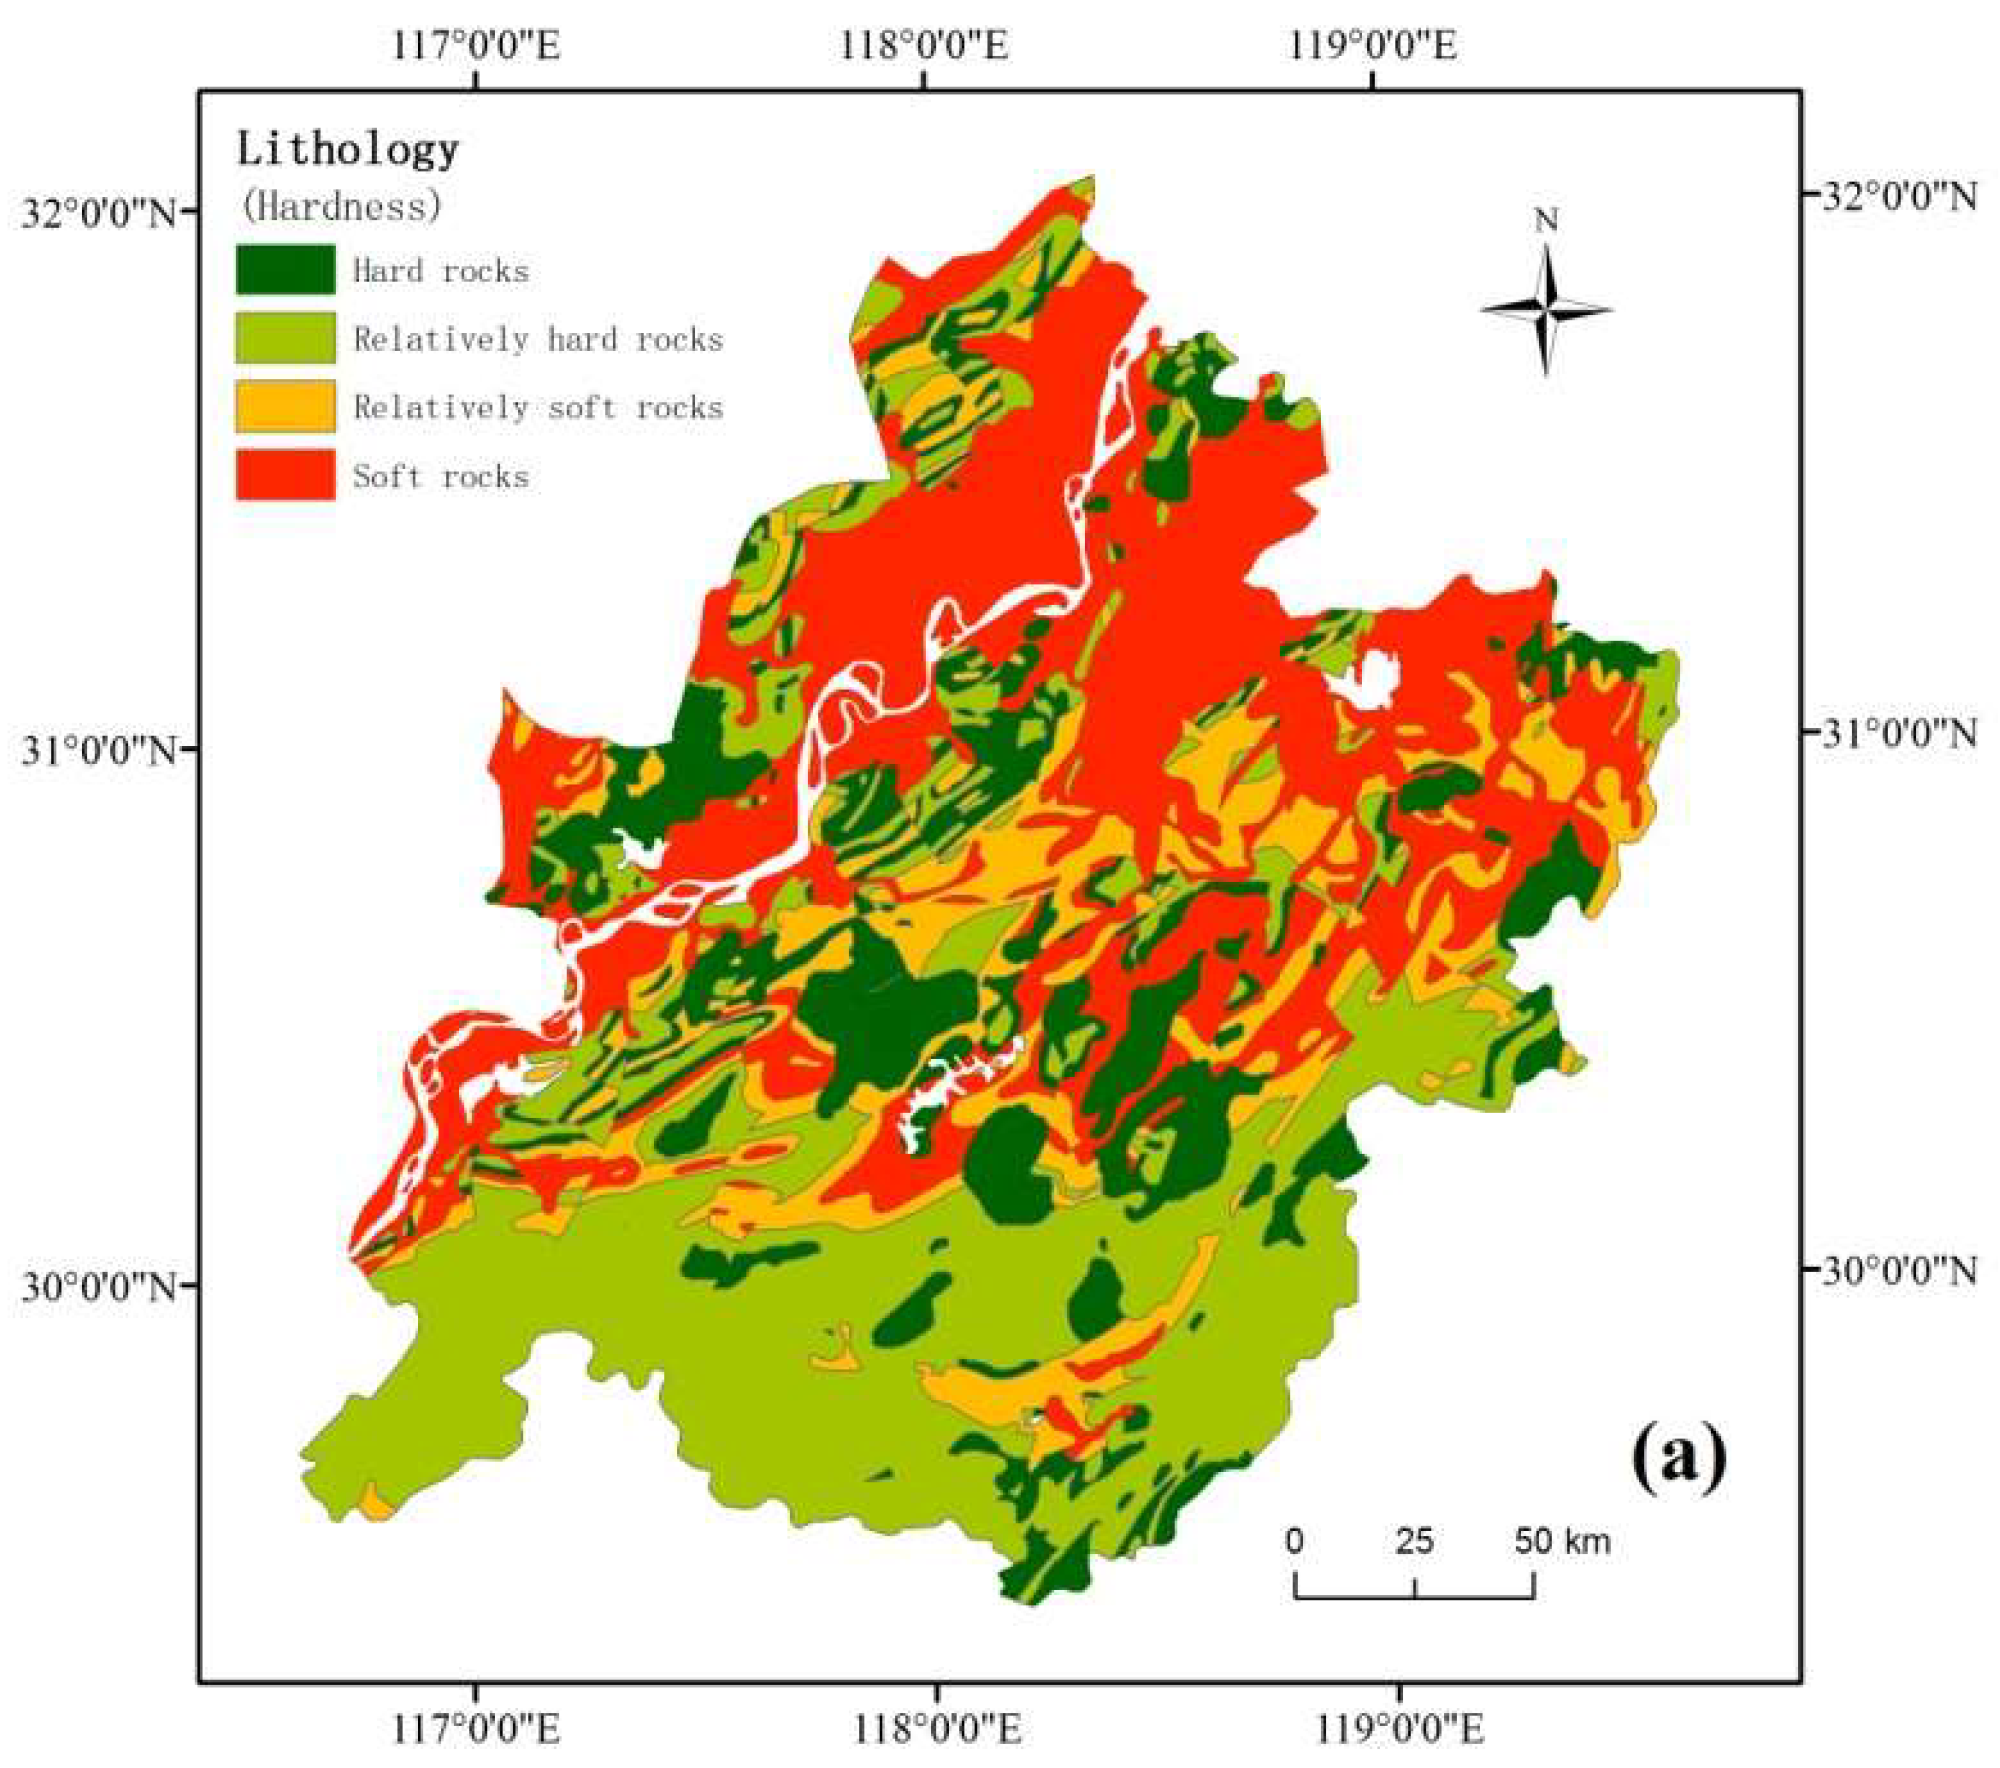
- (a)
- Lithology. Formation lithologies are classified into four types: hard, relatively hard, relatively soft and soft rocks.
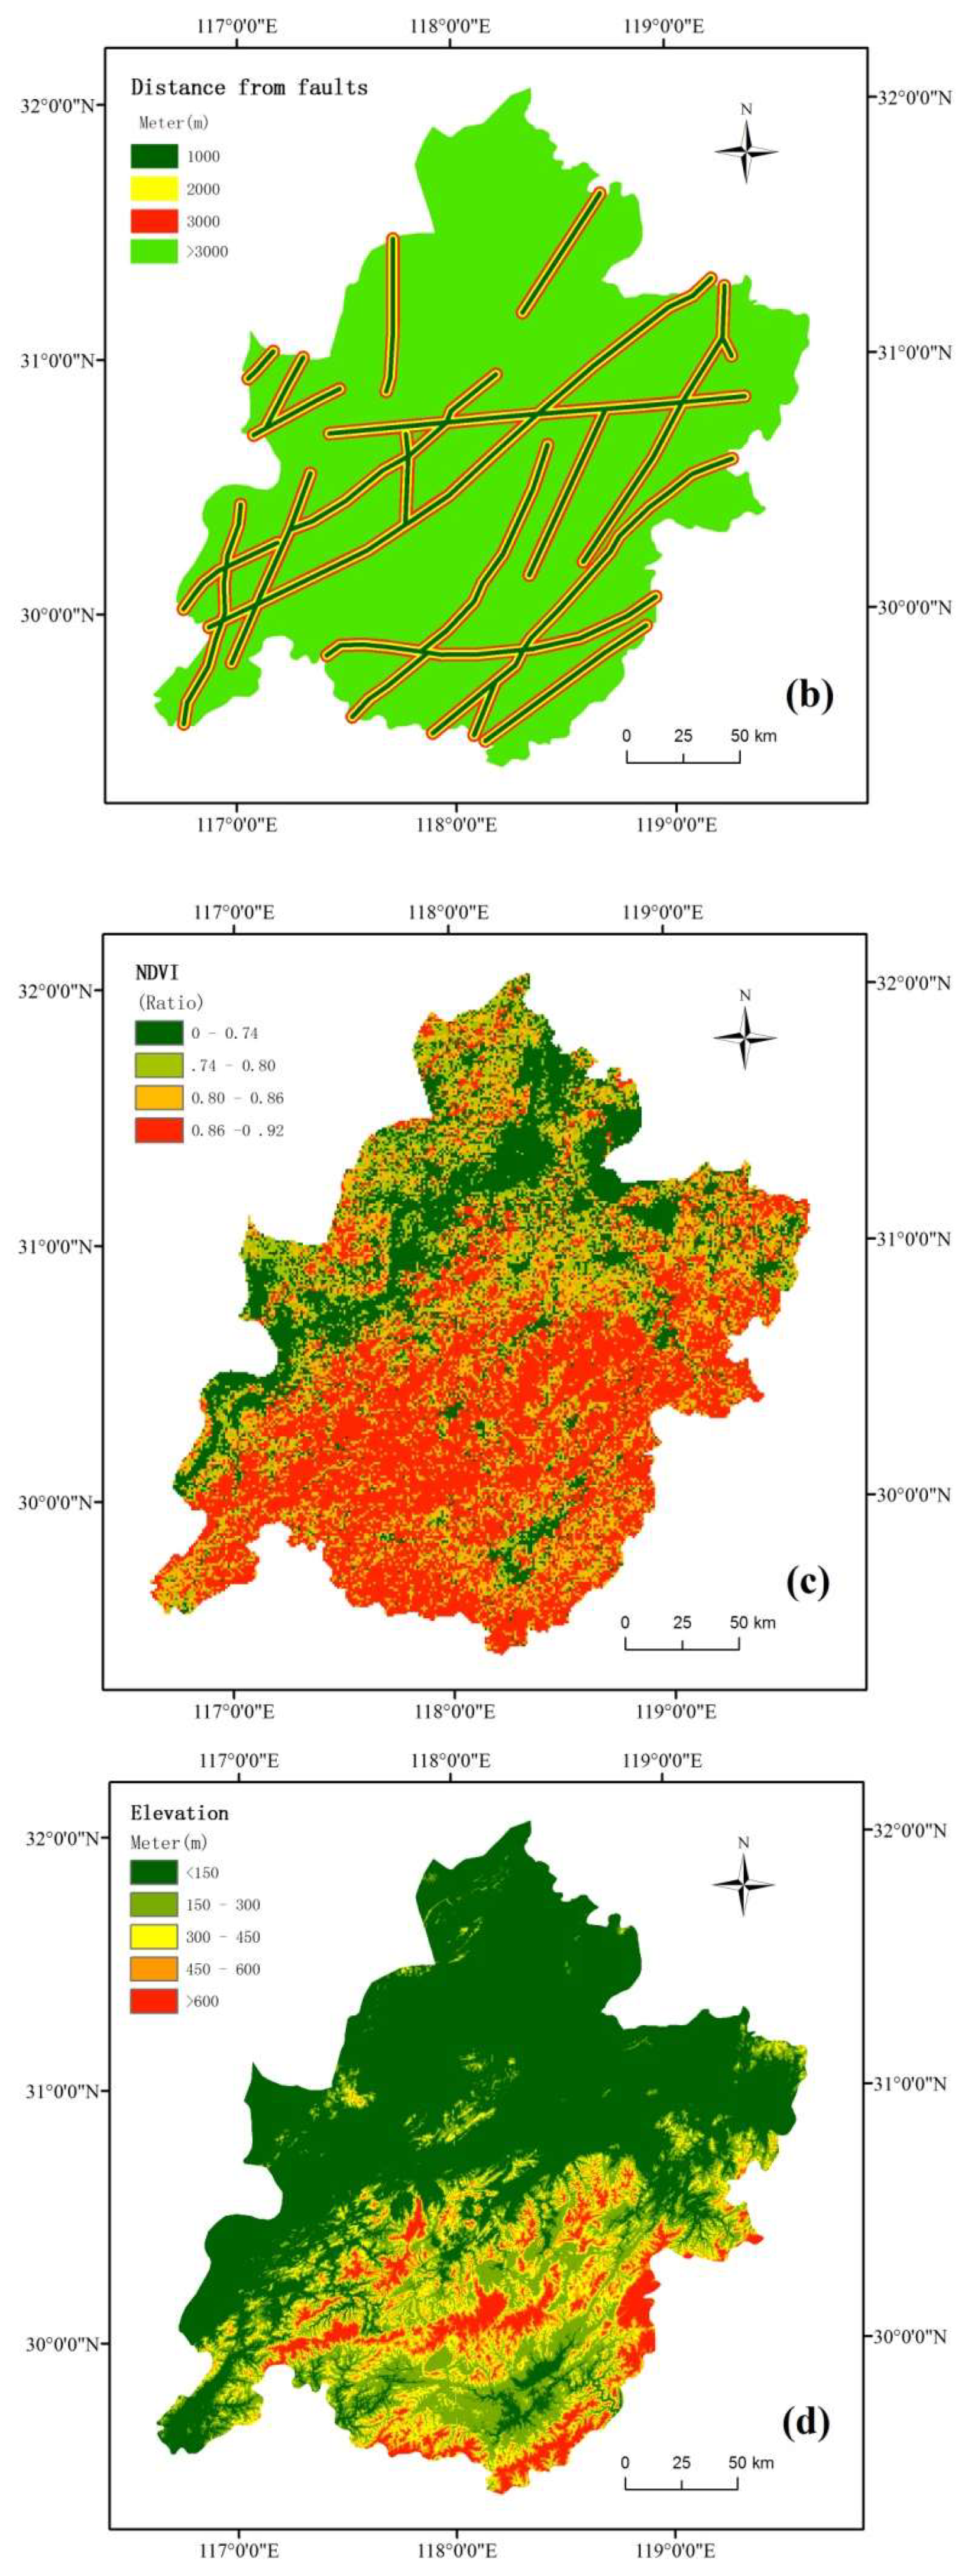
- (b)
- Distance from faults. Four buffer zones are created at distances of <1000, 1000–2000, 2000–3000 and >3000 m from the fault zone.
- (c)
- NDVI. NDVI is classified into four ranges: <0.74, 0.74–0.80, 0.80–0.86 and 0.86–0.92.
- (d)
- Elevation. Elevations are categorized into five ranges: <150, 150–300, 300–450, 450–600 and >600 m.
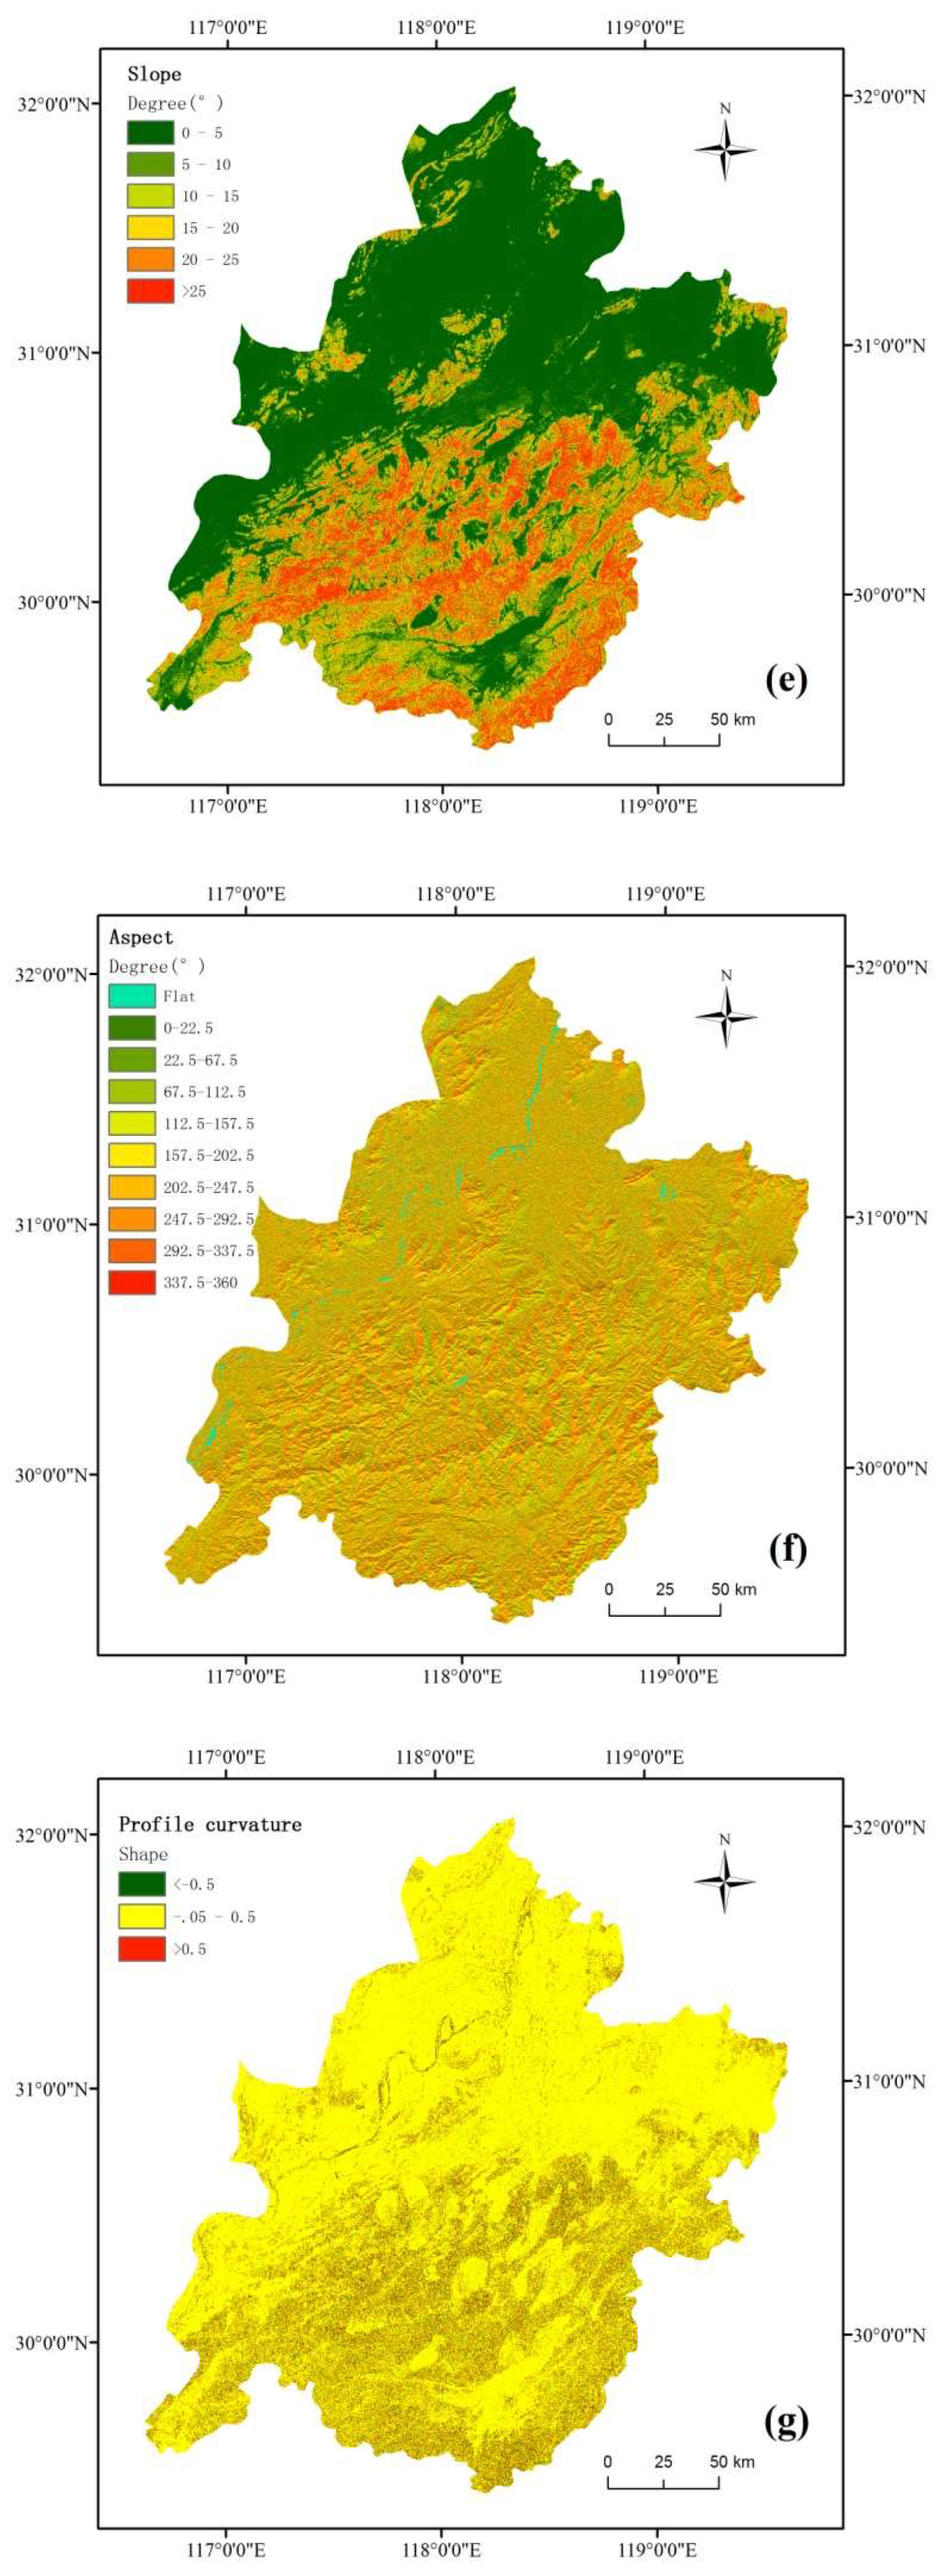
- (e)
- Slope. Slopes are categorized into six ranges: 0°–5°, 5°–10°, 10°–15°, 15°–20°, 20°–25° and >25°. Convex slopes are prone to rock falls and many landslides caused by earthquakes, while concave slopes are prone to debris slides or flows along the valleys [49].
- (f)
- Aspect. Aspects are categorized into eight types: east, west, south, north, southeast, southwest, northeast and northwest.
- (g)
- Profile curvature. Profile curvatures are categorized into three types: convex slopes (profile curvature > 0.5), concave slopes (profile curvature < −0.5) and linear slopes (−0.5 < profile curvature < 0.5).
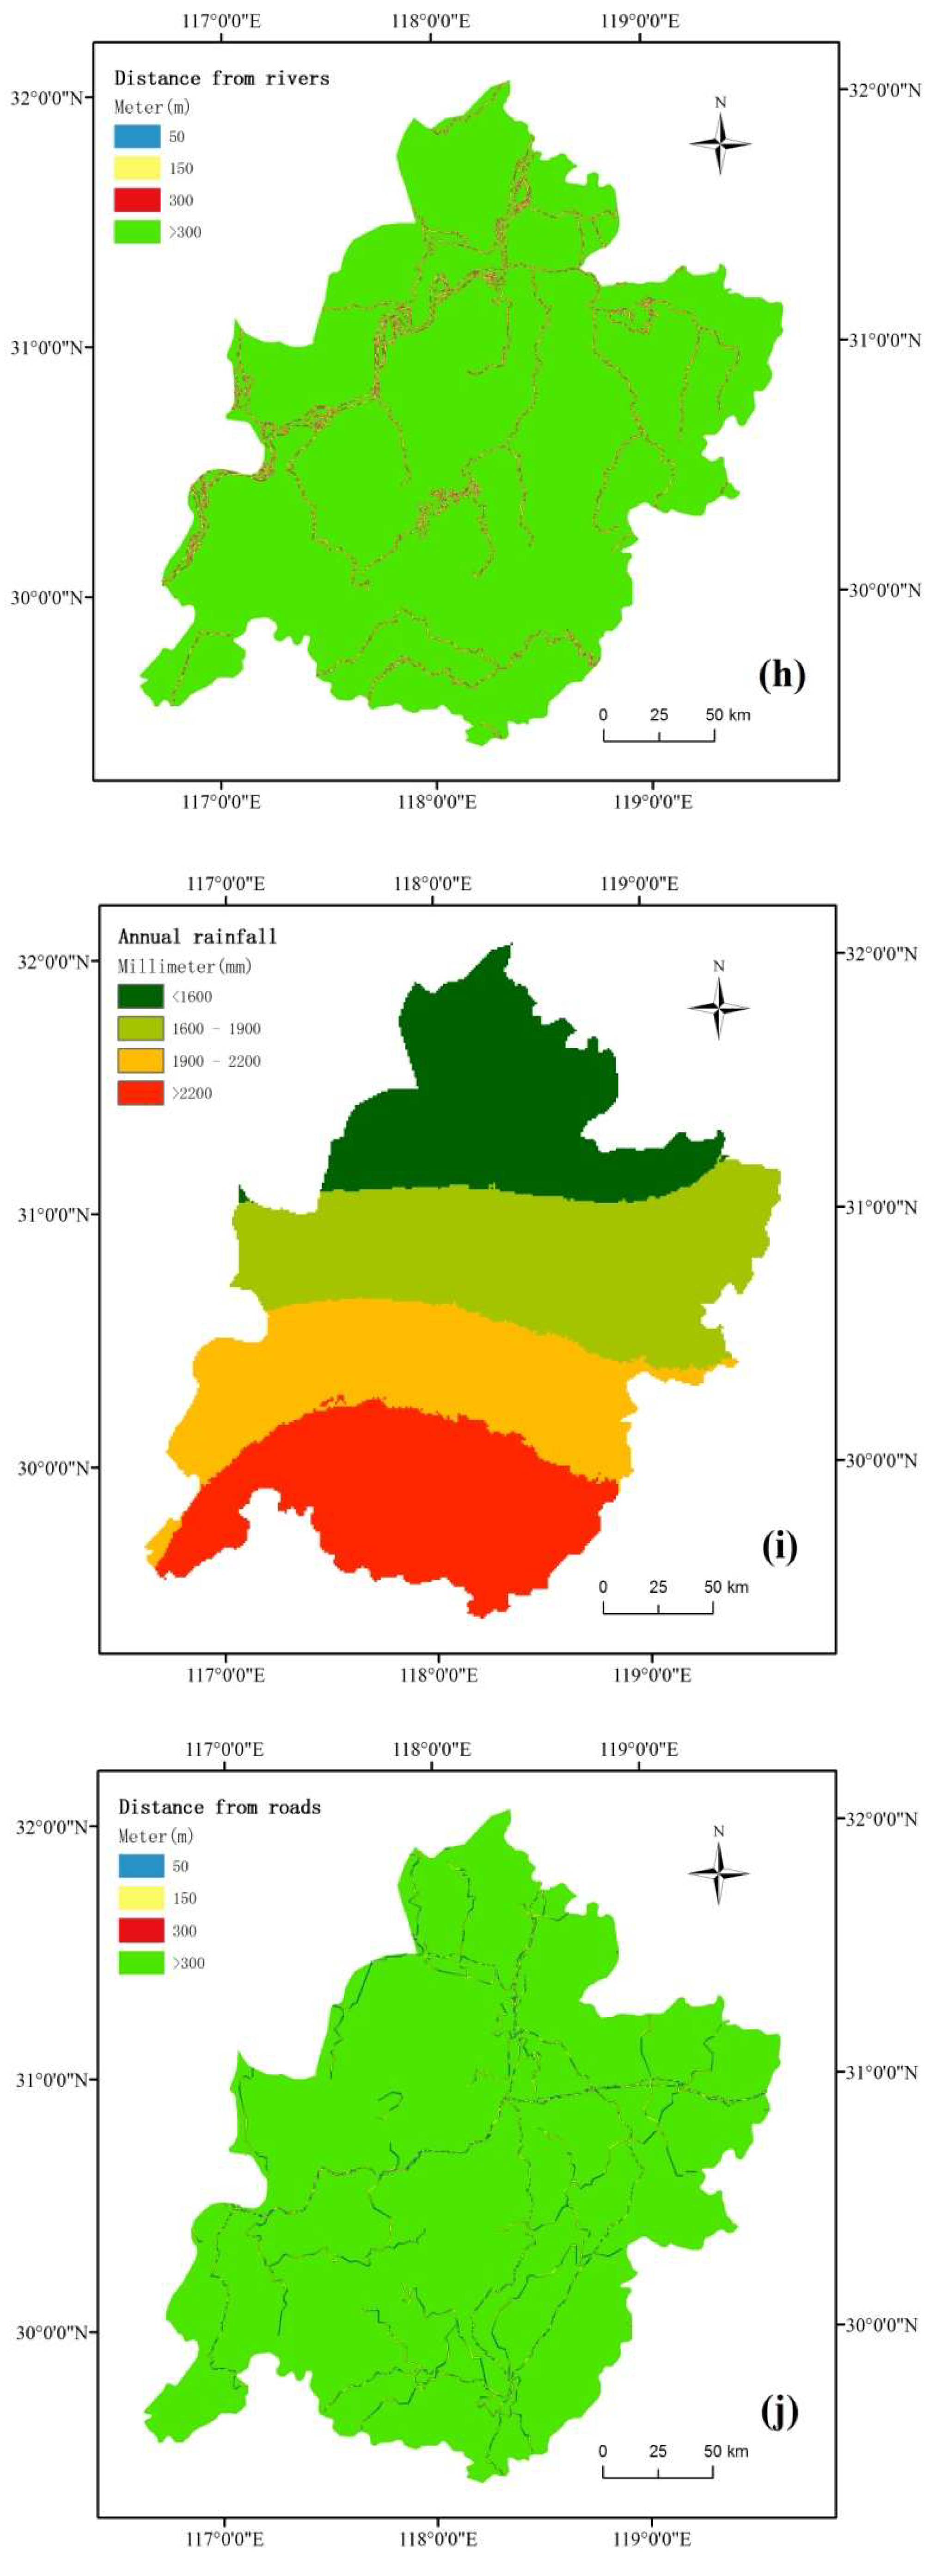
- (h)
- Distance from rivers. Four types of buffer zones are created at distances of <50, 50–150, 150–300 and >300 m from the river.
- (i)
- Annual rainfall. Annual rainfall is categorized into four ranges: <1600, 1600–1900, 1900–2200 and >2200 mm.
- (j)
- Distance from roads. Four types of buffer zones are created at distances of <50, 50–150, 150–300 and >300 m from the road.
2.3.3. AHP-Weighted Information Content Method
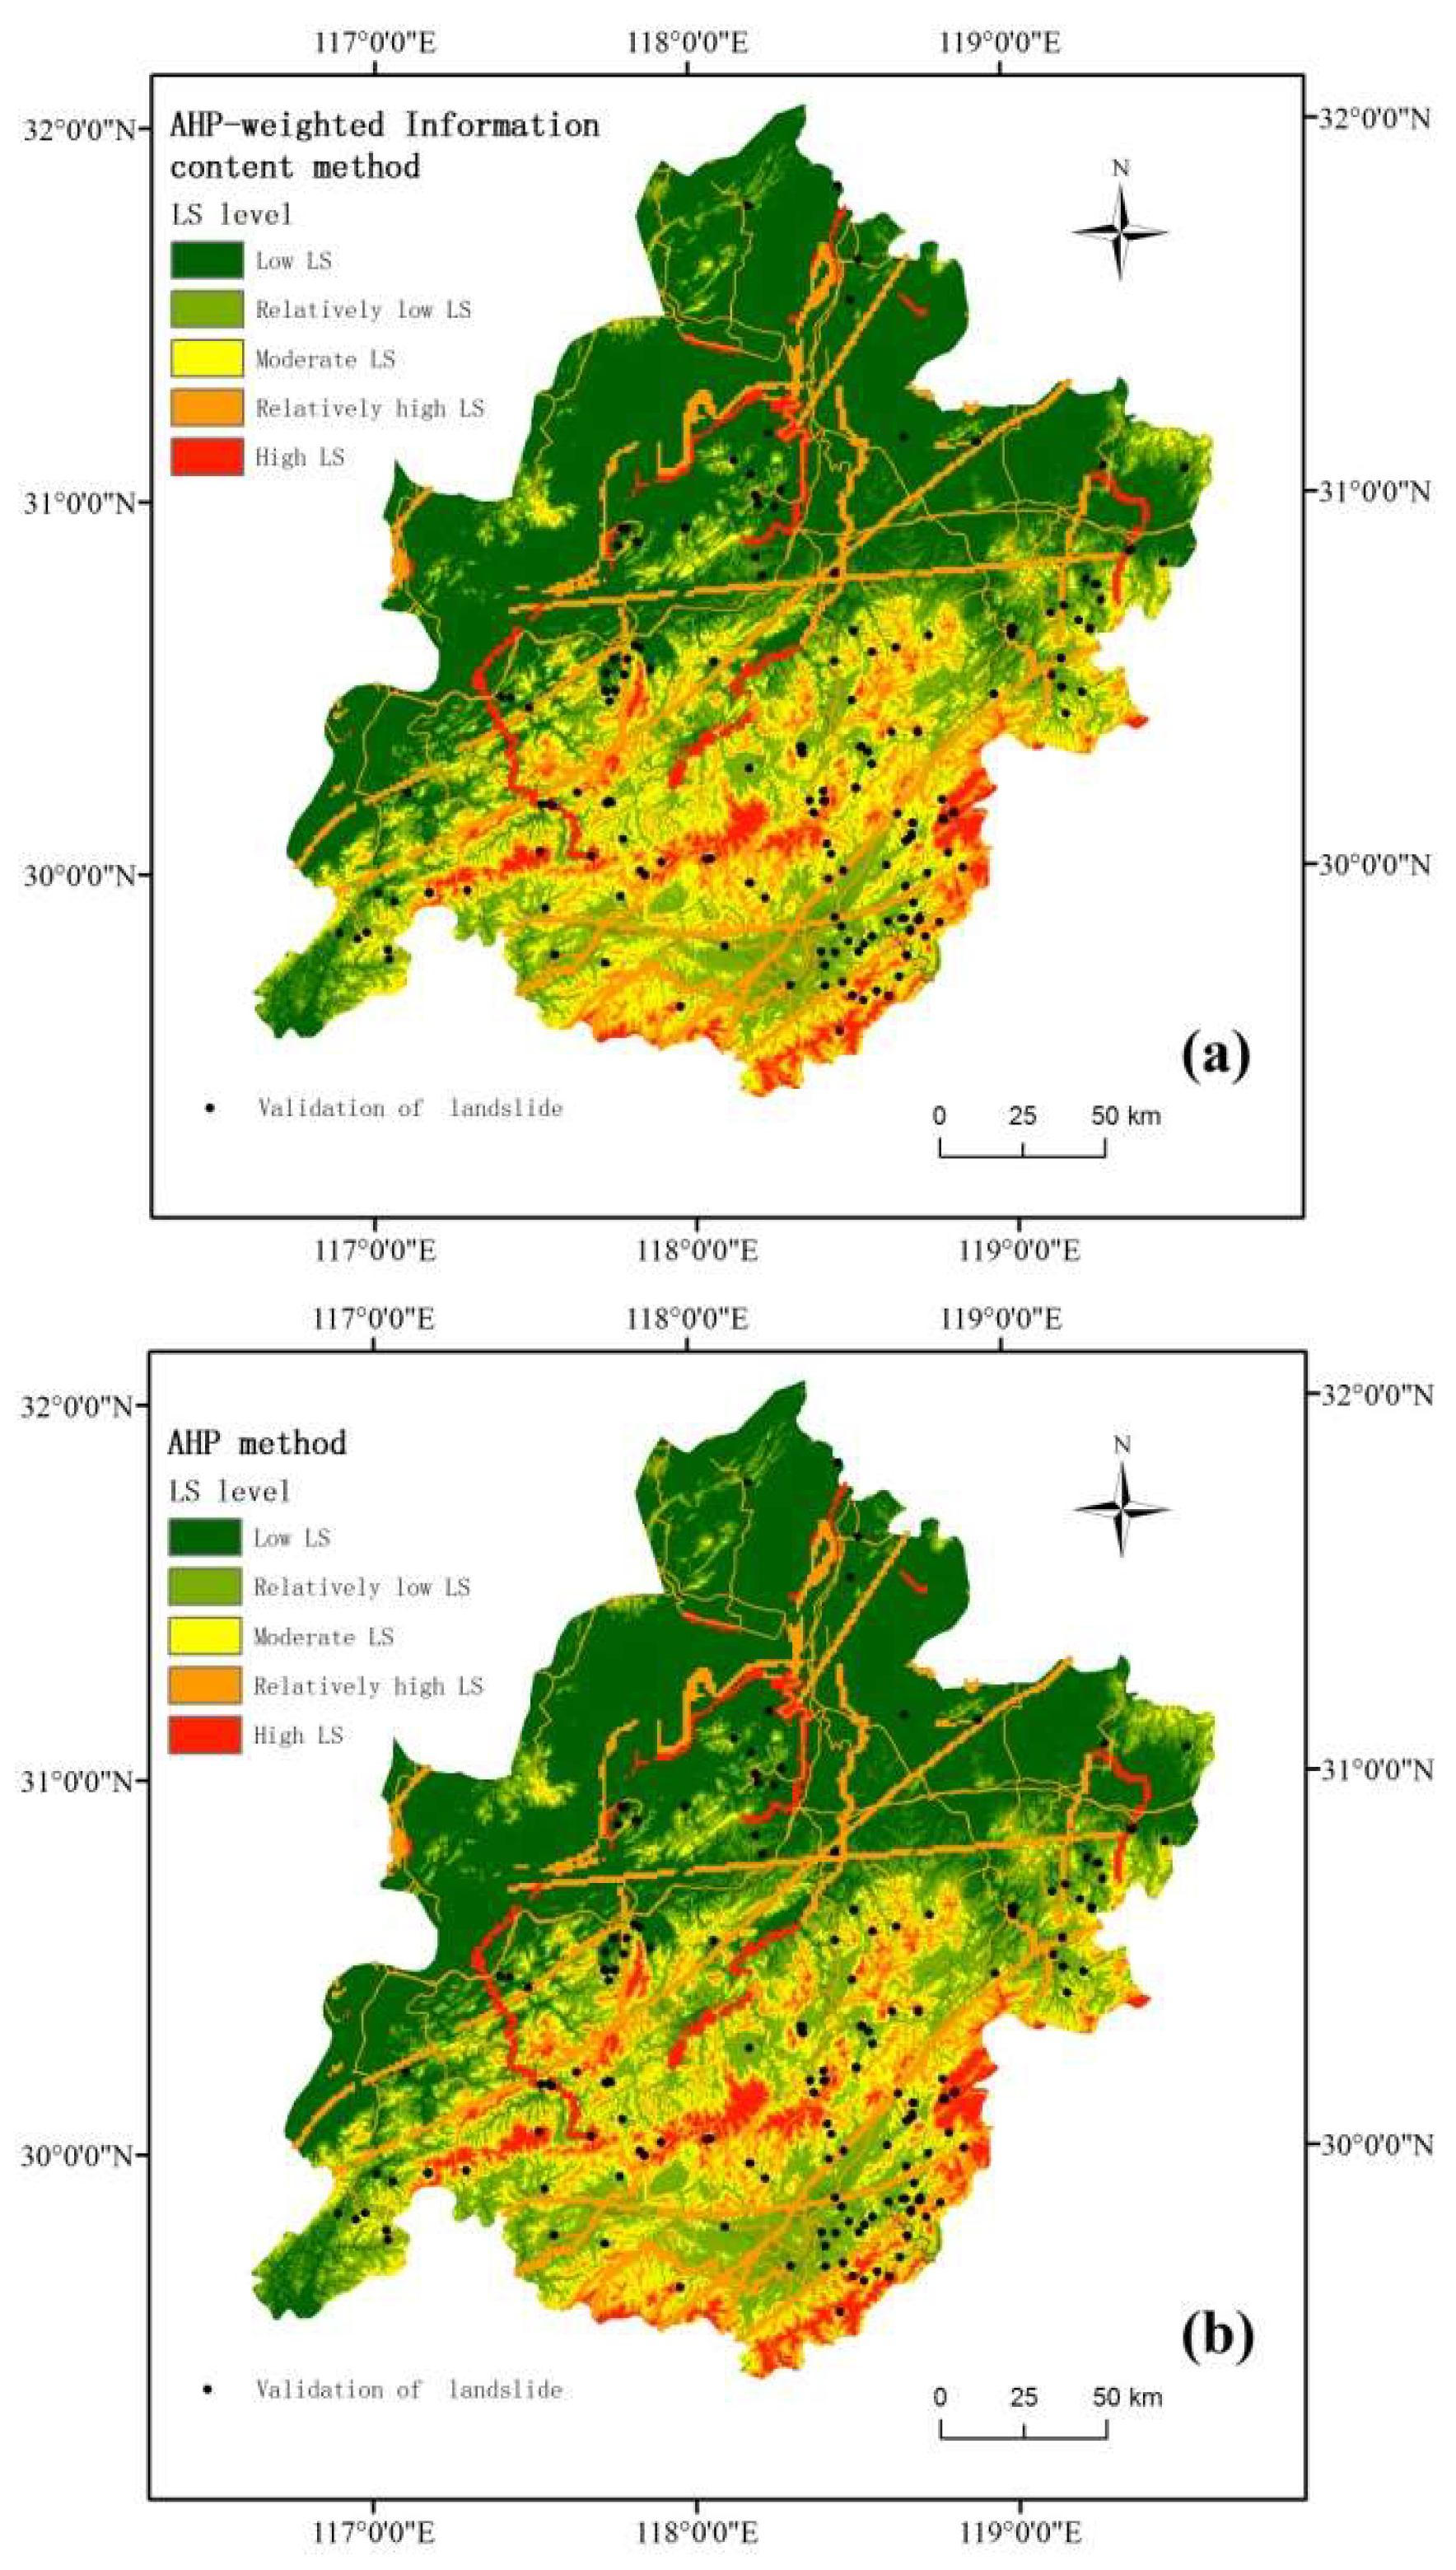
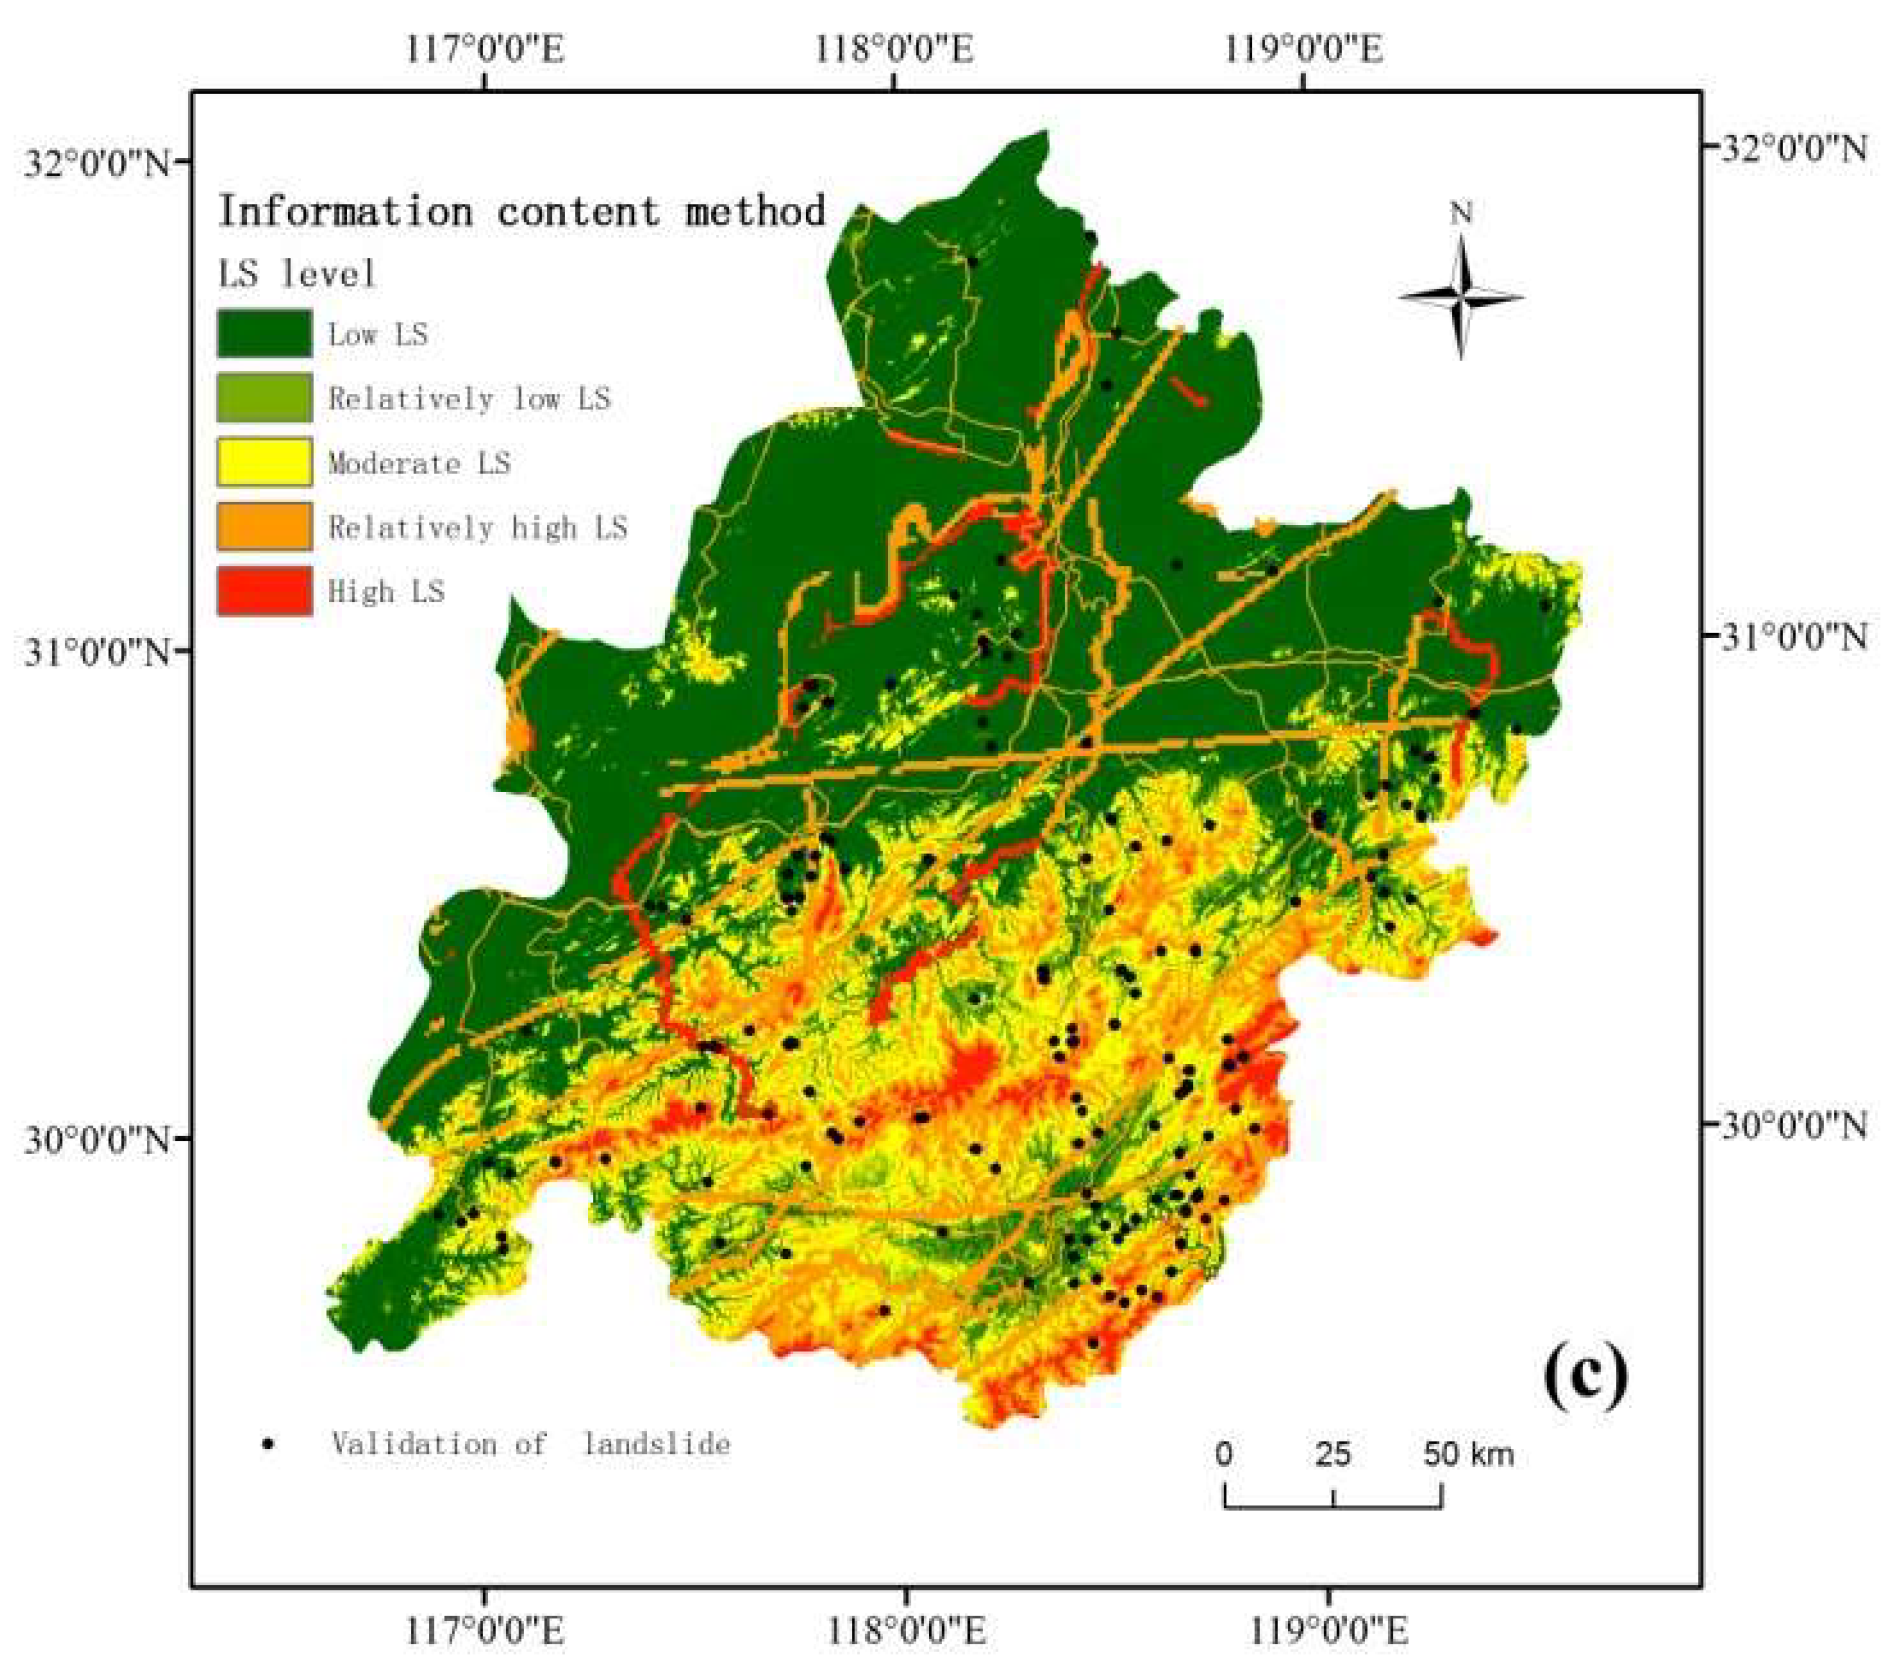
3. Results
- (a)
- Lithology: Formation lithology is the material basis for landslide formation and activity. Landslides within a certain region occur within a certain formation. Rock type and hardness affect slope stability and difficulty of surface erosion, and are two of the most important landslide-affecting factors and internal conditions for landslide formation. Landslides vary significantly between formations that differ in geologic age and lithology. Landslides in southern Anhui mostly occur in regions characterized by relatively soft rock.
- (b)
- Distance from faults: Structural fault zones, which develop on weak structural planes, contain fragmented rocks and are central locations for landslide occurrences. Small faults often become a controlling factor for landslide boundaries. In terms of the overall trend, landslides in southern Anhui are controlled by faults. The farther a region is from a fault, the lower its landslide density. Landslide numbers and area densities are significantly higher in regions within 2 km of a fault than in other regions.
- (c)
- NDVI: In a region with high vegetation coverage, soil erosion does not occur easily, terrain erosion is slow and the damage to slopes is relatively insignificant. Generally, NDVI is an important index that reflects vegetation cover. The higher the NDVI, the higher the vegetation growth. The probability of landslide occurrence in southern Anhui is relatively high in regions with a high NDVI (0.80–0.86).
- (d)
- Elevation: Elevation reflects the terrain in a small region. However, landslides are significantly affected by elevation. Clearly, landslides in southern Anhui are mainly concentrated within an elevation range of 150–450 m.
- (e)
- Slope: Slope is an important factor that affects landslide development and directly affects slope stability. The landslides occur depending on the type of landslide and the materials of the slopes, as well as on triggers such as rainfall. As a slope increases, the shear stress on the slope increases, and the probability of landslide occurrence also increases. In southern Anhui, landslides are concentrated in regions with slopes of 5°–25°, and the rate of landslide occurrence in regions with slopes of 5°–15° is the highest, suggesting that regions with slopes of 5°–15° are favorable for landslide occurrence in southern Anhui.
- (f)
- Aspect: Slopes with different aspects differ in solar radiation intensity, which affects a multitude of factors, including temperature difference, evaporation capacity, vegetation cover and slope surface, as well as slope and landslide stability. Aspects that favor landslide occurrence in the study area are 157.5°–202.5° and 247.5°–292.5°.
- (g)
- Profile curvature: Profile curvature is categorized into three types—convex slopes (profile curvature > 0.5), concave slopes (profile curvature < −0.5) and linear slopes (−0.5 < profile curvature < 0.5). In contrast, precipitation can easily accumulate on a concave slope, which will soften the soil. Concave slopes in southern Anhui are the most prone to landslides.
- (h)
- Distance from rivers: Rivers stress the conditions of landslide masses and alter their previous stable state, which may allow landslides to occur more easily. Landslides are active in regions where scouring intensity is enhanced as a result of hydrostatic action or human disturbance. In southern Anhui, there is a high probability of landslide occurrence in regions within 0–50 m of a river.
- (i)
- Annual rainfall: Precipitation is the most important landslide-inducing factor in southern Anhui. Heavy-precipitation storms and persistent rainfall can both induce landslides. In regions with loose soil, rainwater infiltrates the slopes, thereby inducing landslides. In southern Anhui, there is a relatively high probability of landslide occurrence in regions with annual rainfall greater than 1900 mm.
- (j)
- Distance from roads: It is obvious that the artificial and natural parts of slopes around roads are more sensitive to landslide manifestation [29]. In southern Anhui, there is a high probability of landsliding in regions within 0–150 m of a road.
4. Discussion
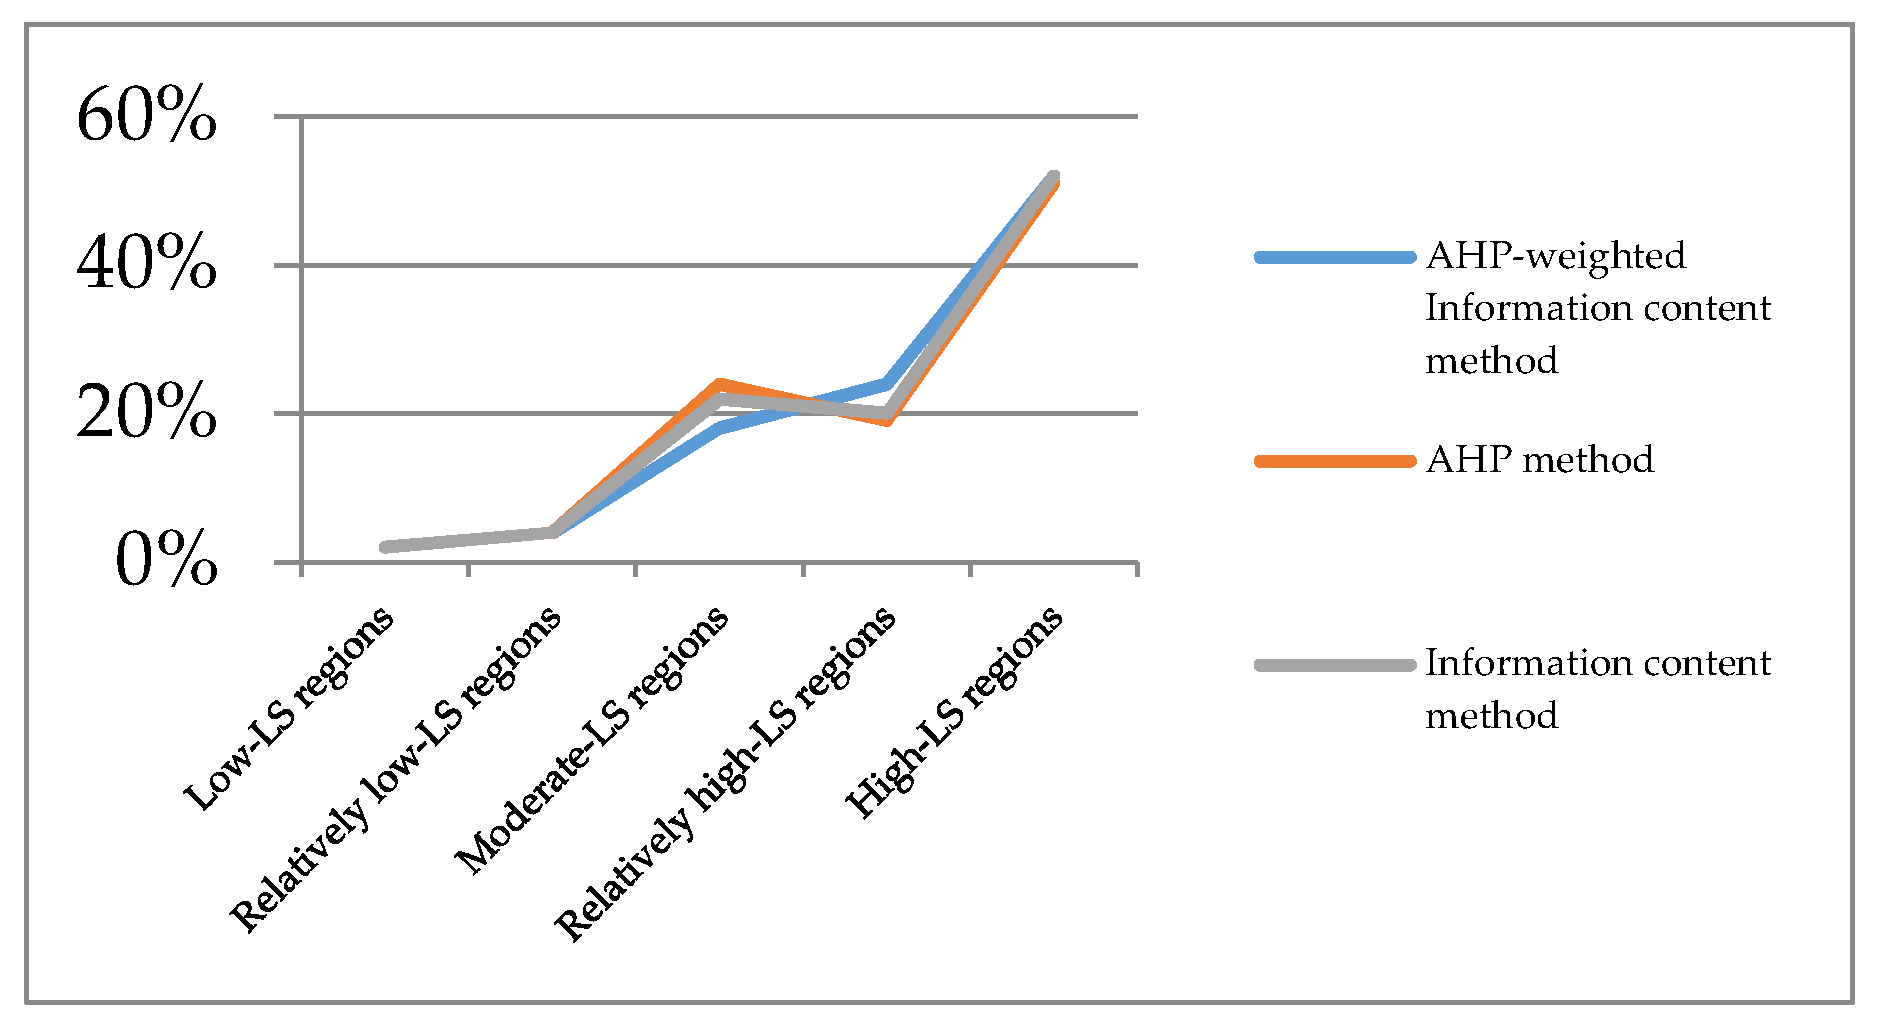
4.1. Random Landslide Site for the Validating Models Assessment and Analysis
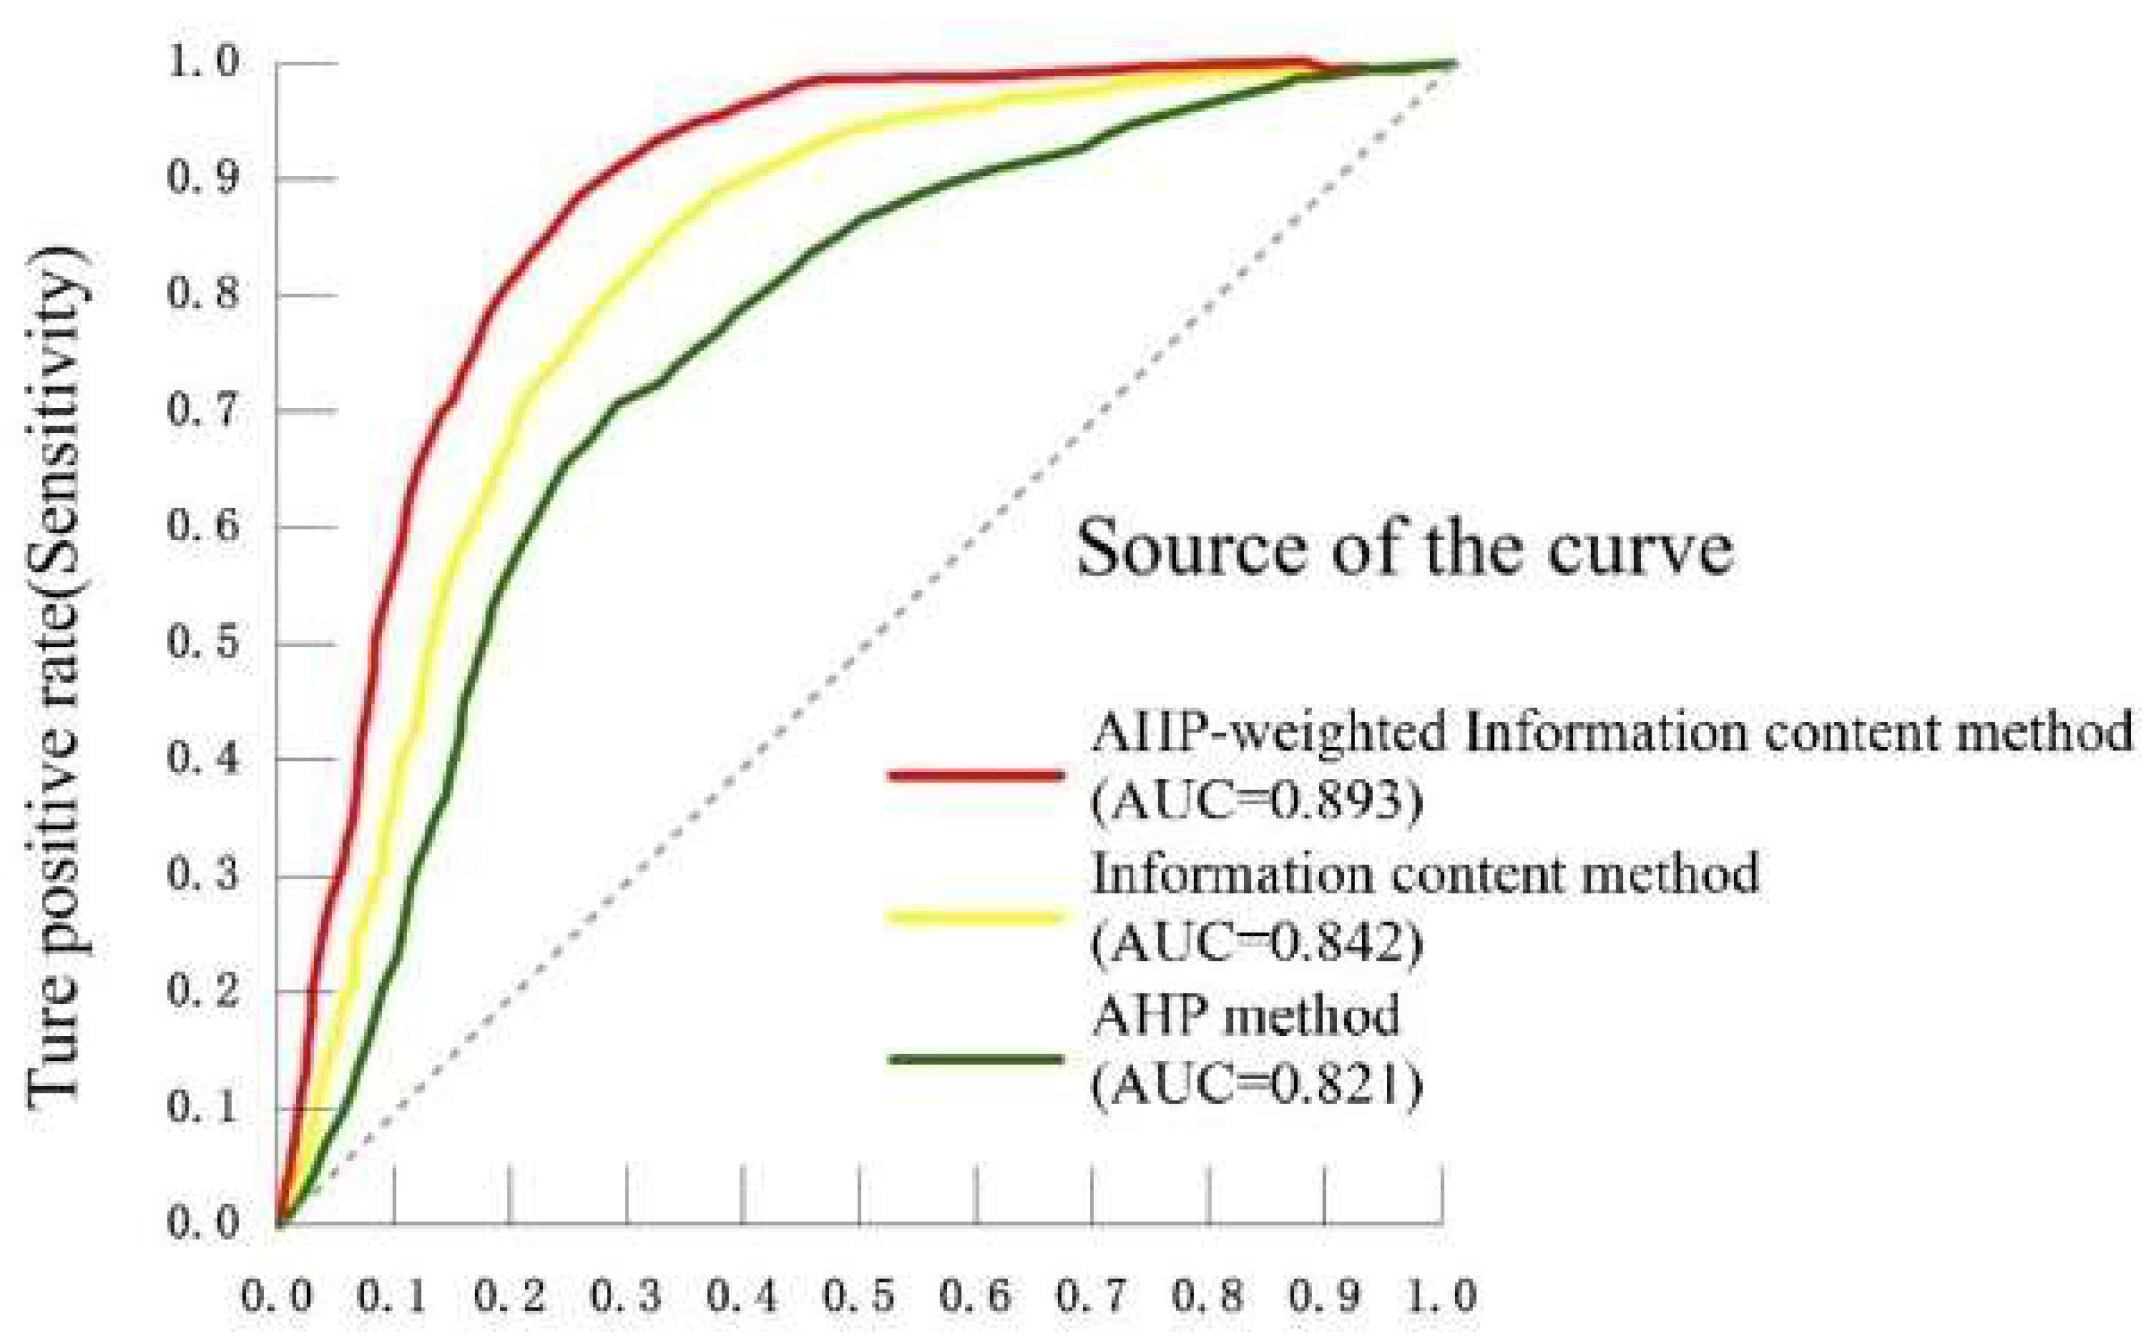
4.2. AUC-Based Comparative Analysis
5. Conclusions
Author Contributions
Funding
Acknowledgments
Conflicts of Interest
References
- Guzzetti, F.; Mondini, A.C.; Cardinali, M.; Fiorucci, F.; Santangelo, M.; Chang, K.T. Landslide inventory maps: New tools for an old problem. Earth-Sci. Rev. 2012, 112, 42–66. [Google Scholar] [CrossRef] [Green Version]
- Clerici, A.; Perego, S.; Tellini, C. A procedure for landslide susceptibility zonation by the conditional analysis method. Geomorphology 2002, 48, 349–364. [Google Scholar] [CrossRef]
- Bunce, C.M.; Cruden, D.M.; Morgenstern, N.R. Assessment of the hazard from rock fall on a highway. Can. Geotech. J. 1997, 34, 344–356. [Google Scholar] [CrossRef]
- Yamagishi, H. Integrated Disaster Prevention Maps and Landslide Hazard Maps using GIS: Examples of Shikoku and Central America Honduras. J. Jpn. Landslide Soc. 2014, 51, 24–29. [Google Scholar] [CrossRef]
- Yamagishi, H. GIS Landslide: Identification and Mapping of Landslides; Springer: Tokyo, Japan, 2017. [Google Scholar]
- Yamagishi, H.; Doshida, S.; Pimiento, E. GIS Analysis of Heavy-Rainfall Induced Shallow Landslides in Japan. In Landslide Science and Practice; Springer: Berlin, Germany, 2013. [Google Scholar]
- Froude, M.J.; Petley, D.N. Global fatal landslide occurrence from 2004 to 2016. Nat. Hazards Earth Syst. Sci. 2018, 18, 2161–2181. [Google Scholar] [CrossRef] [Green Version]
- Westen, C.J.V.; Asch, T.W.J.V.; Soeters, R. Landslide hazard and risk zonation—Why is it still so difficult? Bull. Eng. Geol. Environ. 2006, 65, 167–184. [Google Scholar] [CrossRef]
- Metternicht, G.; Hurni, L.; Gogu, R. Remote sensing of landslides: An analysis of the potential contribution to geo-spatial systems for hazard assessment in mountainous environments. Remote Sens. Environ. 2005, 98, 284–303. [Google Scholar] [CrossRef]
- Westen, C.J.V.; Castellanos, E.; Kuriakose, S.L. Spatial data for landslide susceptibility, hazard, and vulnerability assessment: An overview. Eng. Geol. 2008, 102, 112–131. [Google Scholar] [CrossRef]
- Hou, W.; Lu, X.; Wu, P.; Xue, A.; Li, L. An integrated approach for monitoring and information management of the Guanling Landslide (China). ISPRS Int. J. Geo-Inf. 2017, 6, 79. [Google Scholar] [CrossRef]
- Fell, R.; Corominas, J.; Bonnard, C.; Cascini, L.; Leroi, E.; Savage, W.Z. Guidelines for landslide susceptibility, hazard and risk zoning for land use planning. Eng. Geol. 2007, 102, 85–98. [Google Scholar] [CrossRef]
- Chalkias, C.; Ferentinou, M.; Polykretis, C. GIS supported landslide susceptibility modeling at regional scale: An expert-based fuzzy weighting method. ISPRS Int. J. Geo-Inf 2014, 3, 523–539. [Google Scholar] [CrossRef]
- Deng, X.; Li, L.; Tan, Y. Validation of spatial prediction models for landslide susceptibility mapping by considering structural similarity. ISPRS Int. J. Geo-Inf. 2017, 6, 103. [Google Scholar] [CrossRef]
- Eeckhaut, M.V.D.; Poesen, J.; Verstraeten, G.; Vanacker, V.; Moeyersons, J.; Nyssen, J. The effectiveness of hillshade maps and expert knowledge in mapping old deep-seated landslides. Geomorphology 2005, 67, 351–363. [Google Scholar] [CrossRef]
- Zhu, A.X.; Wang, R.; Qiao, J.; Qin, C.Z.; Chen, Y.; Liu, J. An expert knowledge-based approach to landslide susceptibility mapping using GIS and fuzzy logic. Geomorphology 2014, 214, 128–138. [Google Scholar] [CrossRef]
- Bai, S.; Lu, G.; Wang, J. GIS-based rare events logistic regression for landslide-susceptibility mapping of Lianyungang, China. Environ. Environ. Earth Sci. 2010, 62, 139–149. [Google Scholar] [CrossRef]
- Yilmaz, I. Landslide susceptibility mapping using frequency ratio, logistic regression, artificial neural networks and their comparison: A case study from Kat landslides (Tokat—Turkey). Comput. Geosci. 2009, 35, 1125–1138. [Google Scholar] [CrossRef]
- Liao, Q.L.; Li, X.; Lee, S.; Dong, Y.H. Occurrence, geology and geomorphy characteristics and origin of qianjiangping landslide in three gorges reservoir area and study on ancient landslide criterion. Chin. J. Rock Mech. Eng. 2005, 24, 3146–3153. [Google Scholar]
- Pourghasemi, H.R.; Mohammady, M.; Pradhan, B. Landslide susceptibility mapping using index of entropy and conditional probability models in gis: Safarood basin, Iran. Catena 2012, 97, 71–84. [Google Scholar] [CrossRef]
- Vahidnia, M.H.; Alesheikh, A.A.; Alimohammadi, A.; Hosseinali, F. A gis-based neuro-fuzzy procedure for integrating knowledge and data in landslide susceptibility mapping. Comput. Geosci. 2010, 36, 1101–1114. [Google Scholar] [CrossRef]
- Akgun, A.; Sezer, E.A.; Nefeslioglu, H.A.; Gokceoglu, C.; Pradhan, B. An easy-to-use MATLAB program (MamLand) for the assessment of landslide susceptibility using a Mamdani fuzzy algorithm. Comput. Geosci. 2012, 38, 23–34. [Google Scholar] [CrossRef]
- Tien Bui, D.; Pradhan, B.; Lofman, O.; Revhaug, I.; Dick, O.B. Spatial prediction of landslide hazards in Hoa Binh province (Vietnam): A comparative assessment of the efficacy of evidential belief functions and fuzzy logic models. Catena 2012, 96, 28–40. [Google Scholar] [CrossRef]
- Yoshimatsu, H.; Abe, S. A review of landslide hazards in Japan and assessment of their susceptibility using an analytical hierarchic process (ahp) method. Landslides 2006, 3, 149–158. [Google Scholar] [CrossRef]
- Kayastha, P.; Dhital, M.R.; De Smedt, F. Application of the analytical hierarchy process (ahp) for landslide susceptibility mapping: A case study from the Tinau watershed, west Nepal. Comput. Geosci. 2013, 52, 398–408. [Google Scholar] [CrossRef]
- Hasekioǧullari, G.D.; Ercanoglu, M. A new approach to use AHP in landslide susceptibility mapping: A case study at Yenice (Karabuk, NW Turkey). Nat. Hazards 2012, 63, 1157–1179. [Google Scholar] [CrossRef]
- Bathrellos, G.D.; Skilodimou, H.D.; Chousianitis, K.; Youssef, A.M.; Pradhan, B. Suitability estimation for urban development using multi-hazard assessment map. Sci. Total Environ. 2017, 575, 119–134. [Google Scholar] [CrossRef] [PubMed]
- Skilodimou, H.D.; Bathrellos, G.D.; Chousianitis, K.; Youssef, A.M.; Pradhan, B. Multi-hazard assessment modeling via multi-criteria analysis and GIS: A case study. Environ. Earth Sci. 2019, 78, 47. [Google Scholar] [CrossRef]
- Rozos, D.; Bathrellos, G.D.; Skilodimou, H.D. Comparison of the implementation of Rock Engineering System (RES) and Analytic Hierarchy Process (AHP) methods, based on landslide susceptibility maps, compiled in GIS environment. A case study from the Eastern Achaia County of Peloponnesus, Greece. Environ. Earth Sci. 2011, 63, 49–63. [Google Scholar] [CrossRef]
- Pradhan, B.; Lee, S. Landslide susceptibility assessment and factor effect analysis: Backpropagation artificial neural networks and their comparison with frequency ratio and bivariate logistic regression modelling. Environ. Model. Softw. 2010, 25, 747–759. [Google Scholar] [CrossRef]
- Lee, S.; Talib, J.A. Probabilistic landslide susceptibility and factor effect analysis. Environ. Geol. 2005, 47, 982–990. [Google Scholar] [CrossRef]
- Gao, K.; Cui, P.; Zhao, C.; Wei, F. Landslide hazard evaluation of wanzhou based on gis information value method in the three gorges reservoir. Chin. J. Rock Mech. Eng. 2006, 25, 991–996. [Google Scholar]
- Che, V.B.; Kervyn, M.; Suh, C.E.; Fontijn, K.; Ernst, G.G.J.; Marmol, M.A.D. Landslide susceptibility assessment in limbe (SW Cameroon): A field calibrated seed cell and information value method. Catena 2012, 92, 83–98. [Google Scholar] [CrossRef]
- Wang, J.; Yin, K.; Xiao, L. Landslide susceptibility assessment based on gis and weighted information value: A case study of wanzhou district, three gorges reservoir. Chin. J. Rock Mech. Eng. 2014, 33, 797–808. [Google Scholar]
- Hong, H.; Ilia, I.; Tsangaratos, P.; Wei, C.; Chong, X. A hybrid fuzzy weight of evidence method in landslide susceptibility analysis on the Wuyuan area, China. Geomorphology 2017, 290, 1–16. [Google Scholar] [CrossRef]
- Wang, Z.W.; Li, D.-Y.; Wang, X.G. Zonation of landslide hazards based on weights of evidence model. Chin. J. Geotech. Eng. 2007, 29, 1268–1273. [Google Scholar]
- Ayalew, L.; Yamagishi, H. The application of gis-based logistic regression for landslide susceptibility mapping in the kakuda-yahiko mountains, central Japan. Geomorphology 2005, 65, 15–31. [Google Scholar] [CrossRef]
- Gorsevski, P.V.; Gessler, P.E.; Foltz, R.B.; Elliot, W.J. Spatial prediction of landslide hazard using logistic regression and roc analysis. Trans. GIS 2010, 10, 395–415. [Google Scholar] [CrossRef]
- Akcay, O. Landslide fissure inference assessment by ANFIS and logistic regression using UAS-based photogrammetry. ISPRS Int. J. Geo-Inf. 2015, 4, 2131–2158. [Google Scholar] [CrossRef]
- Kayastha, P.; Dhital, M.R.; Smedt, F. Evaluation of the consistency of landslide susceptibility mapping: A case study from the kankai watershed in east Nepal. Landslides 2013, 10, 785–799. [Google Scholar] [CrossRef]
- Felicísimo, Á.M. Mapping landslide susceptibility with logistic regression, multiple adaptive regression splines, classification and regression trees, and maximum entropy methods: A comparative study. Landslides 2013, 10, 175–189. [Google Scholar] [CrossRef]
- Jiang, W.; Rao, P.; Cao, R.; Tang, Z.; Chen, K. Comparative evaluation of geological disaster susceptibility using multi-regression methods and spatial accuracy validation. J. Geogr. Sci. 2017, 27, 439–462. [Google Scholar] [CrossRef] [Green Version]
- Youssef, A.M.; Pourghasemi, H.R.; Pourtaghi, Z.S.; Al-Katheeri, M.M. Landslide susceptibility mapping using random forest, boosted regression tree, classification and regression tree, and general linear models and comparison of their performance at Wadi Tayyah Basin, Asir Region, Saudi Arabia. Landslides 2016, 13, 839–856. [Google Scholar] [CrossRef]
- Genuer, R.; Poggi, J.M.; Tuleau-Malot, C. Variable selection using Random Forests. Pattern Recognit. Lett. 2010, 31, 2225–2236. [Google Scholar] [CrossRef]
- Hong, H.; Pourghasemi, H.R.; Pourtaghi, Z.S. Landslide susceptibility assessment in Lianhua County (China): A comparison between a random forest data mining technique and bivariate and multivariate statistical models. Geomorphology 2016, 259, 105–118. [Google Scholar] [CrossRef]
- Zhang, M.; Liu, J. Controlling factors of loess landslides in western China. Environ. Earth Sci. 2010, 59, 1671–1680. [Google Scholar] [CrossRef]
- Wang, Y.; Lin, Q.; Shi, P. Spatial pattern and influencing factors of casualty events caused by landslides. Acta Geogr. Sin. 2017, 72, 906–917. [Google Scholar]
- Bui, D.T.; Pradhan, B.; Lofman, O. Landslide susceptibility assessment in the Hoa Binh province of Vietnam: A comparison of the Levenberg–Marquardt and Bayesian regularized neural networks. Geomorphology 2012, 171, 12–29. [Google Scholar]
- Yamagishi, H.; Iwahashi, J. Comparison between the two triggered landslides in Mid-Niigata, Japan by July 13 heavy rainfall and October 23 intensive earthquakes in 2004. Landslides 2007, 4, 389–397. [Google Scholar] [CrossRef]
- Reichenbach, P.; Rossi, M.; Malamud, B.D.; Mihir, M.; Guzzetti, F. A review of statistically-based landslide susceptibility models. Earth-Sci. Rev. 2018, 180, 60–91. [Google Scholar] [CrossRef]
- Pradhan, B.A. Comparative study on the predictive ability of the decision tree, support vector machine and neuro-fuzzy models in landslide susceptibility mapping using GIS. Comput. Geosci. 2013, 51, 350–365. [Google Scholar] [CrossRef]
- Lan, H.X. Study on GIS-aided model for analysis of landslide hazard. J. Eng. Geol. 2002, 12, 4139–4181. [Google Scholar]
- Tsangaratos, P.; Ilia, I.; Hong, H.; Chen, W.; Xu, C. Applying information theory and GIS-based quantitative methods to produce landslide susceptibility maps in Nancheng County, China. Landslides 2016, 14, 1091–1111. [Google Scholar] [CrossRef]
- Devkota, K.C.; Regmi, A.D.; Pourghasemi, H.R. Landslide susceptibility mapping using certainty factor, index of entropy and logistic regression models in GIS and their comparison at Mugling–Narayanghat road section in Nepal Himalaya. Nat. Hazards 2013, 65, 135–165. [Google Scholar] [CrossRef]
- Ba, Q.Q.; Chen, Y.M.; Deng, S.S.; Wu, Q.J.; Yang, J.X.; Zhang, J.Y. An improved information value model based on gray clustering for landslide susceptibility mapping. ISPRS Int. J. Geo-Inf. 2017, 6, 18. [Google Scholar] [CrossRef]
- Feizizadeh, B.; Roodposhti, M.S.; Jankowski, P.; Blaschke, T. A GIS-based extended fuzzy multi-criteria evaluation for landslide susceptibility mapping. Comput. Geosci. 2014, 73, 208–221. [Google Scholar] [CrossRef] [PubMed] [Green Version]
- Nefeslioglu, H.A.; Sezer, E.A.; Gokceoglu, C.; Ayas, Z. A modified analytical hierarchy process (M-AHP) approach for decision support systems in natural hazard assessments. Comput. Geosci. 2013, 59, 1–8. [Google Scholar] [CrossRef]
- Chhetri, S.; Kayastha, P. Manifestation of an analytic hierarchy process (AHP) model on fire potentialzonation mapping in Kathmandu Metropolitan City, Nepal. ISPRS Int. J. Geo-Inf. 2015, 4, 400–417. [Google Scholar] [CrossRef]
- Carrara, A.; Cardinali, M.; Detti, R.; Guzzetti, F.; Pasqui, V.; Reichenbach, P. GIS techniques and statistical models in evaluating landslide hazard. Earth Surf. Process. Landf. 2010, 16, 427–445. [Google Scholar] [CrossRef]
- Wang, F.; Xu, P.; Wang, C.; Wang, N.; Jiang, N. Application of a gis-based slope unit method for landslide susceptibility mapping along the Longzi river, southeastern Tibetan plateau, China. ISPRS Int. J. Geo-Inf. 2017, 6, 172. [Google Scholar] [CrossRef]


| Landslide Factor | Origin Website | Description |
| (a) Lithology | http://geocloud.cgs.gov.cn | The hardness of Rocks |
| (b) Distance from faults | http://geocloud.cgs.gov.cn | Buffer range of faults |
| (c) NDVI | http://www.resdc.cn | Normalized difference vegetation index |
| (d) Elevation | https://www.usgs.gov | 30 m digital elevation model |
| (e) Slope | https://www.usgs.gov | Extracted from digital elevation model (DEM) |
| (f) Aspect | https://www.usgs.gov | Extracted from digital elevation model (DEM) |
| (g) Profile curvature | https://www.usgs.gov | Extracted from digital elevation model (DEM) |
| (h) Distance from rivers | http://www.resdc.cn | Buffer range of rivers |
| (i) Annual rainfall | http://www.resdc.cn | Interpolation based on 2400 stations in China (2000–2015) by ANUSPLIN package which is to provide a facility for transparent analysis and interpolation of noisy multi-variate data using thin plate smoothing splines. |
| (j) Distance from roads | https://www.openstreetmap.org | Buffer range of first grade roads |
| Landslide Sites | Origin Website | Description |
| Shallow landslide | http://ags.org.cn/ http://ahdzhj.com/ | Derived from field measurement and interprets the satellite images |
| P1 | P2 | P3 | P4 | P5 | P6 | P7 | P8 | P9 | P10 | Weight | |
|---|---|---|---|---|---|---|---|---|---|---|---|
| P1 | 1 | 4 | 3 | 4 | 2 | 5 | 4 | 2 | 3 | 2 | 0.2143 |
| P2 | 1/4 | 1 | 1/2 | 2 | 1/5 | 3 | 1 | 1/3 | 1/2 | 1 | 0.0558 |
| P3 | 1/3 | 2 | 1 | 2 | 1/5 | 3 | 1/2 | 1/3 | 1/2 | 1/3 | 0.0573 |
| P4 | 1/4 | 1/2 | 1/2 | 1 | 1/4 | 3 | 1/3 | 1/3 | 1/3 | 1/3 | 0.0364 |
| P5 | 1/2 | 5 | 5 | 4 | 1 | 6 | 4 | 2 | 3 | 3 | 0.2101 |
| P6 | 1/5 | 1/3 | 1/3 | 1/3 | 1/6 | 1 | 1/4 | 1/2 | 1/4 | 1/4 | 0.0262 |
| P7 | 1/4 | 1 | 1/2 | 3 | 1/4 | 4 | 1 | 1/4 | 1/2 | 1/4 | 0.0565 |
| P8 | 1/2 | 3 | 3 | 3 | 1/2 | 2 | 4 | 1 | 1/2 | 1/2 | 0.1083 |
| P9 | 1/3 | 2 | 2 | 3 | 1/3 | 4 | 2 | 2 | 1 | 3 | 0.1226 |
| P10 | 1/2 | 1 | 3 | 3 | 1/3 | 4 | 4 | 2 | 1/3 | 1 | 0.1126 |
| P1 = lithology | P2 = Distance from faults | P3 = NDVI | |||||||||
| P4 = Elevation | P5 = Slope | P6 = Aspect | |||||||||
| P7 = Profile curvature | P8 = Distance from rivers | P9 = Annual rainfall | |||||||||
| P10 = Distance from roads | CR = 0.57 < 1 | ||||||||||
| Landslide Factor | Property of Factor | Level | Ni | Ni/N | Si/S | I | Weight | Weighted Information Content | Rank |
|---|---|---|---|---|---|---|---|---|---|
| (a) Lithology | Hardness | Hard rocks | 26 | 0.0525 | 0.0920 | −0.5605 | 0.2143 | −0.1201 | 44 |
| Relatively hard rocks | 226 | 0.4566 | 0.2639 | 0.5482 | 0.2143 | 0.1175 | 6 | ||
| Relatively soft rocks | 228 | 0.4606 | 0.3038 | 0.4162 | 0.2143 | 0.0892 | 10 | ||
| Soft rocks | 12 | 0.0242 | 0.3403 | −2.6417 | 0.2143 | −0.5661 | 46 | ||
| (b) Distance from faults | Meter (m) | 0–1000 | 36 | 0.0727 | 0.0835 | −0.1381 | 0.0558 | −0.0077 | 29 |
| 1000–2000 | 32 | 0.0646 | 0.0829 | −0.2487 | 0.0558 | −0.0139 | 33 | ||
| 2000–3000 | 21 | 0.0424 | 0.0822 | −0.6614 | 0.0558 | −0.0369 | 36 | ||
| >3000 | 403 | 0.8141 | 0.7514 | 0.0802 | 0.0558 | 0.0045 | 20 | ||
| (c) NDVI | Ratio | 0–0.74 | 57 | 0.1152 | 0.2250 | −0.6699 | 0.0573 | −0.0384 | 37 |
| 0.74–0.80 | 78 | 0.1576 | 0.1458 | 0.0777 | 0.0573 | 0.0045 | 21 | ||
| 0.80–0.86 | 162 | 0.3273 | 0.2193 | 0.4004 | 0.0573 | 0.0229 | 16 | ||
| 0.86–0.92 | 195 | 0.3939 | 0.4099 | −0.0397 | 0.0573 | −0.0023 | 27 | ||
| (d) Elevation | Meter (m) | 0–150 | 147 | 0.2970 | 0.5752 | −0.6611 | 0.0364 | −0.0241 | 35 |
| 150–300 | 196 | 0.3960 | 0.1933 | 0.7173 | 0.0364 | 0.0261 | 15 | ||
| 300–450 | 111 | 0.2242 | 0.1091 | 0.7207 | 0.0364 | 0.0262 | 14 | ||
| 450–600 | 33 | 0.0667 | 0.0596 | 0.1121 | 0.0364 | 0.0041 | 23 | ||
| >600 | 5 | 0.0101 | 0.0628 | −1.8279 | 0.0364 | −0.0665 | 41 | ||
| (e) Slope | Degree (°) | 0–5 | 143 | 0.2889 | 0.4487 | −0.4403 | 0.2101 | −0.0925 | 43 |
| 5–10 | 125 | 0.2525 | 0.1476 | 0.5367 | 0.2101 | 0.1128 | 7 | ||
| 10–15 | 104 | 0.2101 | 0.1009 | 0.7334 | 0.2101 | 0.1541 | 5 | ||
| 15–20 | 71 | 0.1434 | 0.0941 | 0.4213 | 0.2101 | 0.0885 | 11 | ||
| 20–25 | 33 | 0.0667 | 0.0854 | −0.2475 | 0.2101 | −0.0520 | 40 | ||
| >25 | 16 | 0.0323 | 0.1232 | −1.3382 | 0.2101 | −0.2812 | 45 | ||
| (f) Aspect | Degree (°) | 337.5–22.5 | 60 | 0.1212 | 0.1220 | −0.0061 | 0.0262 | −0.0002 | 26 |
| 22.5–67.5 | 38 | 0.0768 | 0.1170 | −0.4218 | 0.0262 | −0.0111 | 31 | ||
| 67.5–112.5 | 48 | 0.0970 | 0.1248 | −0.2520 | 0.0262 | −0.0066 | 28 | ||
| 112.5–157.5 | 49 | 0.0990 | 0.1350 | −0.3103 | 0.0262 | −0.0081 | 30 | ||
| 157.5–202.5 | 84 | 0.1697 | 0.1214 | 0.3348 | 0.0262 | 0.0088 | 18 | ||
| 202.5–247.5 | 62 | 0.1253 | 0.1178 | 0.0616 | 0.0262 | 0.0016 | 24 | ||
| 247.5–292.5 | 83 | 0.1677 | 0.1251 | 0.2928 | 0.0262 | 0.0077 | 19 | ||
| 292.5–337.5 | 68 | 0.1374 | 0.1369 | 0.0032 | 0.0262 | 0.0001 | 25 | ||
| (g) Profile curvature | Shape | <−0.5 | 62 | 0.1253 | 0.0763 | 0.4960 | 0.0565 | 0.0280 | 13 |
| −0.5 to 0.5 | 196 | 0.3960 | 0.8392 | −0.7512 | 0.0565 | −0.0424 | 39 | ||
| >0.5 | 234 | 0.4727 | 0.0845 | 1.7220 | 0.0565 | 0.0973 | 9 | ||
| (h) Distance from rivers | Meter (m) | 0–50 | 38 | 0.0768 | 0.0074 | 2.3388 | 0.1083 | 0.2533 | 3 |
| 50–150 | 19 | 0.0384 | 0.0148 | 0.9559 | 0.1083 | 0.1035 | 8 | ||
| 150–300 | 22 | 0.0444 | 0.0216 | 0.7207 | 0.1083 | 0.0781 | 12 | ||
| >300 | 413 | 0.8343 | 0.9562 | −0.1363 | 0.1083 | −0.0148 | 34 | ||
| (i) Annual rainfall | Millimeter (mm) | 0–1600 | 11 | 0.0222 | 0.0244 | −0.0935 | 0.1226 | −0.0115 | 32 |
| 1600–1900 | 88 | 0.1778 | 0.2435 | −0.3146 | 0.1226 | −0.0386 | 38 | ||
| 1900–2200 | 258 | 0.5212 | 0.4688 | 0.1060 | 0.1226 | 0.0130 | 17 | ||
| >2200 | 135 | 0.2727 | 0.2633 | 0.0352 | 0.1226 | 0.0043 | 22 | ||
| (j) Distance from roads | Meter (m) | 0–50 | 102 | 0.2061 | 0.0064 | 3.4644 | 0.1126 | 0.3901 | 1 |
| 50–150 | 76 | 0.1535 | 0.0126 | 2.4965 | 0.1126 | 0.2811 | 2 | ||
| 150–300 | 85 | 0.1717 | 0.0183 | 2.2403 | 0.1126 | 0.2523 | 4 | ||
| >300 | 229 | 0.4626 | 0.9626 | −0.7327 | 0.1126 | −0.0825 | 42 |
| LS Level | AHP-Weighted Information Content Method | AHP Method | Information Content Method |
|---|---|---|---|
| Low LS regions | 2% | 2% | 2% |
| Relatively low LS regions | 4% | 4% | 4% |
| Moderate LS regions | 18% | 24% | 22% |
| Relatively high LS regions | 24% | 19% | 20% |
| High LS regions | 52% | 51% | 52% |
| Parameters | AHP-Weighted Information Content Method | AHP Method | Information Content Method |
|---|---|---|---|
| True positive | 161 | 148 | 154 |
| True negative | 161 | 162 | 162 |
| False positive | 51 | 64 | 58 |
| False negative | 51 | 50 | 50 |
| Sensitivity (%) | 0.7594 | 0.7475 | 0.7549 |
| Specificity (%) | 0.7594 | 0.7168 | 0.7364 |
| Sensitivity (%) = True positive/(True positive + False negative) | Specificity (%) = True negative/(True negative + False positive) | ||
© 2019 by the authors. Licensee MDPI, Basel, Switzerland. This article is an open access article distributed under the terms and conditions of the Creative Commons Attribution (CC BY) license (http://creativecommons.org/licenses/by/4.0/).
Share and Cite
He, H.; Hu, D.; Sun, Q.; Zhu, L.; Liu, Y. A Landslide Susceptibility Assessment Method Based on GIS Technology and an AHP-Weighted Information Content Method: A Case Study of Southern Anhui, China. ISPRS Int. J. Geo-Inf. 2019, 8, 266. https://0-doi-org.brum.beds.ac.uk/10.3390/ijgi8060266
He H, Hu D, Sun Q, Zhu L, Liu Y. A Landslide Susceptibility Assessment Method Based on GIS Technology and an AHP-Weighted Information Content Method: A Case Study of Southern Anhui, China. ISPRS International Journal of Geo-Information. 2019; 8(6):266. https://0-doi-org.brum.beds.ac.uk/10.3390/ijgi8060266
Chicago/Turabian StyleHe, Handong, Di Hu, Qun Sun, Lei Zhu, and Yanrong Liu. 2019. "A Landslide Susceptibility Assessment Method Based on GIS Technology and an AHP-Weighted Information Content Method: A Case Study of Southern Anhui, China" ISPRS International Journal of Geo-Information 8, no. 6: 266. https://0-doi-org.brum.beds.ac.uk/10.3390/ijgi8060266