An Integrated BIM–GIS Method for Planning of Water Distribution System

1
College of Architecture and Civil Engineering, Beijing University of Technology, Beijing 100124, China
2
Faculty of Society & Design, Bond University, Gold Coast 4226, Australia
*
Author to whom correspondence should be addressed.
ISPRS Int. J. Geo-Inf. 2019, 8(8), 331; https://0-doi-org.brum.beds.ac.uk/10.3390/ijgi8080331
Submission received: 14 May 2019
/
Revised: 10 July 2019
/
Accepted: 25 July 2019
/
Published: 27 July 2019
Abstract
:An important function of a water distribution system (WDS) is to supply drinking water to each demand point using a pipe network that has minimal impact on the surroundings. To produce a reliable WDS, planning usually requires a significant amount of geo-spatial information. Current planning practices for pipeline systems, which gather geographic information based on maps, are time-consuming and cumbersome. With the rapid developments in computer and information technology, it is necessary to propose a new WDS planning method that enhances the current planning practices and facilitates the decision-making process. The proposed method allows project information in building information modeling (BIM) to be incorporated into a geographic information system (GIS) model, using semantic mapping to incorporate WDS project data and geo-spatial information to facilitate the WDS planning process. Moreover, a 3D visualization model of the proposed WDS project and its surroundings is provided. In addition, topological rules are set to identify any conflicts between the WDS project and its surroundings. A real WDS project was used to validate the method. The proposed method can help project participants better understand the WDS project and its surroundings and identify any errors in the planning process, thus improving sustainable development.
1. Introduction
An underground pipe system contains water, electric power, heating, communication, gas lines, and other public services [1,2]. Underground pipe systems play an essential role in the operations of urban areas by enabling diverse public services to be delivered to industries and residences. Among the different types of pipe systems, water distribution systems (WDSs) are regarded as one of the most vital [3]. Pipe network planning is a key part of the design process, since it has a significant impact on pipeline construction and operation and maintenance. The purpose of a water pipeline is to transport fluid from one point to another through a tunnel, but differences in location, topography, development strategy, and other factors impact the layout of the pipe system. The surrounding environment is an important factor, because the natural terrain, existing facilities, and the utilities (both above and below the ground) can influence construction activities. A project that is to be constructed should fit into its neighborhood. The project should not be planned in isolation but should always be considered in the context of its surroundings, including existing facilities, locality, and topography. Hence, pipe network planning requires consideration of many factors, such as availability of the site area, space obstructions, coordination with surroundings, and topographic settings. Among these factors, space obstructions and pipeline layout present the most significant challenges during the planning process.
A WDS project may require multiple types of space, which makes it difficult to manually check for spatial conflicts between the proposed WDS project and existing structures during the planning process. Although many software products and information technologies have been employed in the Architectural, Engineering and Construction (AEC) industry, minimal improvements have been made in the planning of water distribution systems (WDSs). Planning of WDSs typically requires substantial spatial data, due to the complexity of urban surfaces and flow paths [4]. A geographic information system (GIS) can be used to describe existing facilities in a larger geographic context [5,6]. Building information modeling (BIM) can be used to store, manage, and manipulate project information. This study provides an integrated BIM and GIS method to incorporate WDS project data into its surroundings for facilitating the WDS planning process.
It is not an easy task to deliver data from BIM to GIS, due to the differences in data formatting and meaning [7,8]. The current study integrates BIM and GIS models, using semantic mapping to facilitate the transformation and sharing of multiple data formats. The proposed method enables project information in BIM to be incorporated into the GIS model, in order to investigate the spatial relationships between the proposed WDS project and its surroundings. The proposed method can help planners with spatial planning in terms of geometry and topology. Geometry refers to the physical features (e.g., dimension and location) of a project within a given area, whereas topology describes spatial relationships and constraints. Given the complexity of pipe network planning, topological rules are established in GIS to check for any conflicts between the WDS project and its surroundings. The topology tool in GIS can be used to model objects that have spatial relationships with each other, which supports different types of spatial relationships [9].
The proposed method provides a 3D visualization model of the WDS project and its surroundings, which helps project participants to better understand the project and avoid misinterpreting project information. Moreover, the proposed method also helps professionals to identify conflicts between the WDS project and existing structures. Changes made to the project during the planning stage are less costly than those made during subsequent construction stages. In addition, previous studies focused on integration of BIM and GIS that only considered building elements such as walls, windows, and doors; there are no studies investigating the interoperability of Industry Foundation Classes (IFC) and City Geography Markup Language (CityGML) for WDS planning. The current study fills a gap in the literature by introducing a method that incorporates BIM data into a GIS system for WDS planning. Also, this study informs researchers and industry professionals about potential applications of GIS in the AEC industry and highlights areas worthy of further investigation.
2. Literature Review
2.1. Integration of BIM and GIS
BIM was developed to model new projects with sufficiently detailed information, while GIS was designed to describe existing facilities in a larger geographic context [5,6]. BIM provides detailed project information and GIS contains geographical and spatial territory information about a project’s surrounding environment. Historically, GIS and BIM were developed in different fields for different purposes. Although BIM and GIS have certain overlapping functions, key differences still exist between the two techniques. The data integration of the two models is challenging. For example, geometric information about a project is an essential aspect of space planning. However, such information is not easily delivered to the GIS environment for geospatial analysis because of certain barriers including representation differences between BIM and GIS, poorly defined semantics in BIM, and a lack of tools capable of representing 3D geospatial information properly [10]. Many studies have been conducted to create a more efficient and effective way for integrating data from the two models. Three methods have been adopted: (1) transfer BIM data to GIS; (2) transfer GIS data to BIM; and (3) transfer both BIM and GIS data to a new platform. This platform can be a web-based platform or a software system.
Previous studies extracted BIM data to GIS. For example, in [11] the authors developed a semantic building model by transferring data from BIM to GIS. In [12], BIM data were extracted into a GIS system to support site selection and the process of fire response management through the development of software components. In [13], an extension of CityGML, called GeoBIM, was developed to incorporate semantic IFC data into a GIS system. Also, in [14], to integrate BIM and GIS, 3D building components were exported from Revit to the ESRI geodatabase format using the data interoperability extension in ArcGIS. Moreover, in [15], a data integration engine was developed to allow bidirectional conversion between BIM and GIS schemas. This developed integration engine enabled industry professionals to extract a BIM model into a GIS system for traffic noise simulation. In [16], a web-based GIS solution was developed to integrate BIM data into a GIS model. In [17], for indoor–to–outdoor route planning, a multi-purpose geometric network model (MGNM) was developed to incorporate IFC data into a GIS system. In [18], an ontology was developed to integrate BIM and GIS for assessing safe routes to school.
In the studies cited above, integration focused on extracting BIM data to a GIS system. However, certain studies integrated BIM and GIS by extracting GIS data into BIM. For example, in [19], an information delivery manual (IDM) was used to connect GIS data to a BIM system for analysis of the climate adaptation of buildings and their surroundings. In [20], a plug-in interface in BIM was developed to incorporate GIS data into a BIM model. Furthermore, certain studies focused on extracting both BIM and GIS data into a new platform. For example, in [21], both BIM and GIS data were exported to the Autodesk platform for better data storage and sharing. In [22], Autodesk Infraworks was used to incorporate ArcGIS shapefiles and Revit files for linking BIM and GIS models. In [23], a data model was developed as a profile of Geographic Markup Language (GML), which enabled consistent storage of BIM and GIS data.
2.2. Previous Studies of Water Distribution Systems (WDSs)
Over the years, a variety of studies about water distribution systems (WDSs) have been conducted, ranging from optimization of pipe layout to pipe construction and operation management. Mathematical techniques were used to optimize pipeline layout. For example, in [24], a method called ant colony optimization (ACO) was adopted to optimize pipe routing. ACO is a mathematical strategy that identifies the shortest path in water pipe networks. Certain studies focused on optimizing the design of a WDS by minimizing cost and maximizing its effectiveness using a genetic algorithm [25], agent swarm optimization [26], and a heuristic approach [27]. Moreover, certain studies were concerned with conflicts between pipe systems and existing structures during the construction stage [28,29].
Certain advanced information technology methods have been adopted for WDSs. For example, in [30], the authors suggested that GIS is a powerful tool for managing WDSs. GIS can be used to perform certain tasks such as layout and map plotting, demand forecasting, counter-meter installation, pipe connection, leakage and breakdown controls, planning maintenance operations, and asset assessment. In [31], a topology model of WDS in a GIS environment was developed for water leakage management. In [32], a GIS-based method that describes changes in the surrounding soil environment during pipeline construction was presented. In [33], a hydraulic model using a GIS tool was developed to acquire information about the water pipeline network. Additionally, certain studies considered GIS to be a powerful data management tool for WDS [34,35], while others used a GIS model as a decision support system for the renovation of WDS [36,37,38]. In [39], a GIS tool was utilized to rank several potential pipeline routes. In [4], the authors used an approach that integrated GIS and optimization technologies to provide an optimal pipeline layout for a water pipeline network. In [40], BIM and GIS were integrated to visualize underground pipelines connected to building utilities.
3. Proposed Method
In this section, the proposed method is illustrated in detail. This study used Revit and ESRI ArcMap to develop the proposed method. The proposed method mainly consists of three parts. First, the integration of BIM and GIS models using semantic mapping is illustrated. Second, the g process of developing a 3D visualization model of the proposed WDS project and its surroundings is explained. Finally, the topological rules that can be used to identify conflicts between the proposed WDS project and its surroundings are established. The process of the proposed method is shown in Figure 1.
3.1. Semantic Mapping
In this study, Industry Foundation Classes (IFC) was chosen as the data schema for BIM, whereas City Geography Markup Language (CityGML) was selected as the data schema for GIS since they are neutral file formats and widely accepted in the two domains [15]. They are both widely accepted semantic models [41].
3.1.1. IFC Schema
The IFC schema, first introduced by buildingSMART in 1994, has been widely used in the Architectural, Engineering and Construction (AEC) industry for information exchange. IFC is recognized as the most essential schema for BIM and is well supported by most BIM software products [42,43]. IFC includes a set of relationships among entire pipe networks, pipe segments, and pipe connections (nodes). The entire set of relationships is supported by IfcSystem. For example, a pipe network is a system and each element of the network is a section or part. The IFC spatial structure includes IfcFlowSegment, IfcFlowFitting, IfcFlowController, and IfcFlowStorageDevice. IfcFlowSegment defines pipe segments, IfcDistributionPort defines pipe connections (nodes, ports), IfcFlowController defines the device used to regulate water flow (e.g., valve) in a pipe network, and IfcFlowStorgeDevice defines an element that is used for temporary storage of water (e.g., tank) in a pipe network. Moreover, the connections between the pipe section and ports are defined by IfcRelConnectsPortToElement.
3.1.2. CityGML Schema
CityGML is an Open Geospatial Consortium official standard and is supported by many GIS platforms, such as ArcGIS [44]. To represent a basic structure for various types of pipe networks in ArcGIS, a core model is developed based on geometric networks [45]. This network can be constructed as lines, points, and other features. Each object in the real-world pipe network can be represented as one element in the network, while the same kind of elements can be defined by a class [46,47,48,49]. The basic structure of a pipe network consists only of pipe segments (edges) and connections (nodes). The network can include more feature classes in a pipe system and involve all relationships, attributes, and rules [45]. A logical network can automatically be developed and stored in ArcGIS when a geometric network is generated and edited. In order to prevent inappropriate connection of network elements to each other, certain topological rules are required to be specified.
3.1.3. Mapping IFC Data into CityGML System
According to the above descriptions of IFC and CityGML standards considering pipe networks, a substantial overlapping of information exists in both standards. The different classes in CityGML and the corresponding information in IFC are presented. The mapping that describes the classes in CityGML using IFC are illustrated in this section. Two classes of UtilityNetwork in CityGML can be used to represent a network: Network and _NetworkFeature [45]. The Network class is a core component in the UtilityNetwork model. It attempts to describe relationships of entire networks such as water distribution or gas supply systems. In general, Network class represents the networks, each network is a collection of _NetworkFeatures. The _NetworkFeatures can provide subclasses for division of network elements or objects according to their semantics. There are three attributes in the class of _NetworkFeatures: Unique ID, Description, and name.
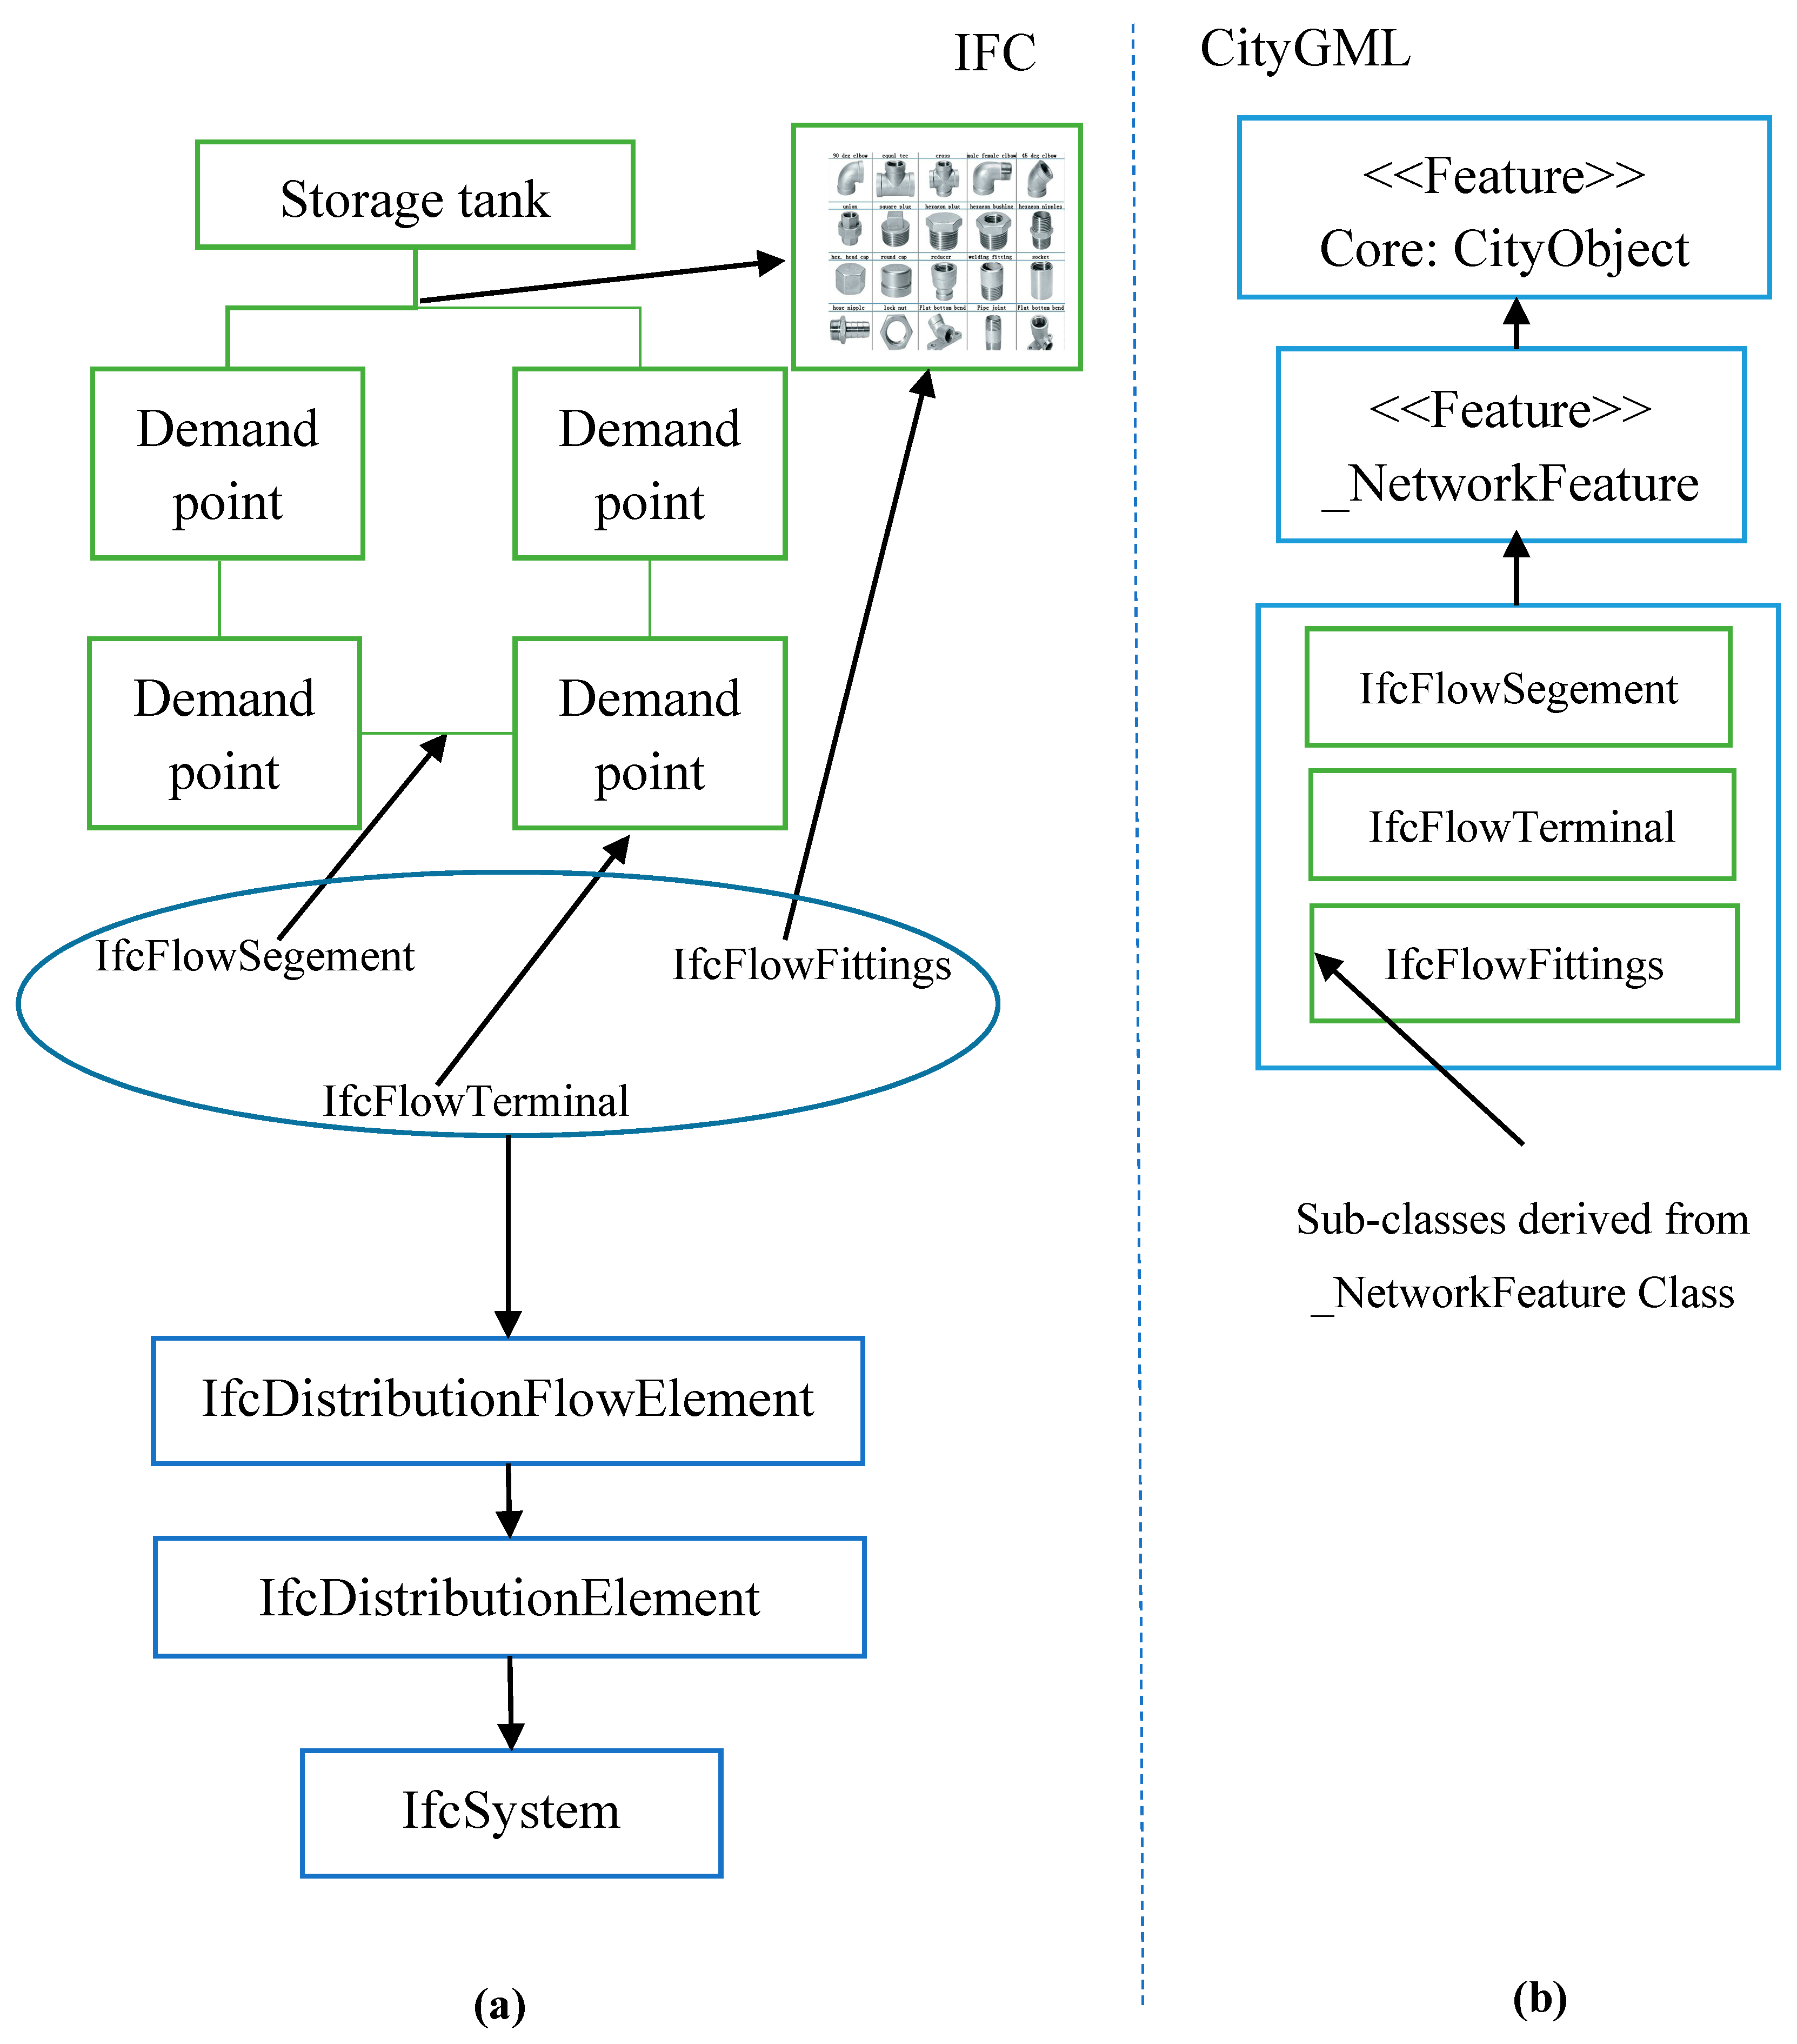
The IfcSystem entity in IFC that serves as a subgroup of the IfcGroup entity can be used to represent a functional network, including a collection of network objects. For example, a system can be a water distribution network consisting of pipes, connections, a tank, and other related objects. Moreover, the attributes of a network can also be represented in the IFC entity. The Unique ID can be obtained from IfcGloballyUniqueID, name can be acquired from IfcLable, and Description can be obtained from IfcText. The class _NetworkFeature can be produced by the use of the entity IfcDistributionElement in IFC, as shown in Figure 2. All components of a pipe network can be represented by subtypes of IfcDistributionElement. These subtypes, which include IfcFlowSegment, IfcFlowFitting, IfcFlowController, and IfcFlowStorageDevice, can be used to describe the logical and semantic structure of the model.
There are two types of connectivity in a pipe system: physical connectivity and logical connectivity with ports. Physical connectivity usually represents things that are physically or directly connected. The concept of logical connectivity is usually associated with things that are logically connected. The two types of connectivity can be described using the same entities in IFC. IFC describes the topological relationships in pipe networks by using the concept of connectivity. Moreover, using physical and logical relationships defined by IfcRelConnectsPortToElement and IfcRel-ConnectsPorts, a pipe network can be defined and transformed to the edge class in GIS. The topological relationships of utility networks in CityGML can be described by using NetworkGraph. Each network object can be indicated using graphic representation. The graph representation can include one node or a combination where a group of edges and nodes describe a network. Other objects such as the pump, tank, and reservoir in the network can be represented in the _NetworkFeature class. A pipe with two and three nodes was described in a graph, as shown in Figure 3. A graph representation of connectivity of network elements facilitates topological analysis. The proposed method can provide 3D visualization of the pipe networks and generate a graph structure for topological analysis, as shown in Figure 4.
3.2. 3D Visualization Model
The 3D model mainly included the surface model, modeling of existing buildings, and modeling of pipe systems. All the information was incorporated into different layers and integrated into GIS to develop the 3D model, as shown in Figure 5. The steps for developing a 3D visualization model are displayed in Figure 6. The software products used include ArcGIS, AutoCAD, Revit, and SketchUp.
3.2.1. Surface Model
The site topography can be represented vividly in a 3D surface model. The surface model provides different heights for valleys and ridges. A triangulated irregular network (TIN) surface model can be developed in GIS; a TIN surface model can more accurately represent topography than raster. TIN is a vector-based surface model. The steps for developing the surface model can be described as follows: First, a topographic survey was conducted on the investigated site to obtain the coordinates including locations (x, y) and elevations (z) of the control points by using a Total Station. The data from the Total Station were imported into AutoCAD. Second, the data were exported from AutoCAD to ArcGIS to form a geodatabase including the locations and elevations of these points. The data in geodatabase were stored in Shapefile. Third, the elevation values were assigned to corresponding points. Fourth, the TIN surface model was generated based on the control points and their coordinates. Finally, by using appropriate ground control points, the TIN surface model was covered by an aerial photograph of the site to generate a virtual 3D surface model.
3.2.2. Modeling of Existing Buildings
To develop a 3D model of the existing buildings, several steps should be followed. First, based on the previously developed surface model, the location and footprints of the existing buildings could be identified. Each type of building (residential, commercial, institutional) was stored in a separate Shapefile in ArcGIS. Second, the elevation values at footprints obtained from the surface model were assigned to the footprints. Third, the 2D model of footprints was exported from ArcGIS to SketchUp to generate a 3D model. Finally, the 3D model of the footprints was generated and transferred back to ArcGIS. A GIS plug-in was used to facilitate the transfer.
3.2.3. Modeling of Pipe Network Systems
The modeling of the pipe network systems includes existing pipe network systems as well as the proposed water distribution system. The modeling of the pipe network systems includes several steps. First, the CAD drawings of the pipe systems were imported to Revit to generate a 3D model of the systems. The existing pipe network systems were modeled with a minimum level of detail to represent geometry. Second, the information about the pipe systems was stored in the IFC schema. Third, based on the previously illustrated integration process of IFC and CityGML, 3D models of the pipe systems were incorporated into ArcGIS by using the GIS extension of UtilityNetwork. Each type of pipe network (e.g., electric, gas, water, sewer, rainwater drainage) was stored in a separate layer in GIS.
3.3. Topological Validation Process
To examine the spatial conflicts between the proposed WDS project and existing structures, a topological tool was used. Topological analysis is essential for solving spatial problems without complex calculations. Moreover, the established topological rules can help in examining the consistency of the pipe network to avoid redundancy of geometric objects. For example, two points with different identification can be located at the same place without considering topology. In addition, a WDS project requires working space for equipment, materials, and labor, at the construction stage. Hence, the width of the pipeline routes was added to indicate the workspace on the construction site.
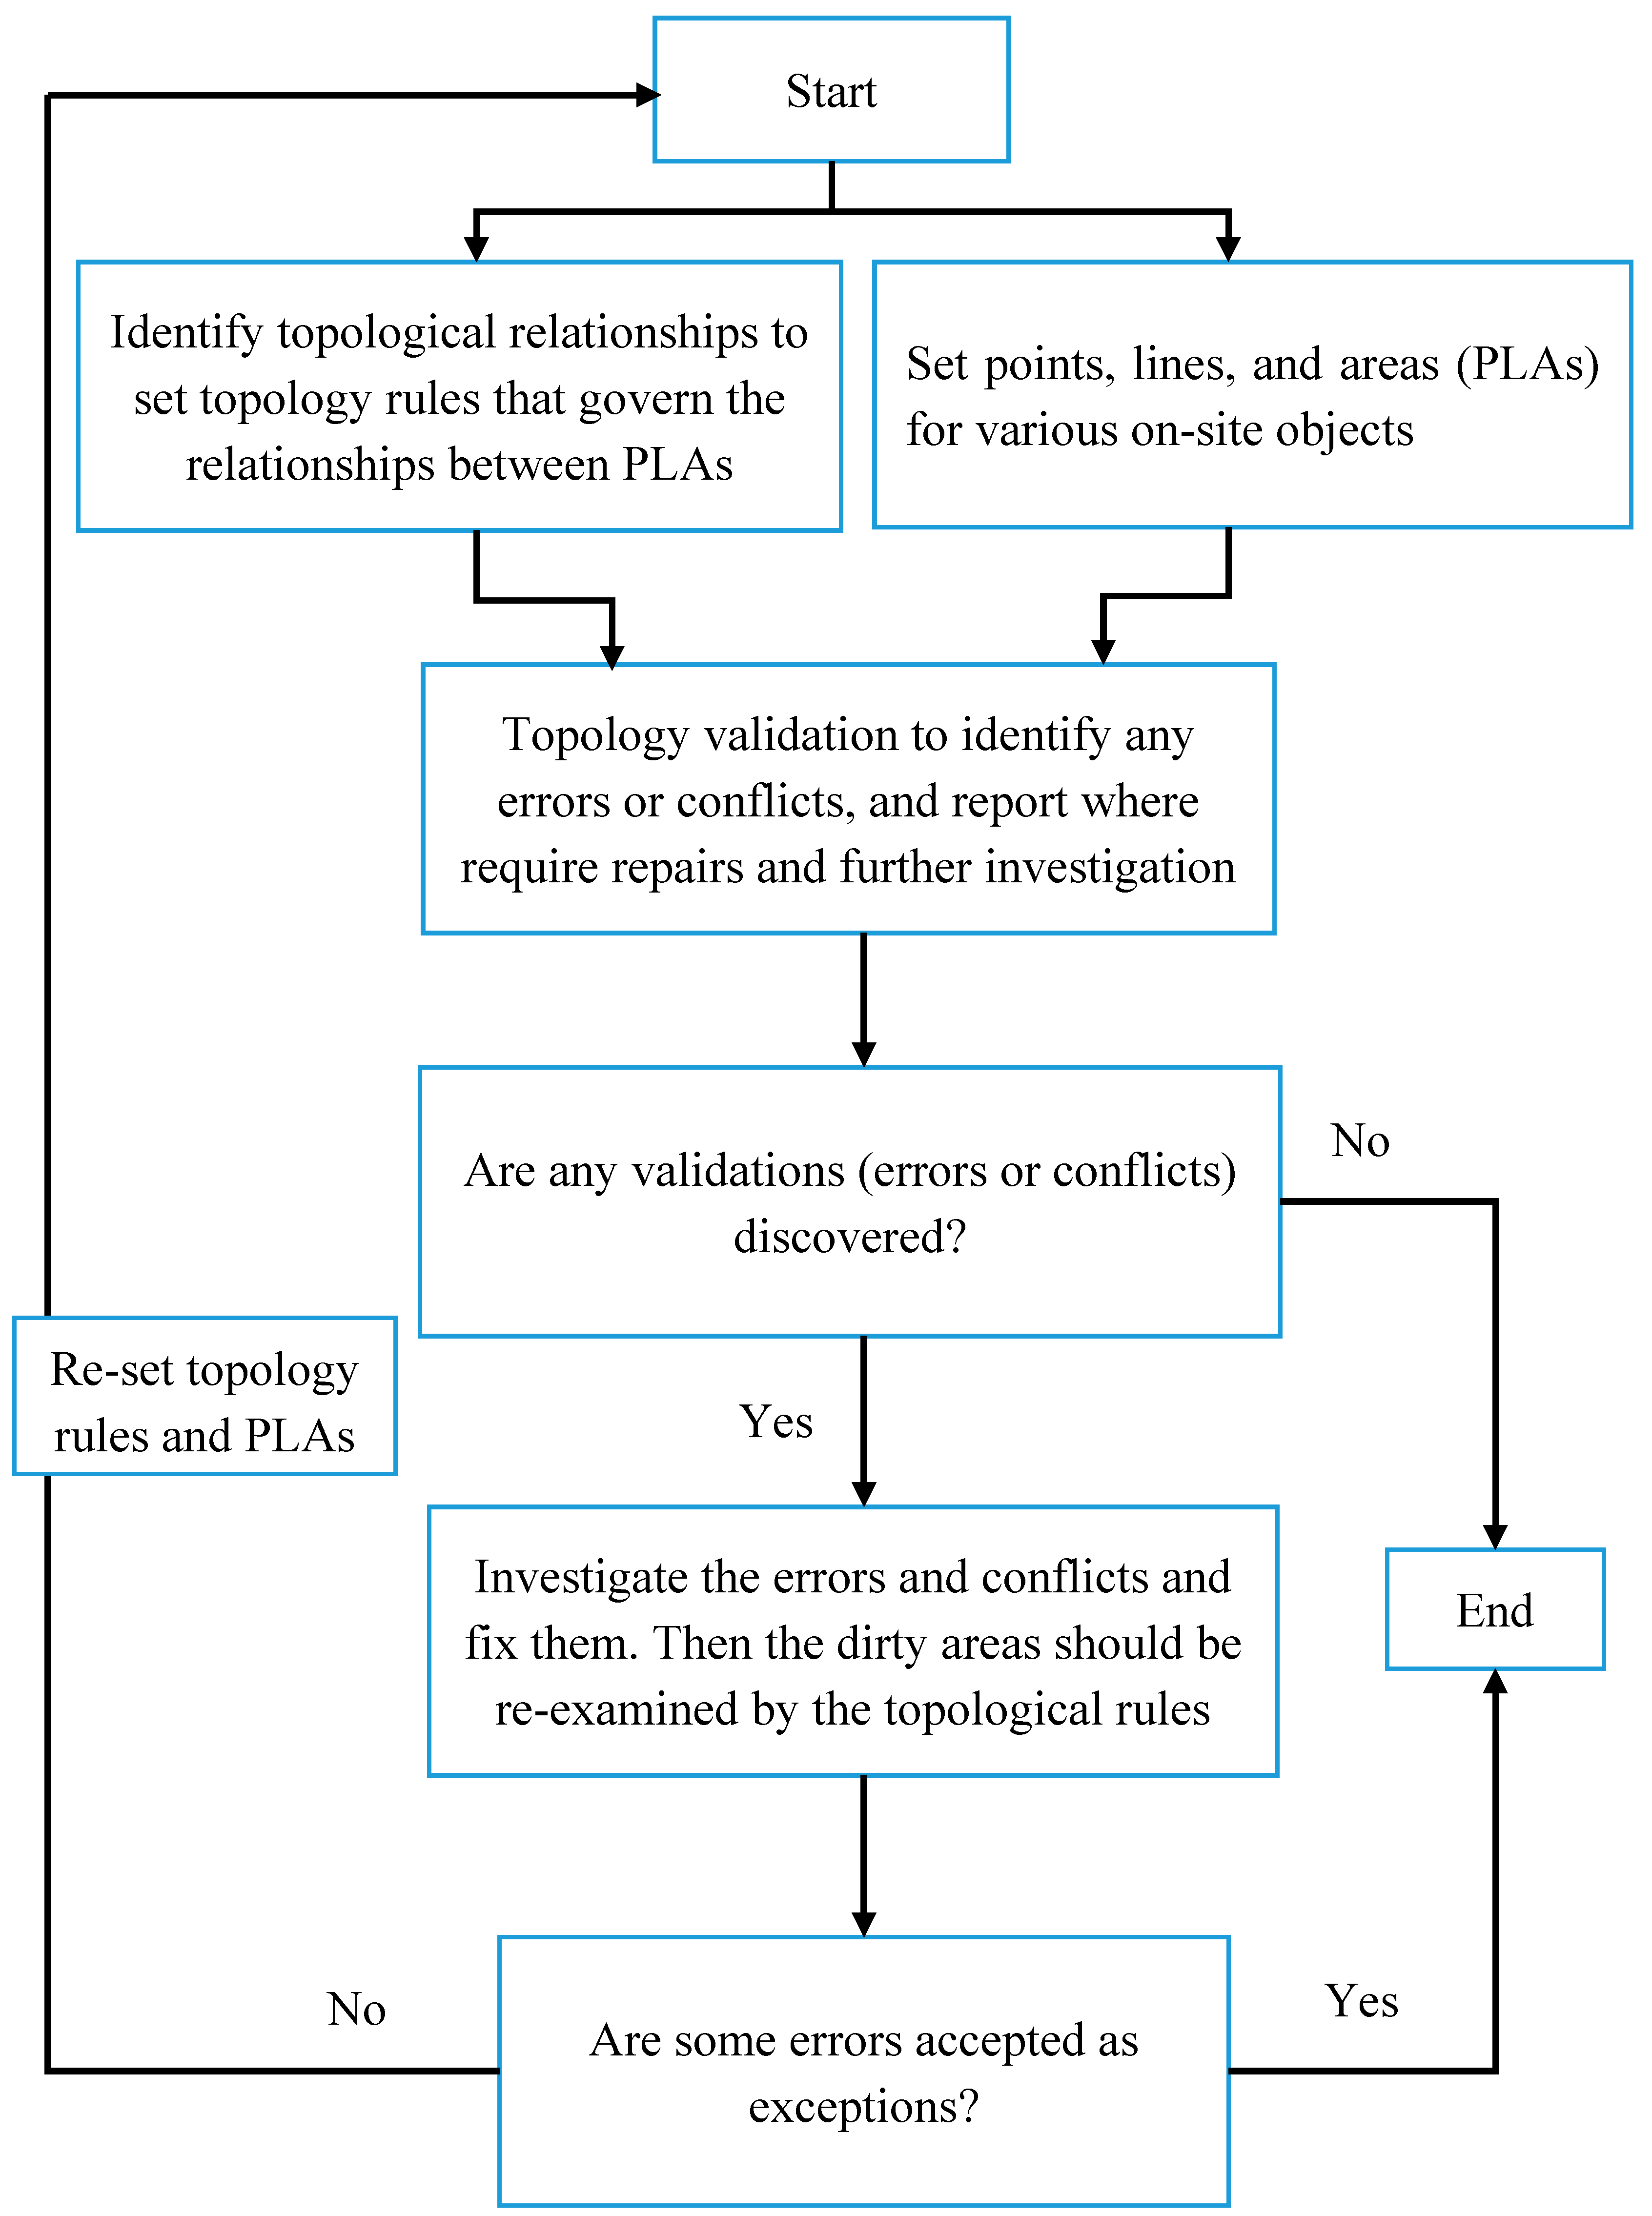
A WDS can be modeled as a simplified system with edges and demand nodes. A WDS can be defined as an undirected graph Z(N, E) having a set of N nodes and a set of E edges [50]. In the graph structure, pipes, control valves, and pumps are denoted as edges in accordance with the general terms used for WDS, while demand points, revisors, and tanks are denoted as nodes [51]. In such a graph, nodes and edges can represent a pipe network. Points, lines, and areas (PLAs) corresponding to various site objects are developed and stored in different layers of the GIS. Then, the nodes can be represented by points and the edges can be represented by lines. The buildings and grassland can be represented by areas. The topology tool in GIS has a set of validation rules for PLAs [9]. Engineers identify and establish topological rules that govern spatial relationships between PLAs. The topological rules are set so as to guarantee the spatial relationships of objects on the construction site. The topology tools in GIS can validate spatial relationships between PLAs, based on the established topological rules. The procedure for the validation process is displayed in Figure 7. The defined PLAs are saved in different layers in GIS and the topological analysis can identify the errors that violate the topological rules, as shown in Figure 8.
4. Implementation
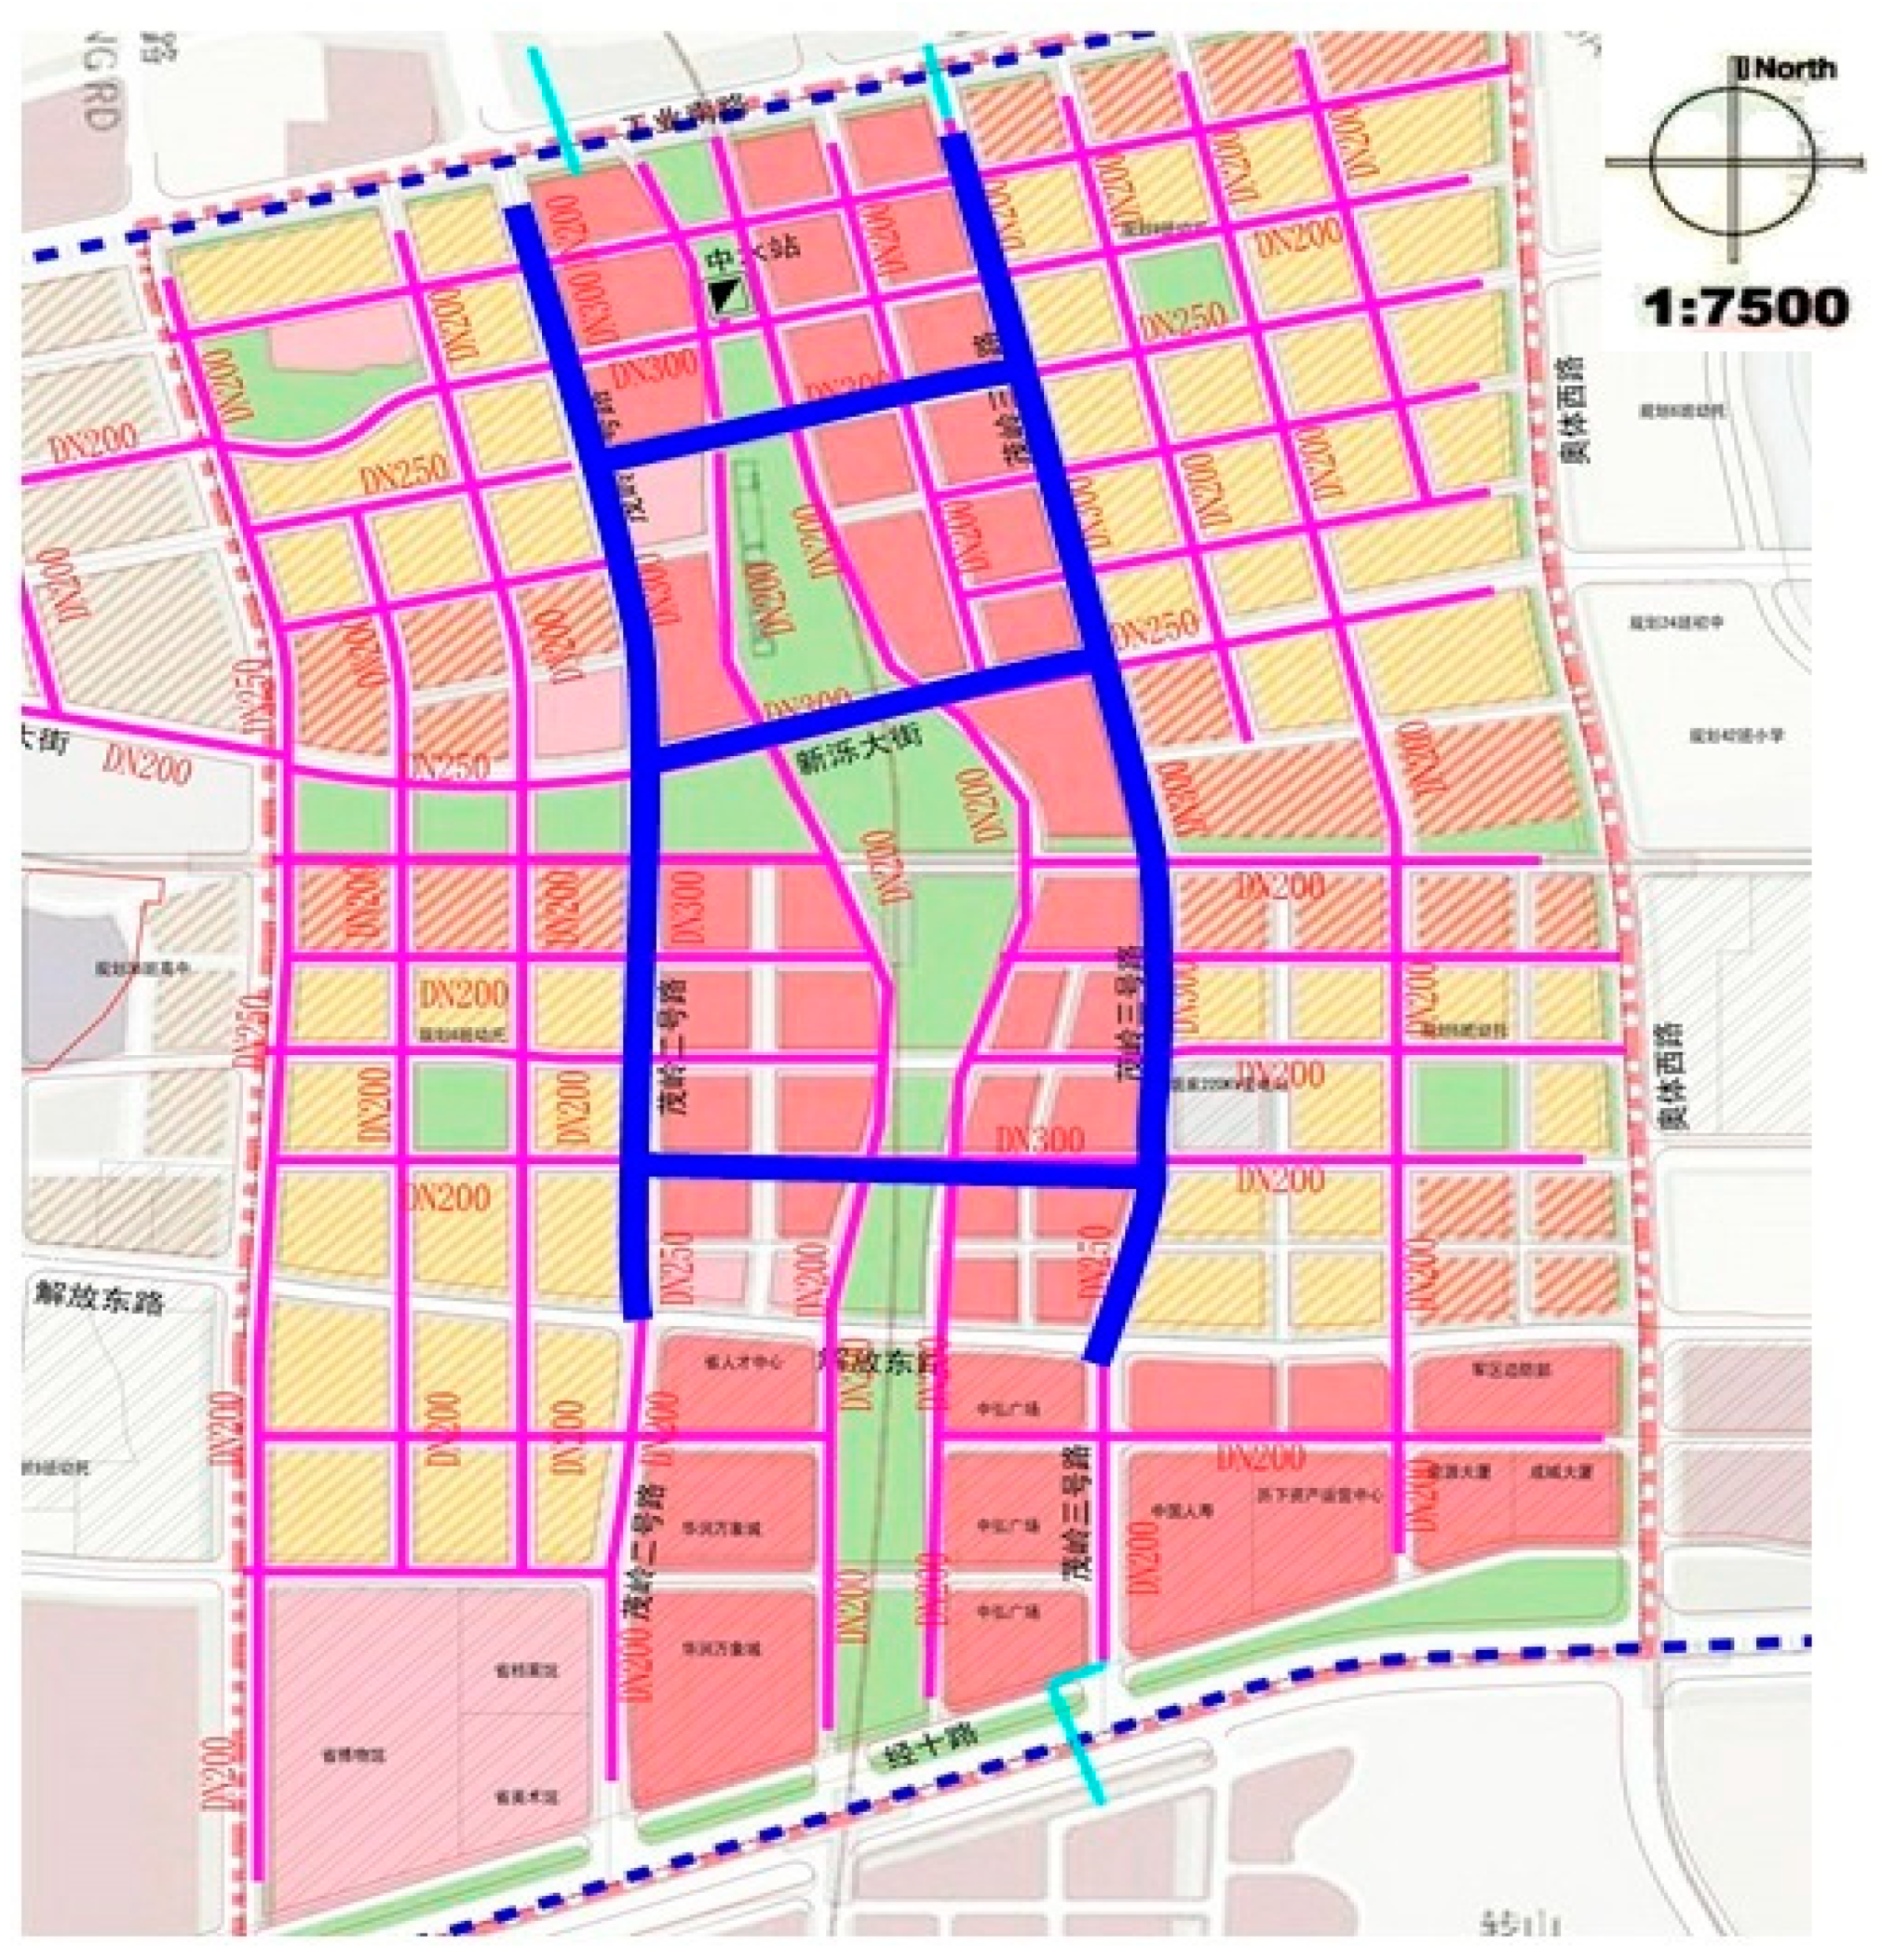
This study provides an integrated BIM and GIS method, and a case example was used to validate the feasibility of the proposed method. The pipe network in this study was a water distribution system (WDS) for a commercial and residential complex community in City Jinan, Shandong province, China. The network is supplied by a water tank and the total pipe length is 4.6 km. The layout planning of the WDS project is shown in Figure 9.
4.1. The Integration of BIM and GIS
Although certain steps require manual tuning during the integration of BIM and GIS, the overall integration can be made automatically. Pipe layouts can be used in a realistic design. The proposed method includes harmonizing the semantic data models IFC and CityGML, to enable formal mapping between BIM and GIS. This study demonstrated that UtilityNetwork in CityGML can provide classes which can be easily extended to model BIM data. BIM data regarding pipeline networks in IFC schema can be mapped to UtilityNetwork in GIS without loss of data. Network class in GIS can offer a similar concept to IfcSystem in IFC. Certain concepts in IfcDistributionFlowElement can also be represented in GIS through the specialized classes derived from _NetworkFeature in GIS. The graph structure in UtilityNetwork can be represented by the use of IFC entities. The connectivity, either physical or logical, can be transformed to UtilityNetwork in GIS. Physical links can be considered as interior nodes or exterior nodes with ports (e.g., water tank). Logical links can be represented by using sub-class Edge in UtilityNetwork. During integration, connectivity should be classified and considered to avoid any problems. Therefore, the BIM data can be incorporated into the GIS model for further analysis and modeling.
4.2. 3D Visualization Model
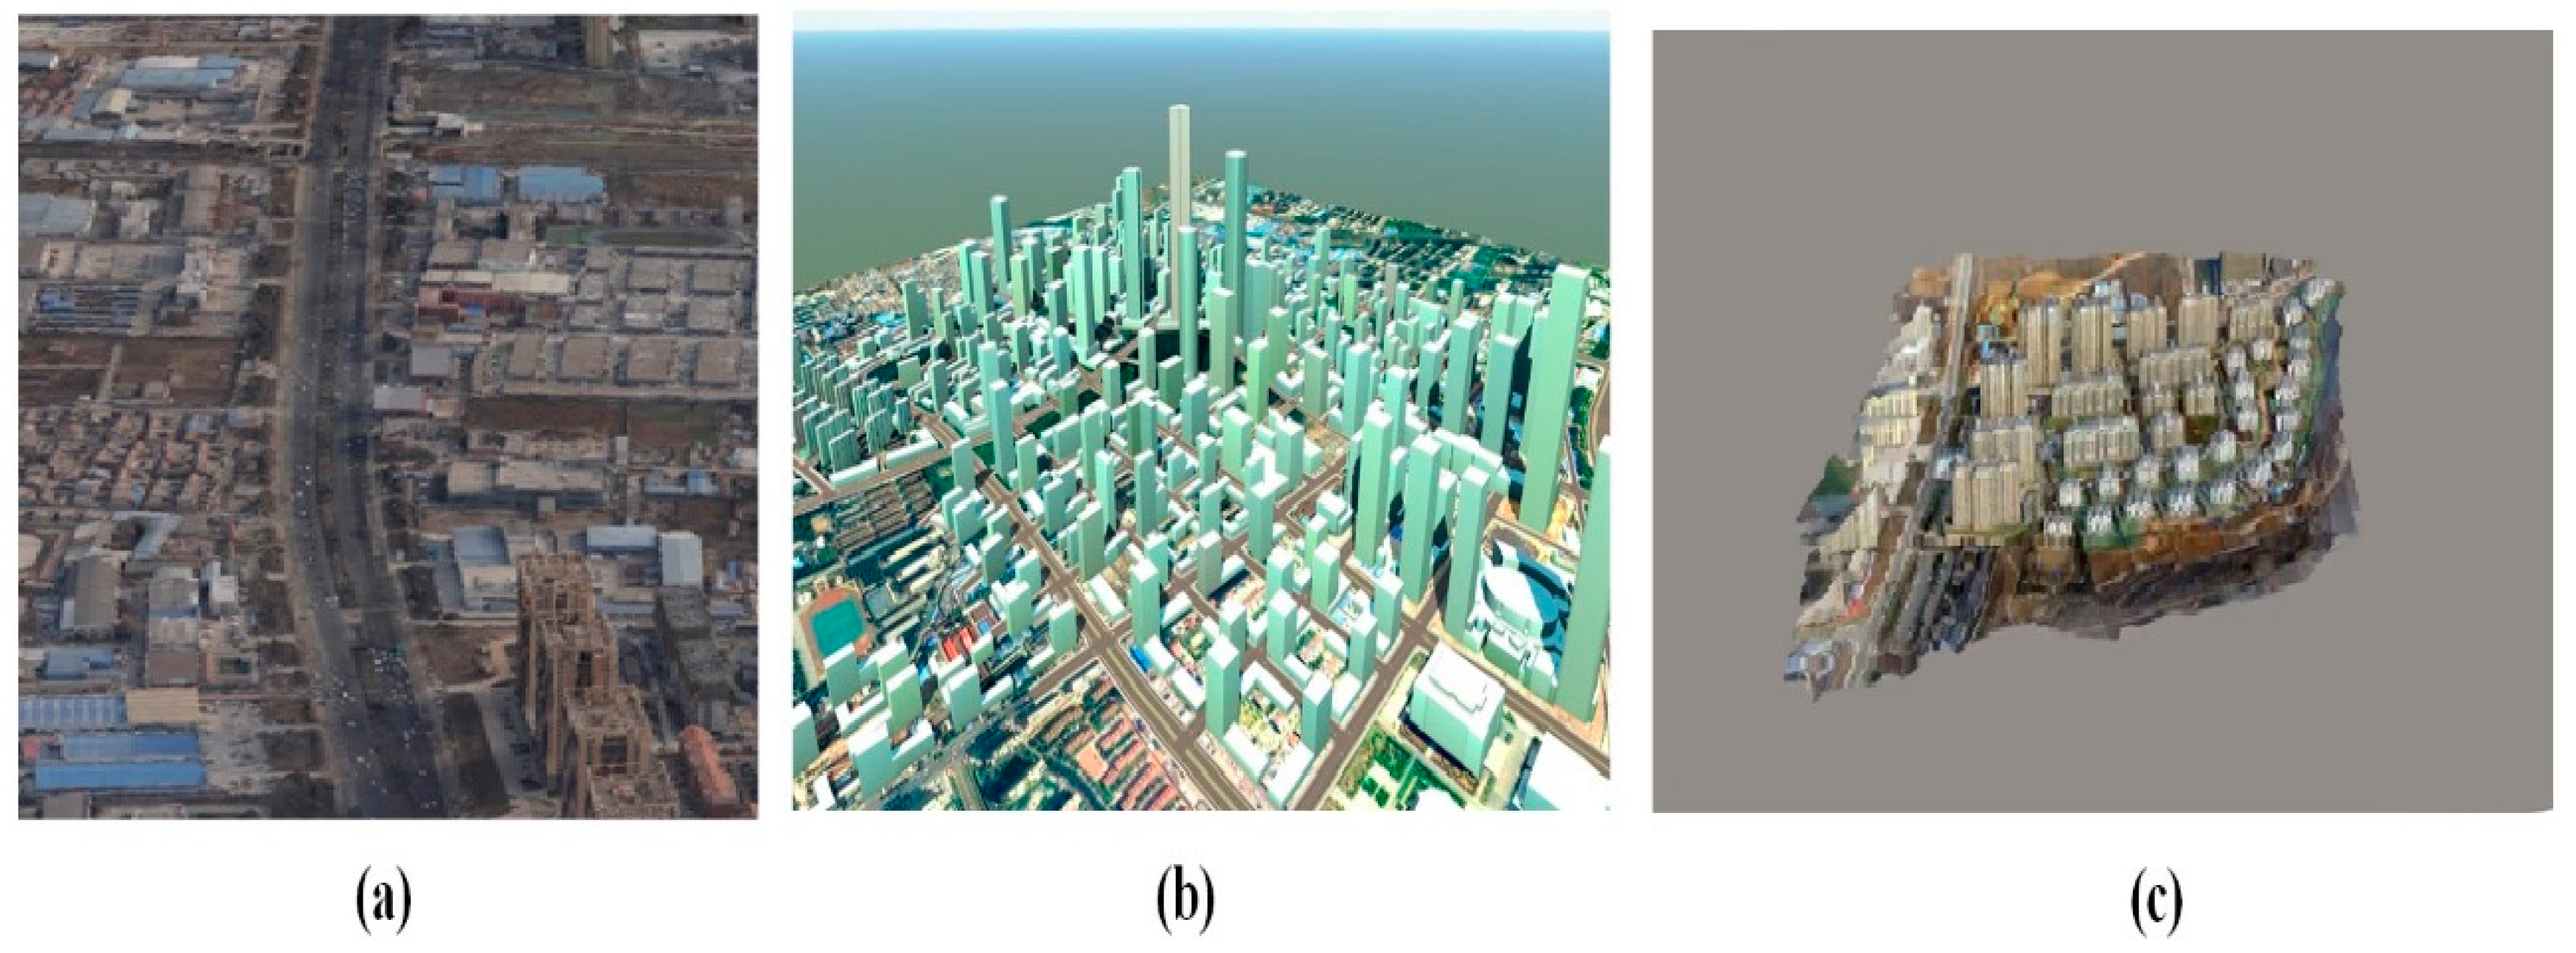
The proposed method can be used to develop a 3D model of the WDS project and its surroundings. The information about the WDS project and its surroundings was incorporated into GIS to develop a 3D model. First, the proposed WDS project was planned and designed in BIM to develop a 3D model. In addition, information about the existing pipe systems was also transferred from AutoCAD to BIM. Second, the surrounding information, including site location and size, and existing buildings, was inputted into GIS for further analysis. The surface model was developed in GIS, as displayed in Figure 10. SketchUp was used to develop a 3D model of existing buildings, as shown in Figure 11. Third, the information about the proposed WDS project and existing pipe systems were transferred from BIM to GIS. The 3D model of the pipe systems is shown in Figure 12. Then, the models were integrated to form the 3D model, as shown in Figure 13. Based on this case study, the development of the 3D model takes time and effort; however, the impact of topography highs and lows can be identified. The identified topography highs and lows are quite helpful for locating a new water tank, as locating the water tank at a higher point facilitates water flow to demand points. Moreover, the developed model can be used at the construction stage in earthworks planning for the proposed WDS.
4.3. Establishment of Topological Rules and Topological Analysis for the Proposed WDS Project
Topological rules were set to validate the spatial relationships of objects on site. For topological analysis, the information was stored as points, lines, and areas (PLAs) in different layers. The detailed steps of the topological analysis process are listed below:
- Set PLAs and topological rules.PLAs must be produced to examine spatial relationships. Moreover, the topological constraints and rules should specify the spatial relationships between the PLAs. All the PLAs must be organized in the same coordinates.
- Decide cluster tolerance.The topology tool can assign a default cluster tolerance that is a minimum possible value based on the precision requirement of a dataset. The cluster tolerance value should be at least an order of magnitude smaller than the precision of a feature dataset so that close vertices are snapped together.
- Assign topological rules.Topological rules are set to govern the spatial relationships among PLAs [27]. PLAs in the studied area are topologically related. Points and lines are constrained, fall inside, are on the edge, or do not cross the edge of a given area. All participating PLAs in the defined area are to be examined. For example, when the “must not overlap” rule is applied to the defined and adjacent areas, the topology tool would examine the overlap between them. All the topological rules used in this study are displayed in Table 1 and the topological rules used in GIS are shown in Figure 14.
- Topology validation.During the validation process, the topological rules are checked against the PLAs to identify any violations so that the PLAs adhere to the defined rules.
- Error identification.After the validation process, the places where topological rules are violated are identified and marked as dirty areas (red circle areas), which are stored in the topology tool [27]. The topology tool reports the errors so that the user is aware of the violations. In this way, the topology tool helps users to oversee the spatial relationships between the PLAs and the suitability of the pipe network planning.
- Topology editing and revalidationSeveral topology editing tools are provided in ArcGIS to fix the identified topological errors. After editing, the changes are saved in topology and topological rules are required to be revalidated. ArcGIS can automatically identify error locations (these locations violate the topological rules) and only the error locations are revalidated. If the topological rules are changed, the PLAs need to be revalidated.
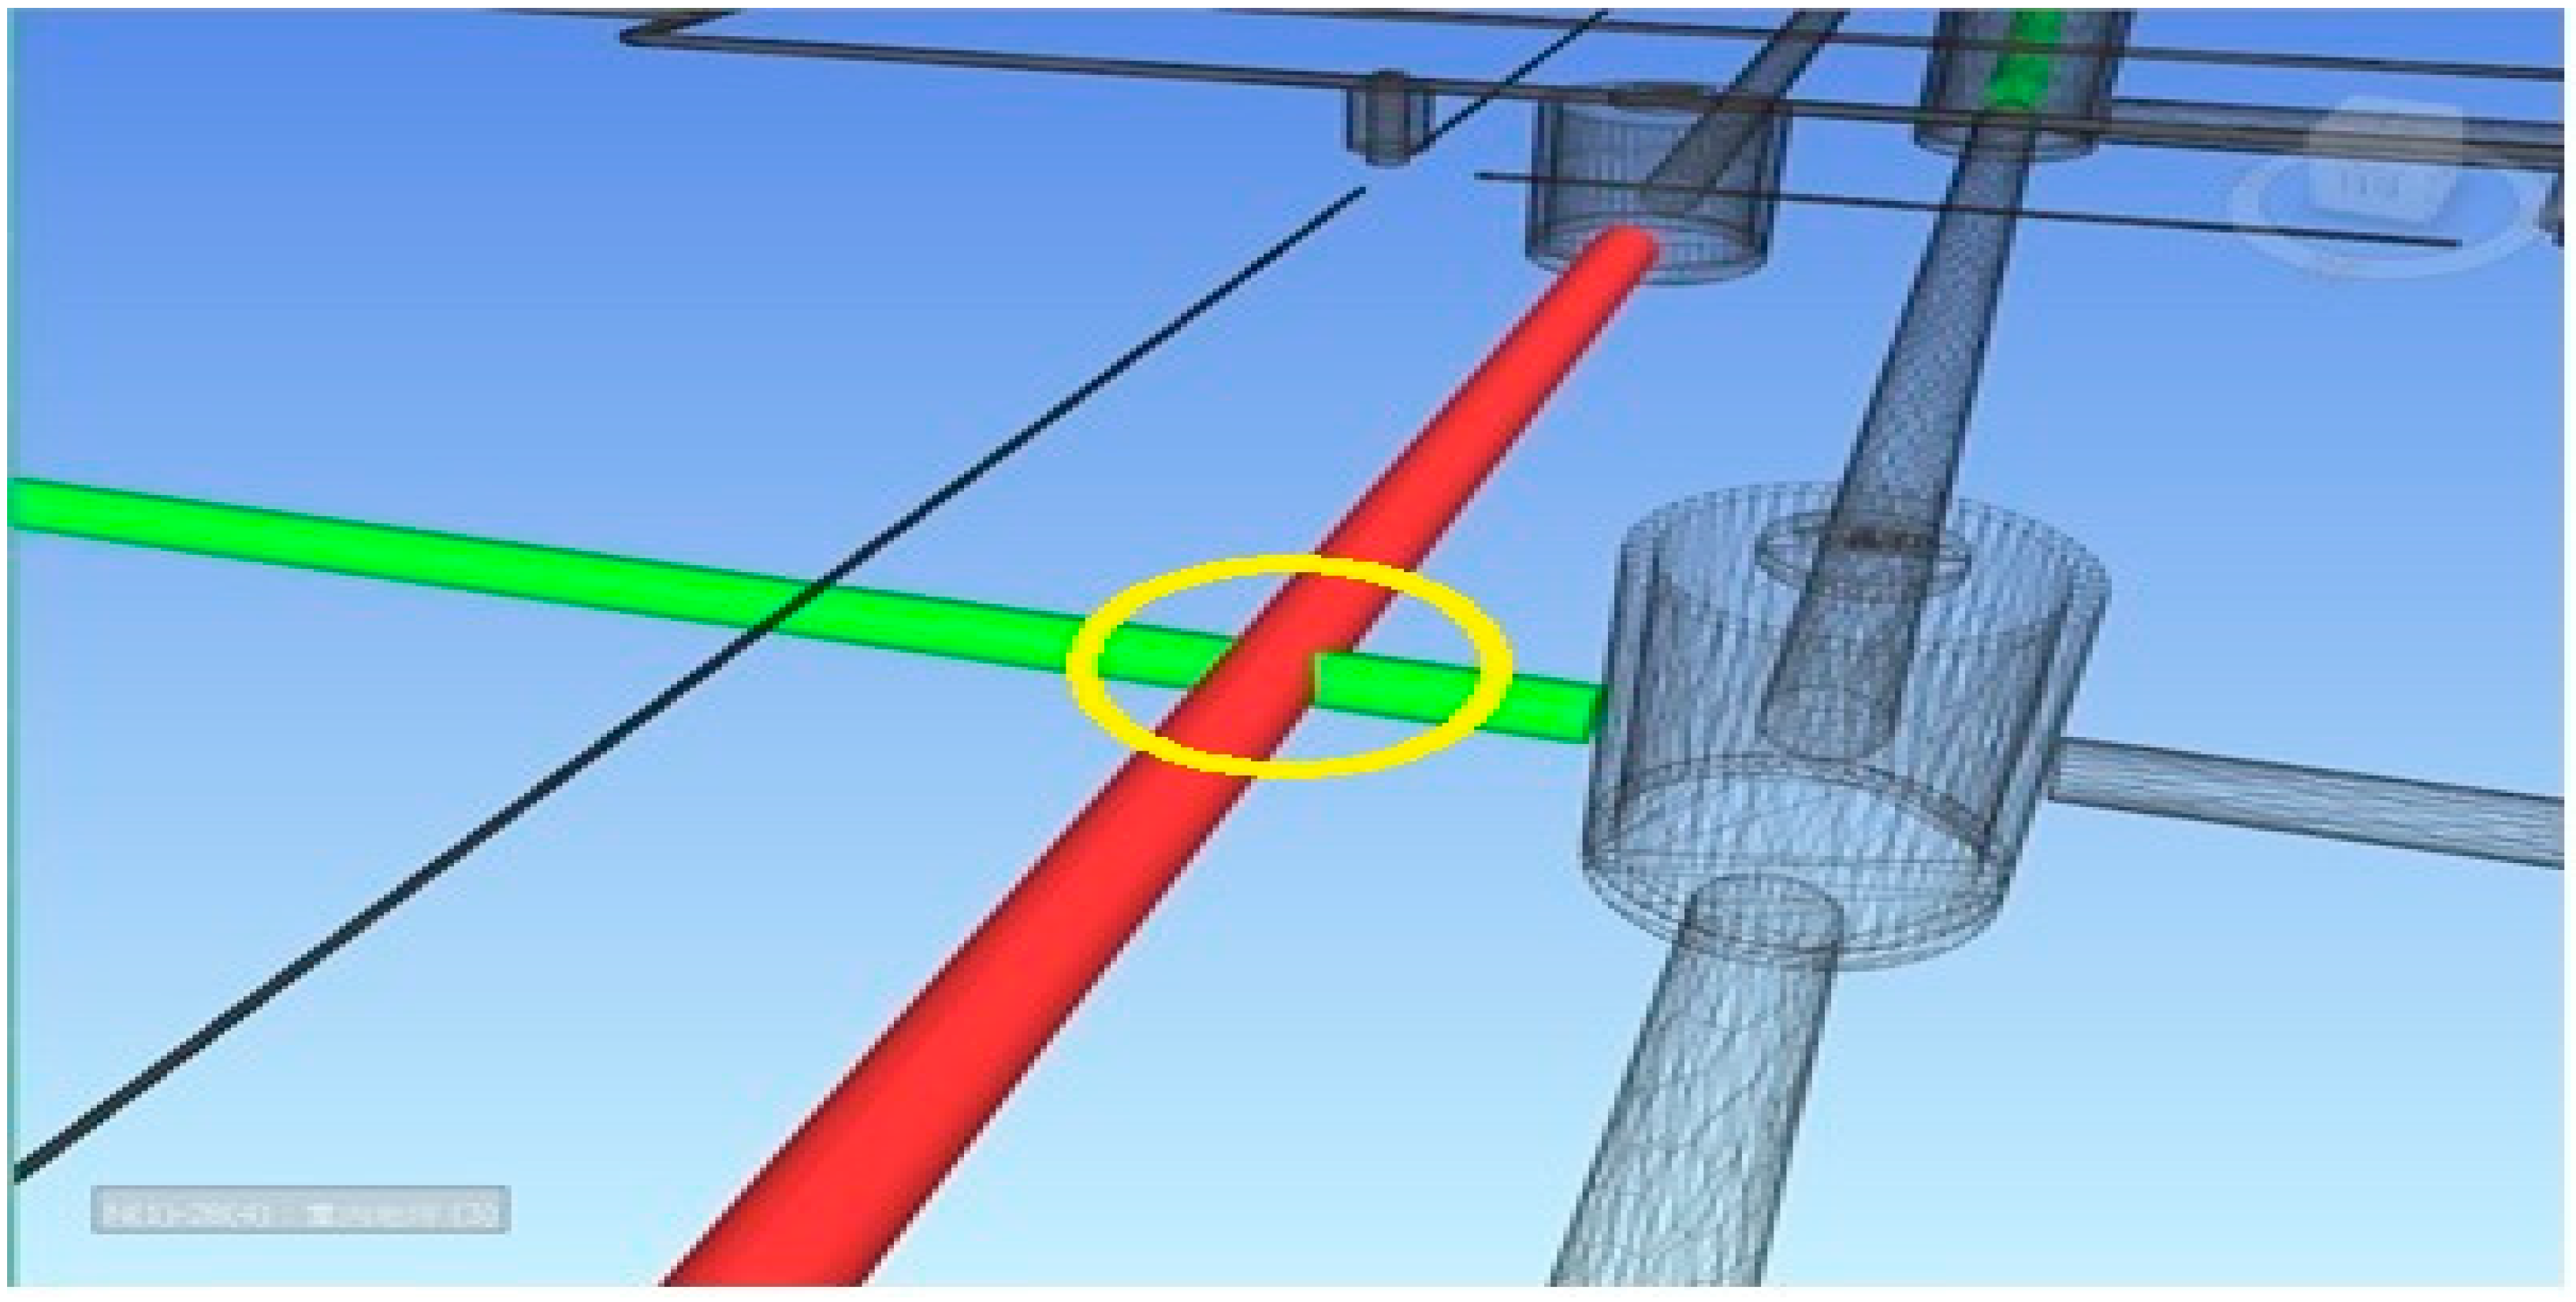
If any space conflicts between the proposed WDS project and the existing pipe networks are identified, the errors will be corrected in order to fit the topological rules. The errors should be examined carefully and corrected until no space conflicts exist. Topological analysis significantly helps in the identification of any conflicts prior to construction, thus saving time and reducing costs. Topological analysis identified space conflicts between the proposed WDS and an existing rainwater drainage pipeline, as shown in Figure 15. The features of each object involved in a conflict should be studied in detail. This can help industry professionals to decide which parts require adjustment. Adjustments include changes in the existing structures or changes in the proposed WDS project. The project team decided to remove the drainage system and build a new one, considering where the existing rainwater drainage system was situated. Hence, the conflict problem was solved.
5. Conclusions
This study proposed an integrated BIM and GIS method for WDS planning, which was verified in an actual WDS project. Semantic mapping was used to integrate BIM and GIS without data loss. The integrated method combines the advantages of both BIM and GIS technologies to facilitate WDS planning; i.e., BIM provides a comprehensive parametric of the pipelines, while GIS provides a 3D visualization model that can be used for analysis. Moreover, topological rules in GIS were applied to obtain an appropriate pipe network layout. The proposed method effectively identified the conflicts between the WDS project and existing structures. The conflicts were identified prior to construction, to avoid any errors during the construction process. The results can also help in the decision-making process by considering the on-site physical constraints and the presence of unrealistic pipe network layouts.
The contributions of the current study are listed below.
- (1)
- Semantic mapping was used to develop an integrated BIM and GIS model for facilitating the WDS planning process.
- (2)
- The proposed method developed a virtual 3D model of the WDS project and its surroundings using the merits of both BIM and GIS. The virtual 3D model has distinct advantages over 2D drawings.
- (3)
- The proposed method was successfully applied to an actual WDS project. It helped to develop reliable WDS planning without conflicts. In addition, the developed model informs industry professionals where adjustments are required to solve the scarcity of space on site.
- (4)
- The techniques explored in this study also support urban development-related projects where project information models do not exist. The information in this study can enrich 3D city models, extending their usability and functionality.
The proposed method provided a good understanding of the WDS project and its surroundings and generated a successful WDS plan. Future studies will extend the generated model to the construction and operation and maintenance stages. Moreover, future studies will focus on extending the usability and functionality of the GIS tool to the AEC industry.
Author Contributions
Conceptualization, Linlin Zhao and Zhansheng Liu; Methodology, Linlin Zhao; Software, Zhansheng Liu; Validation, Jasper Mbachu; Resources, Jasper Mbachu; Writing—original draft preparation, Linlin Zhao; Writing—review and editing, Linlin Zhao and Jasper Mbachu; Visualization, Zhansheng Liu.
Funding
This research was funded by the National Key Research and Development Program of China, grant number 2018YFF0300300, and Beijing University of Technology, grant number 2018JG08704. The APC was funded by both the grants.
Acknowledgments
The authors would like to thank the Beijing University of Technology for its support throughout the research project. The authors would like to thank China Communications Construction, China Railway Group Limited, China State Construction Engineering Corporation, and China Association of Technology Entrepreneurs for providing data to conduct this research. In addition, we would like to thank all the practitioners who contributed to this project.
Conflicts of Interest
The authors declare no conflicts of interest.
References
- Sun, Z.; Wang, P.; Vuran, M.C.; Al-Rodhaan, M.A.; Al-Dhelaan, A.M.; Akyildiz, I.F. MISE-PIPE: Magnetic induction-based wireless sensor networks for underground pipeline monitoring. Ad Hoc Netw. 2011, 9, 218–227. [Google Scholar] [CrossRef]
- Mancuso, A.; Compare, M.; Salo, A.; Zio, E.; Laakso, T. Risk-based optimization of pipe inspections in large underground networks with imprecise information. Reliab. Eng. Syst. Saf. 2016, 152, 228–238. [Google Scholar] [CrossRef]
- Laucelli, D.; Giustolisi, O. Vulnerability assessment of water distribution networks under seismic actions. J. Water Resour. Plan. Manag. 2015, 141, 1–14. [Google Scholar] [CrossRef]
- Ayad, A.; Awad, H.; Yassin, A. Integrated approach for the optimal design of pipeline networks. Alex. Eng. J. 2018, 57, 87–96. [Google Scholar] [CrossRef]
- Peckienė, A.; Ustinovičius, L. Possibilities for Building Spatial Planning Using BIM Methodology. Procedia Eng. 2017, 172, 851–858. [Google Scholar] [CrossRef]
- Uggla, G.; Horemuz, M. Geographic capabilities and limitations of Industry Foundation Classes. Autom. Constr. 2018, 96, 554–566. [Google Scholar] [CrossRef]
- Kang, T.W.; Hong, C.H. IFC-CityGML LOD mapping automation using multiprocessing-based screen-buffer scanning including mapping rule. KSCE J. Civ. Eng. 2018, 22, 373–383. [Google Scholar] [CrossRef]
- Schevers, H.; Mitchell, J.; Akhurst, P.; Marchant, D.; Bull, S.; McDonald, K.; Drogemuller, R.; Linning, C. Towards digital facility modelling for sydney opera house using IFC and semantic web technology. J. Inf. Technol. Constr. 2007, 12, 347–362. [Google Scholar]
- Bansal, V.K. Use of GIS and topology in the identification and resolution of space conflicts. J. Comput. Civ. Eng. 2011, 25, 159–171. [Google Scholar] [CrossRef]
- Borrmann, A.; Schraufstetter, S.; Rank, E. Implementing metric operators of a spatial query language for 3D building models: Octree and B-rep approaches. J. Comput. Civ. Eng. 2009, 23, 34–46. [Google Scholar] [CrossRef]
- Benner, J.; Geiger, A.; Leinemann, K. Flexible generation of semantic 3D building models. In Proceedings of the 1st International Workshop on Next Generation 3D City Models, Bonn, Germany, 21 June 2005; pp. 17–22. [Google Scholar]
- Isikdag, U.; Underwood, J.; Aouad, G. An investigation into the applicability of building information models in geospatial environment in support of site selection and fire response management processes. Adv. Eng. Inform. 2008, 22, 504–519. [Google Scholar] [CrossRef]
- Van Berlo, L.; Laat, R. Integration of BIM and GIS: The development of the CityGML GeoBIM extension. In Proceedings of the 5th International 3D GeoInfo Conference, Berlin, Germany, 3–4 November 2010. [Google Scholar]
- Tashakkori, H.; Rajabifard, A.; Kalantar, M. A new 3D indoor outdoor GIS model for indoor emergency response facilitation. Build. Environ. 2015, 89, 170–182. [Google Scholar] [CrossRef]
- Deng, Y.; Cheng, J.C.P.; Anumba, C. A framework for 3D traffic noise mapping using data from BIM and GIS integration. Struct. Infrastruct. Eng. 2016, 12, 1267–1280. [Google Scholar] [CrossRef]
- Hijazi, I.; Ehlers, M.; Zlatanova, S. BIM for Geo-analysis (BIM4GEOA): Set up of 3D information system with open source sofrware and open specification. In Proceedings of the 5th International 3D GeoInfo Conference, Berlin, Germany, 3–4 November 2010. [Google Scholar]
- Teo, T.A.; Cho, K.H. BIM-oriented indoor network model for indoor and outdoor combined route planning. Adv. Eng. Inform. 2016, 30, 268–282. [Google Scholar] [CrossRef]
- Kim, J.I.; Koo, B.; Suh, S.; Suh, W. Integration of BIM and GIS for formal representation of walkability for safe routes to school programs. KSCE J. Civ. Eng. 2016, 20, 1669–1675. [Google Scholar] [CrossRef]
- Hjelseth, E.; Thiis, T.K. Use of BIM and GIS to enable climatic adaptations of buildings. In eWork and eBusiness in Architecture, Engineering and Construction: ECPPM; CRC Press: London, UK, 2008. [Google Scholar]
- Irizarry, J.; Karan, E.P.; Jalaei, F. Integrating BIM and GIS to improve the visual monitoring of construction supply chain management. Autom. Constr. 2013, 31, 241–254. [Google Scholar] [CrossRef]
- Sergi, D.M.; Li, J. Applications of GIS-Enhanced Networks of Engineering Information. Appl. Mech. Mater. 2014, 444–445, 1672–1679. [Google Scholar] [CrossRef]
- Giudice, M.D.; Osello, A.; Patti, E. BIM and GIS for district modeling. In Proceedings of the European Conference on Product & Process Modelling, Vienna, Austria, 17–19 September 2014. [Google Scholar]
- Amirebrahimi, S.; Rajabifard, A.; Mendis, P.; Ngo, T. A framework for a micro-scale flood damage assessment and visualization for a building using BIM-GIS integration. Int. J. Digit. Earth 2015, 9, 363–386. [Google Scholar] [CrossRef]
- Christodoulou, S.E.; Ellinas, G. Pipe routing through ant colony optimization. J. Infrastruct. Syst. 2010, 16, 149–159. [Google Scholar] [CrossRef]
- Oliker, N.; Ostfeld, A. Multi-objective optimization of cost and resilience of water distribution system design. In Proceedings of the 2013 World Environmental and Water Resources Congress, Cincinnati, OH, USA, 19–23 May 2013. [Google Scholar]
- Arango, I.M.; Sebastián, J.I.; García, R.P.; Rodríguez, J.B.M. Water distribution system design using agent swarm optimization. In Proceedings of the 12th Annual Conference on Water Distribution Systems Analysis (WDSA), Tucson, AZ, USA, 12–15 September 2010. [Google Scholar]
- Kang, D.; Lansey, K. Revisiting optimal water-distribution system design: Issues and a heuristic hierarchical approach. J. Water Resour. Plan. Manag. 2012, 138, 208–217. [Google Scholar] [CrossRef]
- Misterly, G.; Ellenberger, C.; Voorhees, R.; Jardell, J. Overcoming the challenges of pipeline conflicts on a major interstate P3. In Proceedings of the 2017 Pipelines, Phoenix, AZ, USA, 6–9 August 2017. [Google Scholar]
- Warriner, M.R.; Bartley, Y.E. Pipeline construction management—pitfalls, contract traps, and conflicts: How to recognize and avoid them. In Proceedings of the 2006 Pipeline Division Specialty Conference, Chicago, IL, USA, 30 July–2 August 2006. [Google Scholar]
- Bartolín, H.; Martínez, F.; Cortés, J.A. Bringing up to date WDS models by querying an EPANET-based GIS geodatabase. In Proceedings of the 8th Annual Water Distribution Systems Analysis Symposium, Cincinnati, OH, USA, 27–30 August 2006. [Google Scholar]
- Ardeshir, A.; Saraye, M.; Sabour, F.; Behzadian, K. Leakage management for water distribution system in GIS environment. In Proceedings of the 2006 World Environmental and Water Resource Congress, Omaha, NE, USA, 21–25 May 2006. [Google Scholar]
- Liu, H.; Allouche, E.; Baumert, M. A GIS based simulation of ground movement due to pipe bursting operation. In Proceedings of the International Conference on Pipeline Engineering and Construction, Boston, MA, USA, 8–11 July 2007. [Google Scholar]
- Tao, T.; Xin, K.; Liu, S.; Zhang, X. A pipe network skeleton method based on GIS network analysis technologies. In Proceedings of the International Conference on Pipelines and Trenchless Technology (ICPTT), Shanghai, China, 19–21 October 2009. [Google Scholar]
- Yan, B.; Su, X.R.; Chen, Y.Y. Functional structure and data management of urban water supply network based on GIS. Water Resour. Manag. 2009, 23, 2633–2653. [Google Scholar] [CrossRef]
- Sitzenfrei, R.; Möderl, M.; Rauch, W. WDS designer—A tool algorithmic generation of water distribution systems based on GIS data. In Proceedings of the 2010 World Environmental and Water Resources Congress, Providence, RI, USA, 16–20 May 2010. [Google Scholar]
- Ho, C.I.; Lin, M.D.; Lo, S.L. Use of a GIS-based hybrid artificial neural network to prioritize the order of pipe replacement in a water distribution network. Environ. Monit. Assess. 2010, 166, 177–189. [Google Scholar] [CrossRef] [PubMed]
- Tabesh, M.; Delavar, M.R.; Delkhah, A. Use of geospatial information system based tool for renovation and rehabilitation of water distribution systems. Int. J. Environ. Sci. Technol. 2010, 7, 47–58. [Google Scholar] [CrossRef]
- Tabesh, M.; Saber, H. A prioritization model for rehabilitation of water distribution networks using GIS. Water Resour. Manag. 2012, 26, 225–241. [Google Scholar] [CrossRef]
- Salah, A.M.; Atwood, D. Pipeline alignment optimization: Automated GIS-based approach. J. Pipeline Syst. Eng. Pract. 2011, 2, 2–13. [Google Scholar] [CrossRef]
- Liu, R.; Issa, R.R.A. 3D visualization of sub-surface pipelines in connection with the building utilities: Integrating GIS and BIM for facility management. Comput. Civ. Eng. 2012, 341–348. [Google Scholar]
- Isikdag, U.; Zlatanova, S. Towards defining a framework for automatic generation of buildings in CityGML using BIM. In 3D Geo-information Sciences; Lee, J., Zlatanova, S., Eds.; Springer: Berlin, Germany, 2009. [Google Scholar]
- Building Smart Alliance. IFC for GIS; Building Smart Alliance: Hertfordshire, UK, 2011. [Google Scholar]
- Hallberg, D.; Tarandi, V. On the use of 4D BIM in LMS for Construction Works. J. Inf. Technol. Constr. 2009, 16, 445–466. [Google Scholar]
- de Laat, R.; van Berlo, L. Integration of BIM and GIS: The development of the CityGML GeoBIM extension. In Advances in 3D Geo-Information Sciences; Kolbe, T.H., Konig, G., Nagel, C., Eds.; Springer: Berlin, Germany, 2011. [Google Scholar]
- Becker, T.; Nagel, C.; Kolbe, T.H. Integrated 3D modeling of multi-utility networks and their interdependencies for critical infrastructure analysis. In Advances in 3D Geo-Information Sciences; Kolbe, T.H., König, G., Nagel, C., Eds.; Springer: Berlin, Germany, 2011. [Google Scholar]
- Bedford, M. GIS for Water Management in Europe; ESRI Press: Redlands, CA, USA, 2004. [Google Scholar]
- ESRI. ArcGIS Water Utility Data Model; Environmental Systems Research Institute: Redlands, CA, USA, 2003. [Google Scholar]
- ESRI. GIS Technology for Water, Wastewater, and Storm Water Utilities; Environmental Systems Research Institute: Redlands, CA, USA, 2007. [Google Scholar]
- Grise, S.; Idolyantes, E.; Brinton, E.; Booth, B.; Zeiler, M. Water Utilities. ArcGIS™ Data Models; Environmental Systems Research Institute: Redlands, CA, USA, 2001. [Google Scholar]
- Hwang, H.; Lansey, K. Water distribution system classification using system characteristics and graph-theory metrics. J. Water Resour. Plan. Manag. 2017, 143, 1–13. [Google Scholar] [CrossRef]
- Torres, J.M.; Duenas-Osorio, L.; Li, Q.; Yazdani, A. Exploring topological effects on water distribution system performance using graph theory and statistical models. J. Water Resour. Plan. Manag. 2016, 143, 04016068. [Google Scholar] [CrossRef]
Figure 1.
The process of the proposed method.

Figure 2.
(a) Pipe elements represented in Industry Foundation Classes (IFC) schema; (b) pipe elements represented in City Geography Markup Language (CityGML) schema.
Figure 2.
(a) Pipe elements represented in Industry Foundation Classes (IFC) schema; (b) pipe elements represented in City Geography Markup Language (CityGML) schema.

Figure 3.
(a) IfcFlowSegment connected to two distribution ports represented by Featuregraph class in CityGML; (b) IfcFlowFitting connected to three ports using Featuregraph class in CityGML.
Figure 3.
(a) IfcFlowSegment connected to two distribution ports represented by Featuregraph class in CityGML; (b) IfcFlowFitting connected to three ports using Featuregraph class in CityGML.

Figure 4.
IFC data extracted to CityGML.

Figure 5.
Information stored in different layers in GIS.

Figure 6.
The development process for the 3D model of the water distribution system (WDS) and its surroundings.
Figure 6.
The development process for the 3D model of the water distribution system (WDS) and its surroundings.

Figure 7.
Topology validation process.

Figure 8.
Schematic description of the spatial relationships among points, lines, and areas (PLAs).

Figure 9.
The planned layout of the proposed water distribution system.

Figure 10.
(a) The digital elevation model (DEM) of the project area; (b) part of aerial photograph of the project area; (c) 3D surface model.
Figure 10.
(a) The digital elevation model (DEM) of the project area; (b) part of aerial photograph of the project area; (c) 3D surface model.

Figure 11.
(a) Part of aerial photograph of the project area; (b) 3D model of the buildings in SketchUp; (c) 3D model of buildings in geographic information system (GIS).
Figure 11.
(a) Part of aerial photograph of the project area; (b) 3D model of the buildings in SketchUp; (c) 3D model of buildings in geographic information system (GIS).

Figure 12.
(a) The pipe systems in 2D drawings; (b1,b2) 3D model of the pipe systems in building information modeling (BIM); (c1–c3) 3D model of pipe systems in GIS.
Figure 12.
(a) The pipe systems in 2D drawings; (b1,b2) 3D model of the pipe systems in building information modeling (BIM); (c1–c3) 3D model of pipe systems in GIS.

Figure 13.
3D model of the WDS project and its surroundings (a–c).

Figure 14.
Details of the topological rules used.

Figure 15.
The clash between the water pipeline and the rainwater pipeline.


Table 1.
GIS-based topological rules used in this study.
| PLAs | Rules | Use in Pipeline | |
|---|---|---|---|
| Points | a | Must be covered by line | Demand points must be covered pipelines |
| b | Must be properly inside areas | All distribution points must be inside the area | |
| c | Must be covered by endpoint of | Water tank must be covered by end points of the pipeline | |
| Lines | d | Must not intersect | Pipelines must not intersect with each other (water and sewer) |
| e | Endpoints must be covered by | Pipelines in area must end at points | |
| f | Must not have pseudonodes | Pipes can only end at points to prevent subdivided lines | |
| g | Must be inside | The pipes must be inside the area | |
| h | Must be covered by features class of | Underground pipelines must be covered by roads | |
| Areas | i | Must be covered by | Residential buildings to be covered by some part of pipe system area |
| j | Must not have gaps | Land usage of the studied area must form a continuous surface with no gaps | |
| k | Must not overlap | Footprints of various buildings must not overlap |
© 2019 by the authors. Licensee MDPI, Basel, Switzerland. This article is an open access article distributed under the terms and conditions of the Creative Commons Attribution (CC BY) license (http://creativecommons.org/licenses/by/4.0/).
Share and Cite
MDPI and ACS Style
Zhao, L.; Liu, Z.; Mbachu, J. An Integrated BIM–GIS Method for Planning of Water Distribution System. ISPRS Int. J. Geo-Inf. 2019, 8, 331. https://0-doi-org.brum.beds.ac.uk/10.3390/ijgi8080331
AMA Style
Zhao L, Liu Z, Mbachu J. An Integrated BIM–GIS Method for Planning of Water Distribution System. ISPRS International Journal of Geo-Information. 2019; 8(8):331. https://0-doi-org.brum.beds.ac.uk/10.3390/ijgi8080331
Chicago/Turabian StyleZhao, Linlin, Zhansheng Liu, and Jasper Mbachu. 2019. "An Integrated BIM–GIS Method for Planning of Water Distribution System" ISPRS International Journal of Geo-Information 8, no. 8: 331. https://0-doi-org.brum.beds.ac.uk/10.3390/ijgi8080331
Note that from the first issue of 2016, this journal uses article numbers instead of page numbers. See further details here.