Identify and Delimitate Urban Hotspot Areas Using a Network-Based Spatiotemporal Field Clustering Method

Abstract
:1. Introduction
2. Related Work
3. Theoretical Basis
3.1. Spatial Data Field
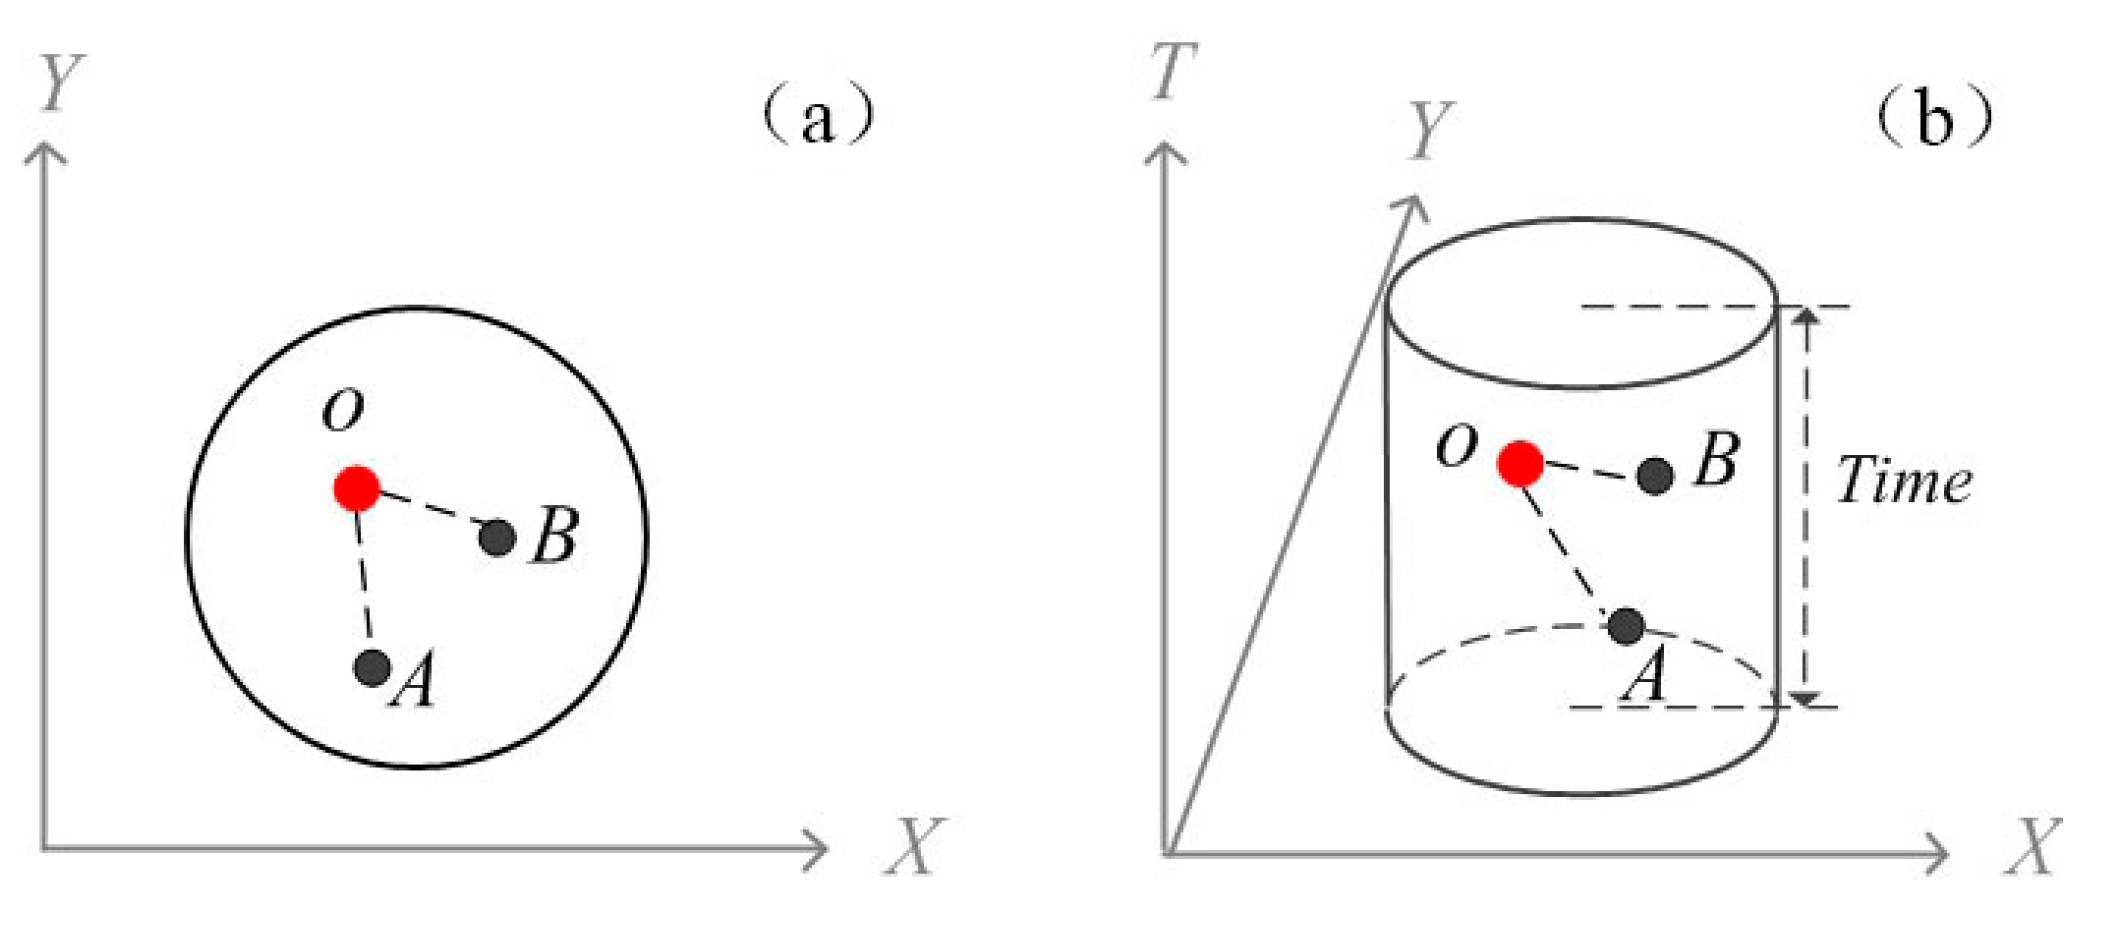
3.2. Extension from Spatial to the Spatiotemporal Data Field
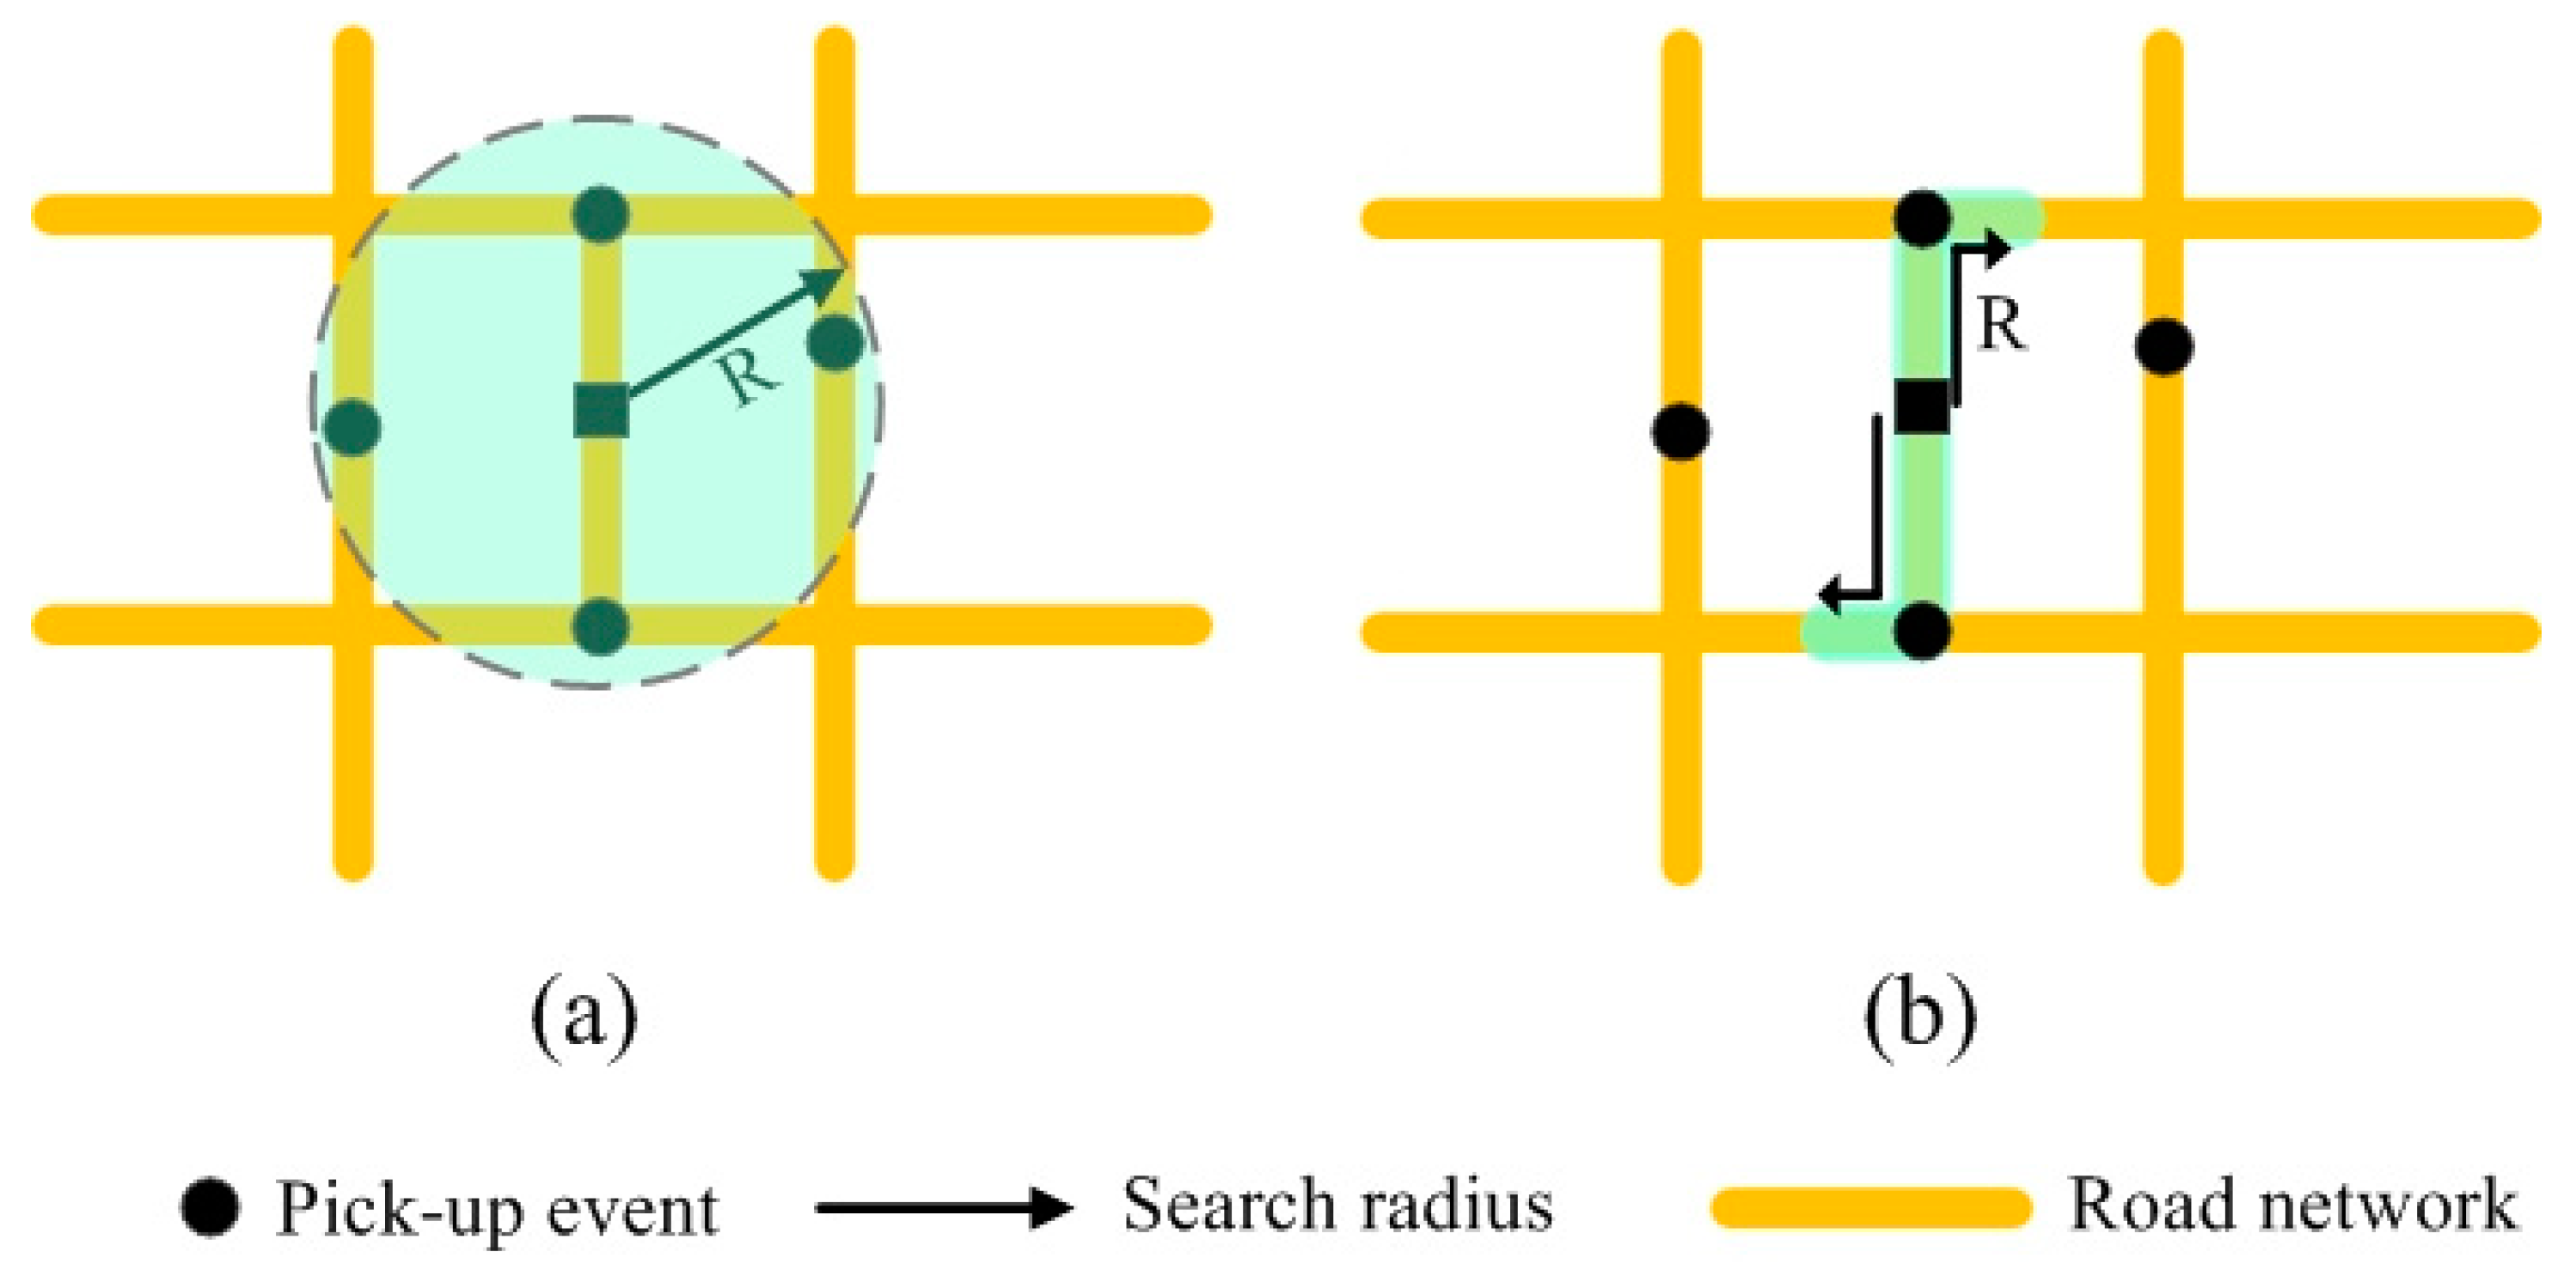
3.3. Network-Based Spatiotemporal Field (NSF) Clustering Method
4. Methodology
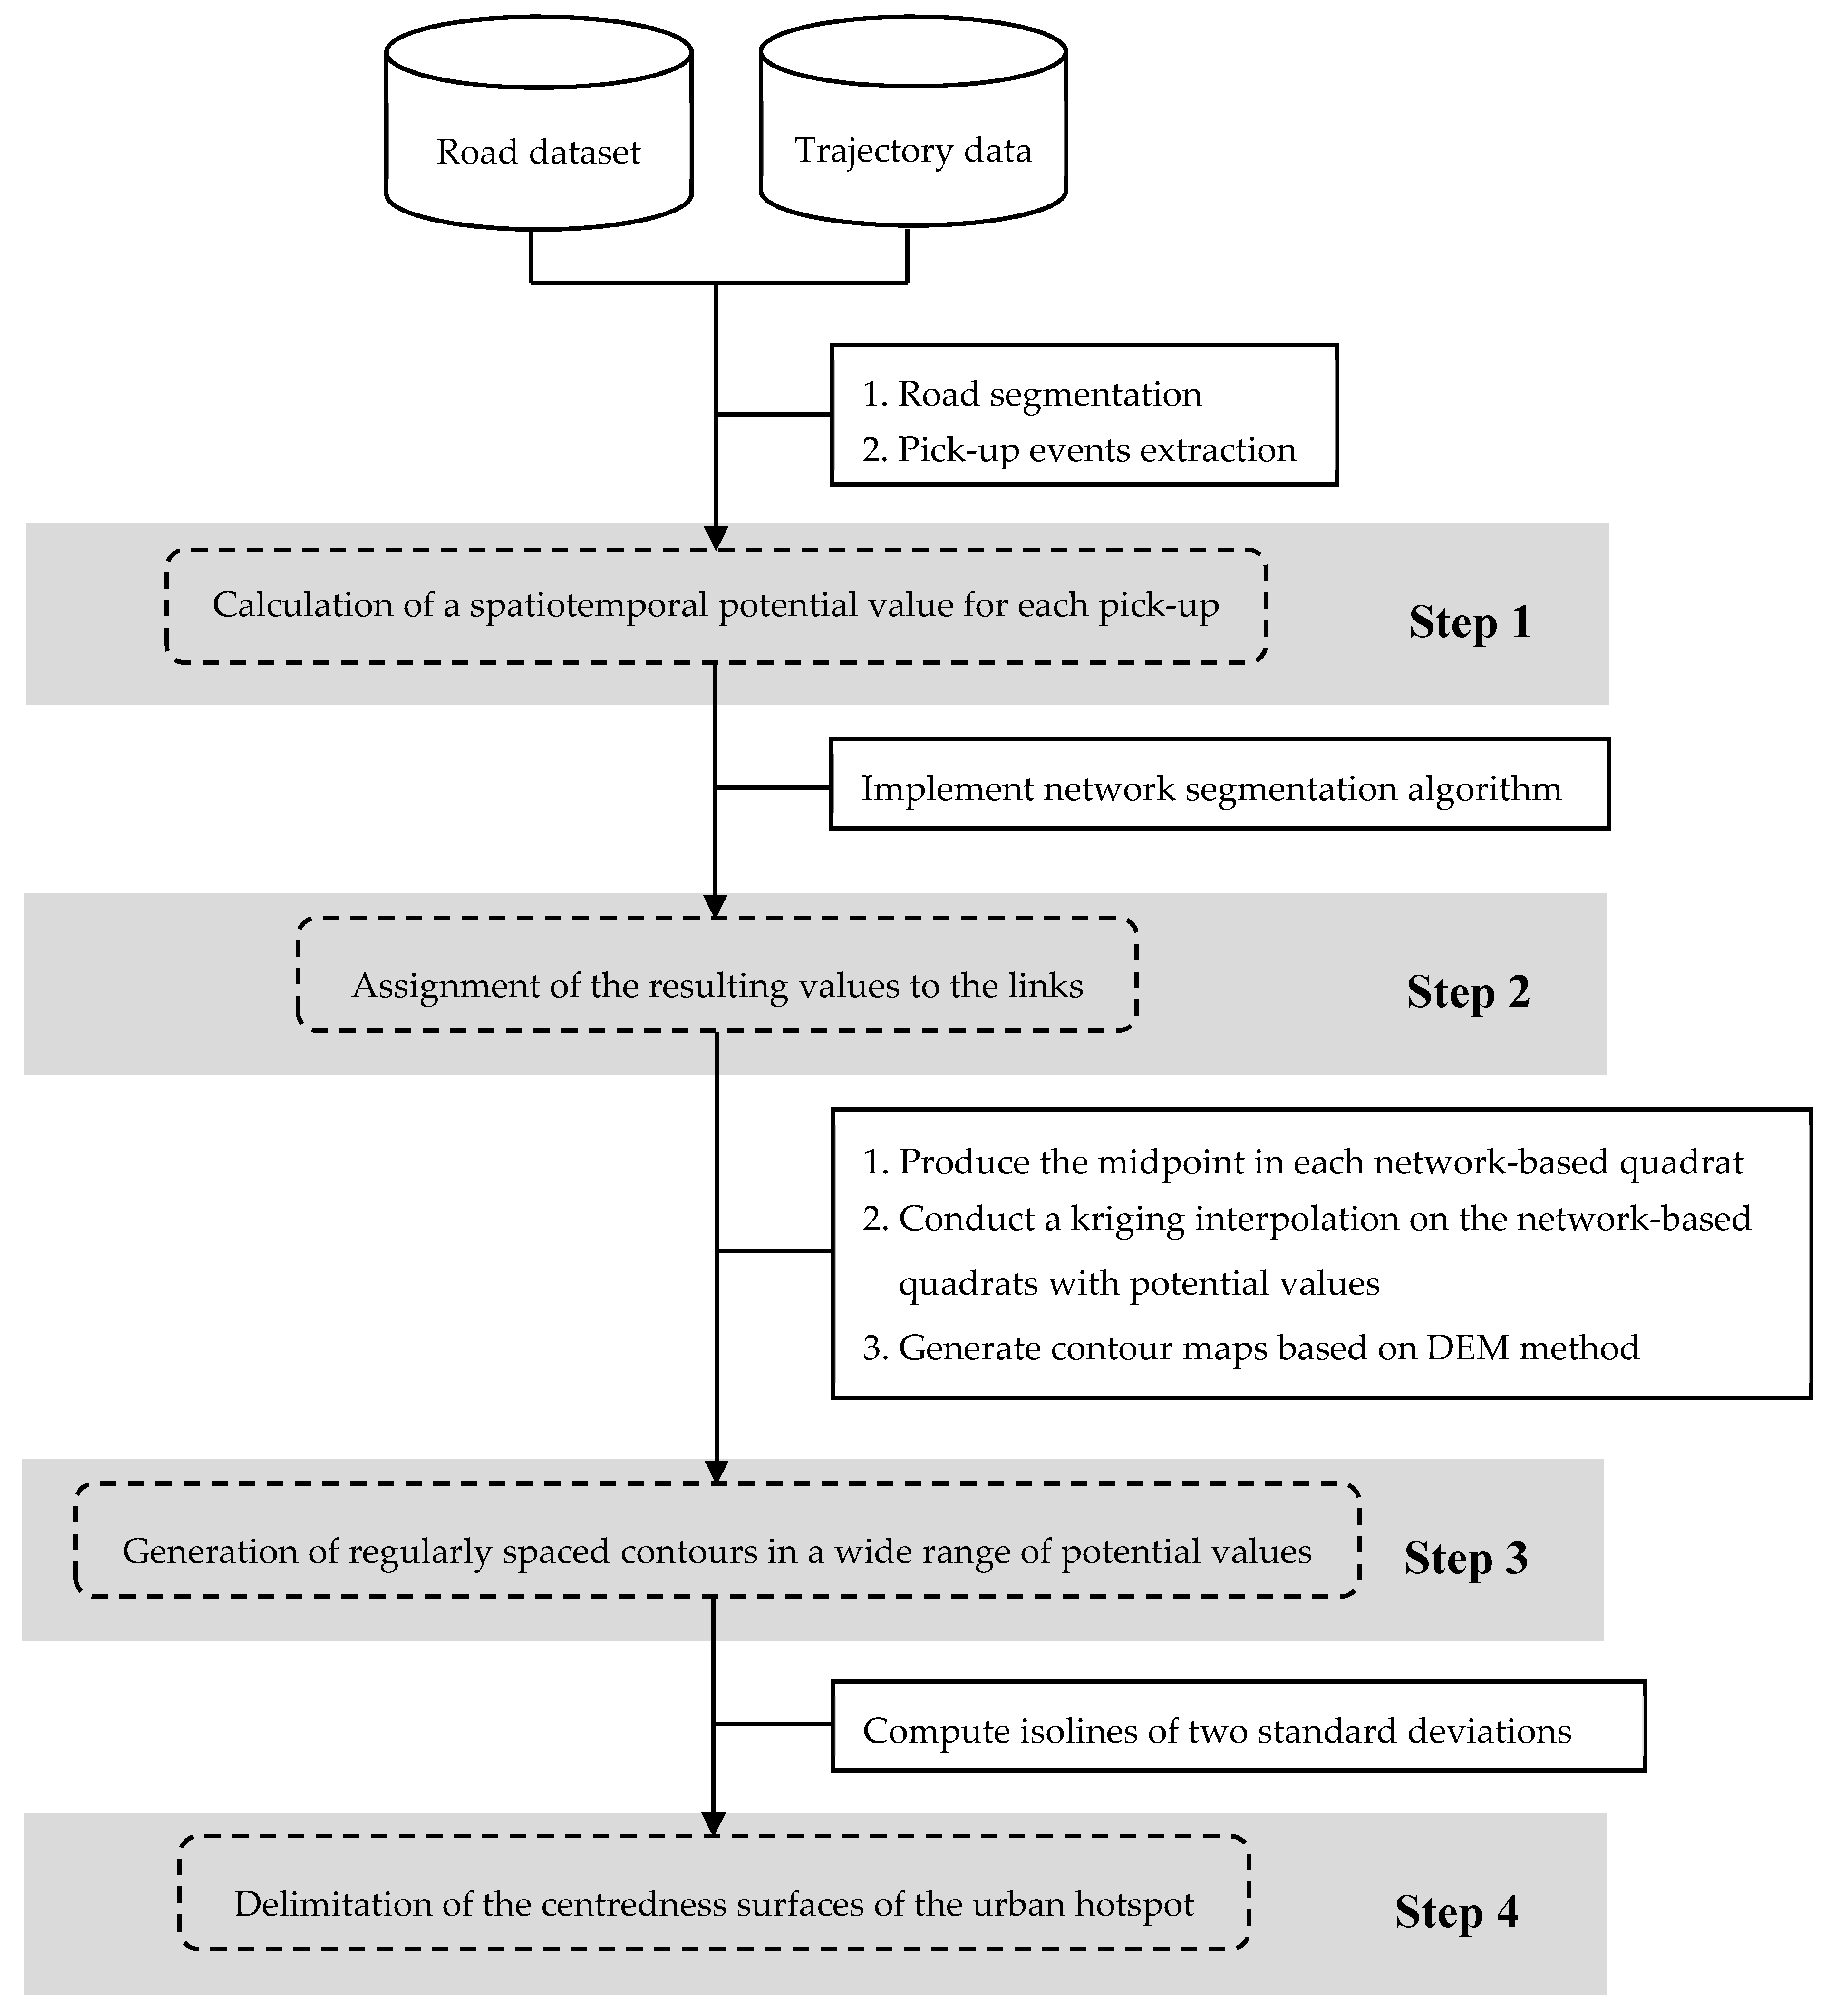
4.1. Framework
4.2. Calculation of Spatiotemporal Potential Value for Each Pick-Up Point
4.3. Assignment of Resulting Values to Links
4.4. Delimitation of Centredness Surfaces of Urban Hotspot
5. Case Study: Exploring Spatiotemporal Clustering Pattern from Taxis’ Pick-up Events
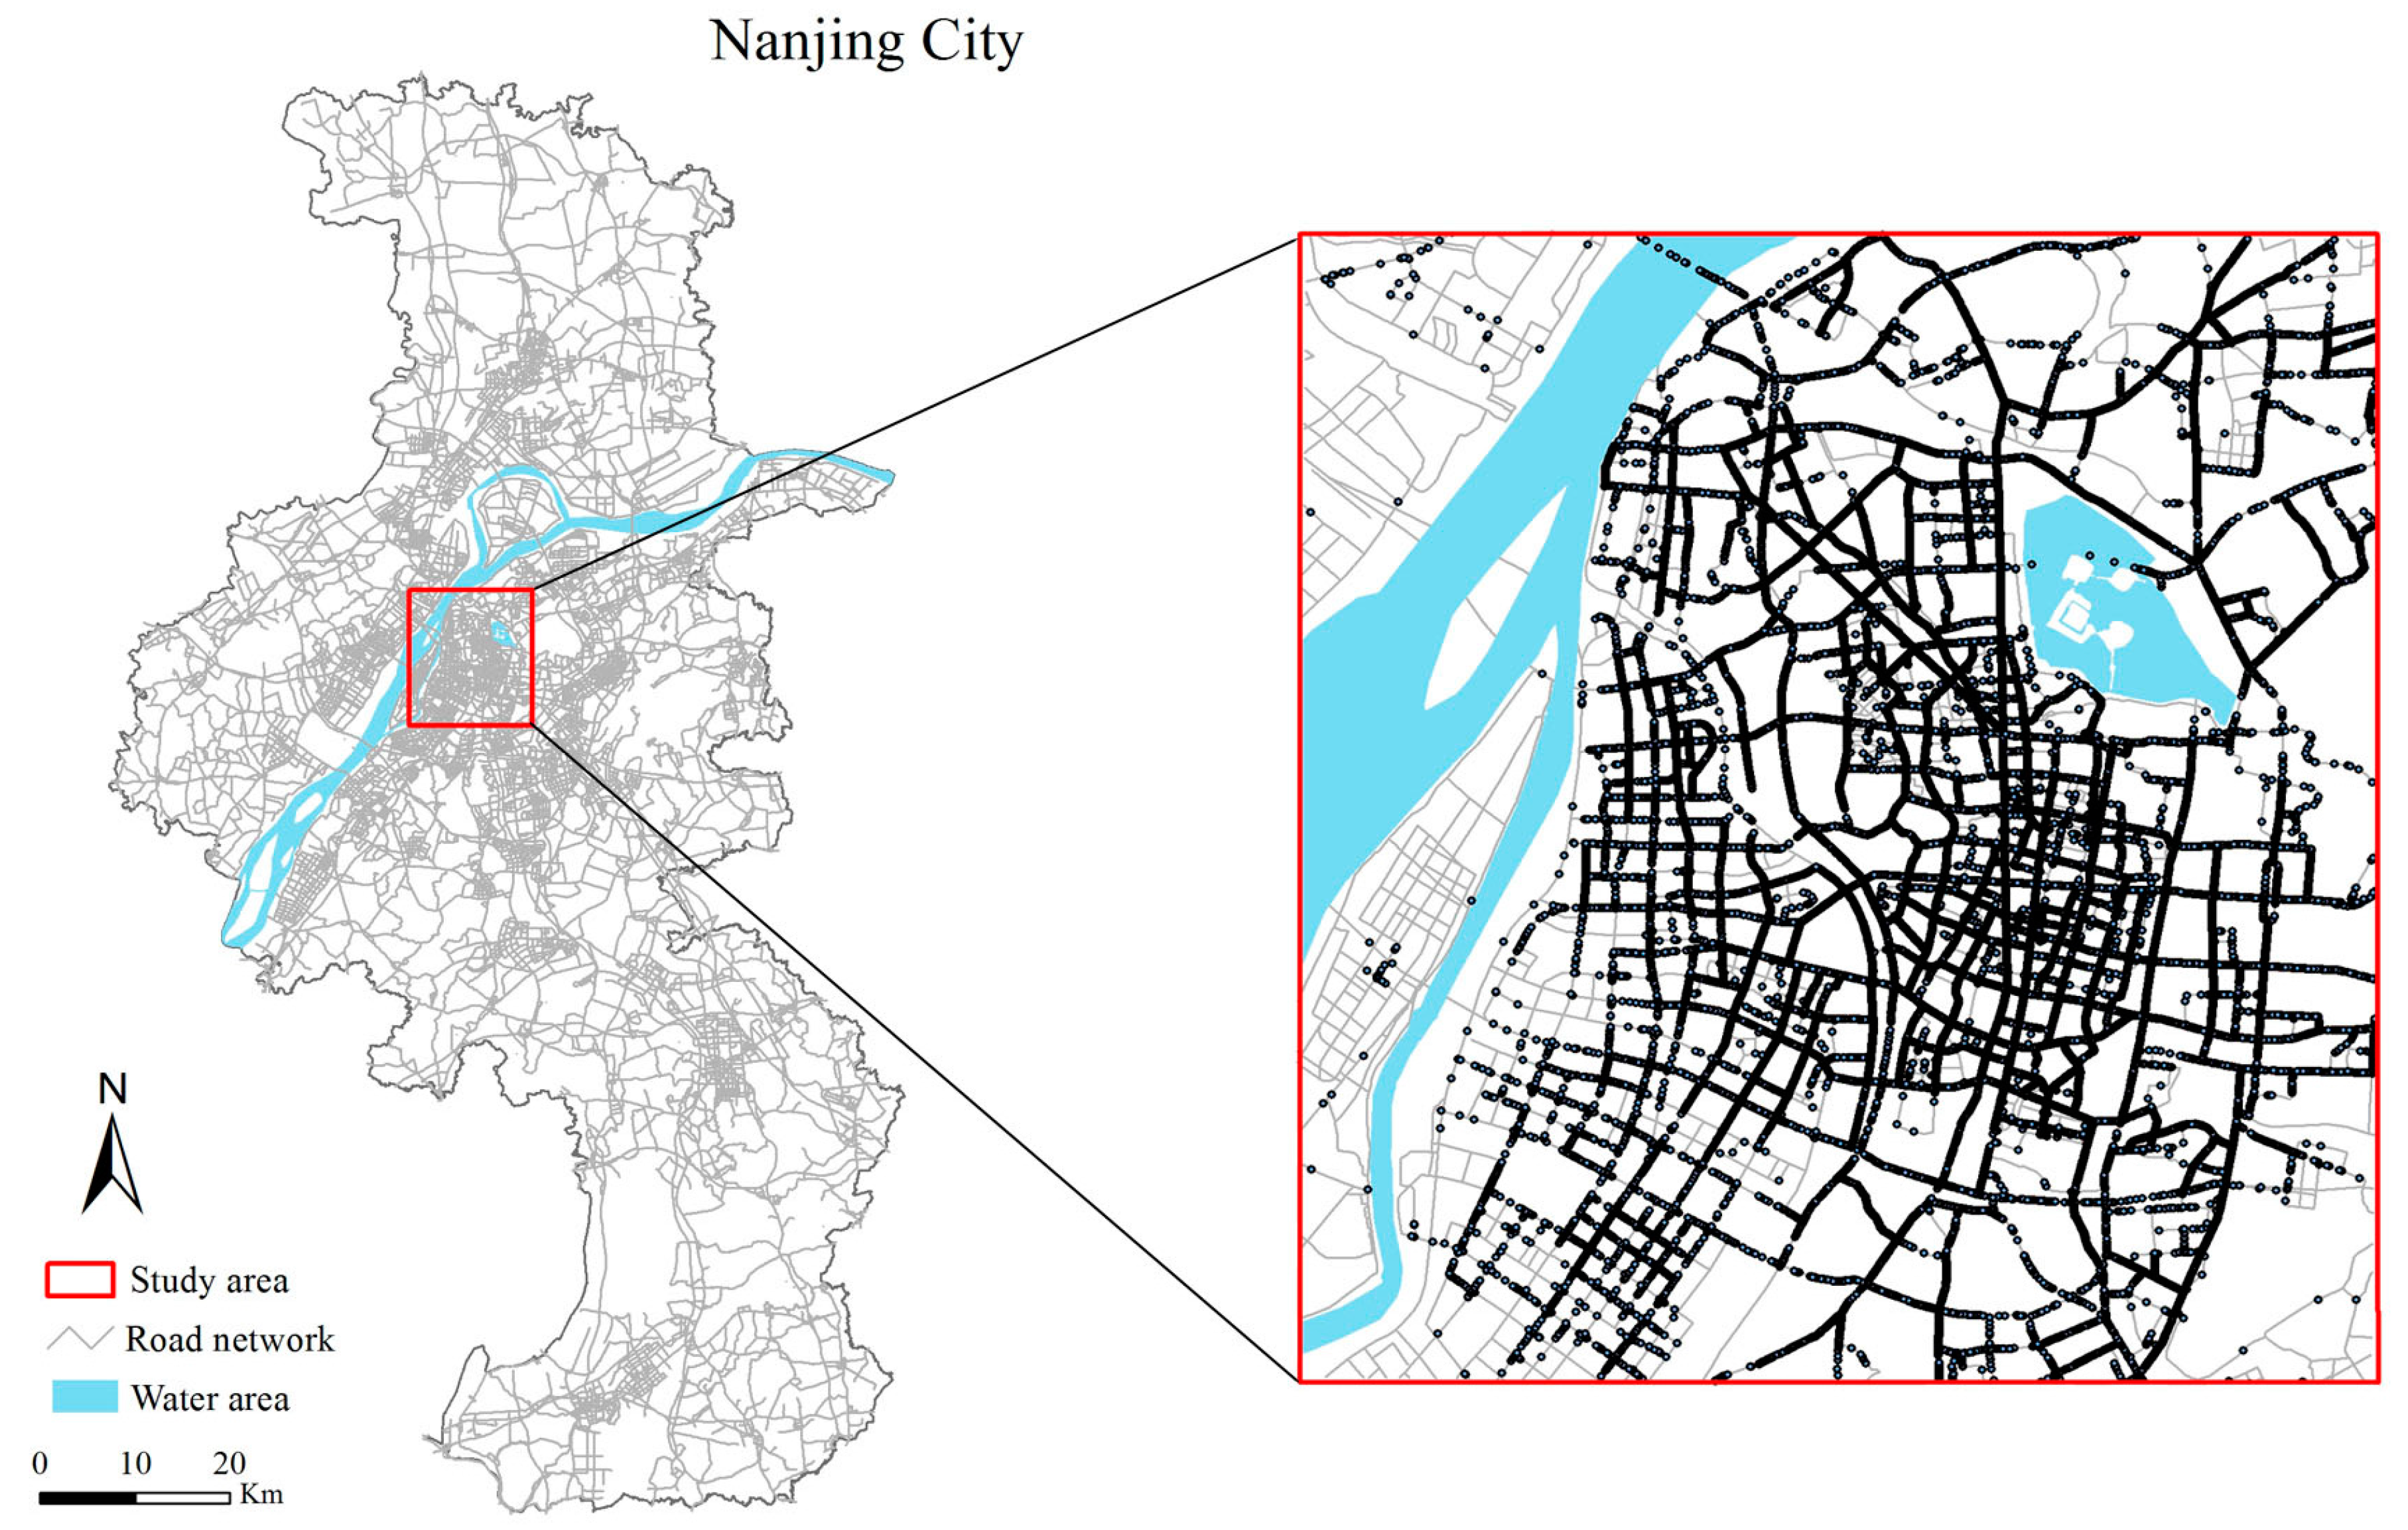
5.1. Data Description and Processing
5.2. Experiment Settings
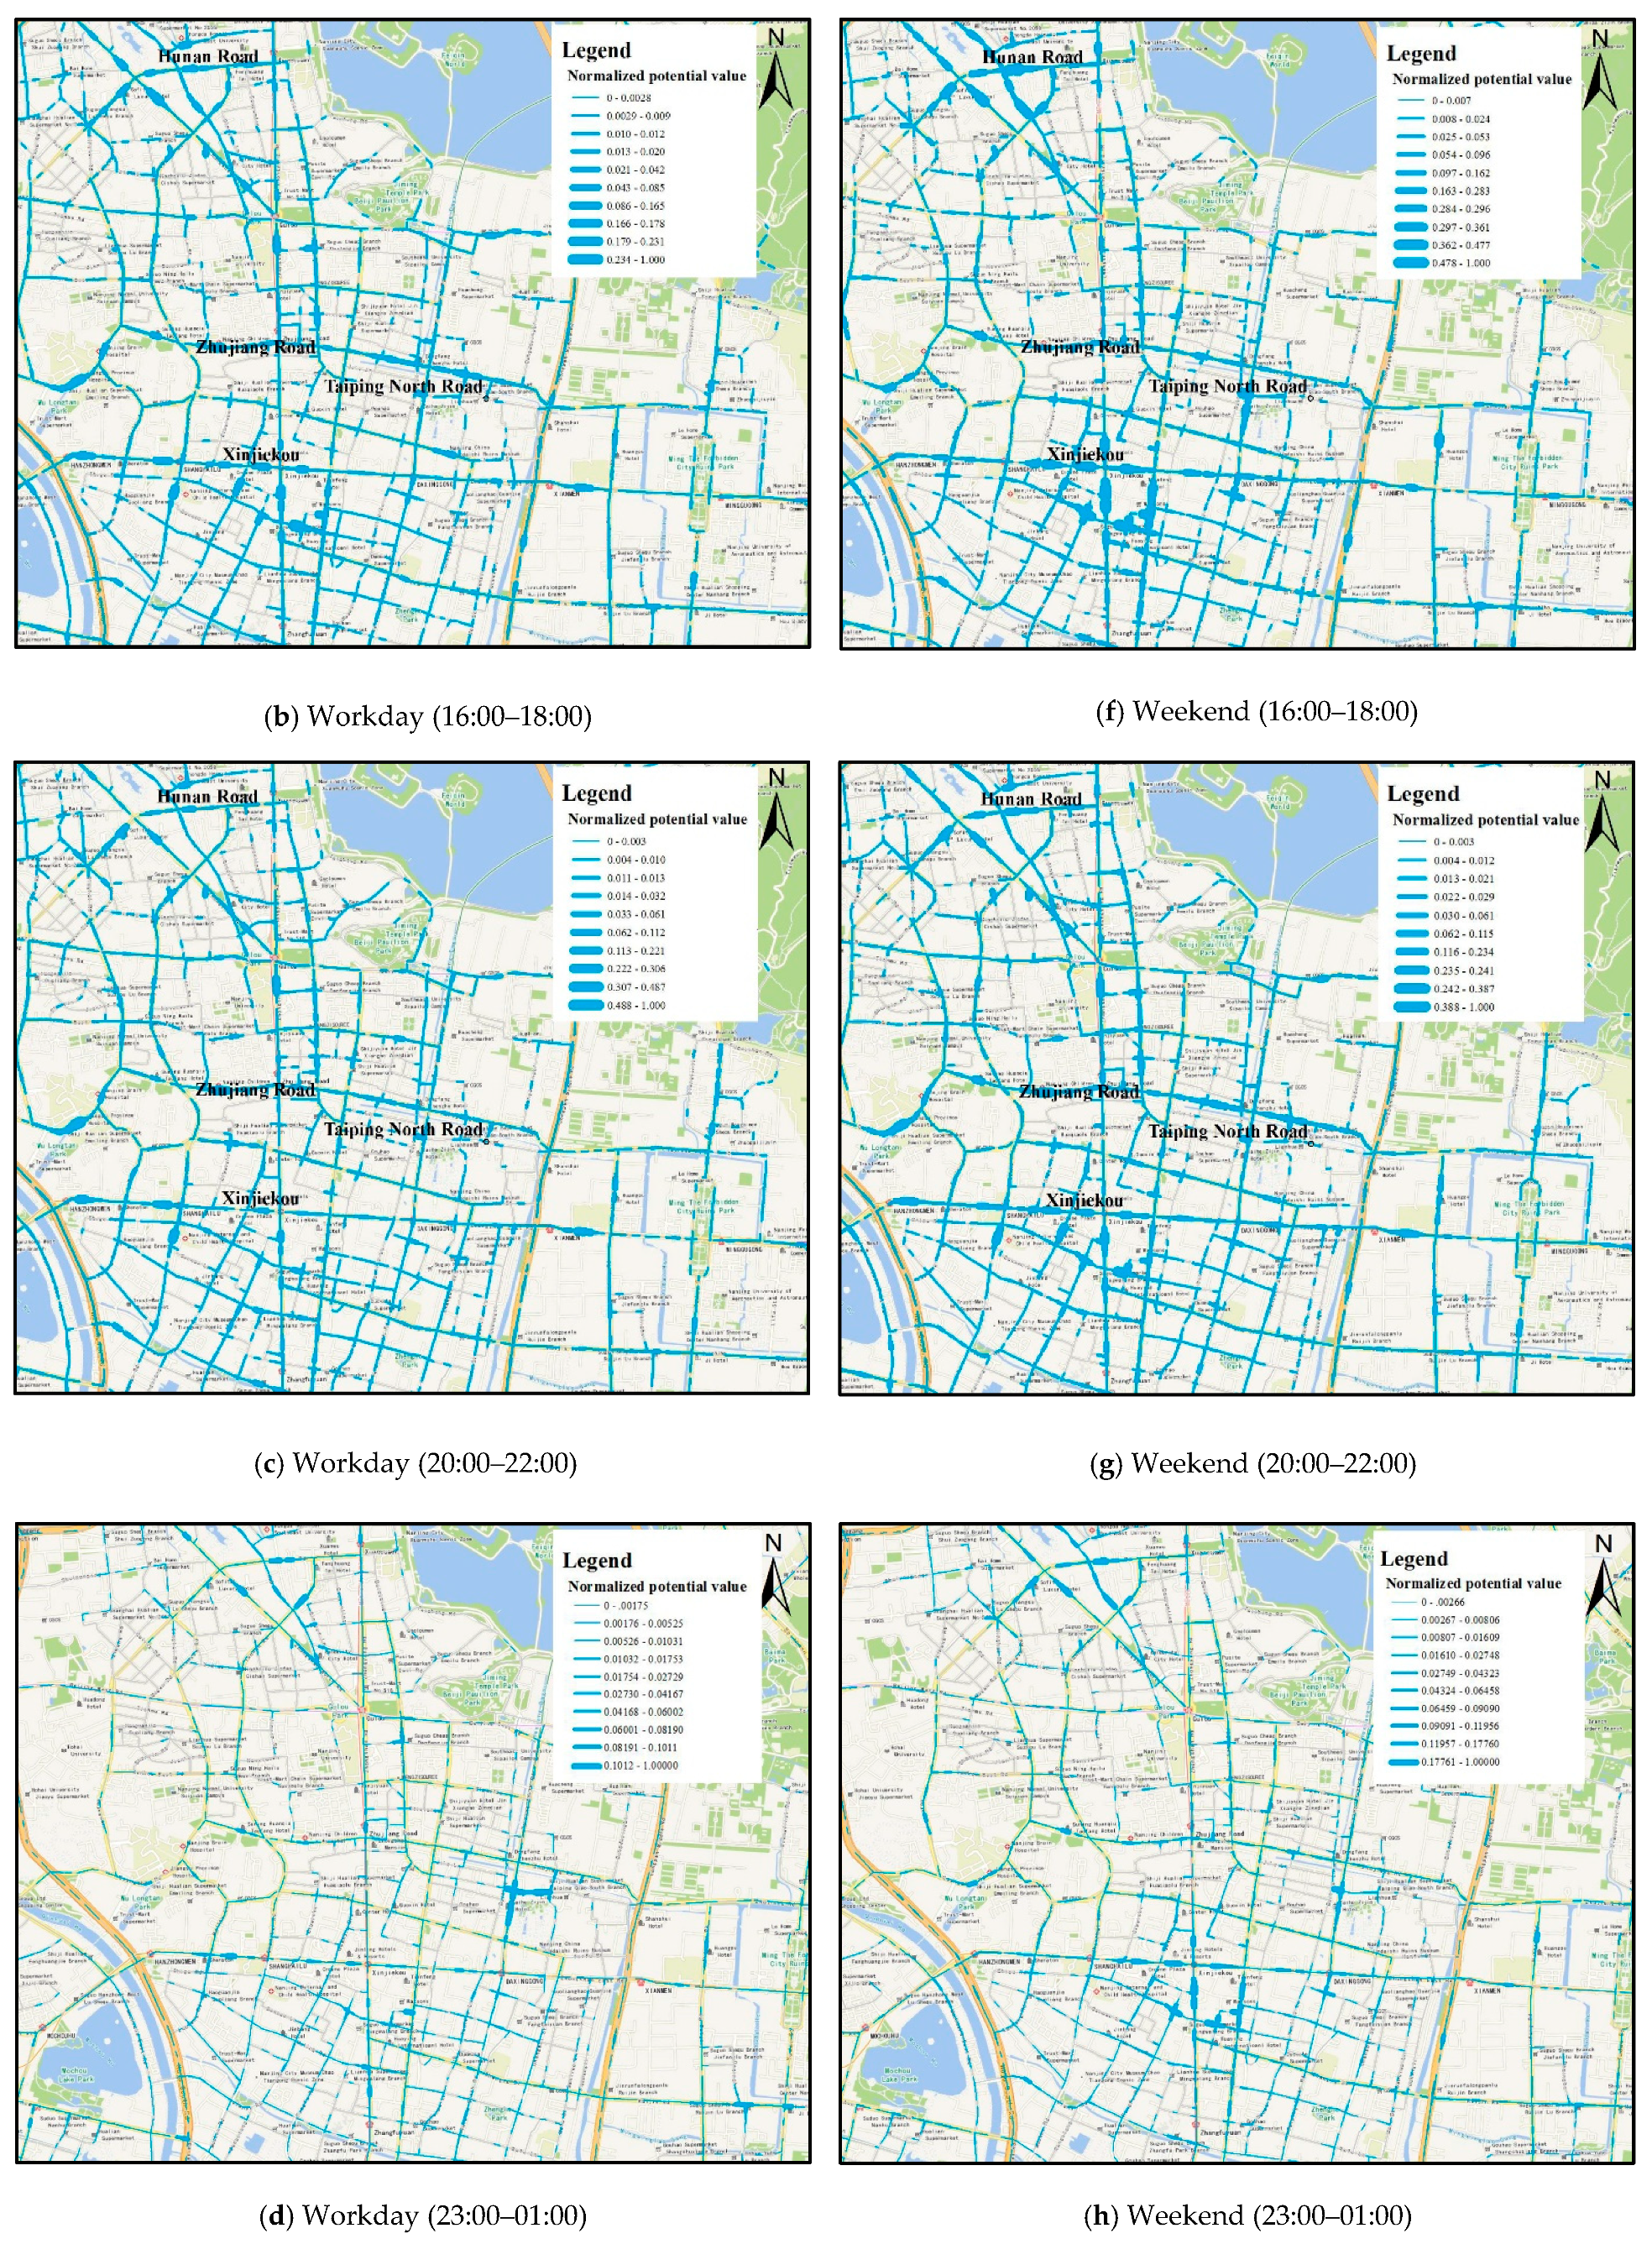
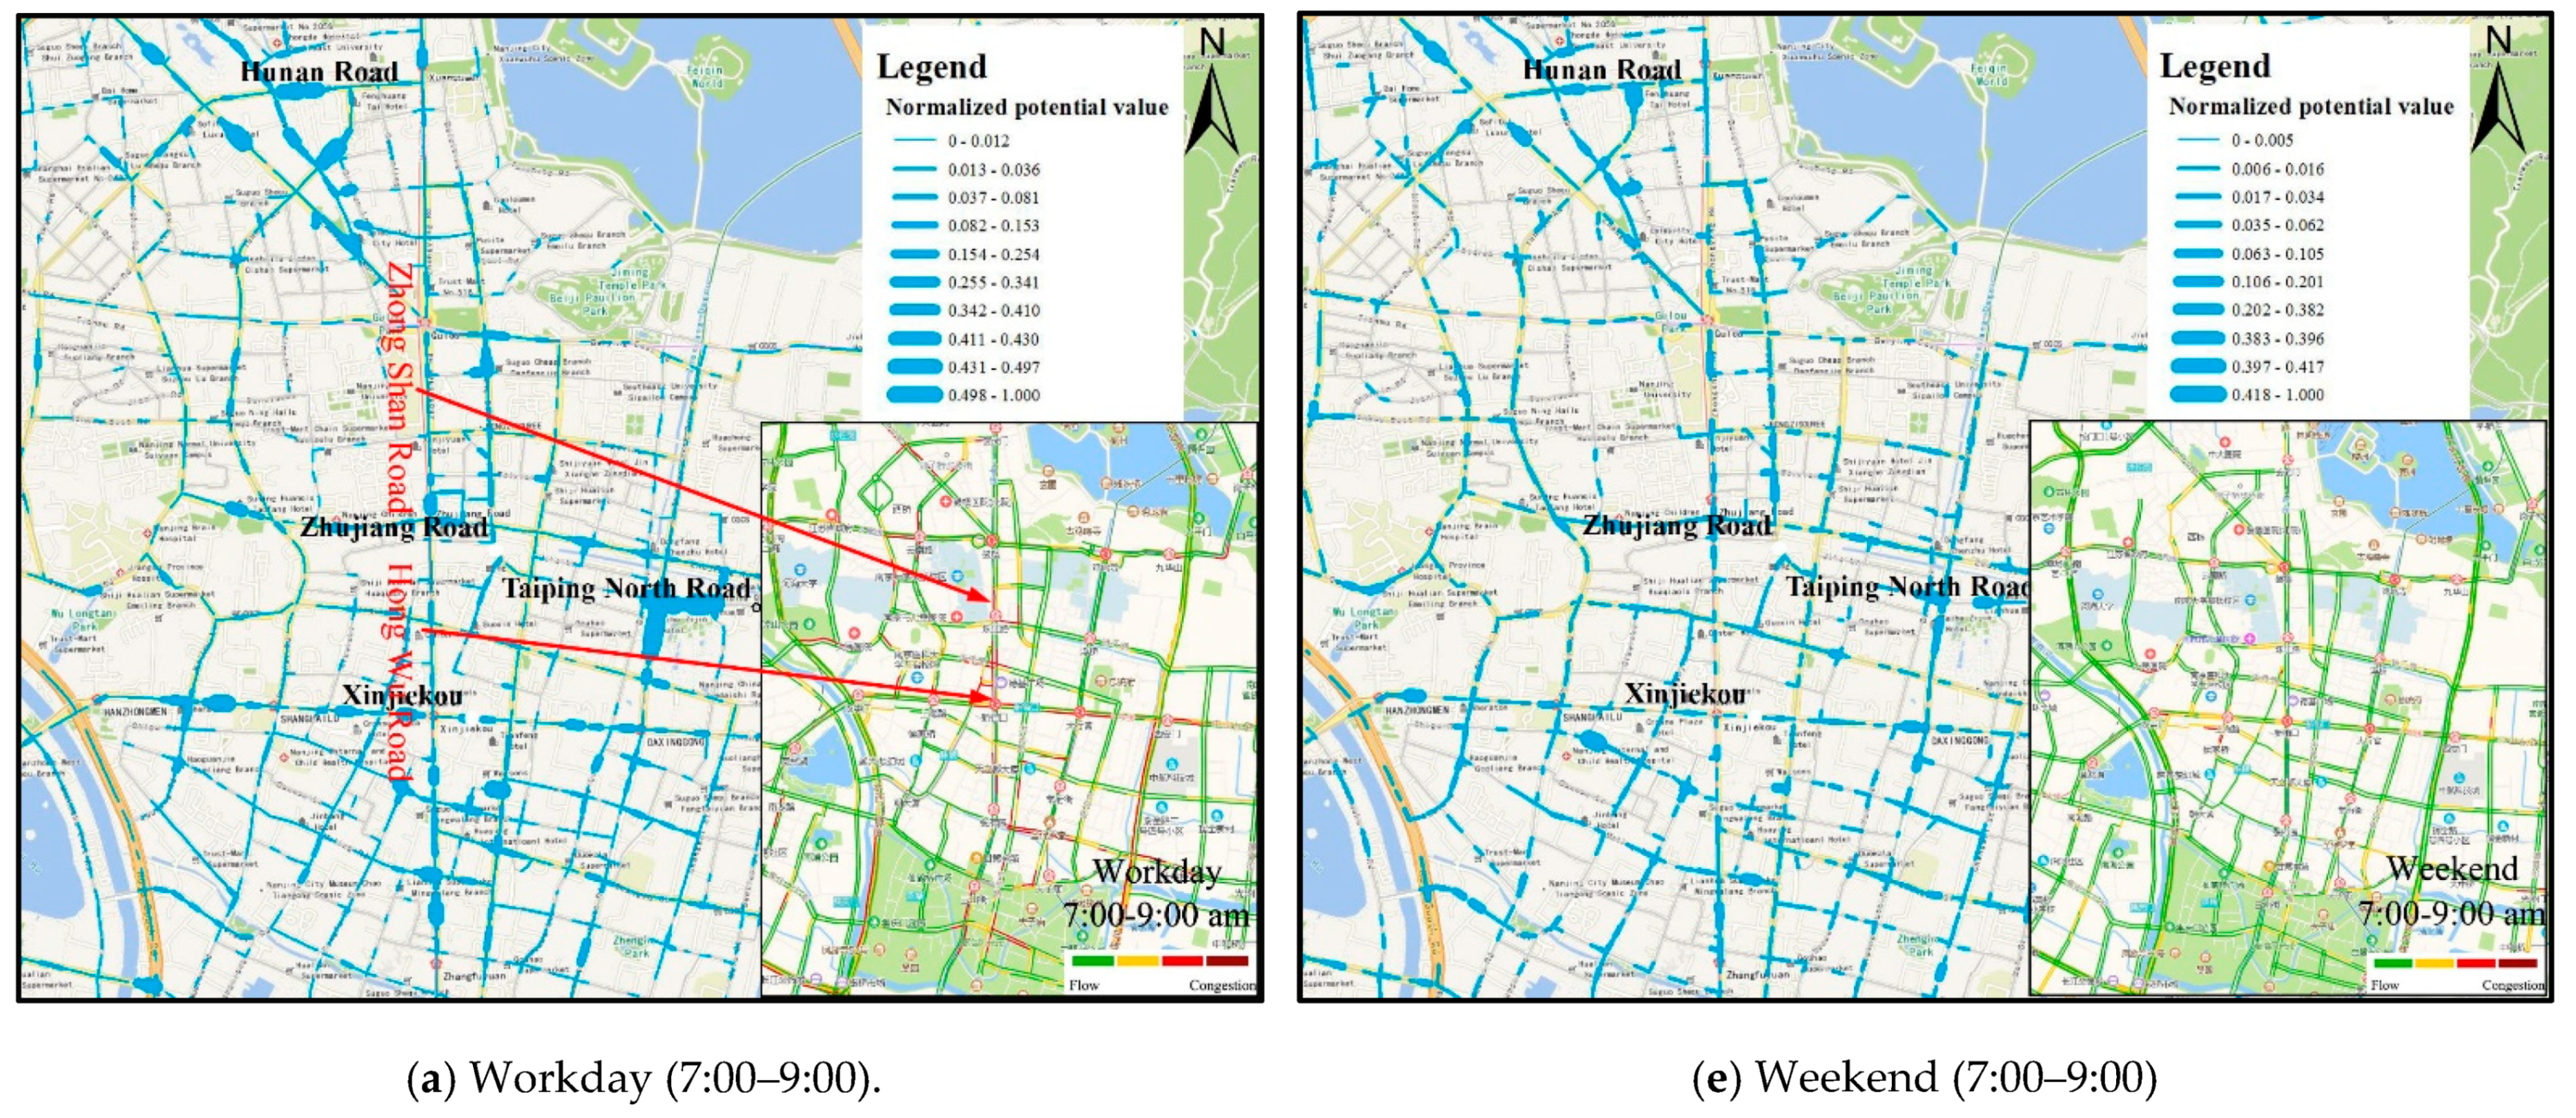
5.3. Analysis of Spatiotemporal Dynamics of Urban Hotspots
6. Delimitation of Urban Hotspot Centredness
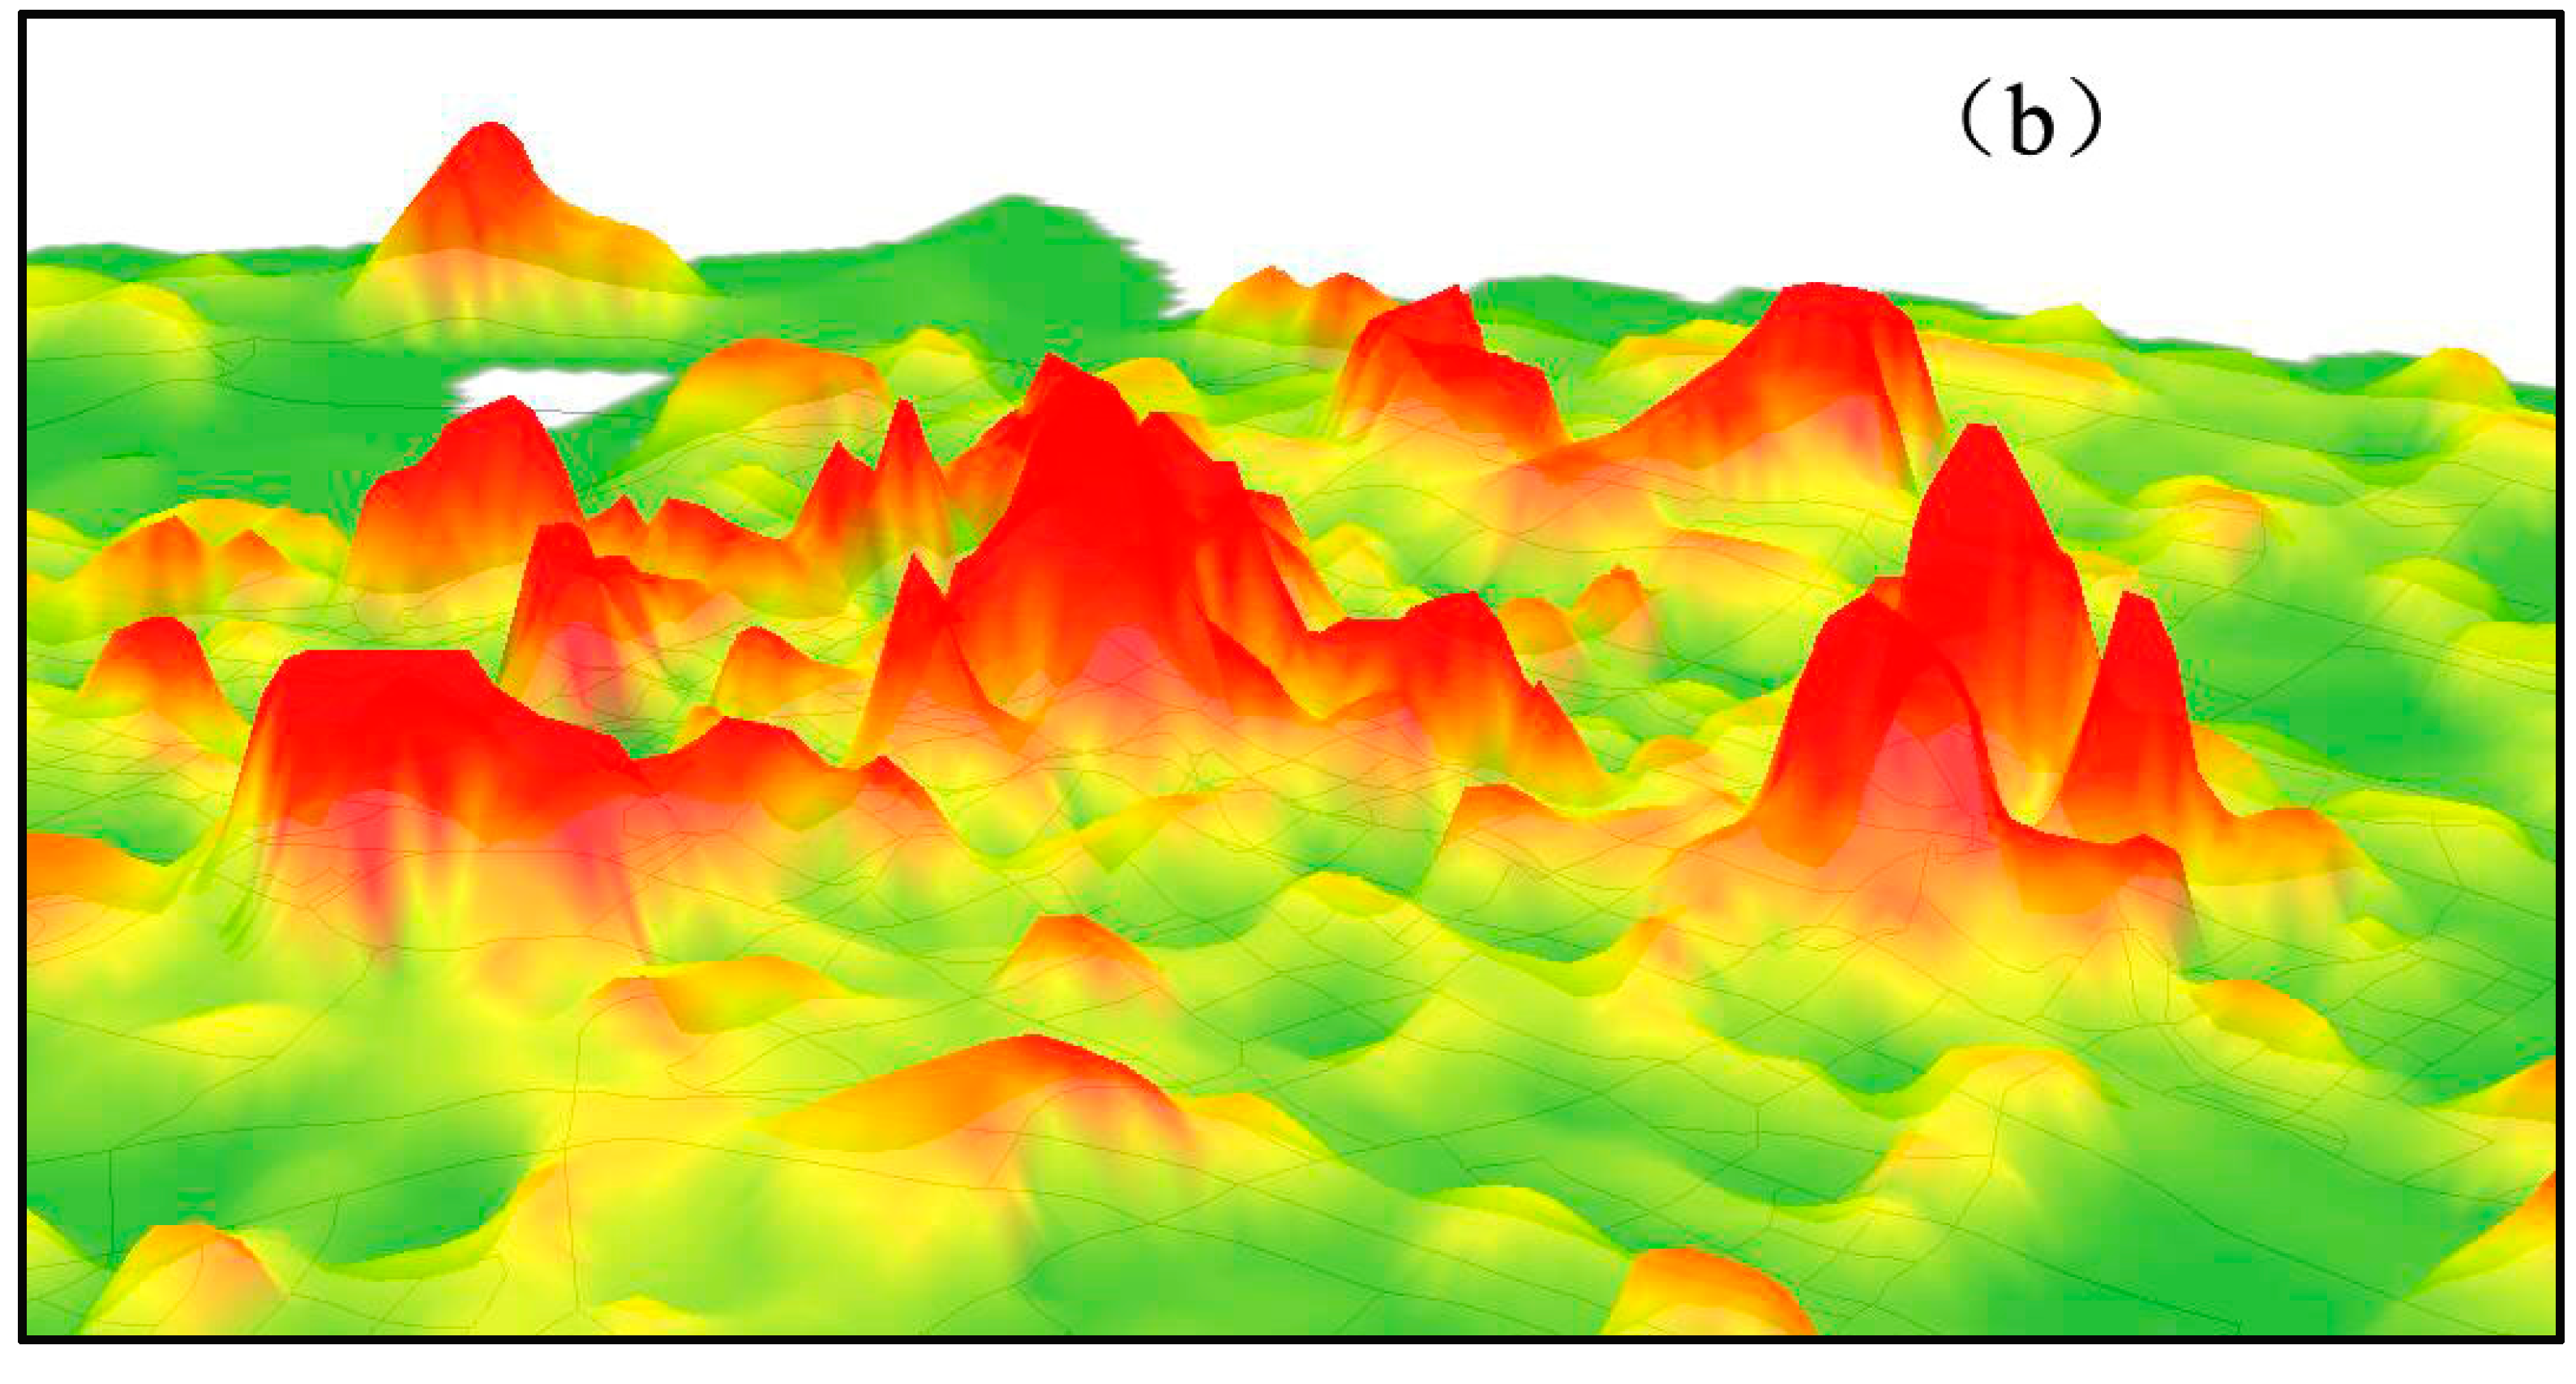
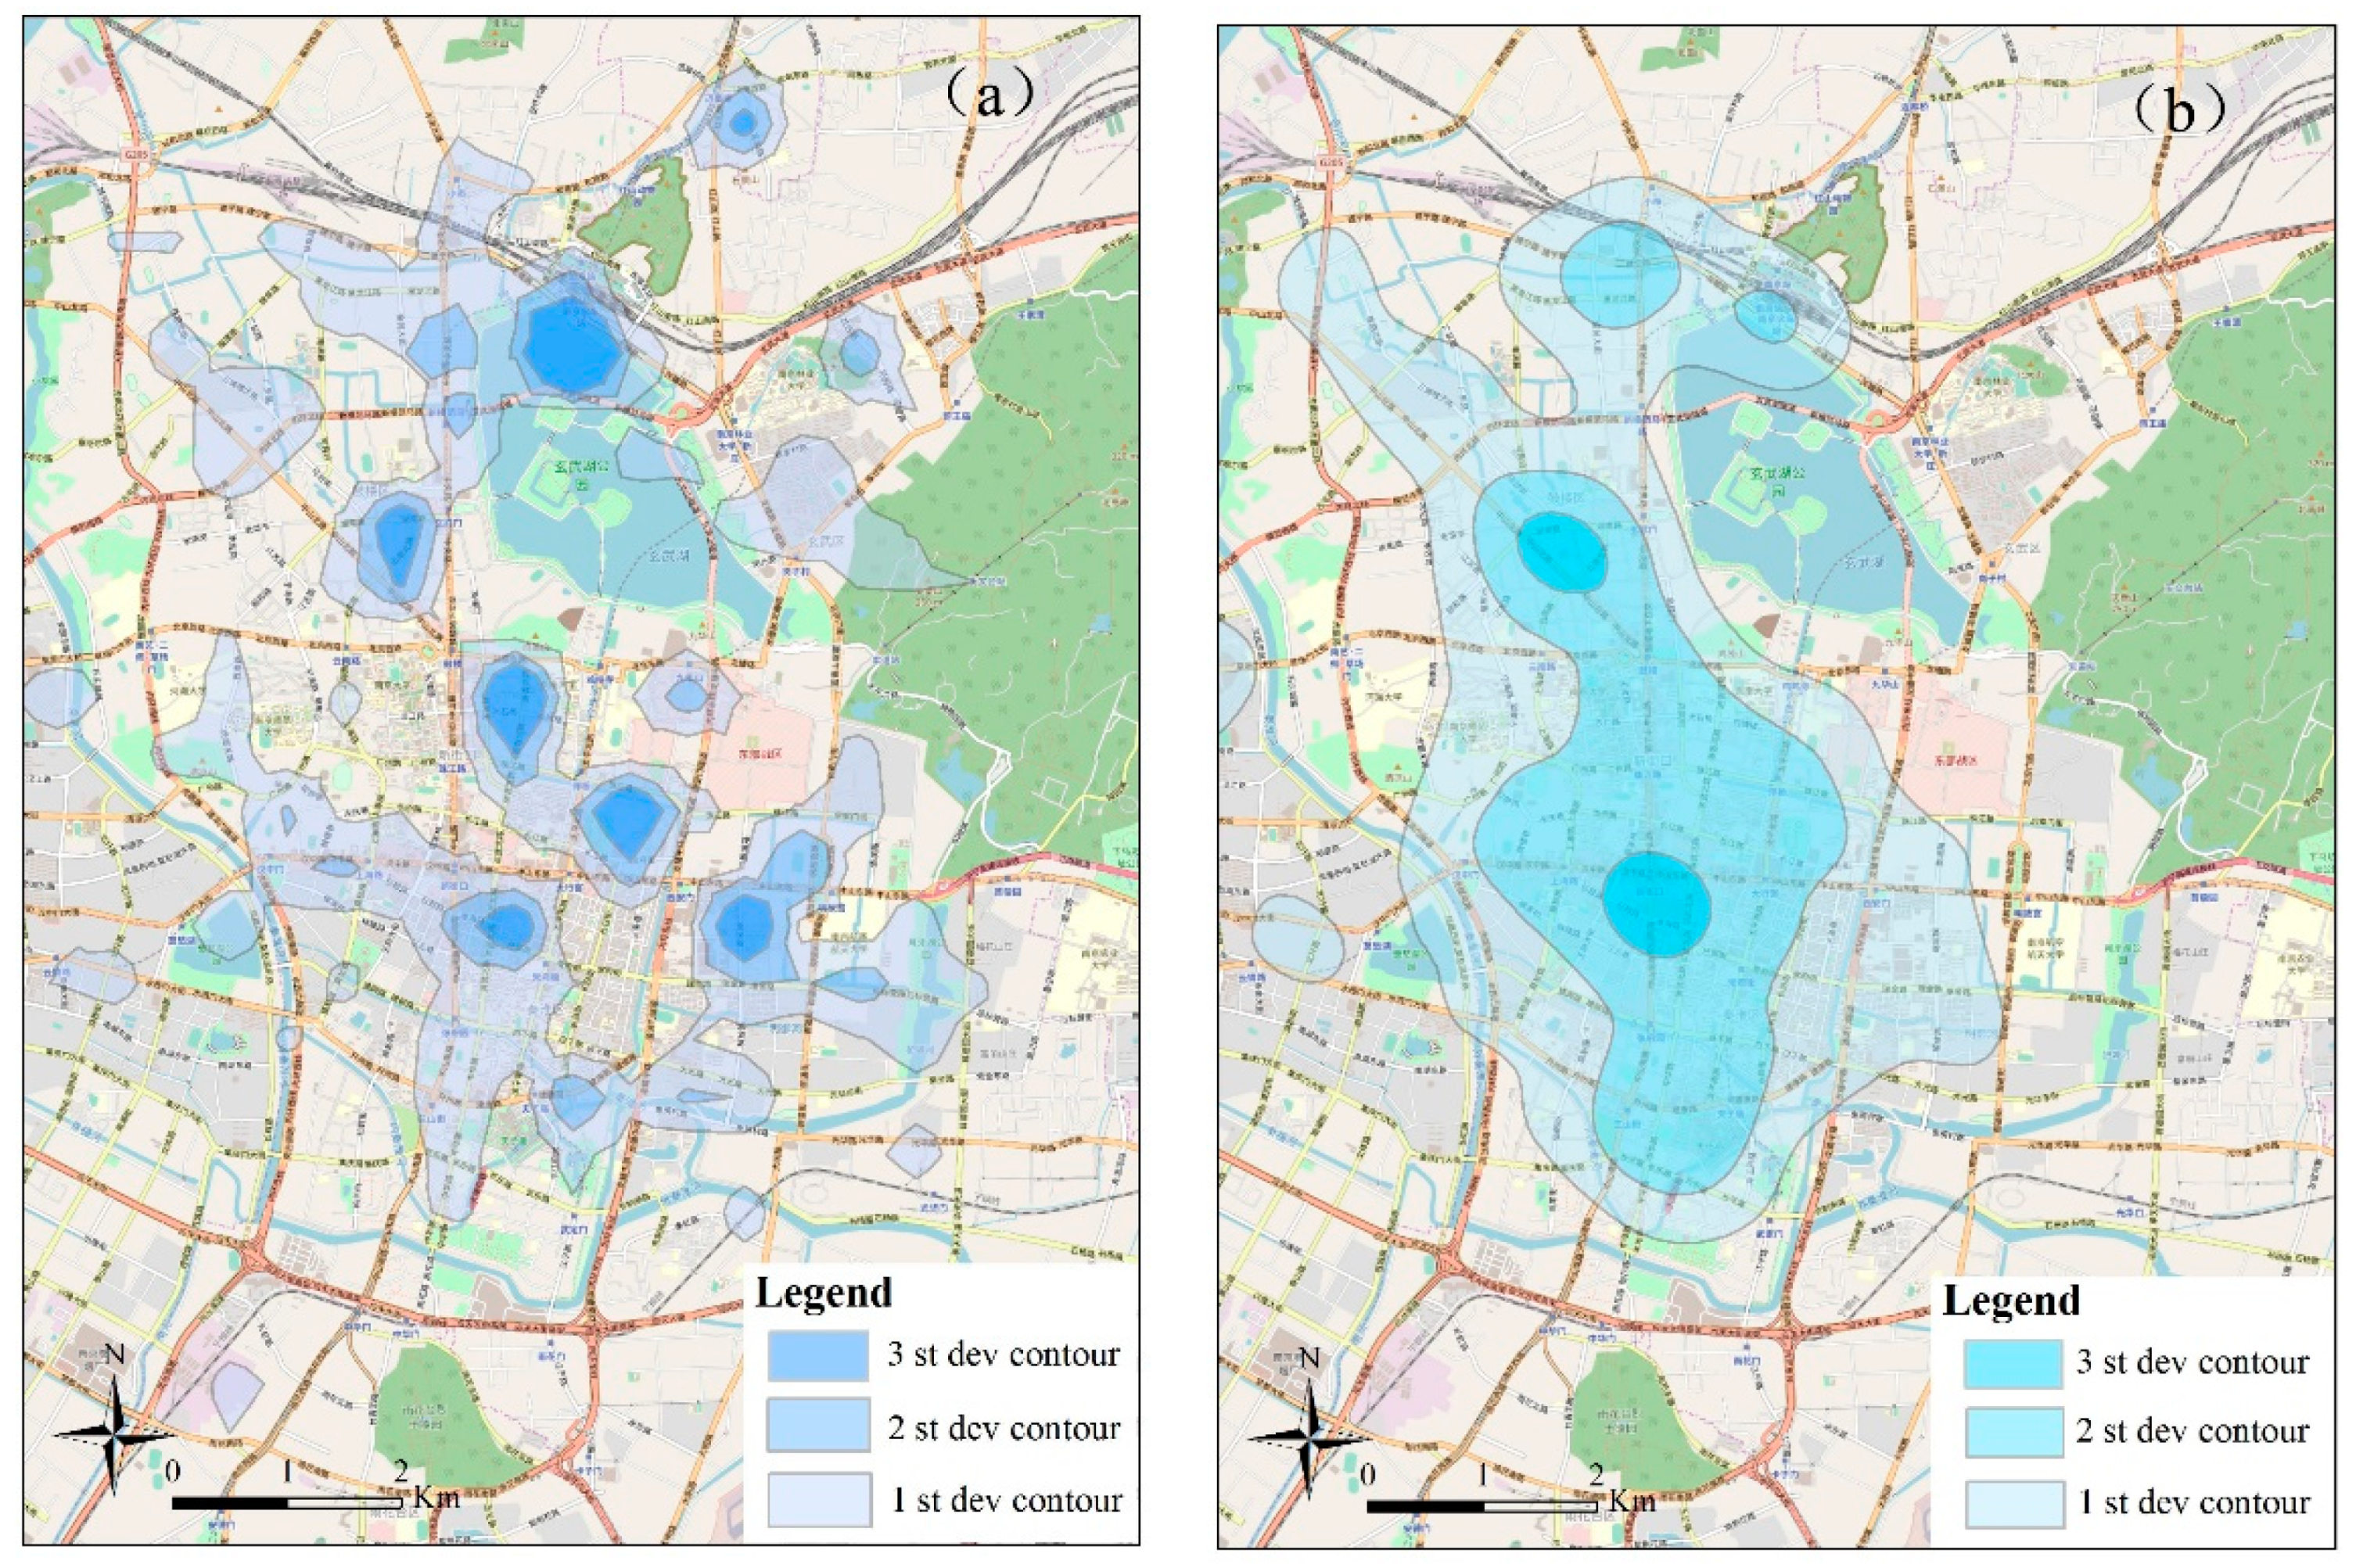
6.1. 3D Visualization of Potential Surface
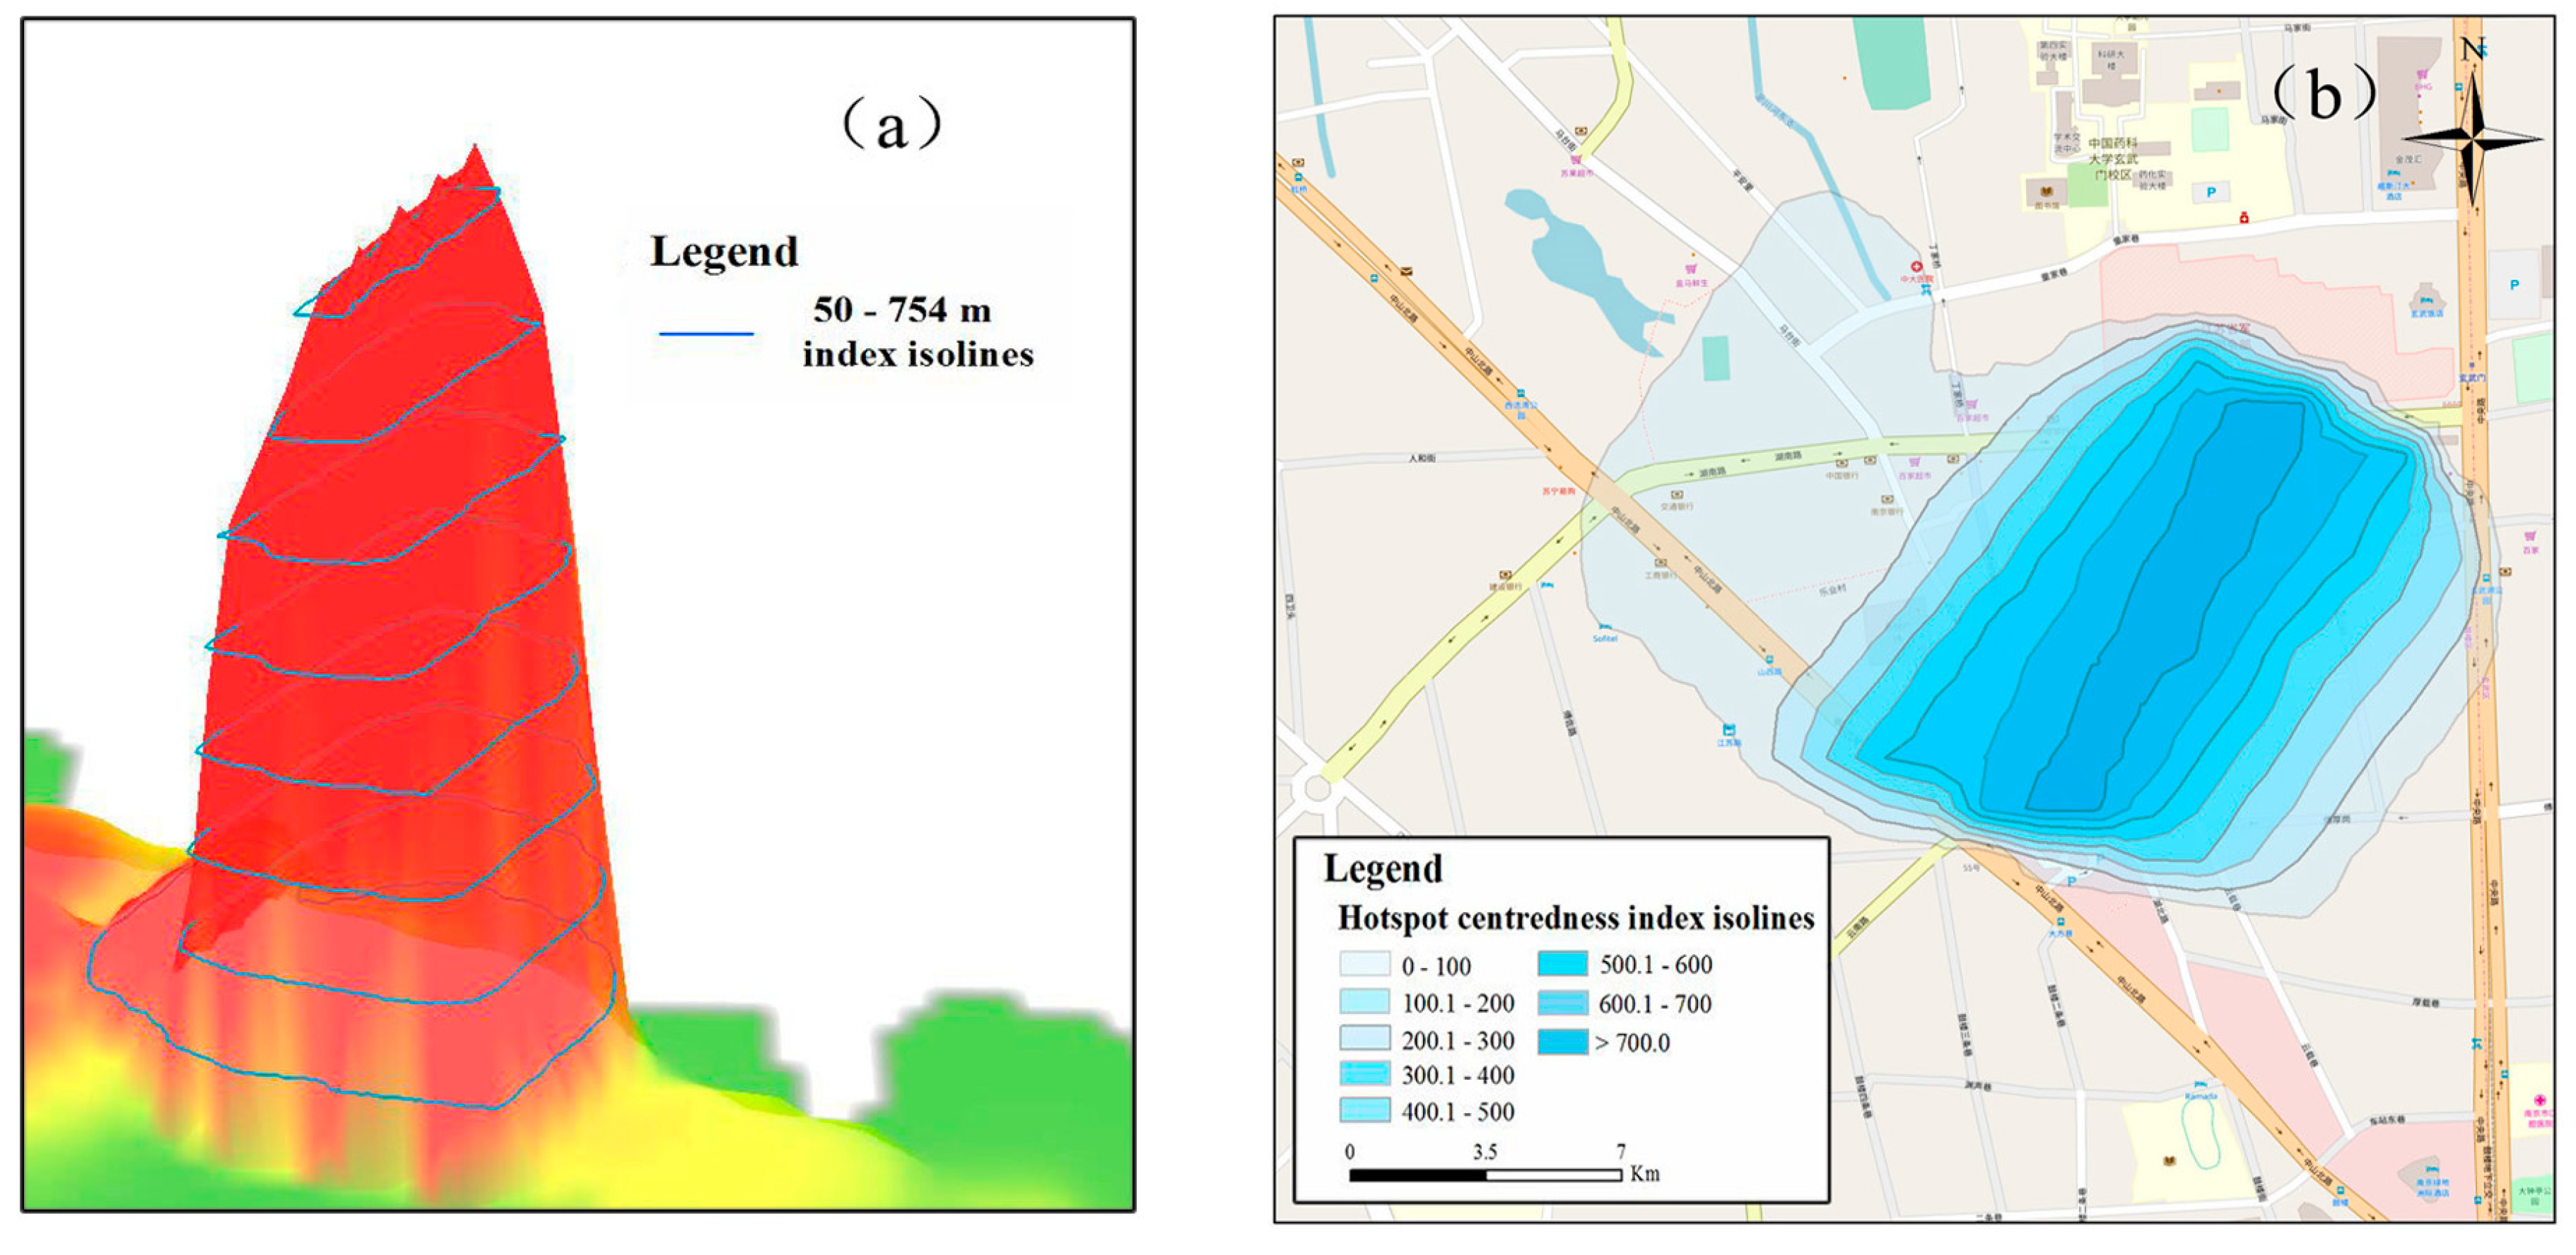
6.2. Delimitation of the Hotspot Centredness Surfaces Using an Isoline Model
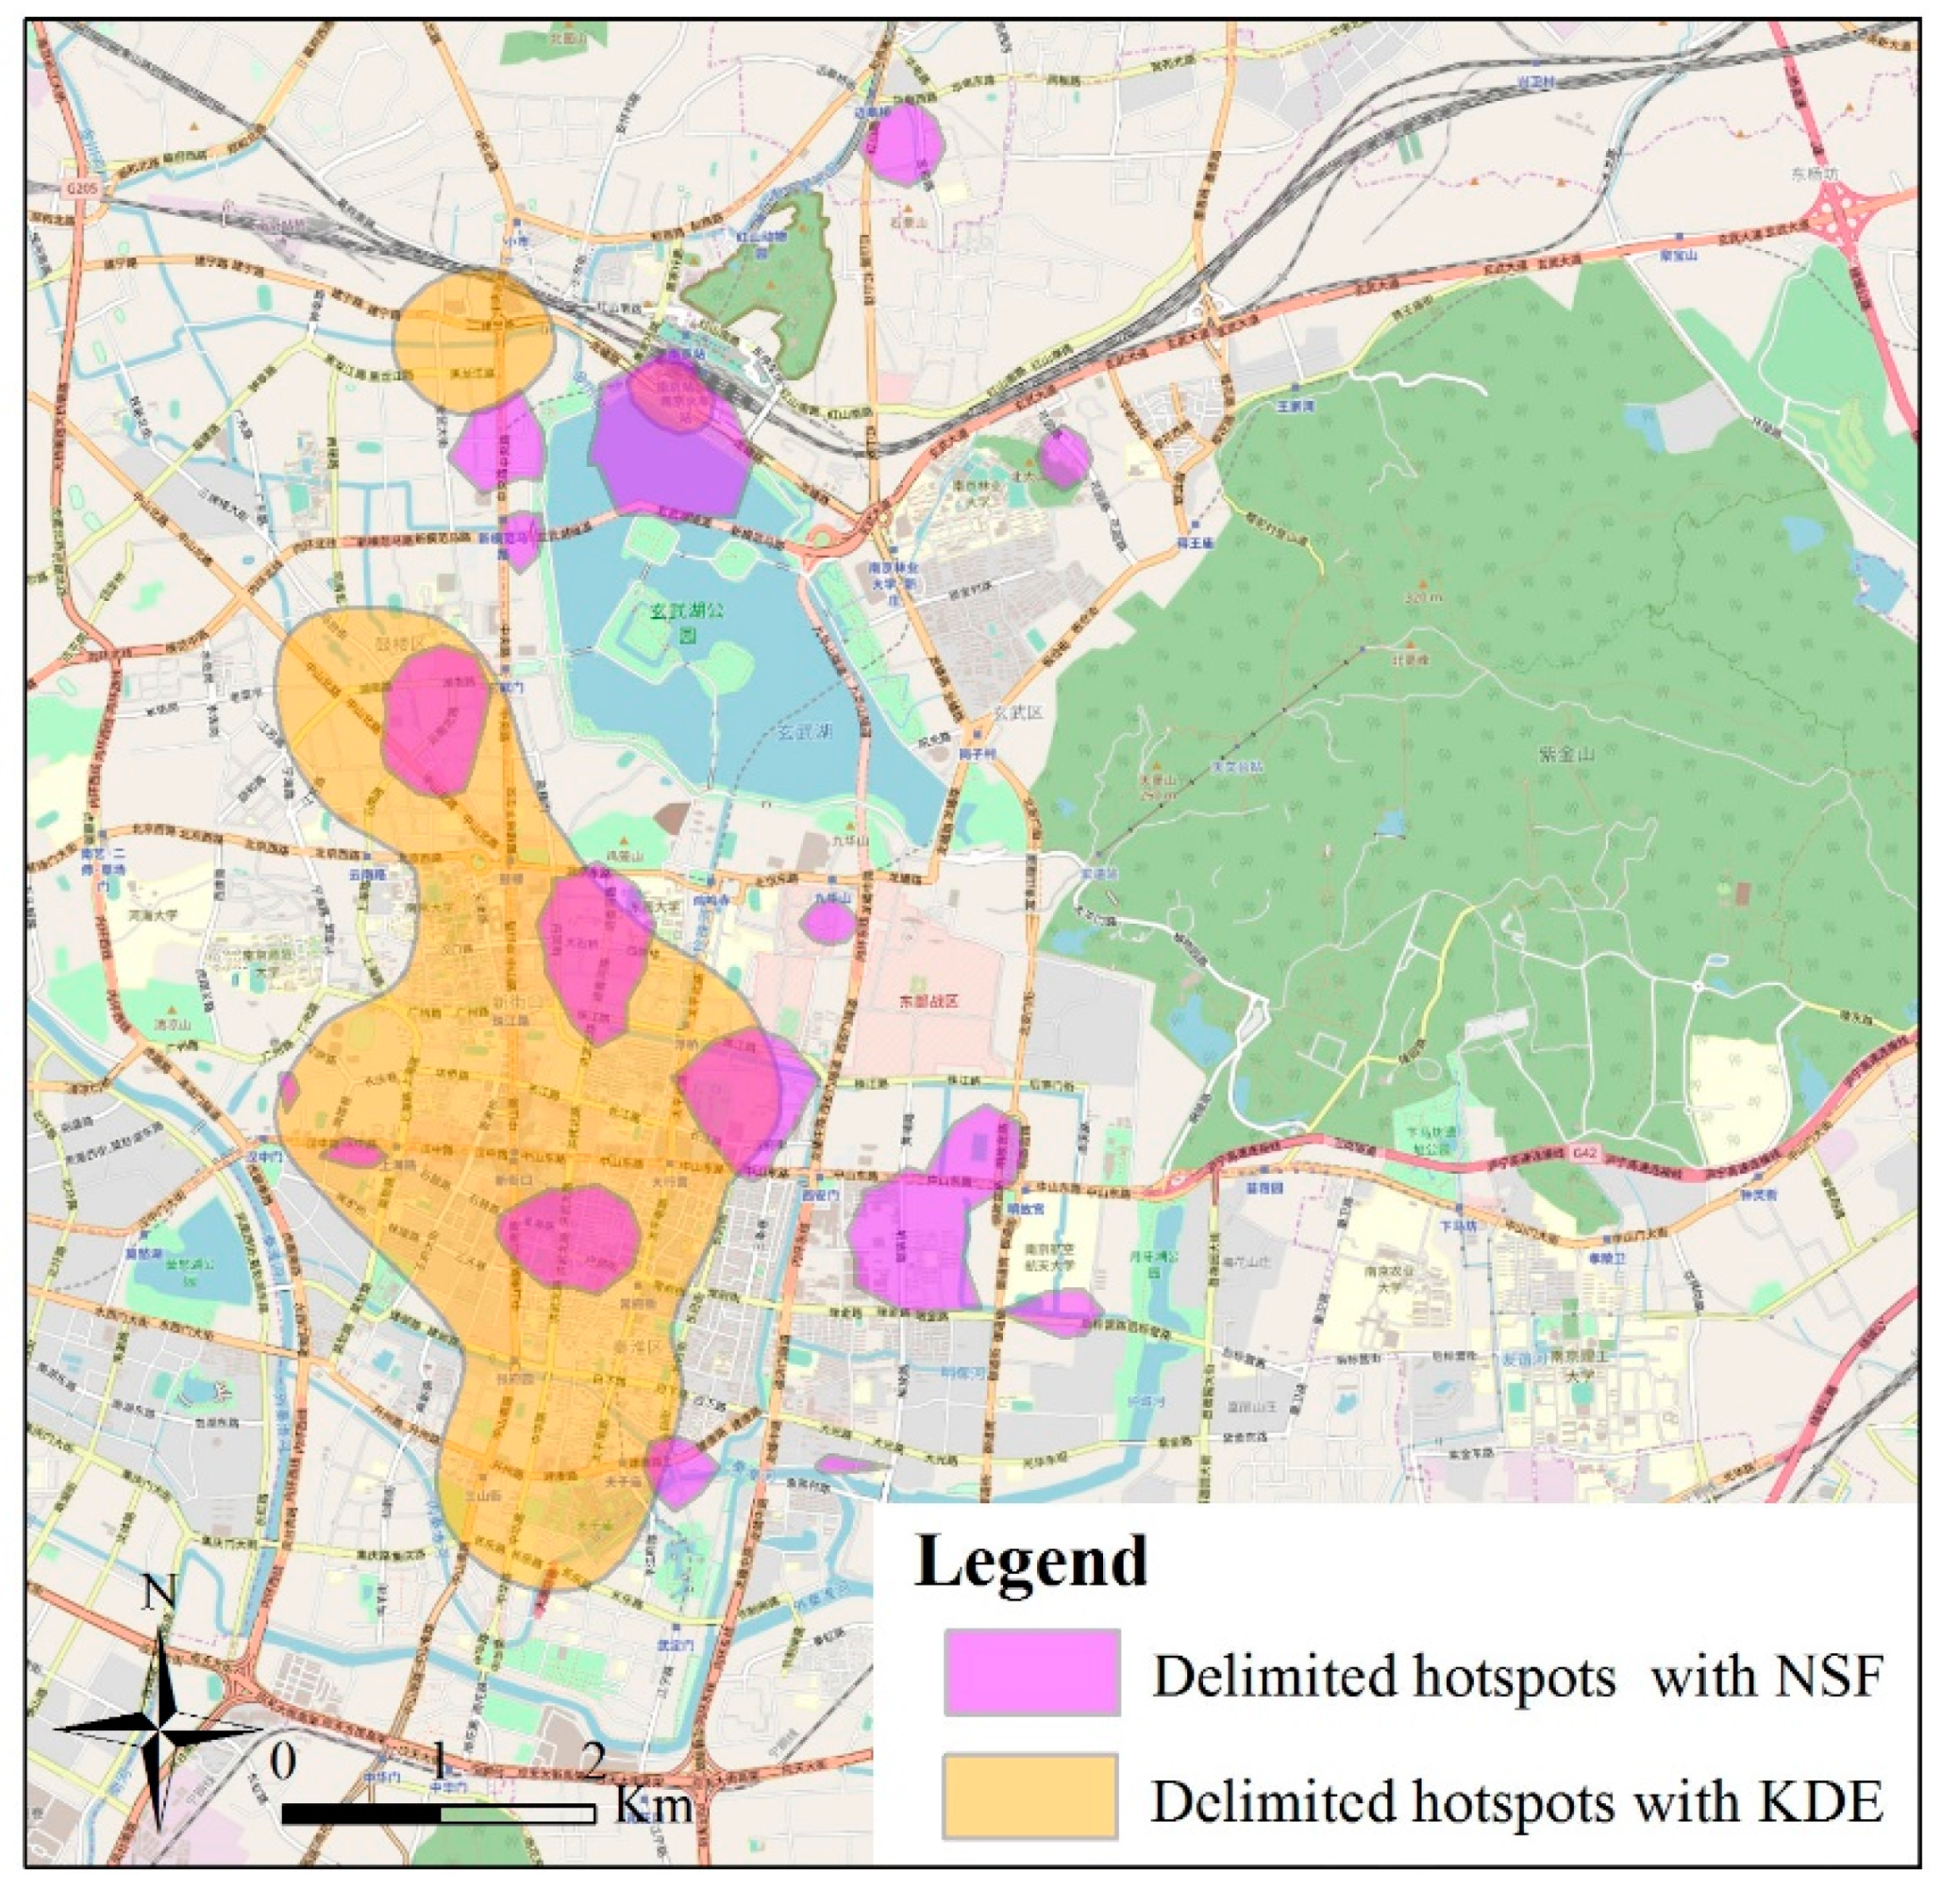
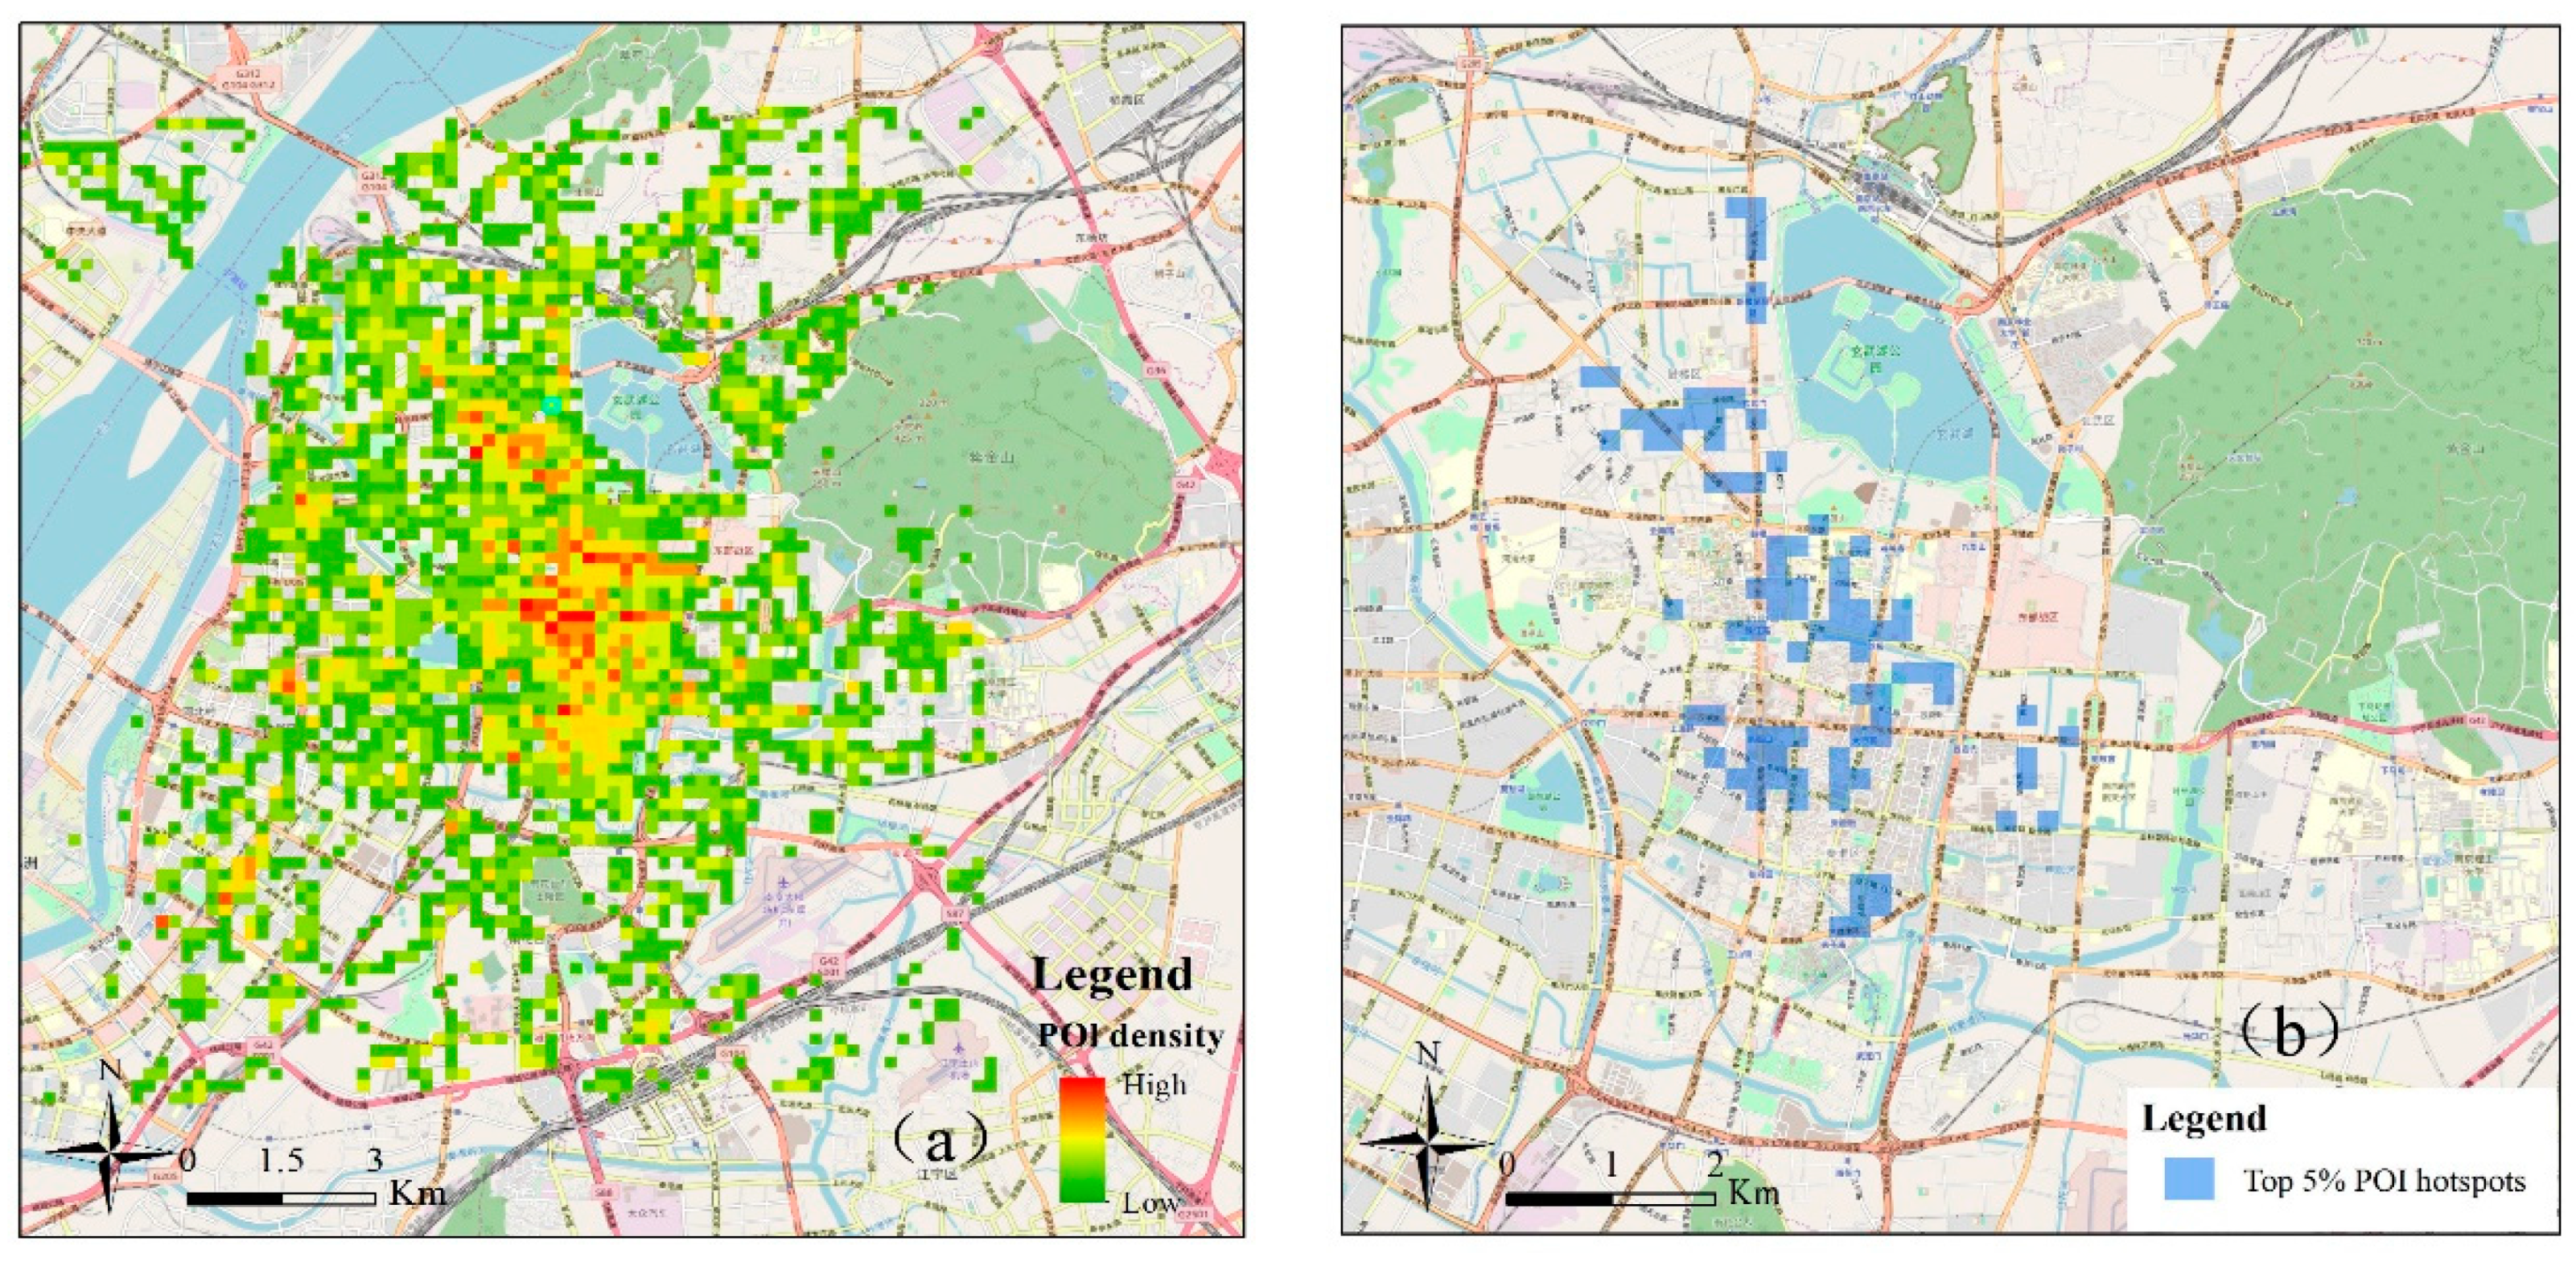
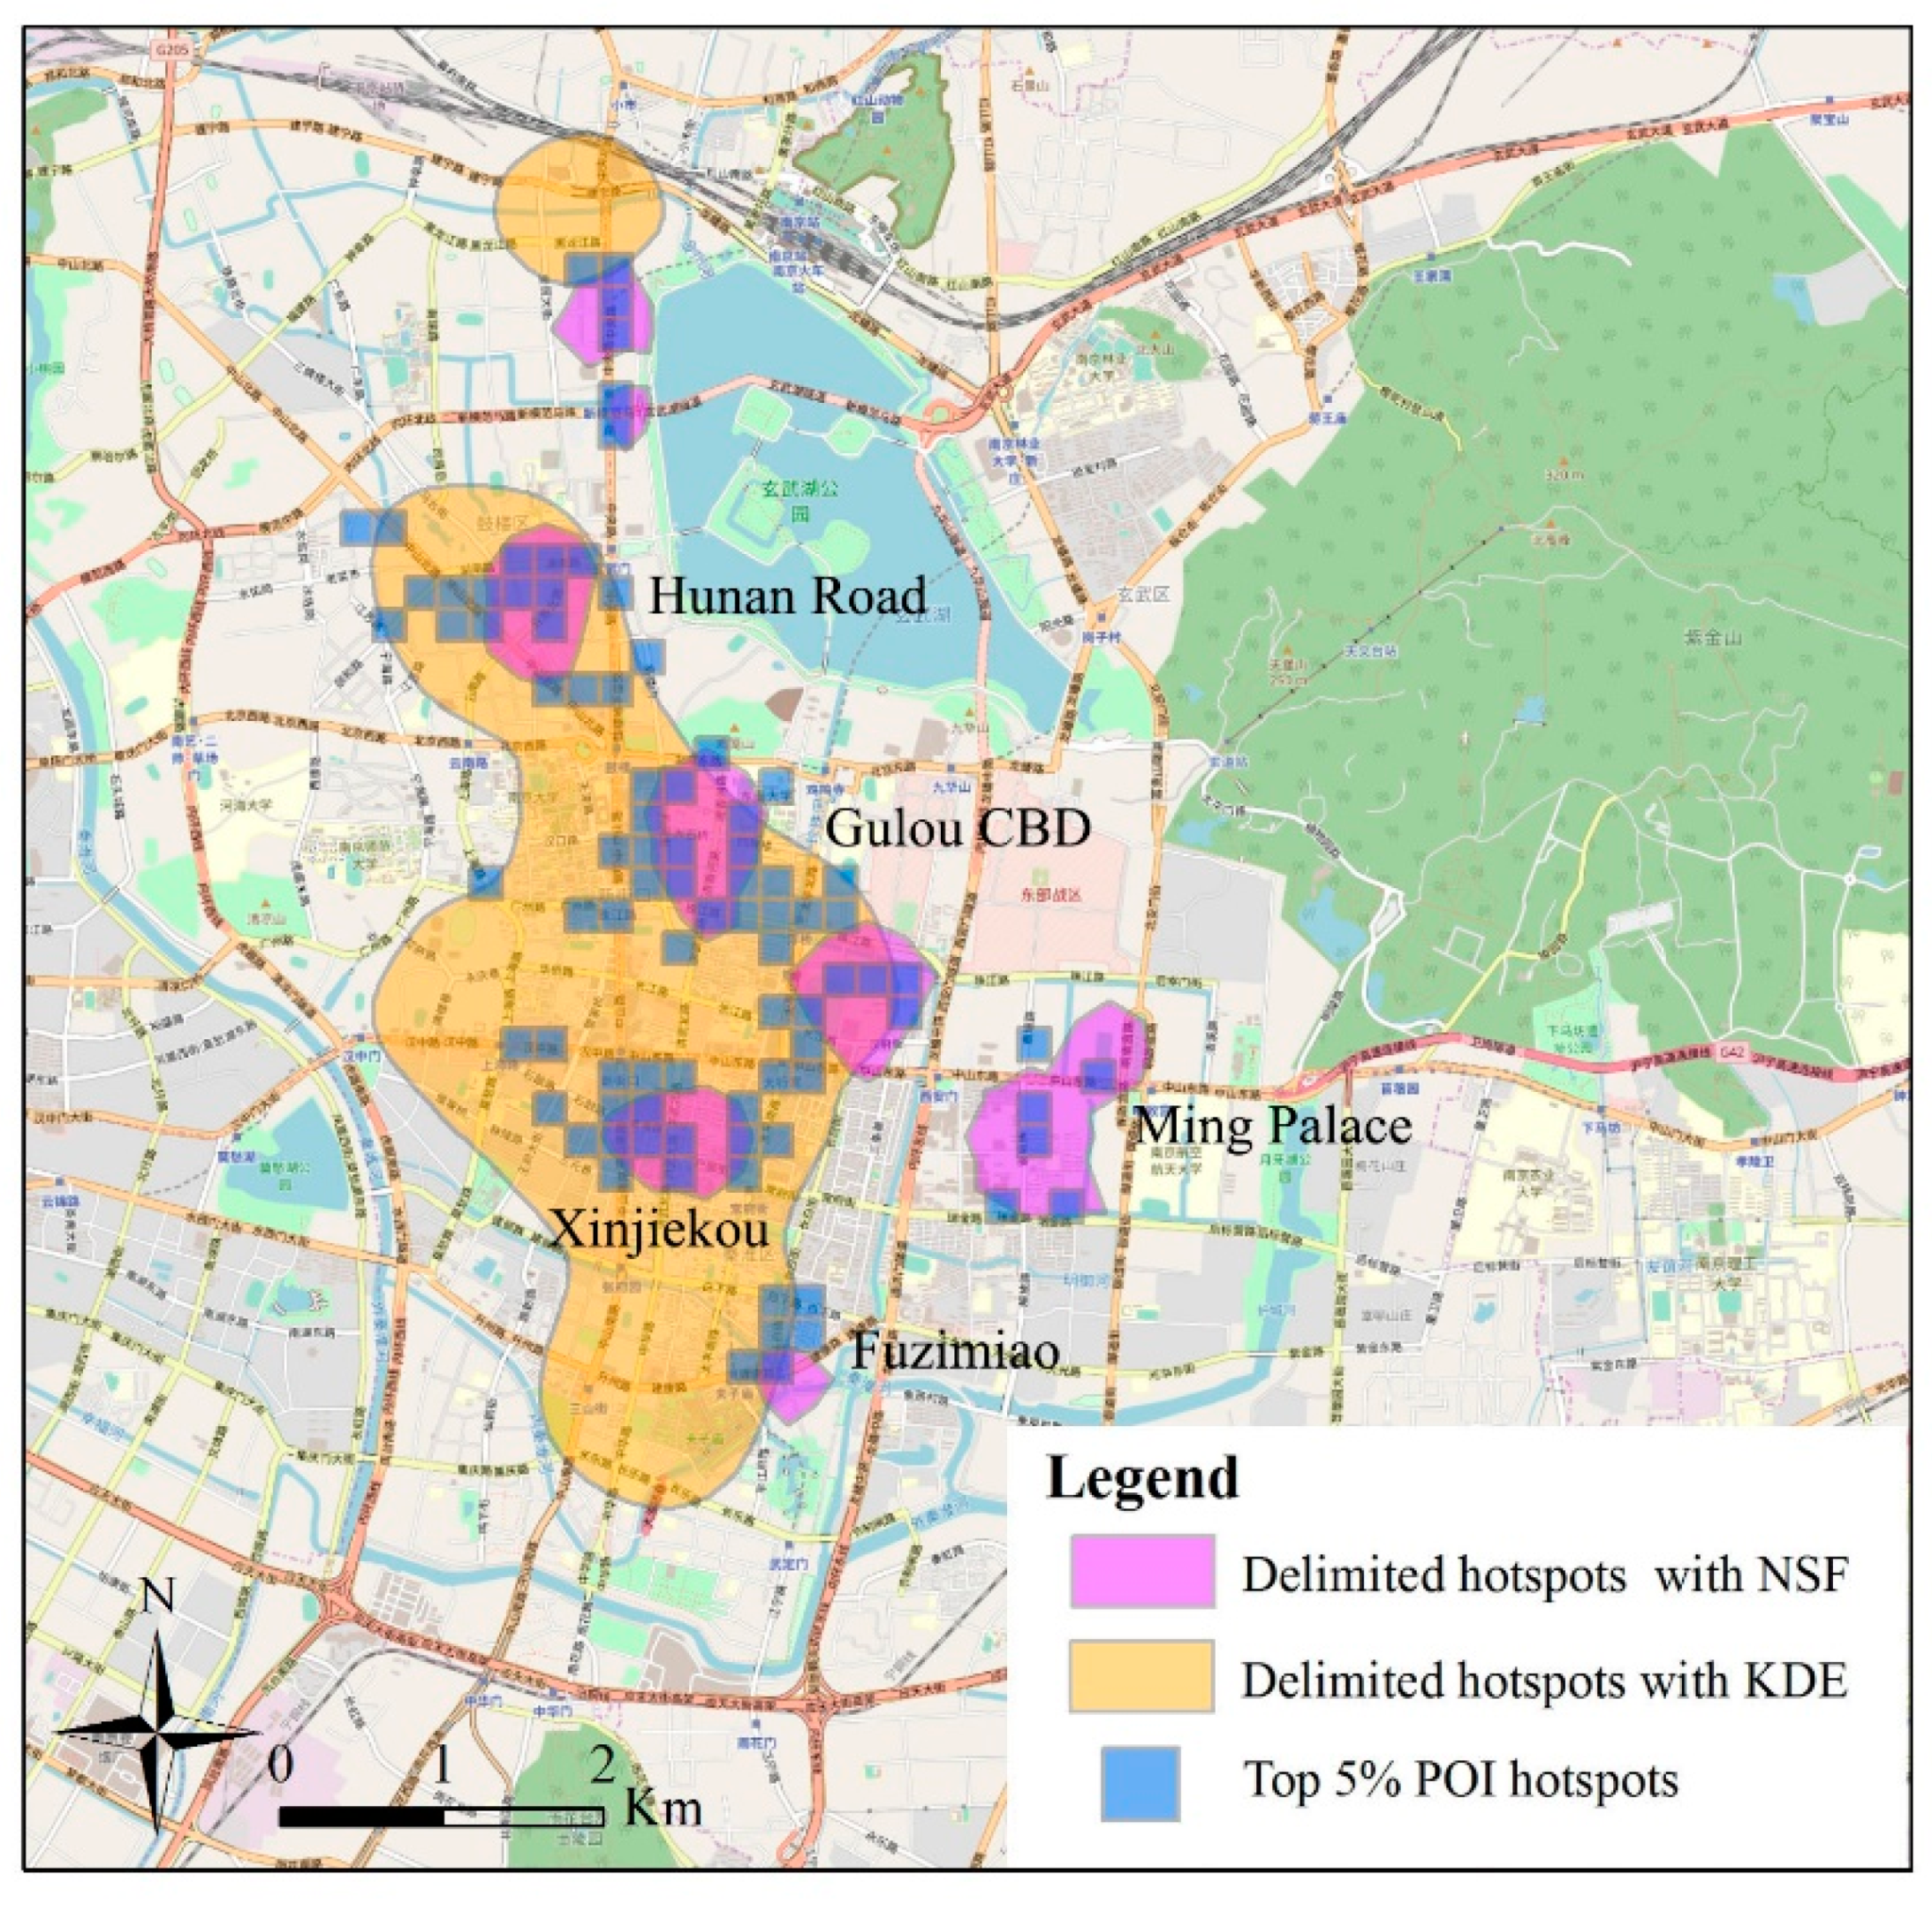
6.3. Validation of the Proposed Method
7. Conclusions
Author Contributions
Funding
Acknowledgments
Conflicts of Interest
References
- Zheng, Y.; Zhang, L.Z.; Xie, X. Mining interesting locations and travel sequences from GPS trajectories. In Proceedings of the 18th International Conference on World Wide Web, Madrid, Spain, 20–24 April 2009; pp. 791–800. [Google Scholar]
- Zhao, P.; Qin, K.; Ye, X.; Wang, Y.A. trajectory clustering approach based on decision graph and data field for detecting hotspots. Int. J. Geogr. Inf. Sci. 2017, 31, 1–27. [Google Scholar] [CrossRef]
- Ahas, R.; Aasa, A.; Silm, S.; Tiru, M. Daily rhythms of suburban commuters’ movements in the Tallinn metropolitan area: Case study with mobile positioning data. Transp. Res. Part C Emerg. Technol. 2010, 18, 45–54. [Google Scholar] [CrossRef]
- Mao, F.; Minhe, J.I.; Liu, T. Mining spatiotemporal patterns of urban dwellers from taxi trajectory data. Front. Earth Sci. 2016, 10, 205–221. [Google Scholar] [CrossRef]
- Zhao, P.; Liu, X.; Shen, J.; Ming, C. A Network Distance and Graph-Partitioning-Based Clustering Method for Improving the Accuracy of Urban Hotspot Detection. Geocarto Int. 2017, 3, 1–34. [Google Scholar] [CrossRef]
- Agryzkov, T.; Tortosa, L.; Vicent, J.F. New highlights and a new centrality measure based on the adapted pagerank algorithm for urban networks. Appl. Math. Comput. 2016, 291, 14–29. [Google Scholar] [CrossRef]
- Agryzkov, T.; Oliver, J.L.; Tortosa, L.; Vicent, J.F. An algorithm for ranking the nodes of an urban network based on the concept of pagerank vector. Appl. Math. Comput. 2012, 219, 2186–2193. [Google Scholar] [CrossRef]
- Agryzkov, T.; Oliver, J.L.; Tortosa, L.; Vicent, J. A new betweenness centrality measure based on an algorithm for ranking the nodes of a network. Appl. Math. Comput. 2014, 244, 467–478. [Google Scholar] [CrossRef]
- Yue, Y.; Zhuang, Y.; Li, Q.; Mao, Q. Mining Time-dependent Attractive Areas and Movement Patterns from Taxi Trajectory Data. In Proceedings of the 2009 International Conference on Geoinformatics, Fairfax, VA, USA, 12–14 August 2009; pp. 1–6. [Google Scholar]
- Chang, H.W.; Tai, Y.C.; Hsu, J.Y.J. Context-aware taxi demand hotspots prediction. Int. J. Bus. Intell. Data Min. 2010, 5, 3–18. [Google Scholar] [CrossRef]
- Tung, A.K.H.; Hou, J.; Jiawei, H. Spatial clustering in the presence of obstacles. In Proceedings of the 17th International Conference on Data Engineering, Heidelberg, Germany, 2–6 April 2001; pp. 359–367. [Google Scholar]
- Hollenstein, L.; Purves, R. Exploring place through user-generated content: Using Flickr tags to describe city cores. J. Spat. Inf. Sci. 2010, 1, 21–48. [Google Scholar]
- Li, B.; Zhang, D.; Sun, L.; Chen, C.; Li, S.; Qi, G.; Yang, Q. Hunting or waiting? Discovering passenger-finding strategies from a large-scale real-world taxi dataset. In Proceedings of the IEEE International Conference on Pervasive Computing and Communications Workshops (PERCOM Workshops), Seattle, WA, USA, 21–25 March 2011; pp. 63–68. [Google Scholar]
- Shen, Y.; Zhao, L.; Fan, J. Analysis and visualization for hot spot based route recommendation using short-dated taxi GPS traces. Information 2015, 6, 134–151. [Google Scholar] [CrossRef]
- Pei, T.; Wang, W.; Zhang, H.; Ma, T.; Du, Y.; Zhou, C. Density-based clustering for data containing two types of points. Int. J. Geogr. Inf. Sci. 2015, 29, 175–193. [Google Scholar] [CrossRef]
- Okabe, A.; Satoh, T.; Sugihara, K. A kernel density estimation method for networks, its computational method and a GIS-based tool. Int. J. Geogr. Inf. Sci. 2009, 23, 7–32. [Google Scholar] [CrossRef]
- Rui, Y.; Yang, Z.; Qian, T.; Khalid, S.; Xia, N.; Wang, J. Network-constrained and category-based point pattern analysis for Suguo retail stores in Nanjing, China. Int. J. Geogr. Inf. Sci. 2006, 30, 186–199. [Google Scholar] [CrossRef]
- Tang, L.; Kan, Z.; Zhang, X.; Sun, F.; Yang, X.; Li, Q. A network Kernel Density Estimation for linear features in space–time analysis of big trace data. Int. J. Geogr. Inf. Sci. 2016, 30, 1717–1737. [Google Scholar] [CrossRef]
- Pang, J.; Huang, J.; Yang, X.; Wang, Z.; Yu, H.; Huang, Q.; Yin, B. Discovering Fine-Grained Spatial Pattern From Taxi Trips: Where Point Process Meets Matrix Decomposition and Factorization. IEEE Trans. Intell. Trans. Syst. 2017, 19, 3208–3219. [Google Scholar] [CrossRef]
- Werabhat, M.; Santi, P.; Merkebe, G.D.; Lina, K.; Marco, B.; Carlo, R. Constructing time-dependent origin-destination matrices with adaptive zoning scheme and measuring their similarities with taxi trajectory data. IEEE Access 2019, 7, 77723–77737. [Google Scholar]
- Li, D.; Du, Y. Artificial Intelligent with Uncertainty; Chapman and Hall, CRC: Boca Raton, FL, USA, 2007. [Google Scholar]
- Wang, S.; Gan, W.; Li, D.; Li, D. Data Field for Hierarchical Clustering. Int. J. Data. Warehous. 2011, 7, 43–63. [Google Scholar] [CrossRef] [Green Version]
- Wu, T.; Qin, K. Image data field for homogeneous region based segmentation. Comput. Electr. Eng. 2012, 38, 459–470. [Google Scholar] [CrossRef]
- Li, D.; Wang, S.; Yuan, H.; Li, D. Software and applications of spatial data mining. Wiley Interdiscip. Rev. Data Min. Knowl. Discov. 2016, 6, 84–114. [Google Scholar] [CrossRef]
- Li, C.; Ding, G.; Wang, D.; Li, Y.; Wang, S. Clustering by fast search and find of density peaks with data field. Chin. J. Electron. 2016, 25, 397–402. [Google Scholar]
- Hug, D.; Reitzner, M. Gaussian polytopes: Variances and limit theorems. Adv. Appl. Probab. 2005, 37, 297–320. [Google Scholar] [CrossRef]
- Jian, B.T.; Ning, S.; Zhao, Q.S. A study of the method for classification of remote sensing images based on data field cluster. Remote Sens. Land Resour. 2008, 20, 20–23. (In Chinese) [Google Scholar]
- Liu, Y.; Jin, J.; Zhang, Y.; Xu, C. A new clustering algorithm based on data field in complex networks. J. Supercomput. 2008, 67, 20–23. [Google Scholar] [CrossRef]
- Downs, J.A.; Horner, M.W.; Hyzer, G.; Lamb, D.; Loraamm, R. Voxel-based probabilistic space–time prisms for analysing animal movements and habitat use. Int. J. Geograph. Inf. Sci. 2014, 28, 875–890. [Google Scholar] [CrossRef]
- Wardlaw, R.L.; Frohlich, C.; Davis, S.D. Evaluation of precursory seismic quiescence in sixteen subduction zones using single-link cluster analysis. Pure Appl. Geophys. 1990, 134, 57–78. [Google Scholar] [CrossRef]
- Qin, K.; Zhou, Q.; Wu, T.; Xu, Y.Q. Hotspots detection from trajectory data based on spatiotemporal data field clustering. In Proceedings of the ISPRS—International Archives of the Photogrammetry, Remote Sensing and Spatial Information Sciences, XLII-2/W7, Wuhan, China, 1–5 October 2017; pp. 1319–1325. [Google Scholar]
- Kun, Q.I.N.; Qing, Z.H.O.U.; Yuanquan, X.U.; Wenting, X.U.; Ping, L.U.O. Spatial interaction network analysis of urban traffic hotspots. Prog. Geogr. 2017, 36, 1149–1157. (In Chinese) [Google Scholar]
- Xie, Z.; Yan, J. Detecting traffic accident clusters with network kernel density estimation and local spatial statistics: An integrated approach. J. Transp. Geogr. 2013, 31, 64–71. [Google Scholar] [CrossRef]
- Yamada, I.; Thill, J.C. Local Indicators of Network-Constrained Clusters in Spatial Patterns Represented by a Link Attribute. Ann. Assoc. Am. Geogr. 2010, 100, 574–594. [Google Scholar] [CrossRef]
- Miller, H.J.; Wentz, E.A. Representation and Spatial Analysis in Geographic Information Systems. Ann. Assoc. Am. Geogr. 2003, 93, 574–594. [Google Scholar] [CrossRef]
- Borruso, G. Network density estimation: A gis approach for analysing point patterns in a network space. Trans. GIS 2008, 12, 377–402. [Google Scholar] [CrossRef]
- Loo, B.P.Y.; Yao, S. The identification of traffic crash hot zones under the link-attribute and event-based approaches in a network-constrained environment. Comput. Environ. Urb. Syst. 2013, 41, 249–261. [Google Scholar] [CrossRef]
- Nie, K.; Du, Q.; Ren, F.; Tian, Q. A network-constrained integrated method for detecting spatial cluster and risk location of traffic crash: A case study from Wuhan, China. Sustainability 2015, 7, 2662–2677. [Google Scholar] [CrossRef]
- Yu, W.; Ai, T. The visualization and analysis of urban facility POIs using network kernel density estimation constrained by multi-factors. Bol. Cienc. Geodesicas 2014, 20, 902–926. [Google Scholar] [CrossRef]
- Shiode, S. Street-level spatial scan statistic and STAC for analyzing street crime concentrations. Trans. GIS 2011, 15, 365–383. [Google Scholar] [CrossRef]
- Shiode, S. Revisiting John Snow’s map: Network-based spatial demarcation of cholera area. Int. J. Geogr. Inf. Sci. 2012, 26, 133–150. [Google Scholar] [CrossRef]
- Yu, W.; Ai, T.; He, Y.; Shao, S. Spatial co-location pattern mining offacility Points-of-Interest improved by network neighbourhood and distance decay effects. Int. J. Geogr. Inf. Sci. 2017, 31, 280–296. [Google Scholar] [CrossRef]
- Guo, D.; Zhu, X.; Jin, H.; Gao, P.; Andris, C. Discovering spatial patterns in origin-destination mobility data. Trans. GIS 2012, 16, 411–429. [Google Scholar] [CrossRef]
- Borruso, G.; Porceddu, A. A tale of two cities: Density analysis of CBD on two midsize urban areas in northeastern Italy. In Geocomputation and Urban Planning; Murgante, B., Borruso, G., Lapucci, A., Eds.; Springer: Berlin/Heidelberg, Germany, 2009; pp. 37–56. [Google Scholar]
- Yu, W.; Ai, T.; Shao, S. The analysis and delimitateation of Central Business District using network kernel density estimation. J. Transp. Geogr. 2015, 45, 32–47. [Google Scholar] [CrossRef]
- He, Q.; He, W.; Song, Y.; Wu, J.; Yin, C.; Mou, Y. The impact of urban growth patterns on urban vitality in newly built-up areas based on an association rules analysis using geographical ‘big data’. Land Use Policy 2018, 78, 726–738. [Google Scholar] [CrossRef]
- Jia, R.; Khadka, A.; Kim, I. Traffic crash analysis with point-of-interest spatial clustering. Acc. Anal. Pre. 2018, 121, 223–230. [Google Scholar] [CrossRef]
- Filipe, B.E.S.; Gallego, J.; Lavalle, C. A high-resolution population grid map for Europe. J. Maps 2013, 9, 16–28. [Google Scholar]
- Astrudmaantay, J.; Maroko, A.R.; Christopher, H. Mapping Population Distribution in the Urban Environment: The Cadastral-based Expert Dasymetric System (CEDS). Am. Cartogr. 2007, 34, 77–102. [Google Scholar]


| Statistics | NSF | KDE |
|---|---|---|
| Delimitated hotspot area (km2) | 4.097 | 11.982 |
| Identical hotspot area (km2) | 2.426 | 3.864 |
| Precision (%) | 59.21 | 32.24 |
© 2019 by the authors. Licensee MDPI, Basel, Switzerland. This article is an open access article distributed under the terms and conditions of the Creative Commons Attribution (CC BY) license (http://creativecommons.org/licenses/by/4.0/).
Share and Cite
Xia, Z.; Li, H.; Chen, Y.; Liao, W. Identify and Delimitate Urban Hotspot Areas Using a Network-Based Spatiotemporal Field Clustering Method. ISPRS Int. J. Geo-Inf. 2019, 8, 344. https://0-doi-org.brum.beds.ac.uk/10.3390/ijgi8080344
Xia Z, Li H, Chen Y, Liao W. Identify and Delimitate Urban Hotspot Areas Using a Network-Based Spatiotemporal Field Clustering Method. ISPRS International Journal of Geo-Information. 2019; 8(8):344. https://0-doi-org.brum.beds.ac.uk/10.3390/ijgi8080344
Chicago/Turabian StyleXia, Zelong, Hao Li, Yuehong Chen, and Weisheng Liao. 2019. "Identify and Delimitate Urban Hotspot Areas Using a Network-Based Spatiotemporal Field Clustering Method" ISPRS International Journal of Geo-Information 8, no. 8: 344. https://0-doi-org.brum.beds.ac.uk/10.3390/ijgi8080344