1. Introduction
Opencast mining is a type of human activity, which influences all elements of the natural environment. Building an open-pit mine introduces massive transformations in the lithosphere, atmosphere, hydrosphere, pedosphere and biosphere [
1]. In addition, opencast mining has impacts on socio-economic components of the environment. The authors here have attempted to present the changes caused by the construction and operation of the Bełchatów Coal Mine—Poland’s largest, and one of Europe’s larger, open-pit mines. The choice of the studied area was not random, as the area related to the operation of the Bełchatów Coal Mine and Power Plant is a place where the amount of changes introduced to the geographic environment, and particularly the lithosphere, was unprecedented in Poland. Since the discovery of the deposit in 1960 and the commencement of excavations in 1975, the environs of Bełchatów have become the focus of research for scientists of all fields. The initial works concerned planning, and attempted to predict the direction of environmental changes which this investment was to introduce [
2]. The geological literature is also particularly rich, which originally concerned boreholes [
3], and led to the analysis of outcrop sediments and structures [
4], as well as hydrological observations [
5].
A superficial analysis of cartographic materials reveals that anthropogenic transformations occurred in three variants. First, pits were created by removing layers of the Quaternary surface, as was the case with the “Bełchatów” pit, and later the “Szczerców” pit, and technological reservoirs. The second variant of transformations was the creation of new convex forms, using mostly the material collected while excavating pits, which forms the dumping grounds. The third variant was the leveling of the topography [
6]. Such a need arose during the construction of the power plant, where a large amount of buildings and equipment had to be erected. This case is similar to the division proposed by David Lorant [
7] into excavated forms, referring to surfaces characterized by reduced quantity of material in comparison with the original state, and accumulated forms, characterized by excess material. On the basis of geotechnical criteria, an additional group was distinguished, including forms destroyed by mining works, resulting in leveling of the surface.
The literature includes examples of similar studies related to an open-pit coal mine in the Patratu Region in India, based on the analysis of DEMs relying on stereographic satellite photographs from previous years [
8]. The prepared models illustrated the topography transformations in the analyzed area, resulting from human reliefogenic activity. Similar research subjects were undertaken [
9] in order to present terrain models from the open-pit coal exploitation area in Fushun. This study, however, was aimed at comparing the methods of model preparation, and not transformations related to mining activity. The topic of design and comparison of terrain models in areas of mining activity has also been present in scientific studies by [
10,
11], whereas the issue of differences between models of the same terrain, resulting from different input data, was dealt with by the following authors: [
12]. Subsidence of terrain above galleries of underground mines, as well as the problem of paludification and lake density in these areas, also with a comparison of terrain models from different periods, was the subject of research conducted in the Upper Silesian Industrial Region [
13]. In order to present the issue comprehensively, the authors of this study apply methods of comparative analysis of terrain models from the pre-investment period, prepared by them on the basis of historical maps and contemporary models obtained from the CODGiK (Main Centre of Geodetic and Cartographic Documentation) database.
2. Materials and Methods
In order to perform an analysis of the topography of a given area, an adequate set of data is required. Printed archival materials usually offer drawings of isohypses or isobaths. For digital iterations, Digital Surface Models can be prepared using various measurement techniques [
14]. The principal aim of this study is to create a dynamic Digital Elevation Model for the area of the Bełchatów Coal Mine. Two models were created, which present the state of the area in two periods. The first one presents the terrain from the pre-investment period. The second contains data of the terrain’s current state, which includes the creation of pits and other terrain transformations, resulting from the operation of the mine. Juxtaposing data from different time periods allows for the presentation of the scale and kind of anthropogenic changes introduced to the topography of the analyzed area. In addition, it provides the possibility to conduct geomorphologic analysis.
First of all, attention must be paid to the differences in defining the digital data which describe the morphometry. The most general term is Digital Elevation Model (DEM). According to the definition, it is a three-dimensional digital representation of the terrain surface, created from elevation data. To define the type of DEM more precisely, we can use two terms: Digital Surface Model (DSM), which is representing elevation of the Earth’s surface, including all natural and anthropogenic land cover elements, while Digital Terrain Model (DTM) represents the elevation associated with the topography of the Earth based on natural features, excluding all man-made elements [
14]. In DEM, a certain number of points, which represent real locations, are assigned three attributes defining their spatial location in the assumed co-ordinate system: longitude (usually marked as (x)), latitude (y), and elevation (z) [
15]. The points alone, however, do not provide clear presentation of surface topography. For this, an appropriate interpolation algorithm is used. It connects points of the same elevation values so that surfaces are created in each elevation range.
Before commencing work on a Digital Elevation Model, it was necessary to select materials with sufficient horizontal and vertical resolutions for the purposes of the analysis, and then to verify them. The selection of optimal data types depended on the assumptions and possibilities of the unit, which prepared the project. Of particular importance was the reconstruction of historical environmental changes, with old maps being the primary source of information. Their low precision and inconsistency of cartographic data was a disadvantage for using this type of materials. This results from a diversity of methods, measurement tools, as well as styles and marking conventions used for creating maps [
16]. Such factors as the required amount of time, work and financing, or the quality provided by the given source must be taken into account. Information can be obtained directly from field measurements, aerial and satellite imagery, and cartographic elaborations.
For this project, cartographic materials in the form of historical maps were used as a source of data. Such a solution is characterized by relatively low financial requirements, but on the down side, it involves much more work. It must be stated, however, that the quality of data obtained from this source is adequate to meet the assumptions of creating DEM for analyzed area [
17,
18]. In addition, it must be noted that when reconstructing historical topographies, archival maps are theright source, which allows for the collection of exhaustive data concerning the given area. This type of source provides numerical, accurate data collected in the field, directly from the person that was taking the measurements in the past. Access to various types of maps means that it is necessary to find and select sheets, which best correspond to the requirements of the given project.
After selecting the appropriate sheets, we proceeded to further data processing: Digitization of the map. The procedure consisted of three stages: scanning, calibration and vectorization [
19]. The first step is scanning the maps, which contain the analyzed terrain. It is best when the area is found on a single sheet, so that a large format scanner can process it in one go, avoiding inaccuracies when merging the maps.
3. Results
3.1. Constructing the Pre-Investment Model and the Historical Topography
In order to create the topography model of the areas related to the operation of the Bełchatów Coal Mine, the method of digitizing data included in historical maps was chosen. The first step was to select the appropriate map sheet, which contained the most suitable source data set for digitization. For this, a considerable amount of cartographic materials was analyzed. The following criteria were used in their evaluation:
Scale—owing to the need to analyze geomorphologic forms, the scale had to be as large as possible. The smallest usable scale was assumed to be 1:25,000.
Contour interval—the higher the density of contour lines, the higher the detail. Thus, the desired contour interval was as small as possible.
Charting time—due to the historical outline of the development of the coalmine, the charting had to be done before 1975. The map could not include any elements of the Bełchatów Coal Mine and Power Plant, whose construction started in that year.
No misrepresentations—some cartographic materials, despite fulfilling the above criteria, were rejected because of misrepresentations included in them, possibly for political reasons (strategic character of the location) [
20].
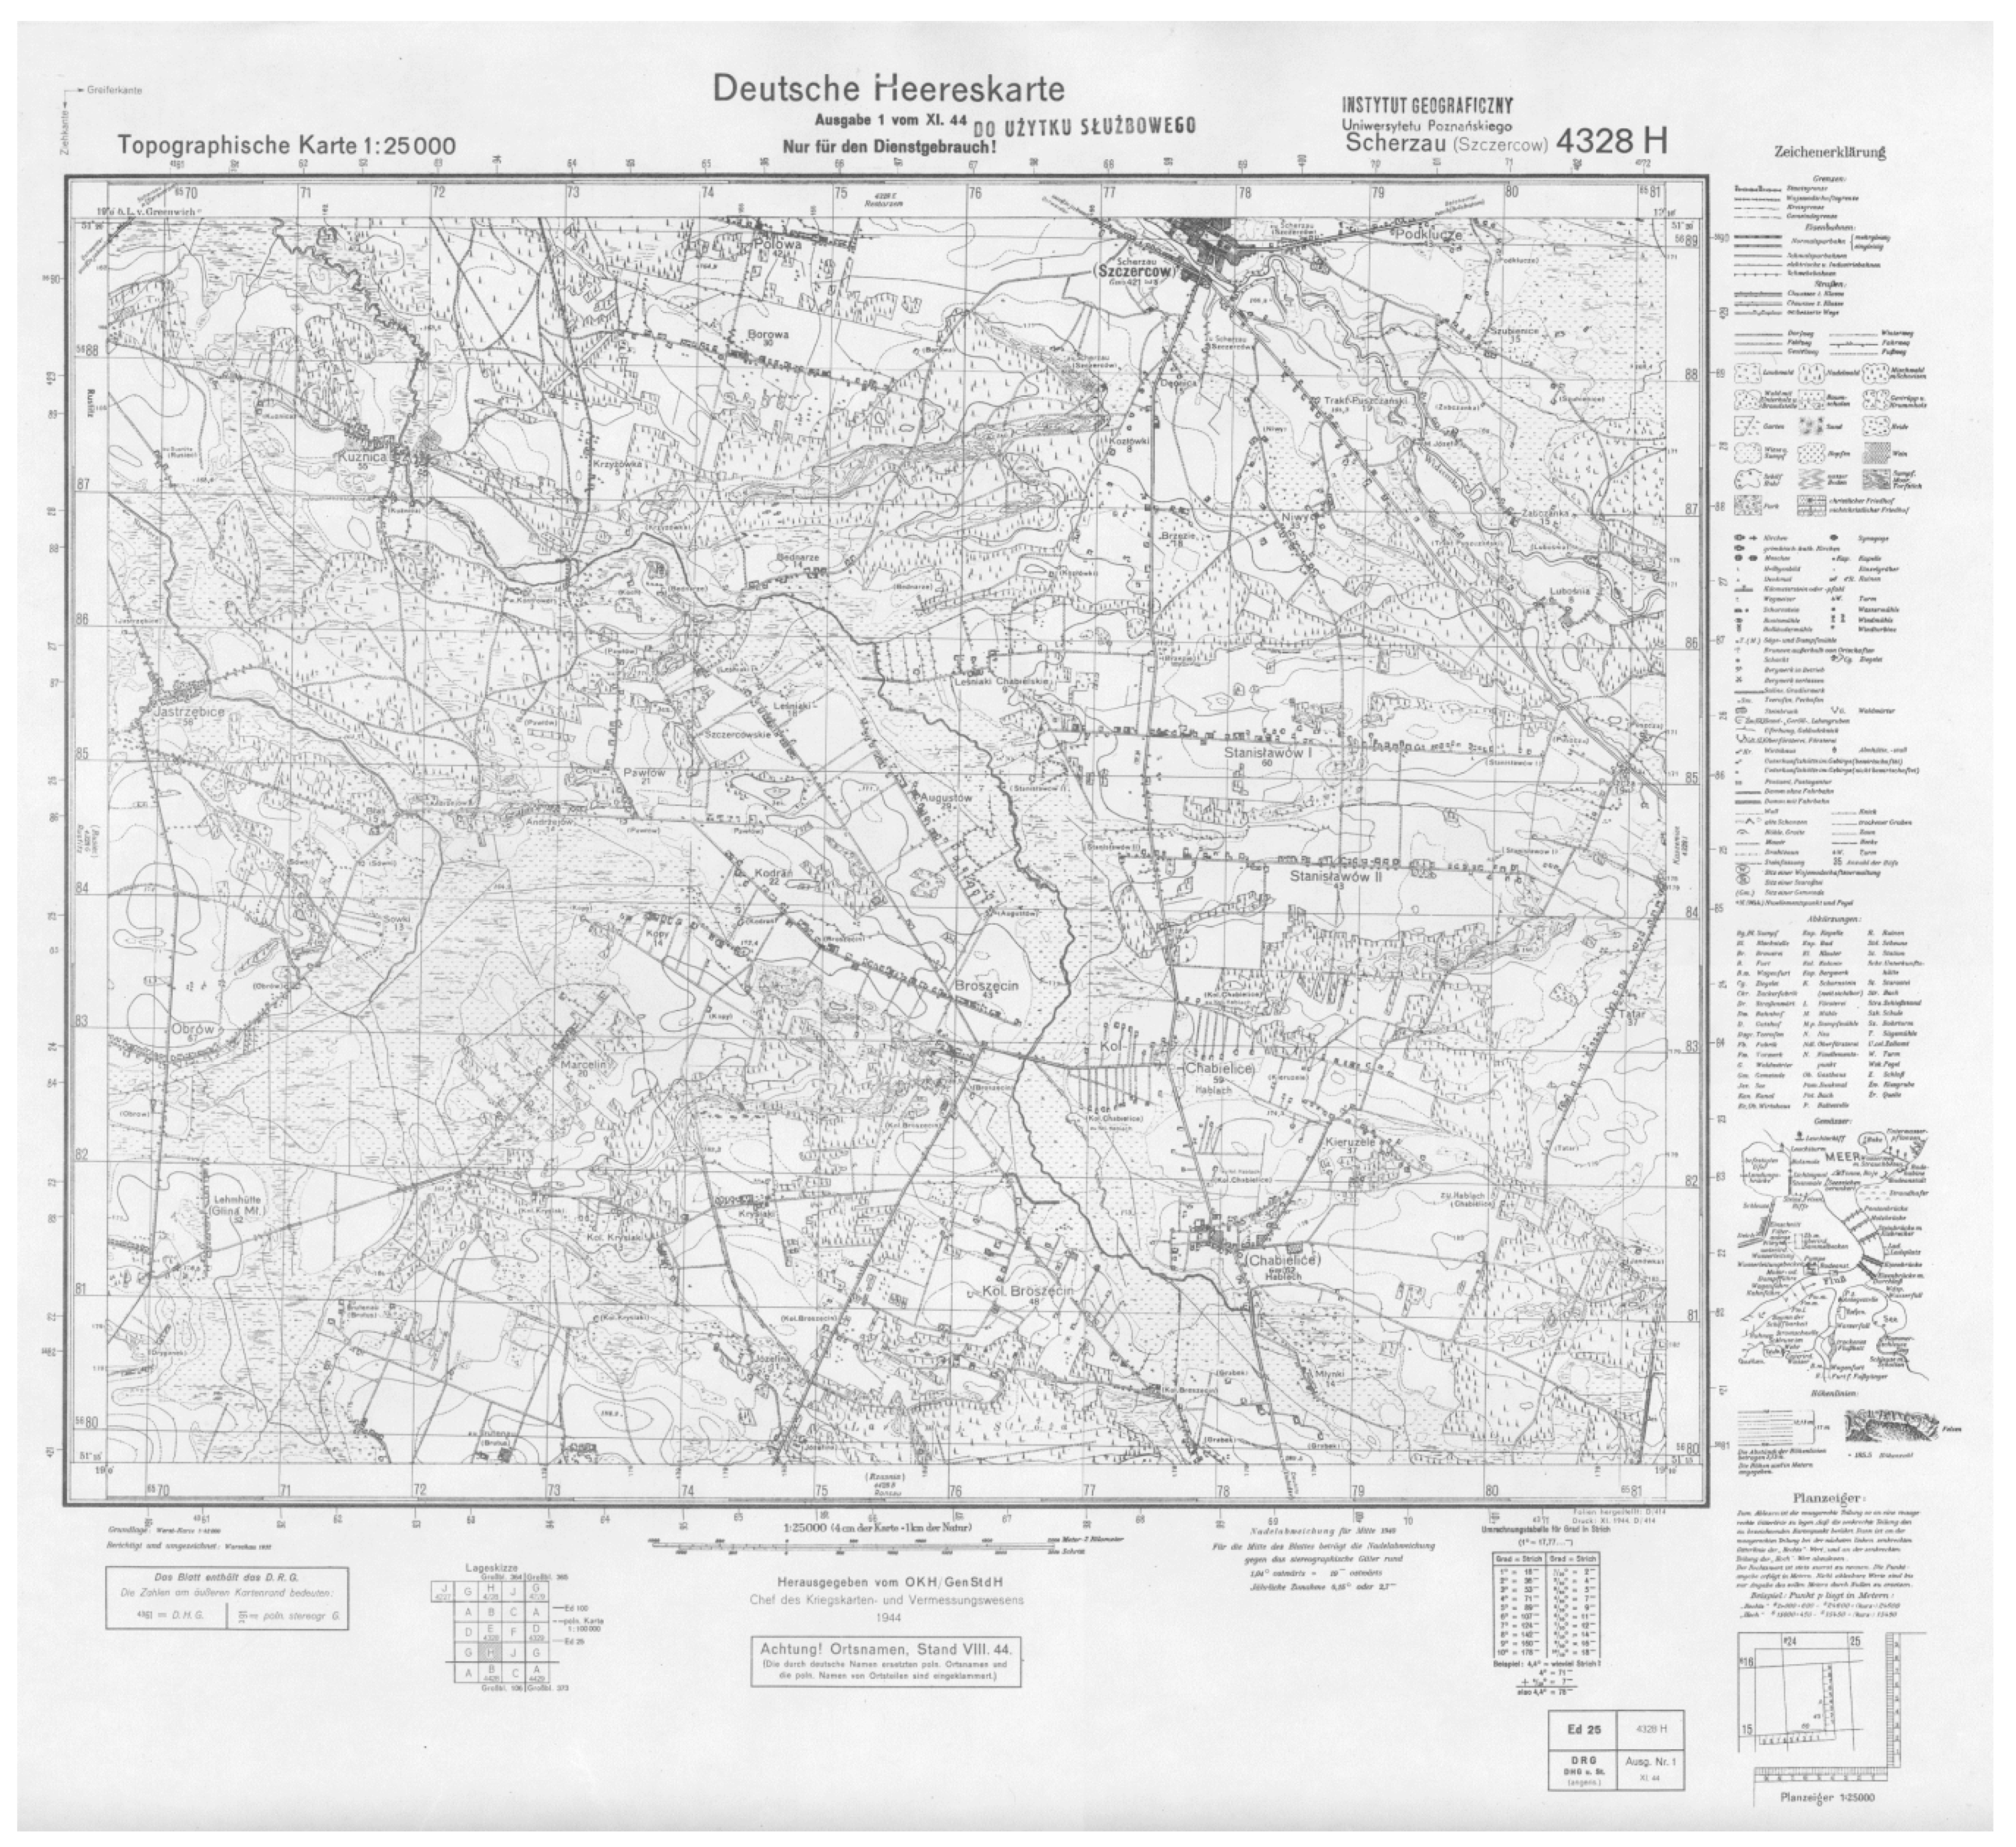
Having analyzed the available materials, six sheets were selected (all of them issued by the Supreme High Command of the German Army (Oberkommando des Heeres/Generalstab). These were charted in the years 1929–1939 by the Military Geographic Institute, and were finally published in 1944 in the German language. Polish names were preserved only for smaller towns and villages. The scale is 1:25,000. A non-standard contour interval of 2.13 m between auxiliary contour lines was used, which gives 17 m between primary isohypses.
The sheets listed above conformed to the project assumptions as regards the large scale of the maps and their contents. The charting years indicate that no construction works related to the mining and power facility had started in the analyzed area. In addition, the mapping precision guarantees the sufficient quality of the data, while containing no misrepresentations. An additional advantage was the availability of scanned sheets of good resolution (300 and 400 dpi, made available by the Cartographic Archive of the Faculty of Geographical Sciences of the AMU in Poznań). The fact that the entire analyzed area was spread across six sheets (Szczerców 4328 H Scherzau (
Figure 1); Rząśnia 4428 B Ronsau; Sulmierzyce 4428 C Sulmers; Wojciechów 4429 A Wojciechow; Kaszewice 4328 J Kaszewice; Łękawa 4329 G Lenkau) can be regarded as a drawback. The sheets required merging in a specialist graphics editor. After creating a base covering the entire study area, the image was calibrated. Georeferences were superimposed using a reference map—raster topographic map at a scale of 1:25,000, imported to the program using the WMS (Web Map Service) offered by polish national geoportal. About a dozen georeferenced points were placed at characteristic locations, such as crossroads or elevation points, of the same value on both maps. In order to perform adequate graphical conversion, the appropriate kind of geometric correction must be selected. For this, available transformation types were tested and the one generating the fewest errors and distortions was selected [
21]. After testing, the ‘adjust’ transformation was performed.
The next step was to vectorize the contour lines. This was done by creating a point layer with the use of editing tools. About 6000 points were indicated according to the same elevation attribute. Afterwards, the point layer was vector-converted to the raster image of the hypsometric map by interpolating point data and selecting the right color scale. When converting data to a raster image, creation of 20-m cells was forced, which resulted in a model with a single pixel corresponding to a square of side 20 m. (
Figure 2). Then, 30 points were selected with precisely defined elevation and location (geodetic reference points), and on this basis the vertical RMS (Root Mean Square) error was calculated using commonly available methodology and formulae [
22]. The error value was 1.05 m. This result is better in the analyzed case than that obtained using SAR (synthetic aperture radar) interferometry, which was 2.3 m [
10].
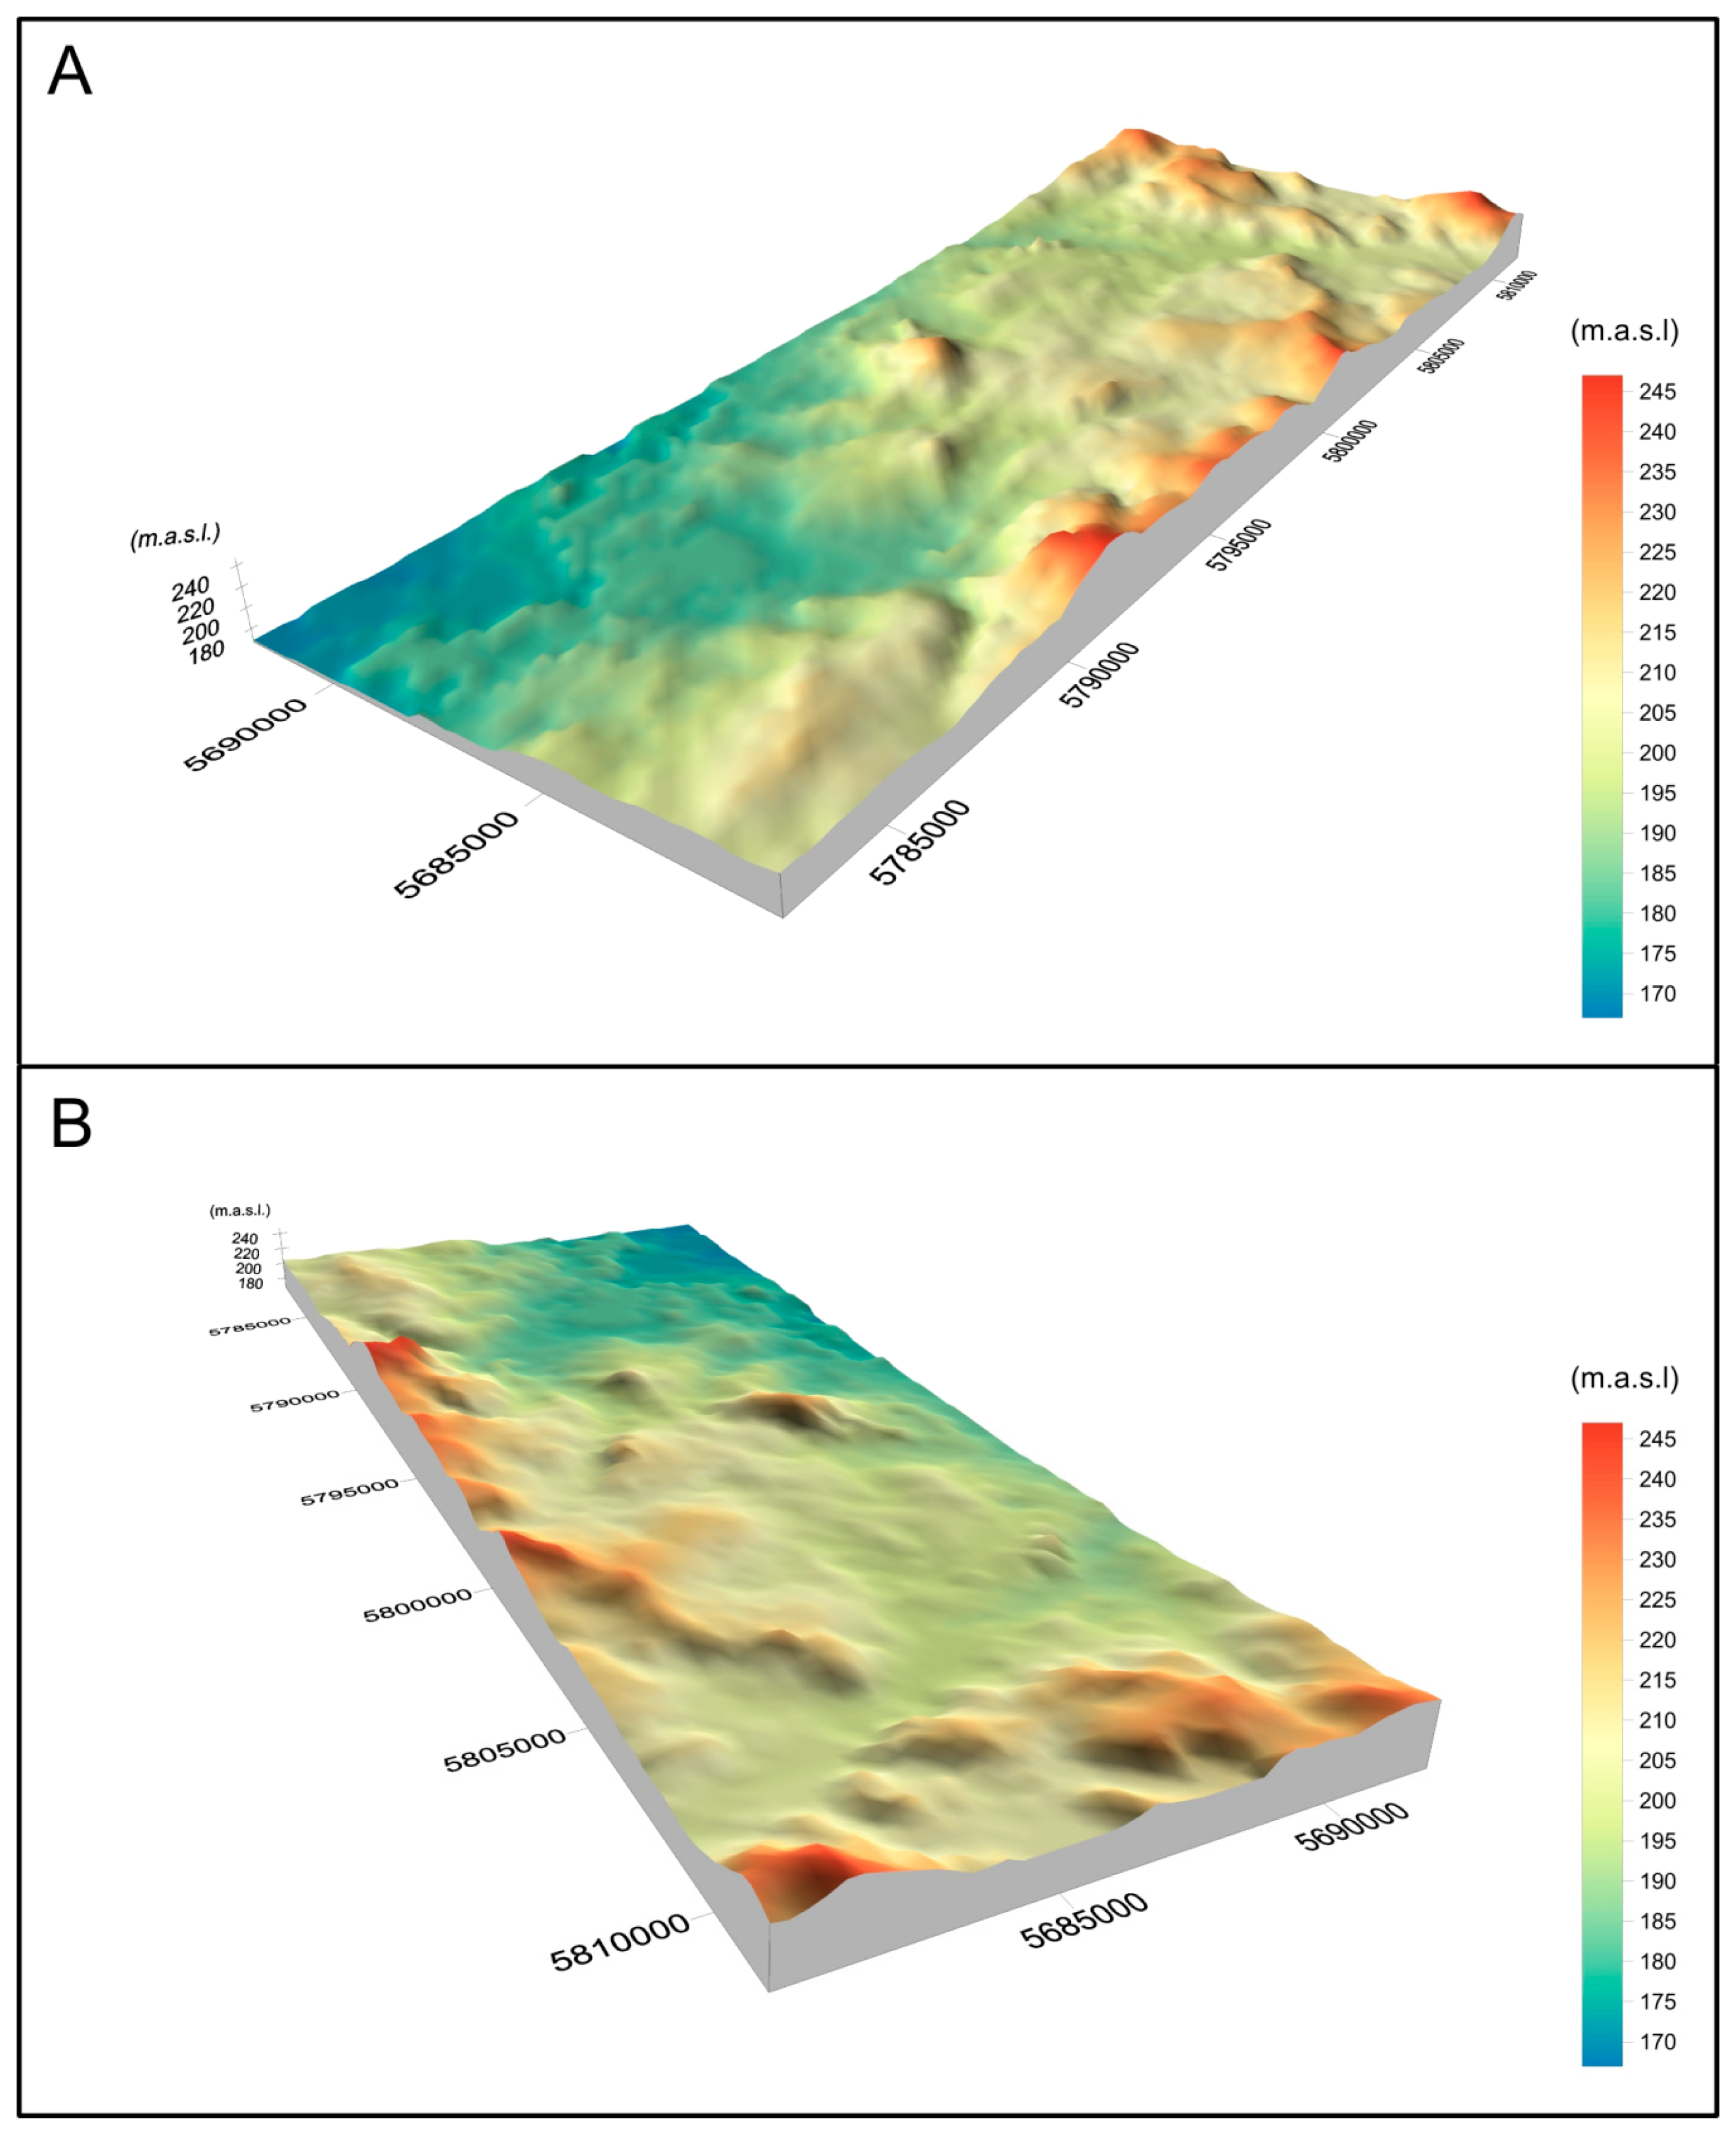
A three-dimensional visualization was also created (
Figure 3), which provides a more vivid image of the topography [
23].
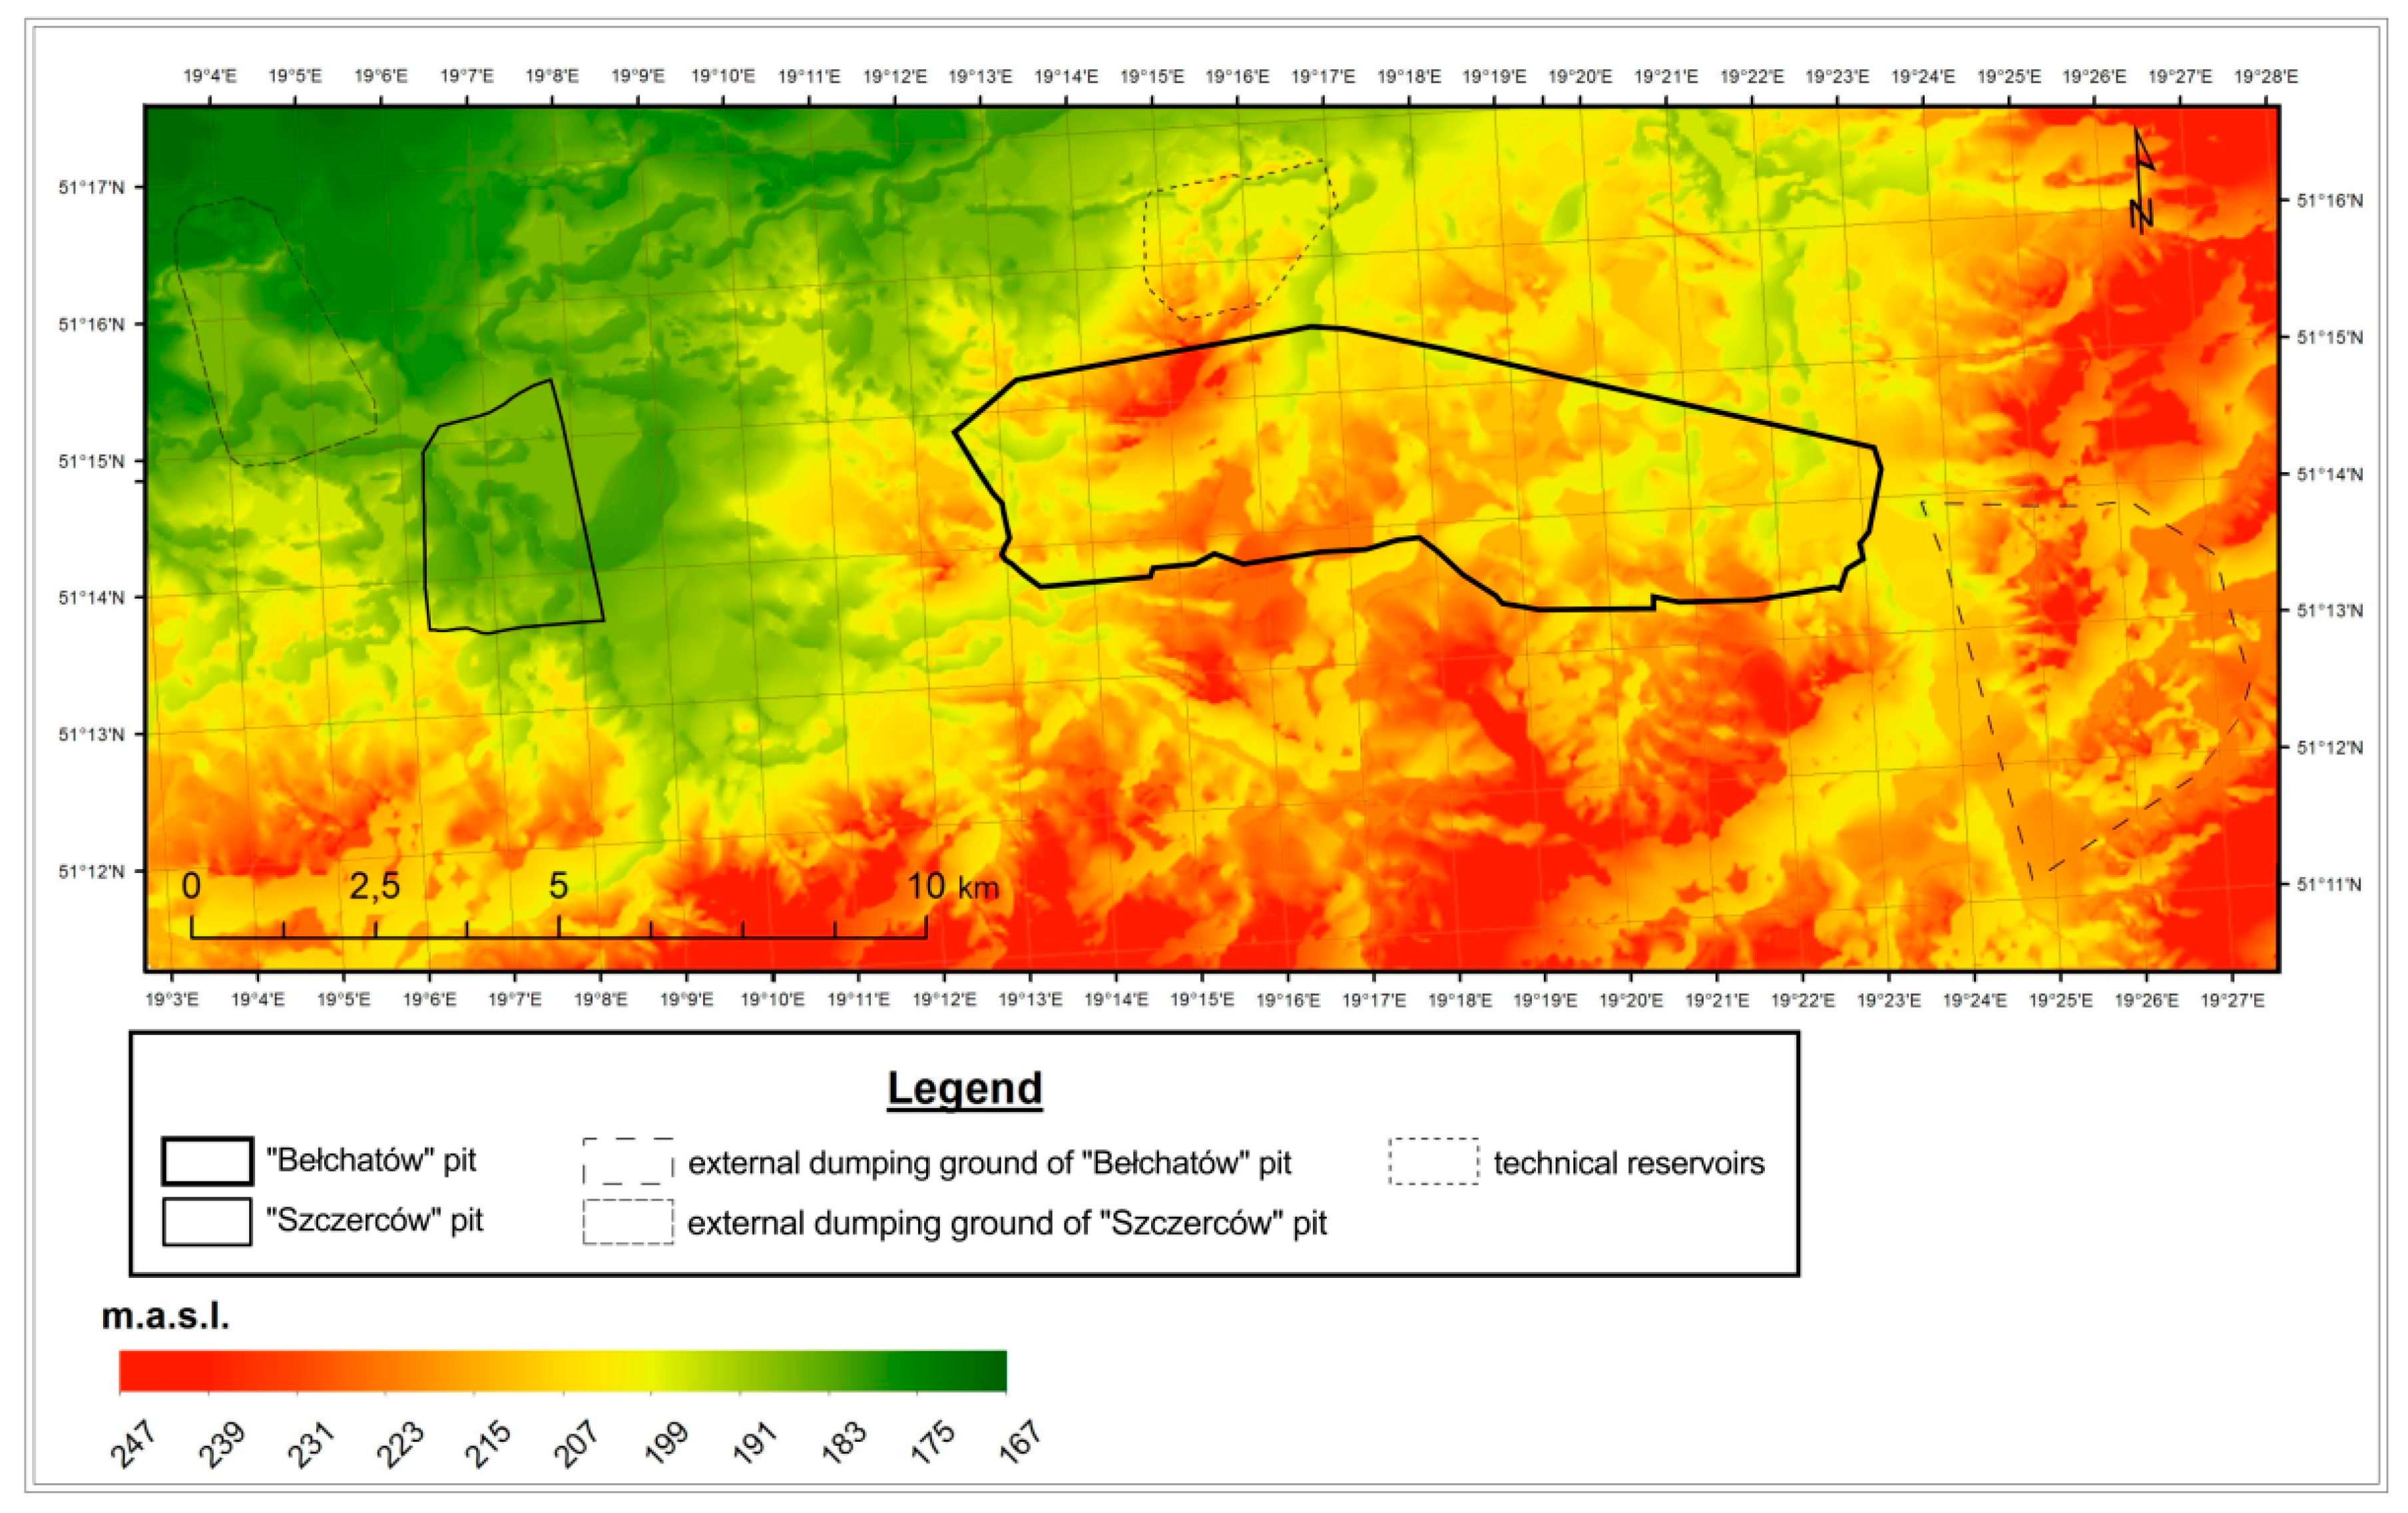
3.2. Constructing the Current Model
In order to conduct a comparative analysis, a DEM of the study area was created for the post-investment period (
Figure 4). The source data for the model were included in the Topographic Database of CODGiK, and were made available by the Department of Geoinformation of the Institute of Urban Geography and Tourism Studies (Faculty of Geographical Sciences, University of Łódź). The data source was intentionally selected in a way which made the obtained information comparable with the historical data as regards precision. Due to this, it was not the very precise Lidar data from laser scanning which was taken into consideration, but the DEM 25, which is based on the design of contemporary topographic maps and orthophotomaps. They were combined so that they contained an image analogous to the model of the pre-investment topography. Then, the vector layer was converted to a raster image with the use of identical interpolation methods and the same pixel size. Similar to the case of constructing the model from the pre-investment period, the RMS error was calculated on the basis of 30 control points, which amounted to 0.8 m in this model. Similar to the construction of the pre-investment model, a 3D model was also created (
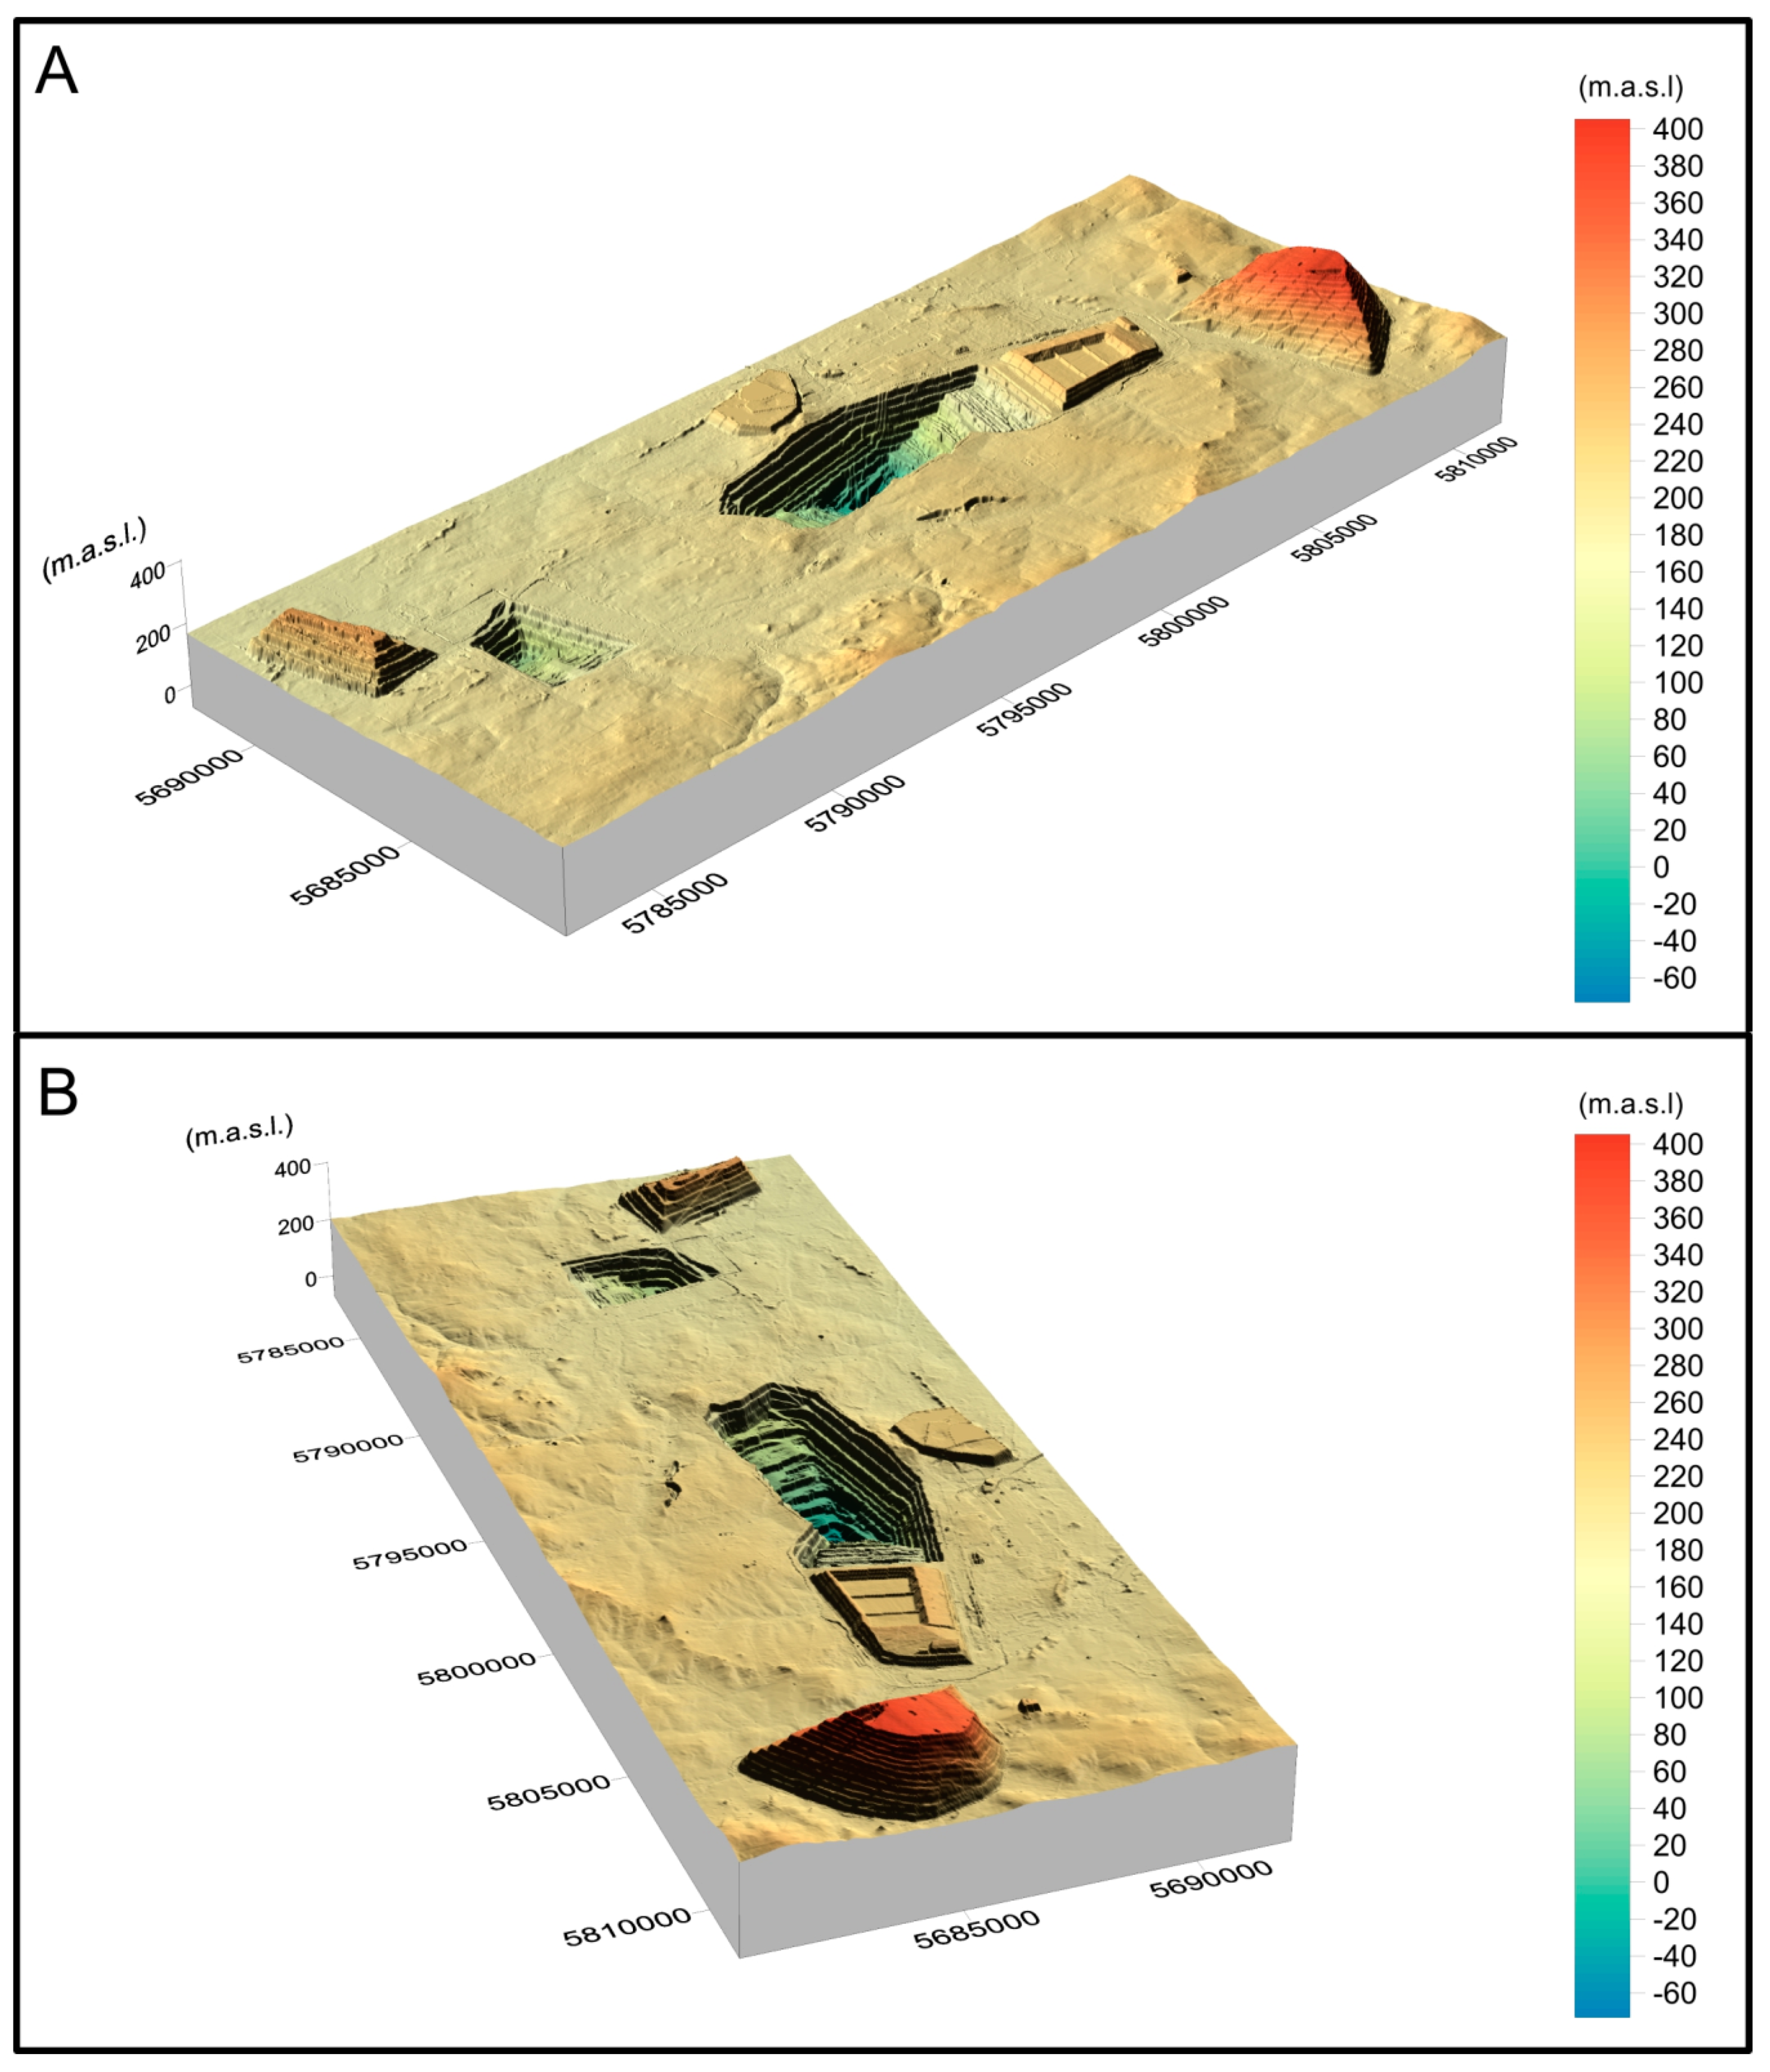
Figure 5).
When creating a three-dimensional model from the post-investment period, it is important to pay attention to parameter value differences in relation to the same model from the pre-investment period. In order to optimize the level of clarity of the topography, the z-factor value was reduced almost twofold. Its value for the pre-investment model was 13, and in this case, it was 7. A different color ramp was also used, adjusted to the far greater height difference.
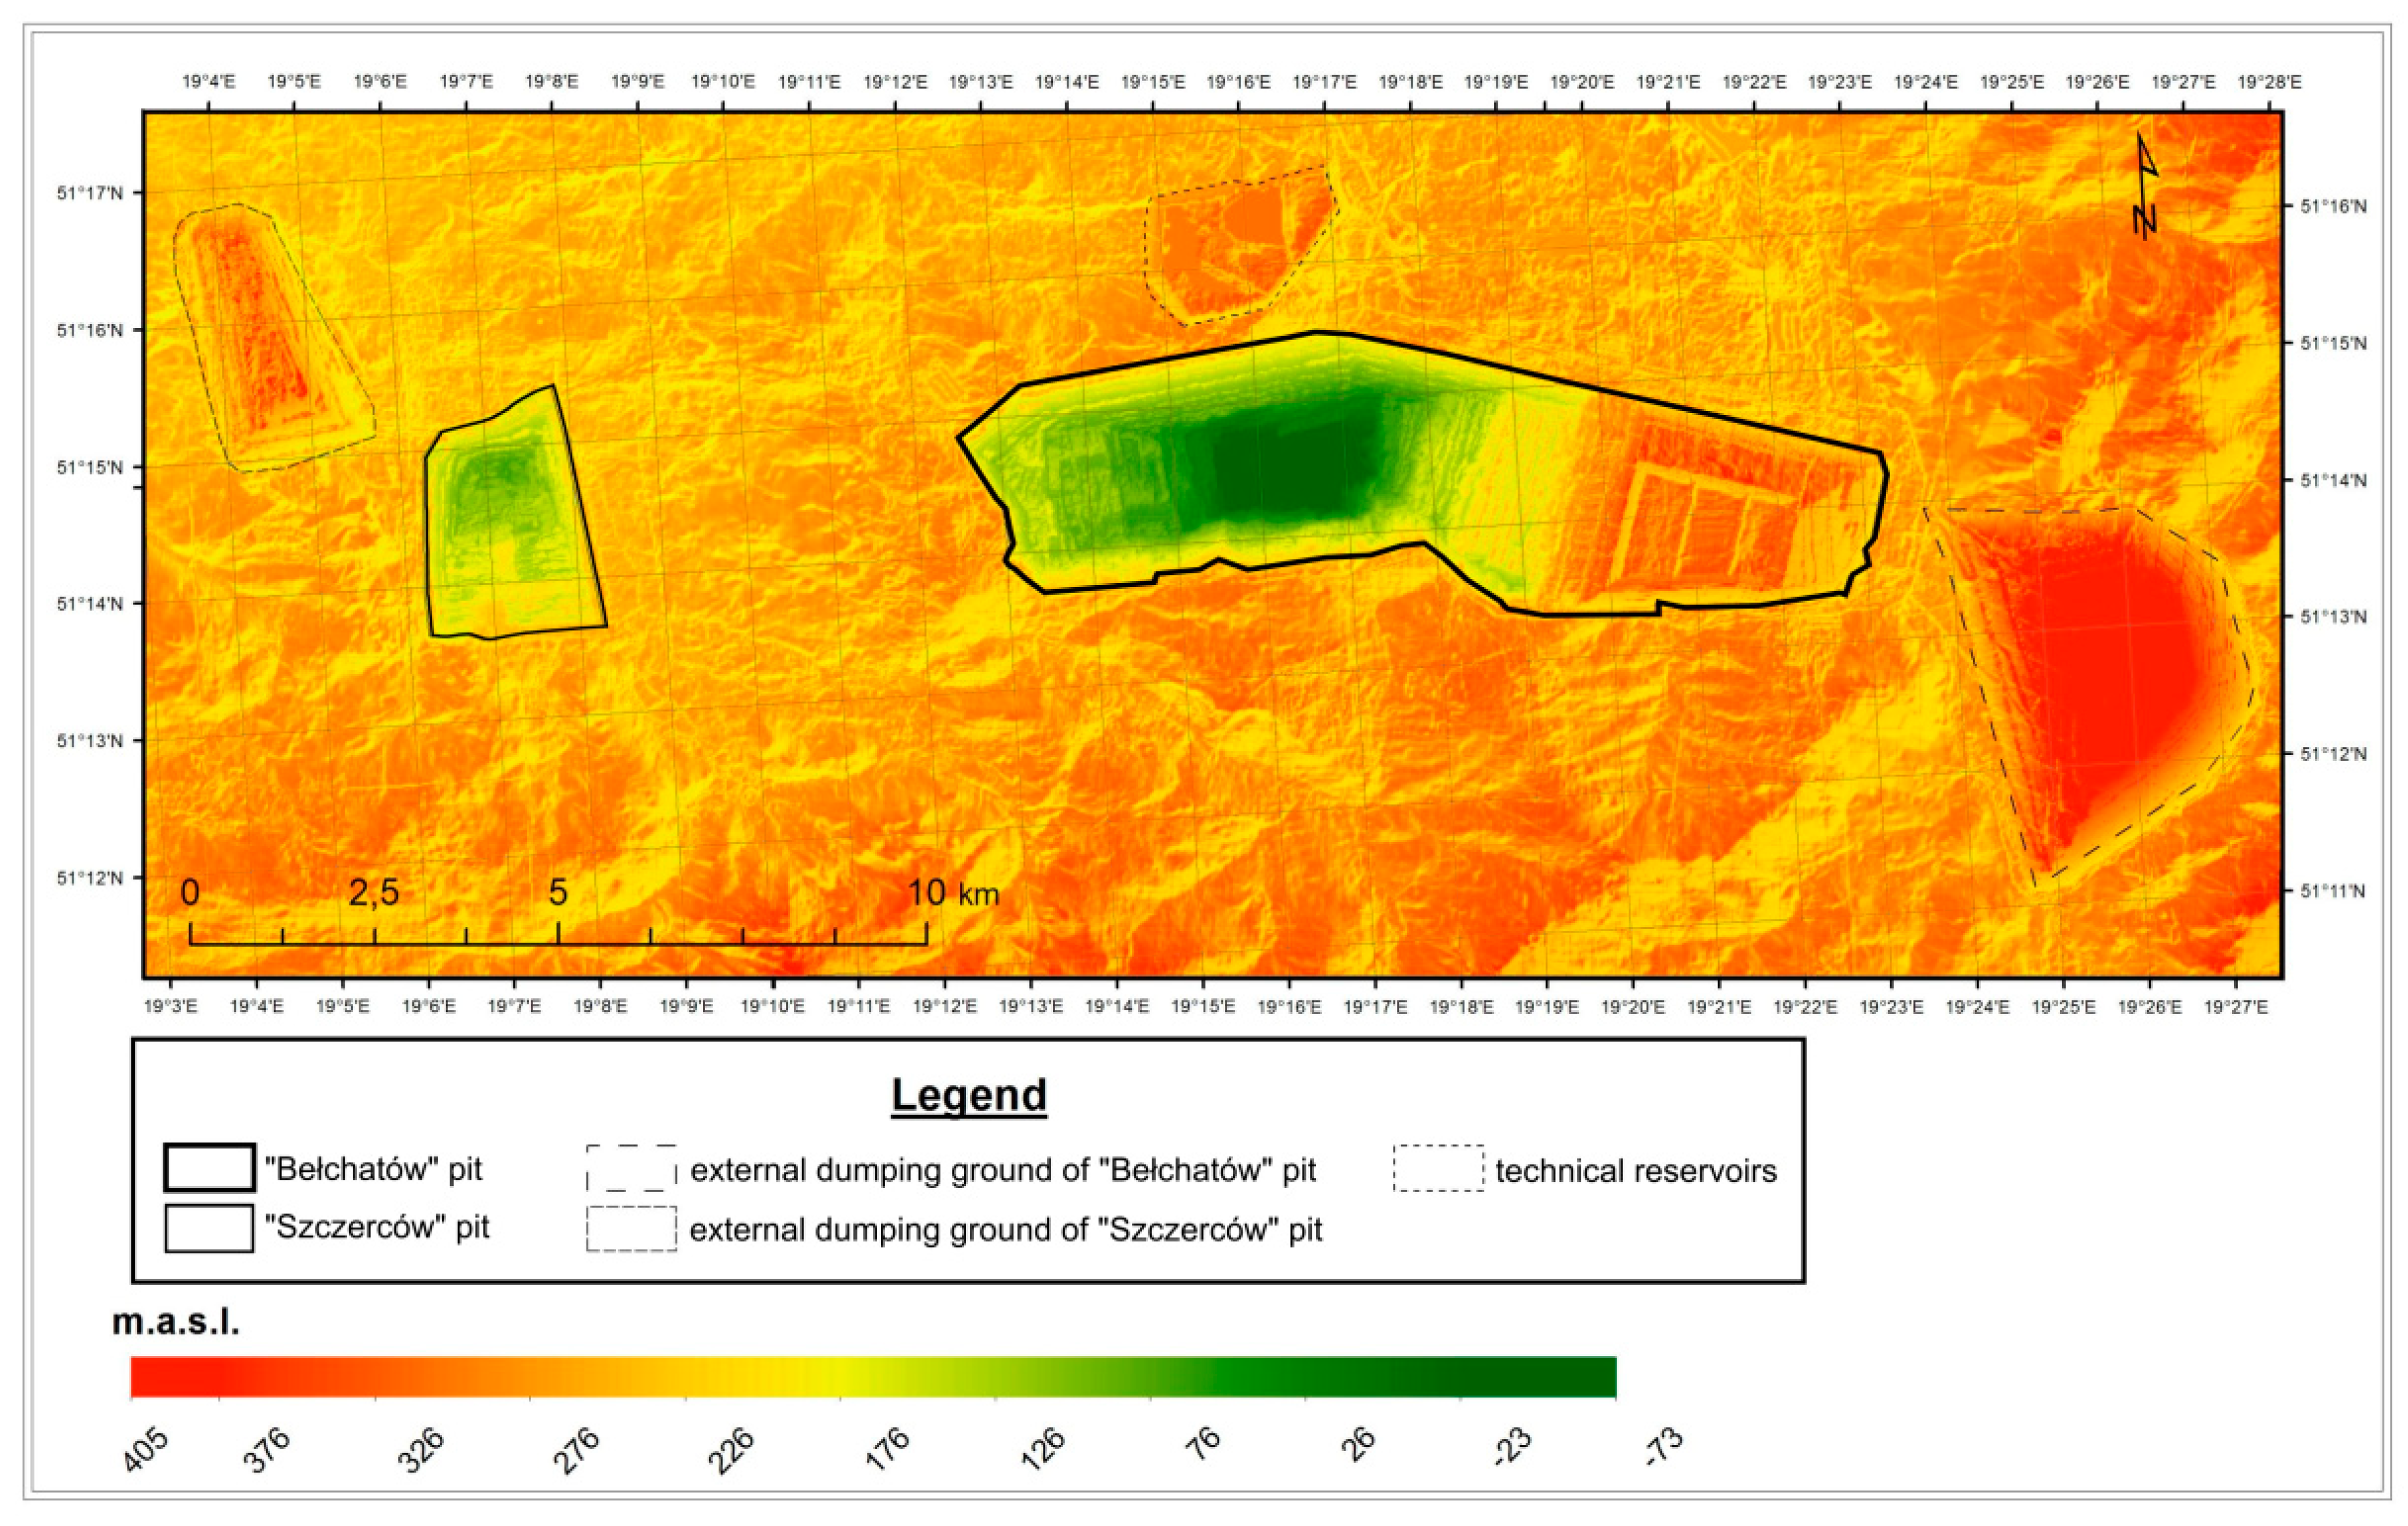
3.3. Comparative Analysis of the Models
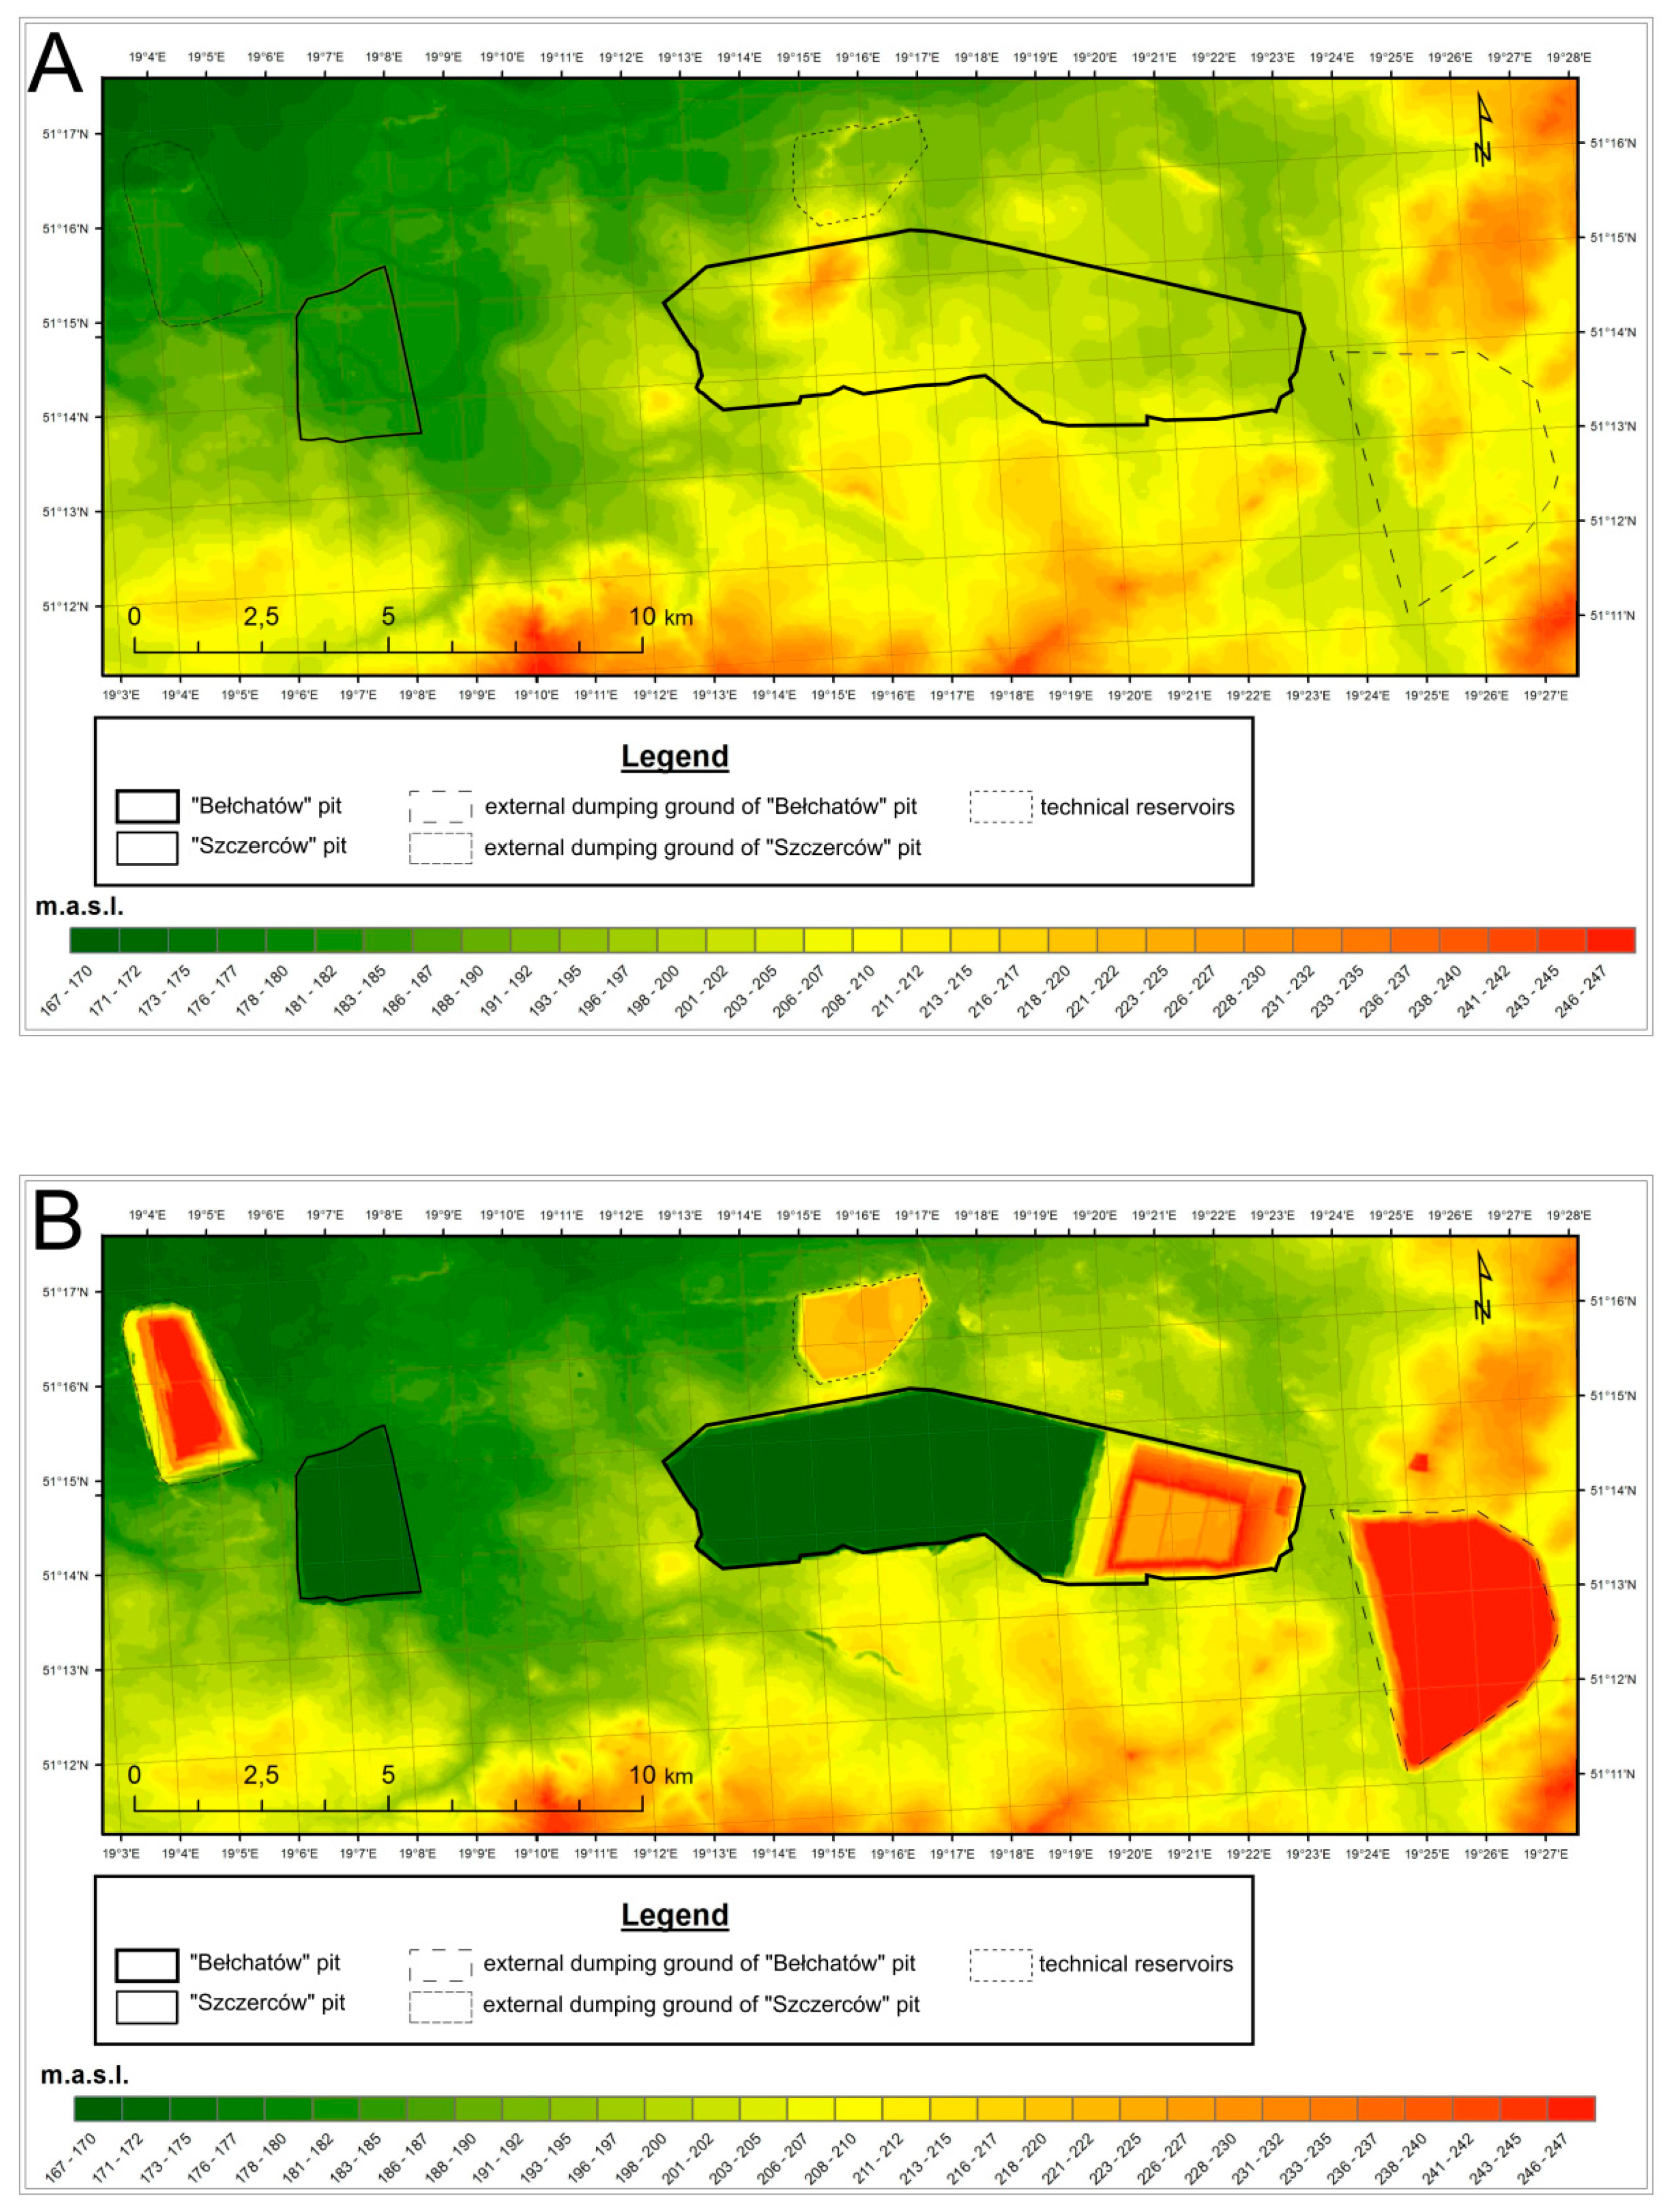
The preparation of models for the pre-investment and post-investment periods allowed for performing a comparative analysis to present the scale of changes over the years. The changes resulted mostly from transformations of anthropomorphic origin, in addition to the natural dynamics of the environment, which also generated transformations of the surface topography. The first method to present the scale of changes was a graphical analysis of the raster images. The form of both two-dimensional models (
Figure 6) was standardized. In this form, the color ramp and the size of a single pixel were matched.
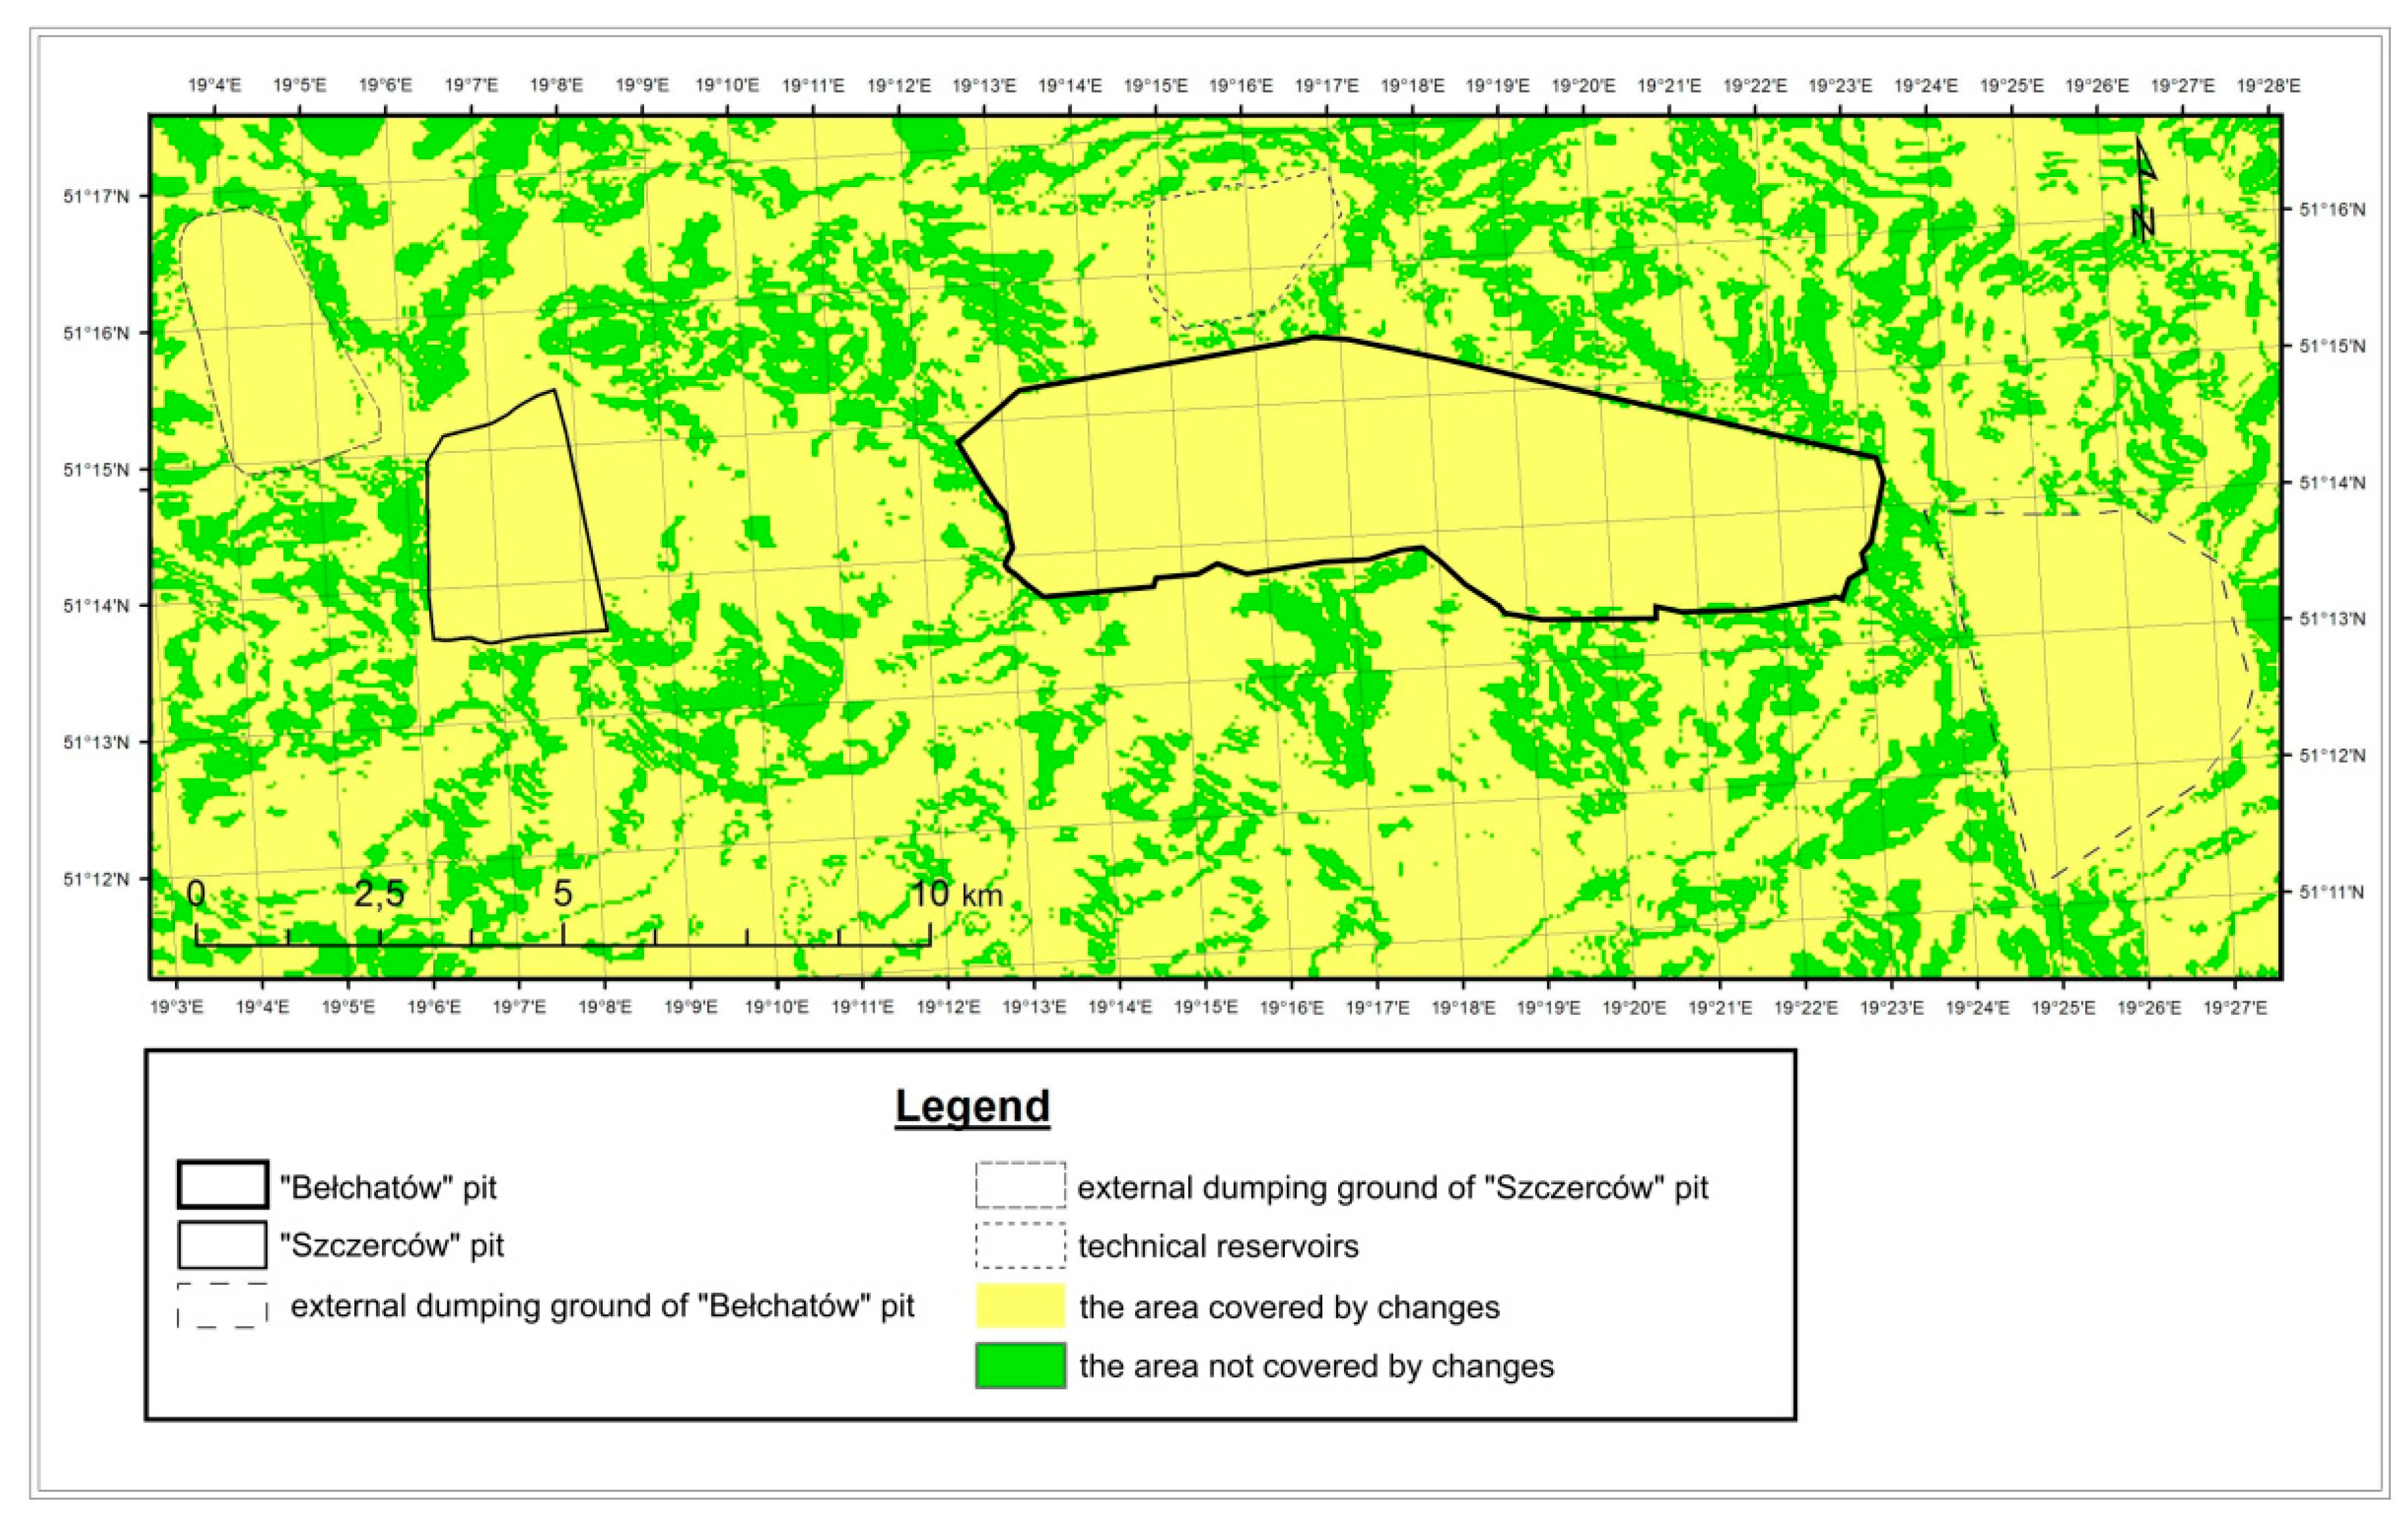
The creation of Digital Elevation Models made it possible to find maximum values of elevation above sea level for hills, and minimum values for depressions. In addition, mean values were calculated. For the pre-investment model, the highest point was at 247 m.a.s.l., whereas the lowest was at 167 m.a.s.l., and the mean value was at 199 m.a.s.l. Currently, the highest point is at 405 m.a.s.l., and the lowest at 77 m.b.s.l.The mean value is 195 m and 77 cm. Height difference must also be taken into consideration. Before the creation of anthropogenic forms, this was 80 m. After pits and dumping grounds were formed, the value increased to 482 m. Both raster images were overlaid upon each other, and were then processed with the Map Algebra tool. The generated difference showed which pixels on both maps were matching and which were different (
Figure 7). The data included in the layer’s attribute table indicate that 74.27% of the study area was transformed. The transformations include both natural denudation and accumulation, and anthropogenic changes resulting from the creation of large forms for the needs of the coalmine. The most evident forms are pits (concave forms) and their external dumping grounds (convex forms). In the northern part of the area, a vast flat form is also noticeable—the grounds of the power plant. 25.73% of the area did not undergo any changes.
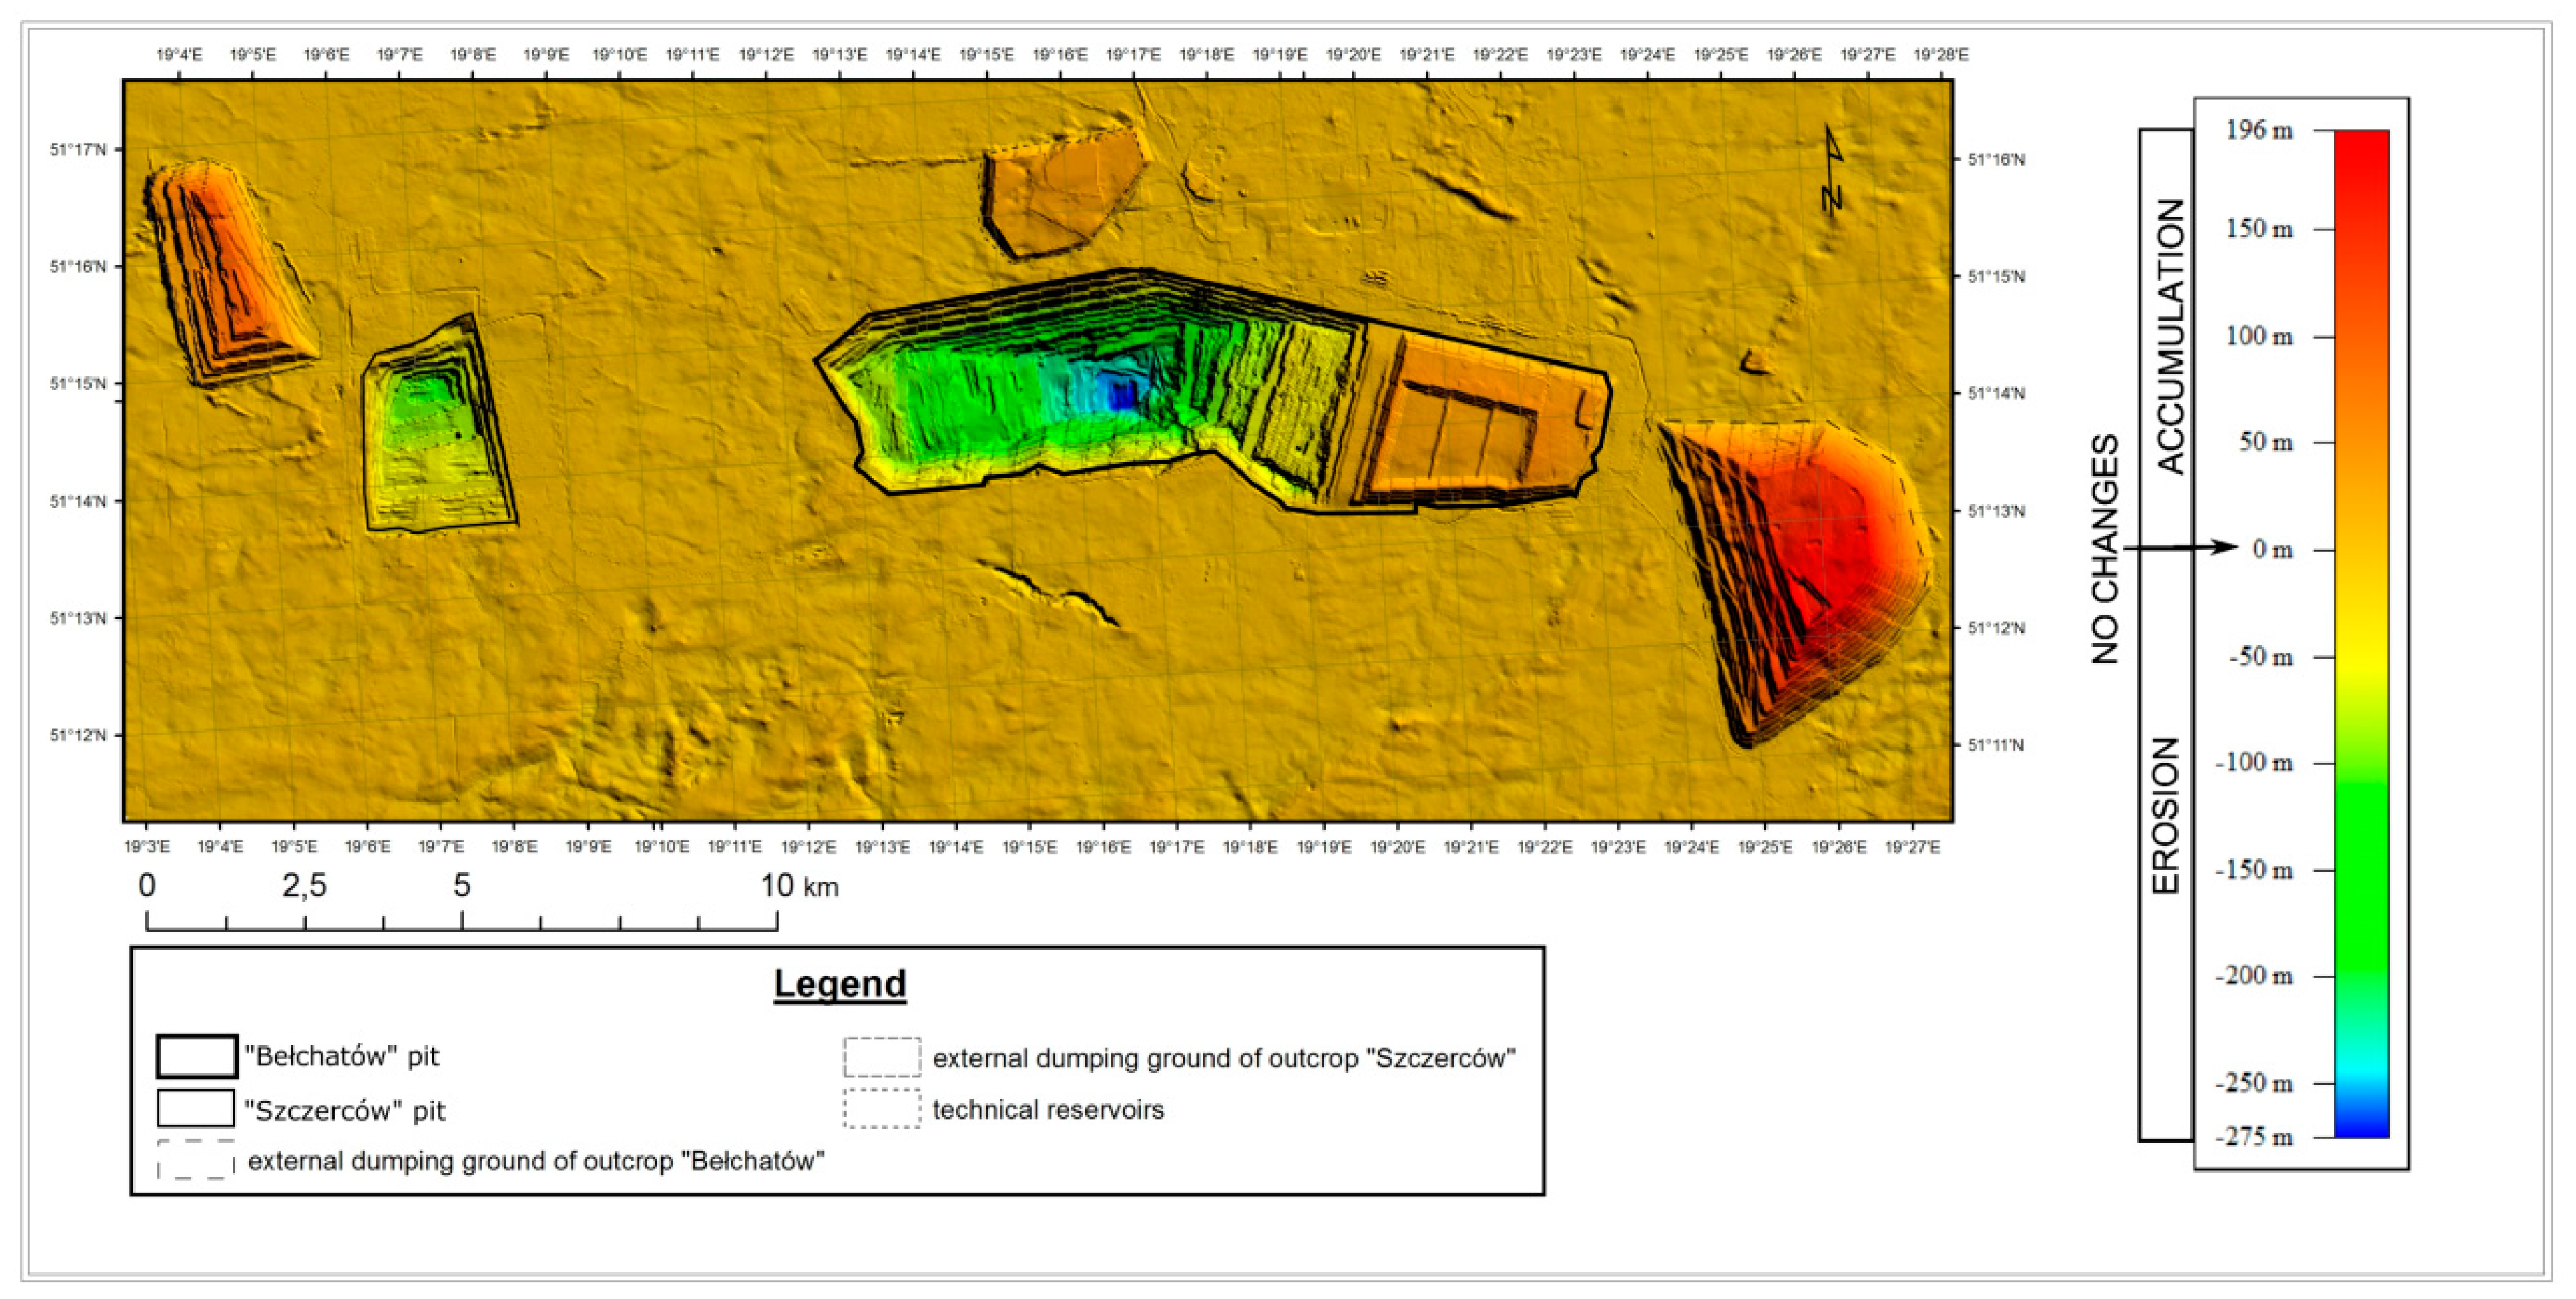
The final outcome of the analysis is a map, which presents changes in elevation above sea level expressed in meters (
Figure 8). Differences between the pre-investment period and the current state are shown using a color scale. The map of the current topography was overlaid with colors, which corresponded to increases or reductions of elevation over the years. On this basis, it is possible to conclude that the most noticeable changes occurred at locations of large topography forms of anthropogenic origin. At the deepest point of the “Bełchatów” pit, the area is depressed in relation to the original elevation by more than 250 m. Changes of this character occurred also along the edges of the “Bełchatów” and “Szczerców” pits. These range from −100 to −50 m. The most significant increases in elevation took place at the location of the external dumping ground. The elevation exceeds the topography level from the pre-investment period by 196 m. A slightly smaller difference concerns the “Szczerców” dumping ground. Changes of the same type concern the area of the power plant and the internal dumping ground of the “Bełchatów” pit, and amount to about 50 m.
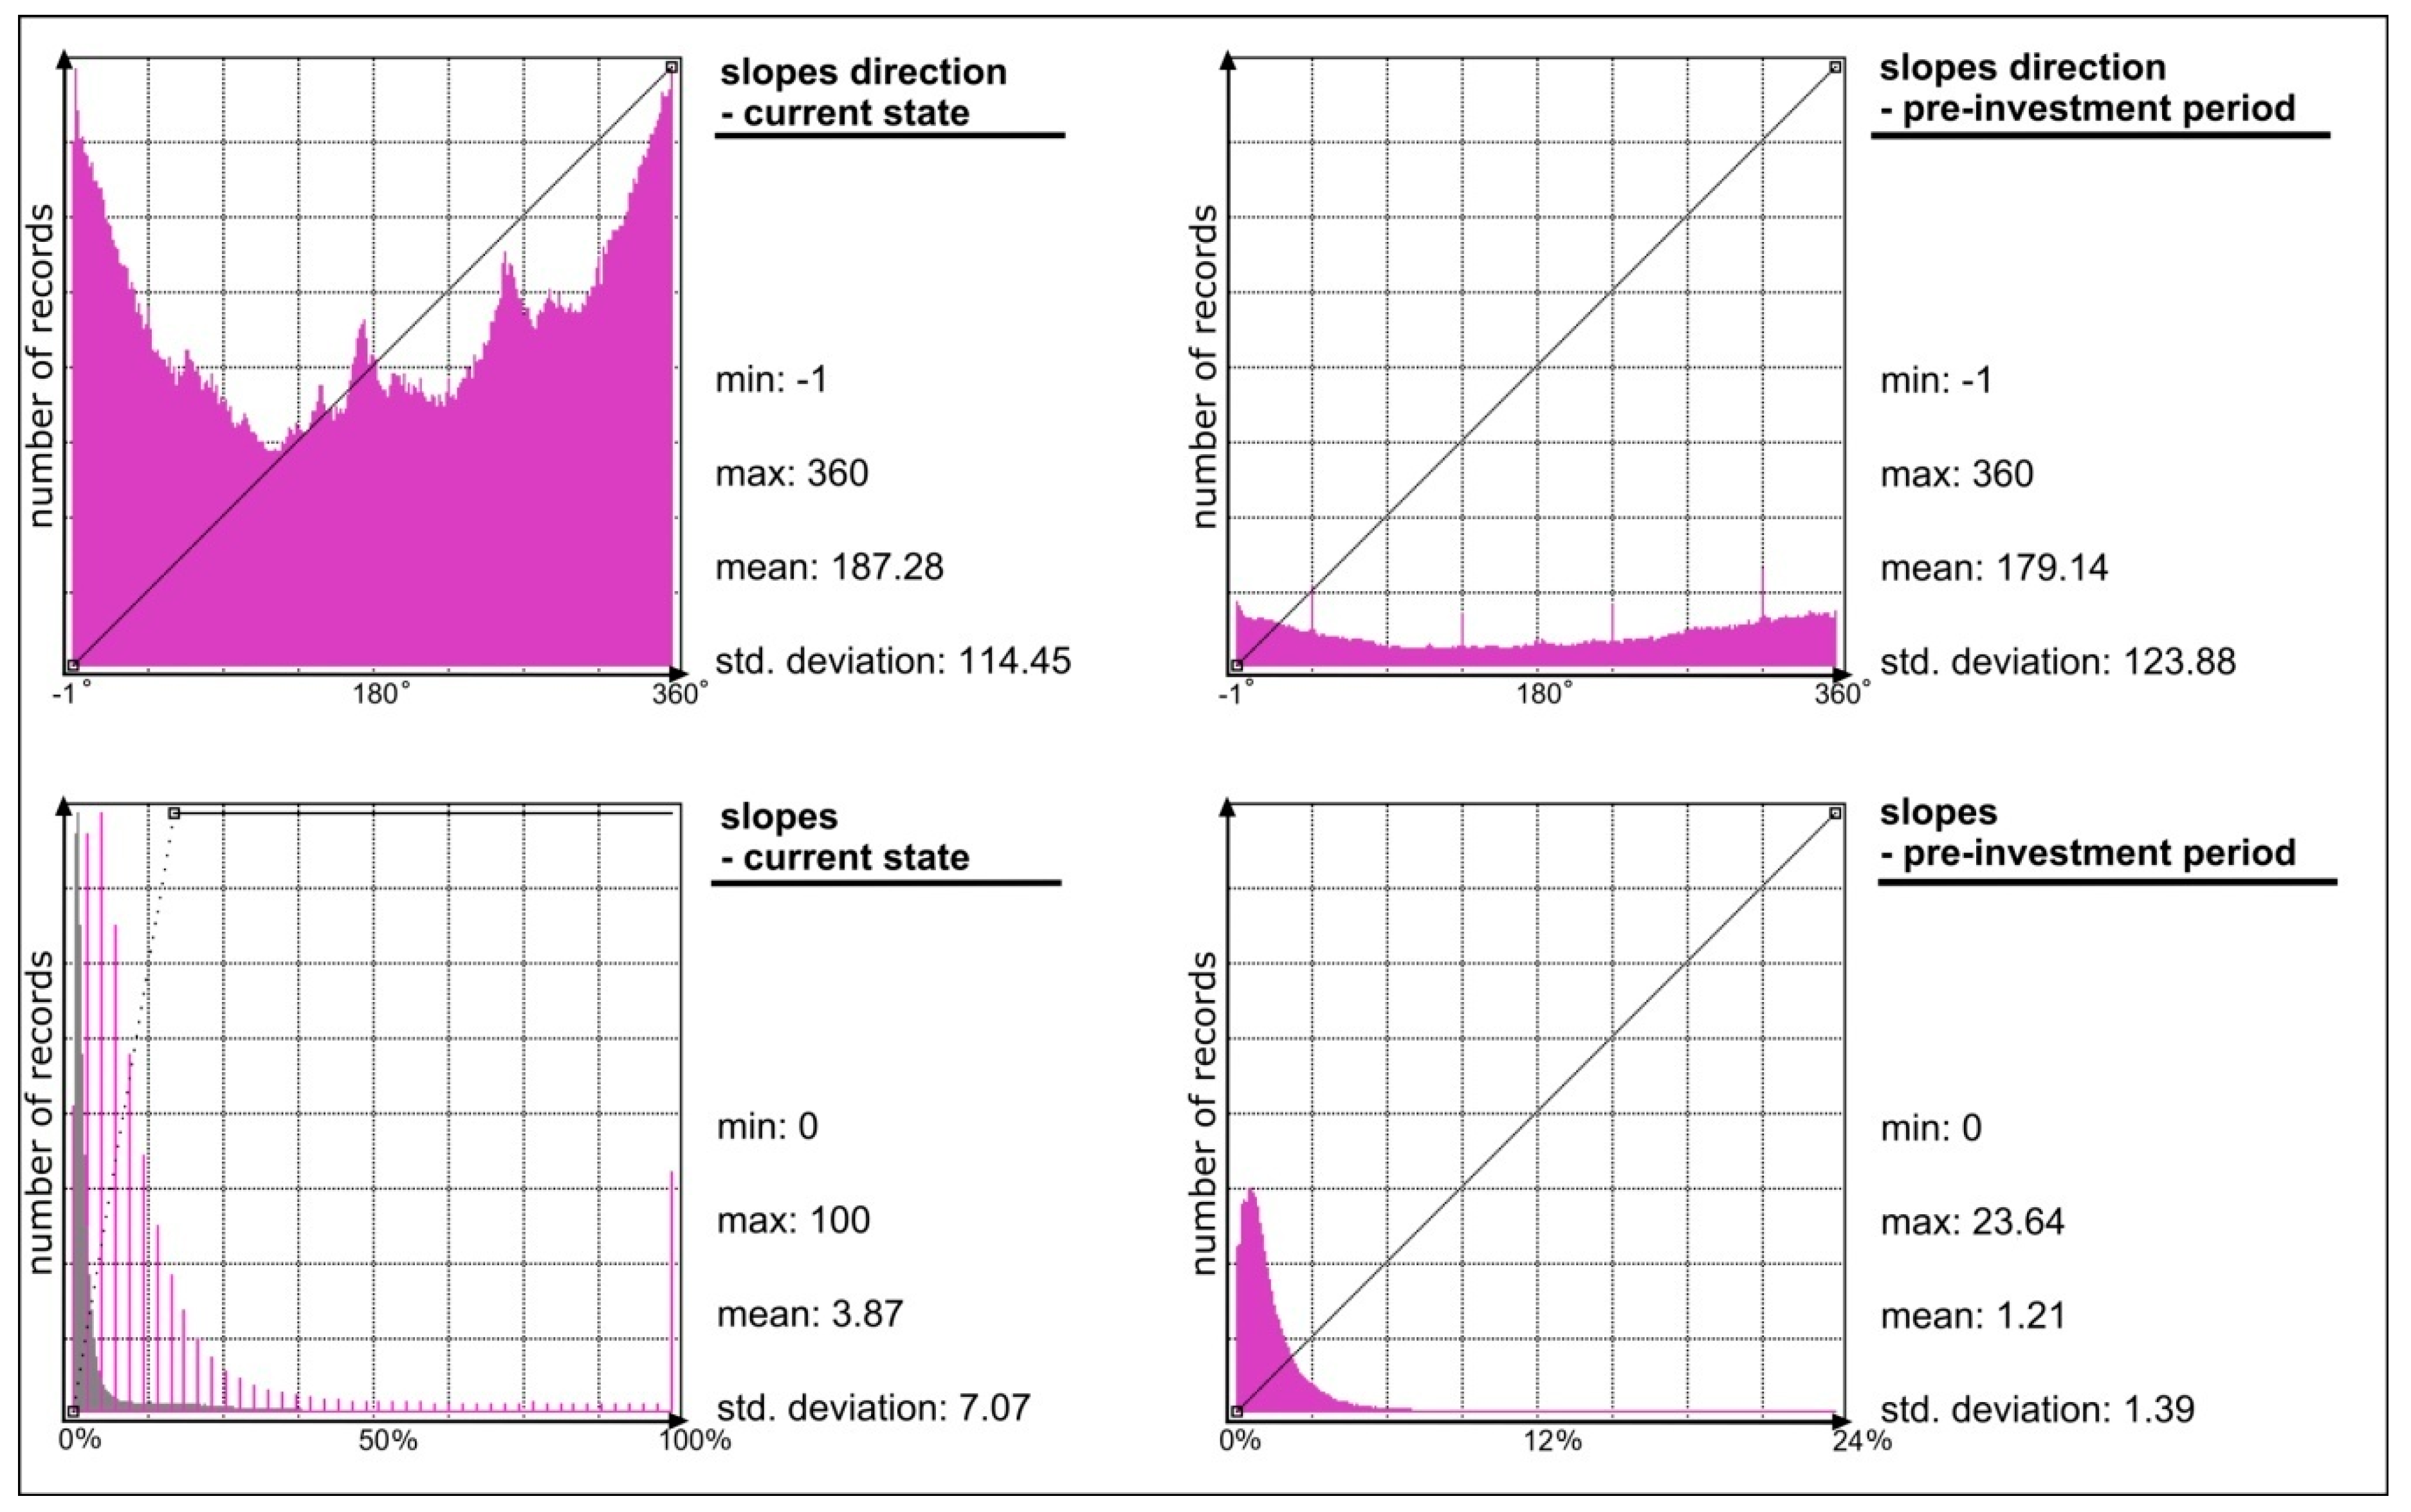
A comparison of changes which occurred in the analyzed area was also conducted on the basis of data from histograms of the raster images presenting features of topography from both periods (
Figure 9). The histograms are graphs, which show the quantitative share of values of a given feature in the entire image. Individual values of the feature are marked on the X-axis. Data from the Y-axis indicate how often the given value occurs. Additionally, the elaboration includes statistical data for individual rasters. The following values were calculated: The maximum, minimum, and mean value, and standard deviation. Slope direction and percentage slope values were taken into account.
An analysis of the graphs allows for stating that the most significant changes occurred in slope directions (aspect). The values are expressed as azimuth from 0° to 360° (EwertowskiandTomczyk, 2009). These values are divided into nine equal intervals, corresponding to compass directions. For the post-investment topography, the culminations occur around 0° and 360°. This means that most slopes are characterized by a northerly, northeasterly, or northwesterly aspect. A minority is formed by values between 116° and 220°. These are values which represent southerly, southwesterly, and southeasterly aspects. Slope aspects of the current state exhibit greater variations in concentrations of values. There are two very clear culminations (not maximum values though): from 160° to 190°, and from 250° to 280°. They correspond precisely to southerly and westerly aspects, respectively. They result from forming pits and dumping grounds whose walls are oriented towards the same direction across the entire surface. Histograms were also created for slope maps. This feature reveals the rate of elevation change towards its greatest decrease or increase. The values can be expressed as degrees, radians, or percentiles [
24]. In the case of histograms of percentage slope maps, the graphs for both periods show similar distributions. Accumulations of feature intensity occur near minimum values, which indicates the plain character of the topography. It must be noted, however, that there is a clear accumulation near the 100% value for the post-investment topography. Such values indicate the occurrence of vertical walls, which are present inside the pit.
4. Discussion
The article presents, for the first time in the literature of the subject, an assessment of morphometry changes of the impact area of the Bełchatów Coal Mine, on the basis of two digital elevation models: one from the pre-investment period, and the other from the current time. Precision analysis revealed the RMS error values to fall within the range of 0.8–1.05 m, which could be assumed as comparable with the precision degree of topographic maps. In order to facilitate a comparative analysis, the models were constructed with the same pixel size (20 m). Thanks to assuming this methodology, the conducted research showed the scale of changes in topography over the years. Historical models, based on vectorization of precise topographic maps, yields research results that can be used for further analysis. It is worthhighlighting the fact that anthropogenic change analysis can be expressed in a quantitative and qualitative way. Results (historical DEM) are a good starting point for geomorphological or land use analysis in the future with qualitative data, but first of all, this study was focused on showing how big impact human activities had on the area where the Bełchatów coal mine is currently located. Such data is important input for planning of location and development of open pit mines all around the world. If researches with a similar approach as shown in this article will be developed, further anthropological changes will be described in a more complex way. Vectorization could be extended to land use, and analysis could include volume of soil material and geological structures.
The conducted analyses resulted in documenting topography changes in nearly 75% of the study area. Lack of changes, or changes which did not exceed the precision of the model, concern only 25% of the area. The transformations are associated with direct human activity, related to brown coal mining and the building of a power plant with accompanying infrastructure. The final graphical presentation allows for identifying the direction of topography changes; erosion when the current elevation is below the value of the pre-investment period; no changes when changes do not occur or are smaller than the precision of the models; and accumulation when the current elevation is higher than the values from the year 1942.

