The Unbalanced Analysis of Economic Urbanization—A Case Study of Typical Cities in China


College of Surveying and Geo-Informatics, Tongji University, Shanghai 200092, China
*
Author to whom correspondence should be addressed.
ISPRS Int. J. Geo-Inf. 2020, 9(1), 13; https://0-doi-org.brum.beds.ac.uk/10.3390/ijgi9010013
Submission received: 1 October 2019
/
Revised: 18 December 2019
/
Accepted: 23 December 2019
/
Published: 25 December 2019
(This article belongs to the Special Issue Geo-Information Science in Planning and Development of Smart Cities)
Abstract
:In the process of economic urbanization, because of competition among cities, agglomerations and polarization of regional economies are produced. This paper studies the urban polarization with Chinese characteristics and the regional economic urbanization, which include the imbalance under the influence of different geographical factors between the east and west of China and the imbalance under the comprehensive influence of natural and human factors in the province. The urban economic polarization index (UEPI) is constructed to describe the regional imbalance caused by the economic polarization of capital cities in China. The purpose is to explore the polarization of provincial capitals in their respective provinces and to reveal the strength and evolution of their role in the imbalance of economic urbanization. Then, combined with relevant analysis of natural and socio-economic background data, the induced factors and the mechanism of urban polarization are diagnosed. The results show the following: (1) The UEPI can accurately measure the polarization level of provincial capitals through the calculation of typical cities. (2) Based on the UEPI, capital cities can be divided into four categories, which include inapparent, obvious, prominent, and striking. Different cities have different effects on the imbalance in economic urbanization. (3) The main inducing factors of urban polarization are the resource environment, policy system, industrial structure, investment, scientific and technological innovation, location, and extroversion. The policy system is often an important link that integrates and adjusts various factors to form a comprehensive driving mechanism.
1. Introduction
After World War II, world urbanization entered a period of unprecedented diffusion and comprehensive development [1,2]. From the 1970s until now, the wide range of urbanization processes of developing countries is particularly noticeable [3]. It is expected that the urbanization level of developing countries will reach 50% by 2020 [4]. By 2030, the urban land cover will increase by 1.2 million km2, which would result in considerable loss of habitats in key biodiversity hotspots [5]. Despite the rapid expansion of urban land, the urban population grew faster, resulting in increasing densities for the majority of urban agglomerations, including those in both more-developed (Japan, South Korea) and industrializing nations (China, Vietnam, Indonesia) [6]. Rapid urbanization in developing countries presents challenges for sustainable environmental planning and peri-urban cropland management [7]. With the rapid expansion of the global urban population, unprecedented new changes have taken place in urban structures and spatial layouts. With the continuous expansion of cities, new forms of spatial organization, such as megacities or metropolitan areas, have emerged. The increasingly serious contradiction between space-carrying capacity and urban expansion has led to urban diseases such as traffic congestion, housing shortages, high housing prices, air and water pollution and so on [8]. The spatial reorganization of production factors and wealth has also led to the one-way flow of populations from rural to urban areas and from small and medium-sized cities to metropolises, which has intensified the unbalanced pattern of regional social and economic development [9].
China’s urbanization in the past decades since the economic reform and opening-up has attracted worldwide attention because of its large-scale and profound influence [10,11]. By the end of 2018, China’s urbanization level reached 59%, and the urban population has exceeded 800 million [12]. China’s urbanization also causes an inefficient phenomenon of economic urbanization. Urban areas pull labor, resources, capital, technology and other factors of production to the city, resulting in high economic agglomerations and large-scale imbalances. In the socialist market economy with Chinese characteristics, the driving role of policy is a problem worthy of attention. National policies establish the regional status of cities and guide the regional selection of major projects and investments. Urban planning stipulates the leading functions of a city, draws the scale of its spatial development, and constructs the corresponding infrastructure system. The layout of education and technology affects the pattern of scientific and technological innovation. China’s provincial capitals usually have large populations and total economic volume, good resources and environmental conditions, excellent transportation, and a long history. Moreover, the provincial administrative centers also have the natural advantage of a policy-oriented allocation of resources. Therefore, exploring the quantitative relationship between the agglomeration effect of provincial capitals and the provincial economy is not only a meaningful theoretical issue but also an important reference for balanced development within provinces.
Scholars mainly study comprehensive urbanization problems, but few of them specialize in economic urbanization. Some related studies focus on the following aspects: (1) The studies discuss the implications of urbanization from the economic perspective. By studying the pattern of urban development in Africa, Rondinelli proposed that population mobility was the key factor affecting urbanization [13]. Zhang reviewed the economic theory and analysis methods of urban system formation and discussed some theoretical issues of urbanization and economic development [14]. Cheshire used the theory of urban economics to study the role of economic development practices in promoting urbanization [15]. (2) The studies examine the economic driving mechanisms of urbanization. Different scholars propose economic driving mechanisms of urbanization from the perspective of industrialization [16], industrial restructuring [17,18], natural resources [19,20] and the role of foreign investment [21,22]. Furthermore, Shi et al. posited the theory of “economic dynamics” of urbanization by studying the phenomenon of urbanization in China [23]. (3) The studies focus on research methods and models of urbanization. Tong et al. used cellular automata (CA) to explain the spatial evolution of cities and analyzed the urban development mode under different scenarios [24,25]. Wu et al. proposed a landscape pattern analysis method to quantify the spatial pattern of urbanization and assess the ecological impact of urbanization [26]. Xu et al. used remote sensing data to quantify the spatial-temporal pattern of urban expansion and found that cities in eastern and central China showed more active urbanization [27]. Li and Gong systematically reviewed the urban growth model, including its evolution, theoretical basis, simulation framework, and typical applications. They also introduced land use and transportation models, cellular automata models and multi-agent models, as well as their internal relations [28]. Recently, the integration of GIS and RS to build a comprehensive model for simulating urban dynamic change has become a more popular research method [29,30,31]. (4) The studies focus on urbanization and the sustainability of the urban economy. Tolley et al. studied sustainable urban economic development policies under market conditions [32]. Yuan et al. studied the impact of foreign trade and domestic natural environment on the sustainable development of the urban economy and explored the sustainable development of resource-based cities [33].
In summary, the existing research focuses on general theories and methods of urbanization. There are more studies on comprehensive urbanization and fewer discussions on economic urbanization. There are more discussions on the driving factors of urbanization and fewer studies on the differences in economic agglomeration capacity driven by the same factors. There are many studies on the primacy of general cities, but the economic polarization of provincial capitals with special political status and its influence on the imbalance in provincial cities are rare.
Compared with previous studies, this paper summarized the contributions of this paper into three aspects: research perspective, method, and results: (1) From the perspective of research, this paper studies a special imbalance in the process of China’s economic urbanization, which is the agglomeration effect of provincial capitals and the economic imbalance within provinces. (2) In terms of research methods, both the concept of “urban primacy law” put forward by Jefferson [34] and the phenomenon of “one-city monopoly” [35] study the polarization level of cities from the single aspect of population or GDP. These studies have ignored the spatial differences between GDP and population. In this paper, the urban economic polarization index (UEPI) is deduced by combining the “Lorenz curve” and “centralized index” through a geometric method to measure the economic polarization level of a city. (3) From the results of the research, this paper establishes the classification standard for urban economic polarization, analyses the inducement factors of the formation of different polarization levels of cities, explains the comprehensive inducement mechanism under the combination of different inducement factors, and analyses the influence of capitals having different polarization levels on the provincial economic imbalance. The three-level topographic framework from west to east and the water distribution from the southeast coast to the northwest inland of China constitute the geographical environment differentiation, which lays the resource base and environmental background of economic urbanization in different provinces. In general, the economic polarization of cities in the eastern coastal areas is weaker than that in the central and western areas of China.
2. Data Sources and Research Methods
2.1. Data Sources
The data in this study were collected from authoritative national statistical datasets, which include the “China Statistical Yearbook” and “China Urban Statistical Yearbook” from 2006 to 2017. Because of the great amount of original data, only some typical cities are listed here, as shown in Table 1:
2.2. Research Methods
Research methods included the selection of research indicators, the centralized index method, and correlation analysis of human factors used to calculate the data.
2.2.1. Selection of Research Indicators
Since Jefferson put forward the concept of urban primacy law [34], Zhou expanded the “four-city” index and “eleven-city” index to describe urban primacy [36]. These methods study the concentration of cities from the perspective of population proportions. GDP is an important comprehensive statistical index in the accounting system. GDP reflects the economic strength and market scale of a city (or region). Many scholars also study the phenomenon of “one-city monopoly” through the proportion of GDP. All of the above studies ignore the cities’ spatial differentiation, so this paper establishes indicators from the perspectives of both GDP and population.
2.2.2. Centralized Index
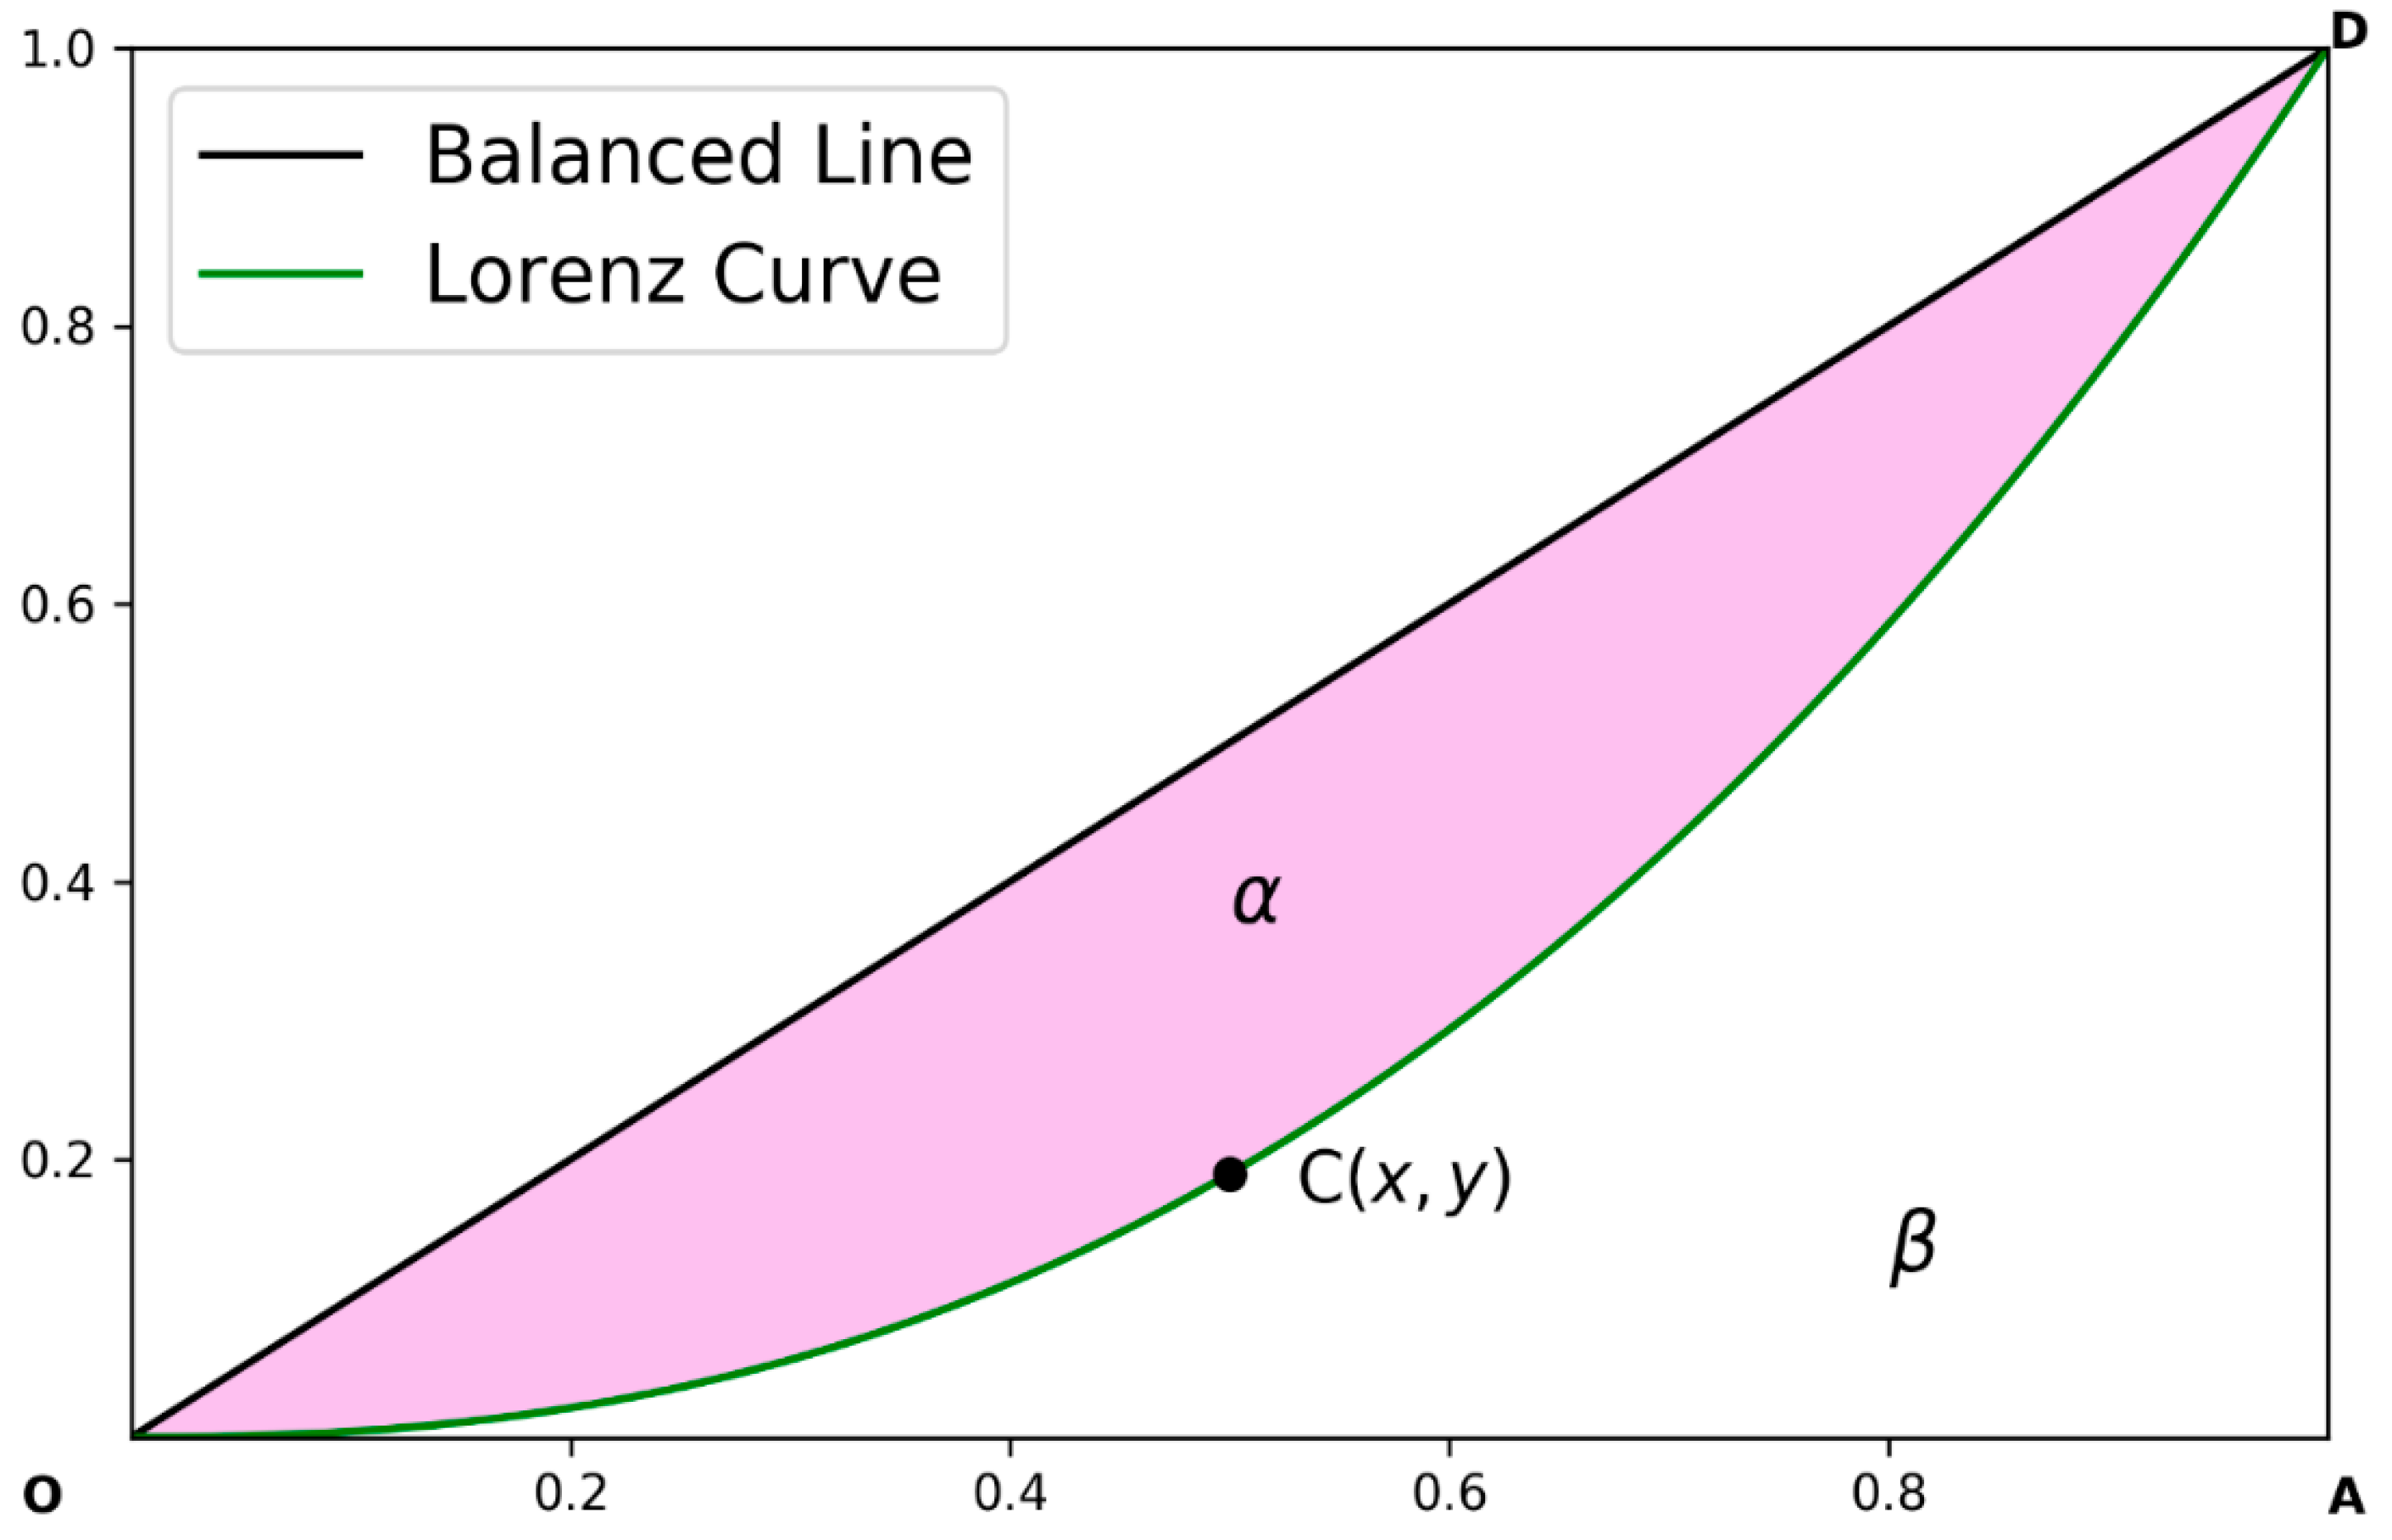
By combining the “Lorenz curve” [37] and the “centralized index” [38], a new index to measure urban economic polarization is proposed. As shown in Figure 1, a downward convex Lorenz curve is determined with the GDP ratio of a city as the abscissa coordinate and the population ratio as the ordinate coordinate. This curve passes through , , and . A linear indicates that there is no polarization, that is, the same percentage of GDP corresponds to the same percentage of the population. From Figure 1, we can see that the larger the polarization degree, the larger is the shadow area (). Therefore, reflects the polarization of the urban economy in the province. Finally, the urban economic polarization index (UEPI) is defined as follows:
where serves as the area of the shadow in Figure 1, it is computed by:
where denotes the area of the triangle OAD. It is a constant with a value of . is the area below . It is calculated by:
When the Lorenz curve is approximated by the power function () [39], the formula is deduced as follows:
where is the ratio of urban GDP to regional GDP, is the ratio of the urban population to the regional population, and log stands for natural logarithm.
2.2.3. Establishment of Evaluation Criteria
According to the reality of urban economic polarization in China, the cities to be evaluated were divided into four categories: inapparent, obvious, prominent, and striking. Typical cities of different types were selected as references. The reference standards were comprehensively formulated based on cities’ relative economic status, the relative rate of industrial restructuring and optimization status, relative agglomeration capacity of various factors of production, urban comprehensive productivity, and the driving effect on the regional economy. The evaluation criteria are shown in Table 2.
3. Research Results and Analysis
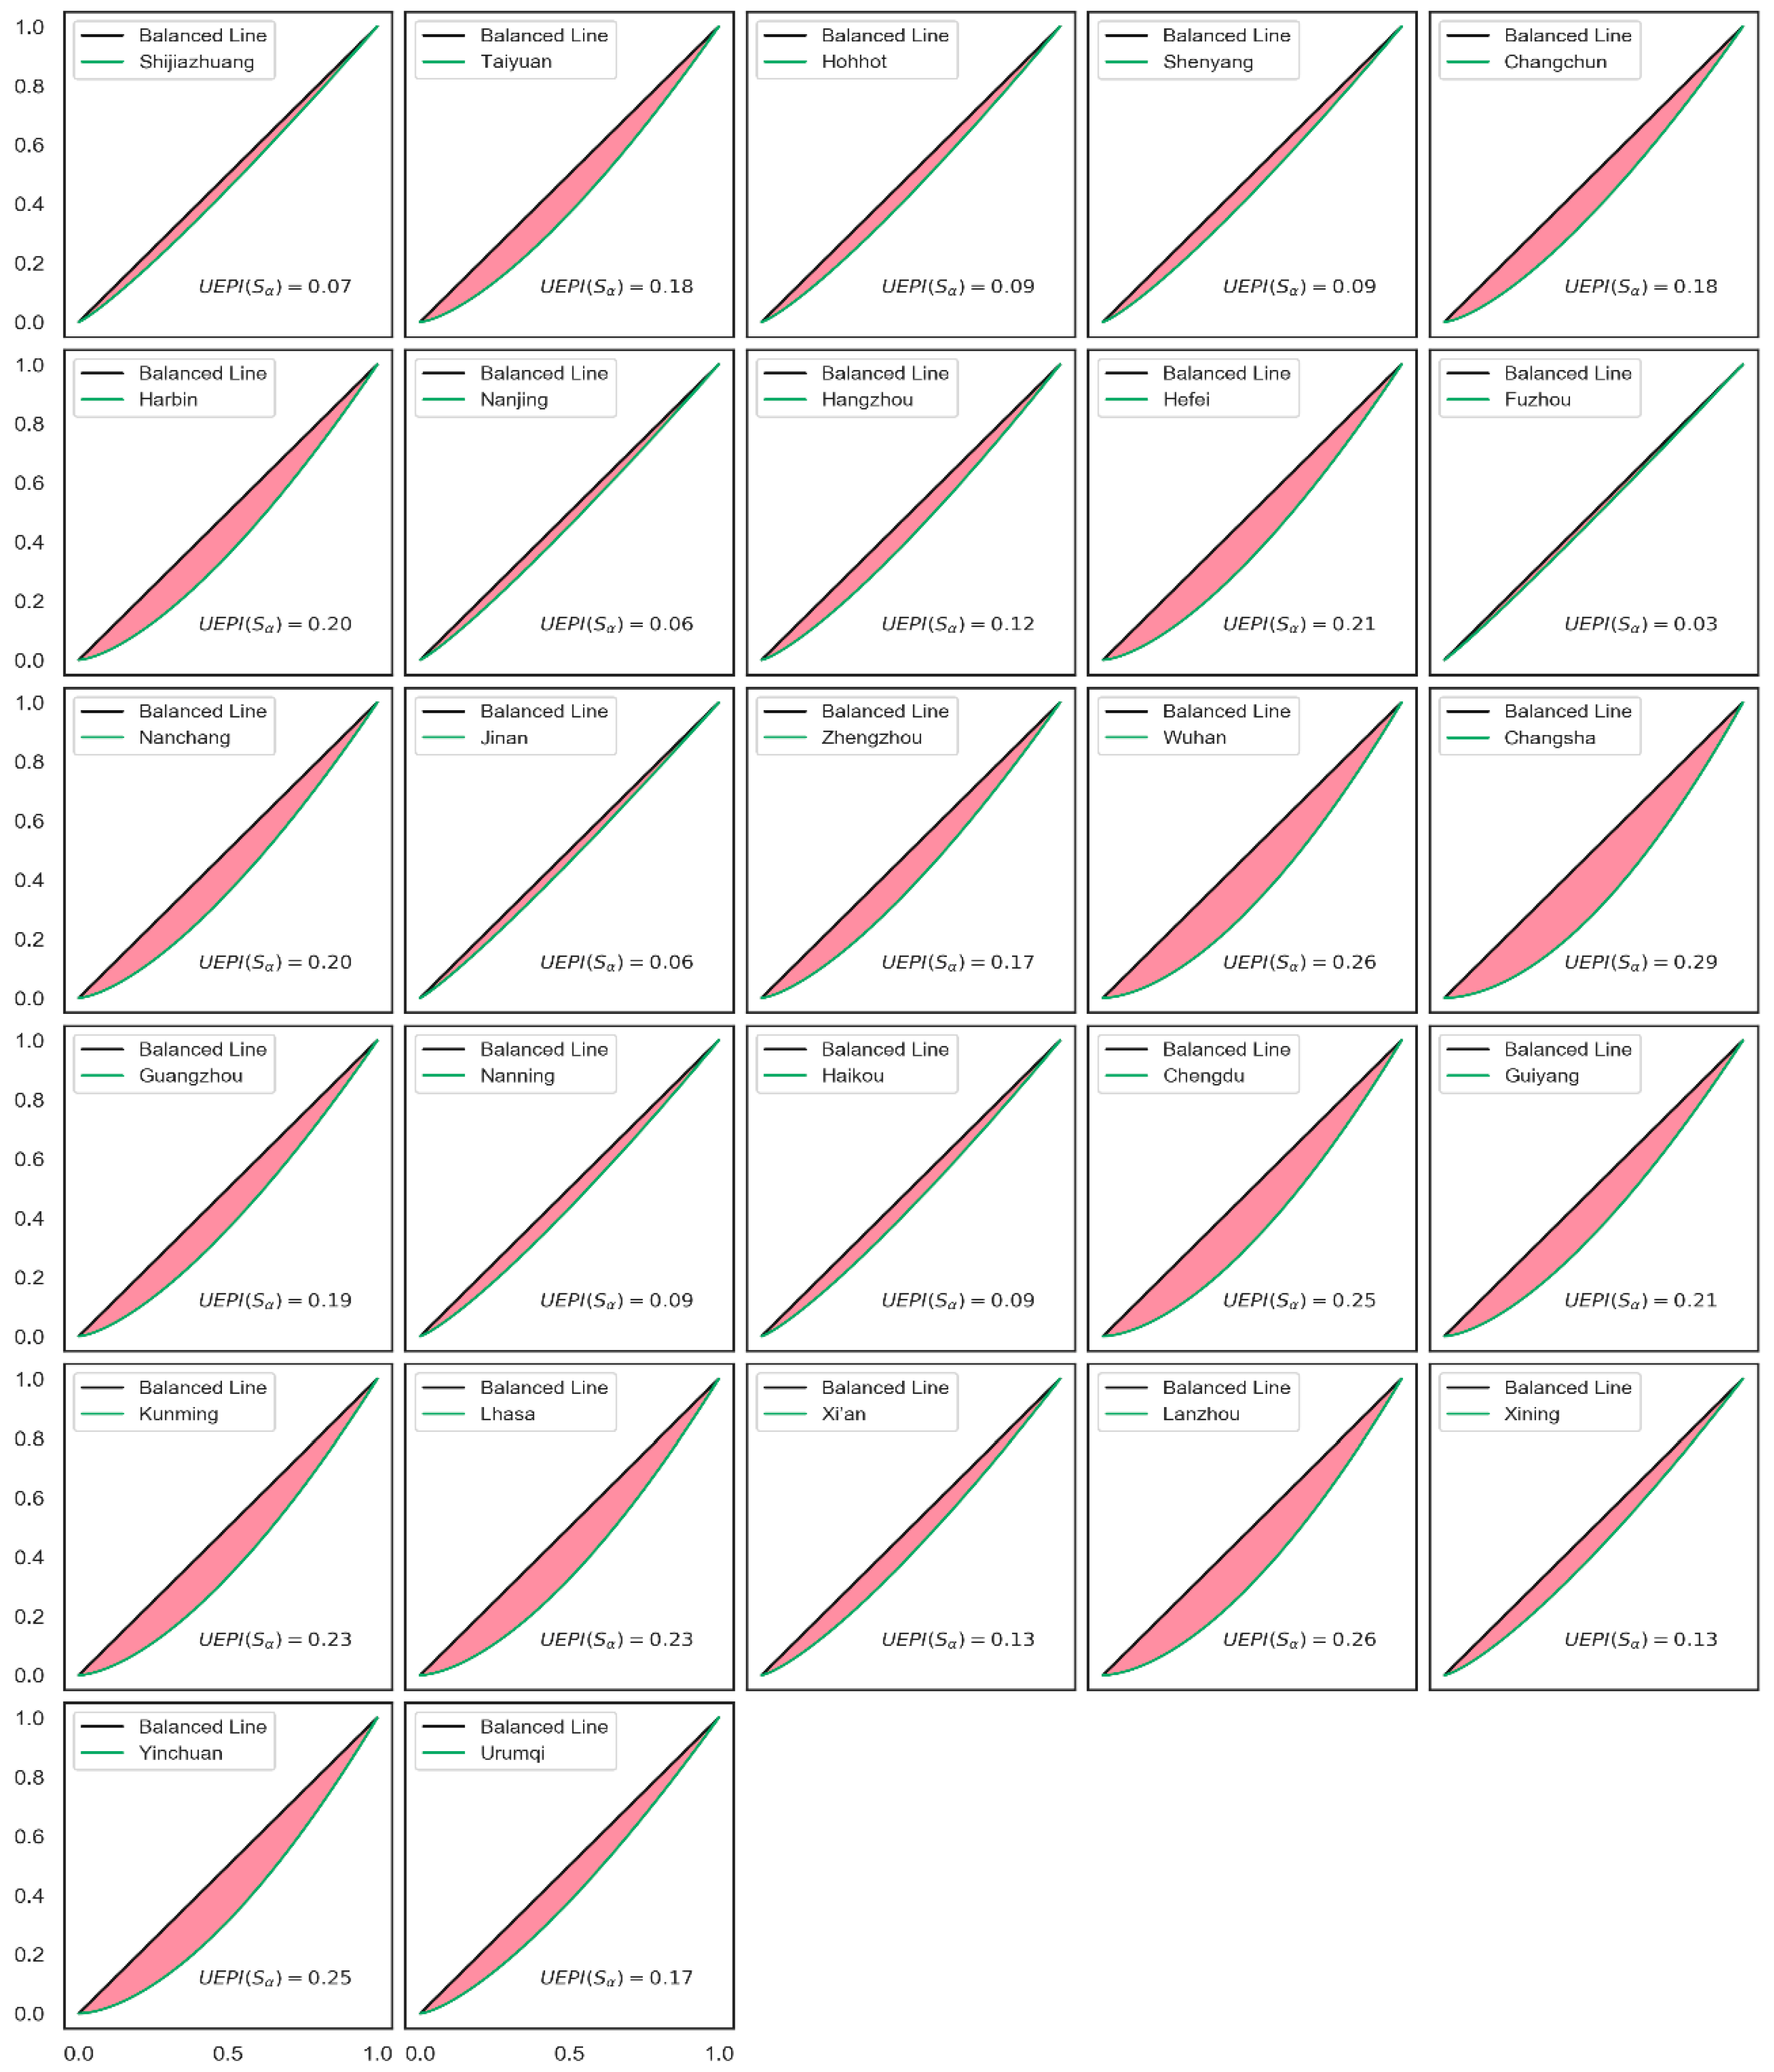
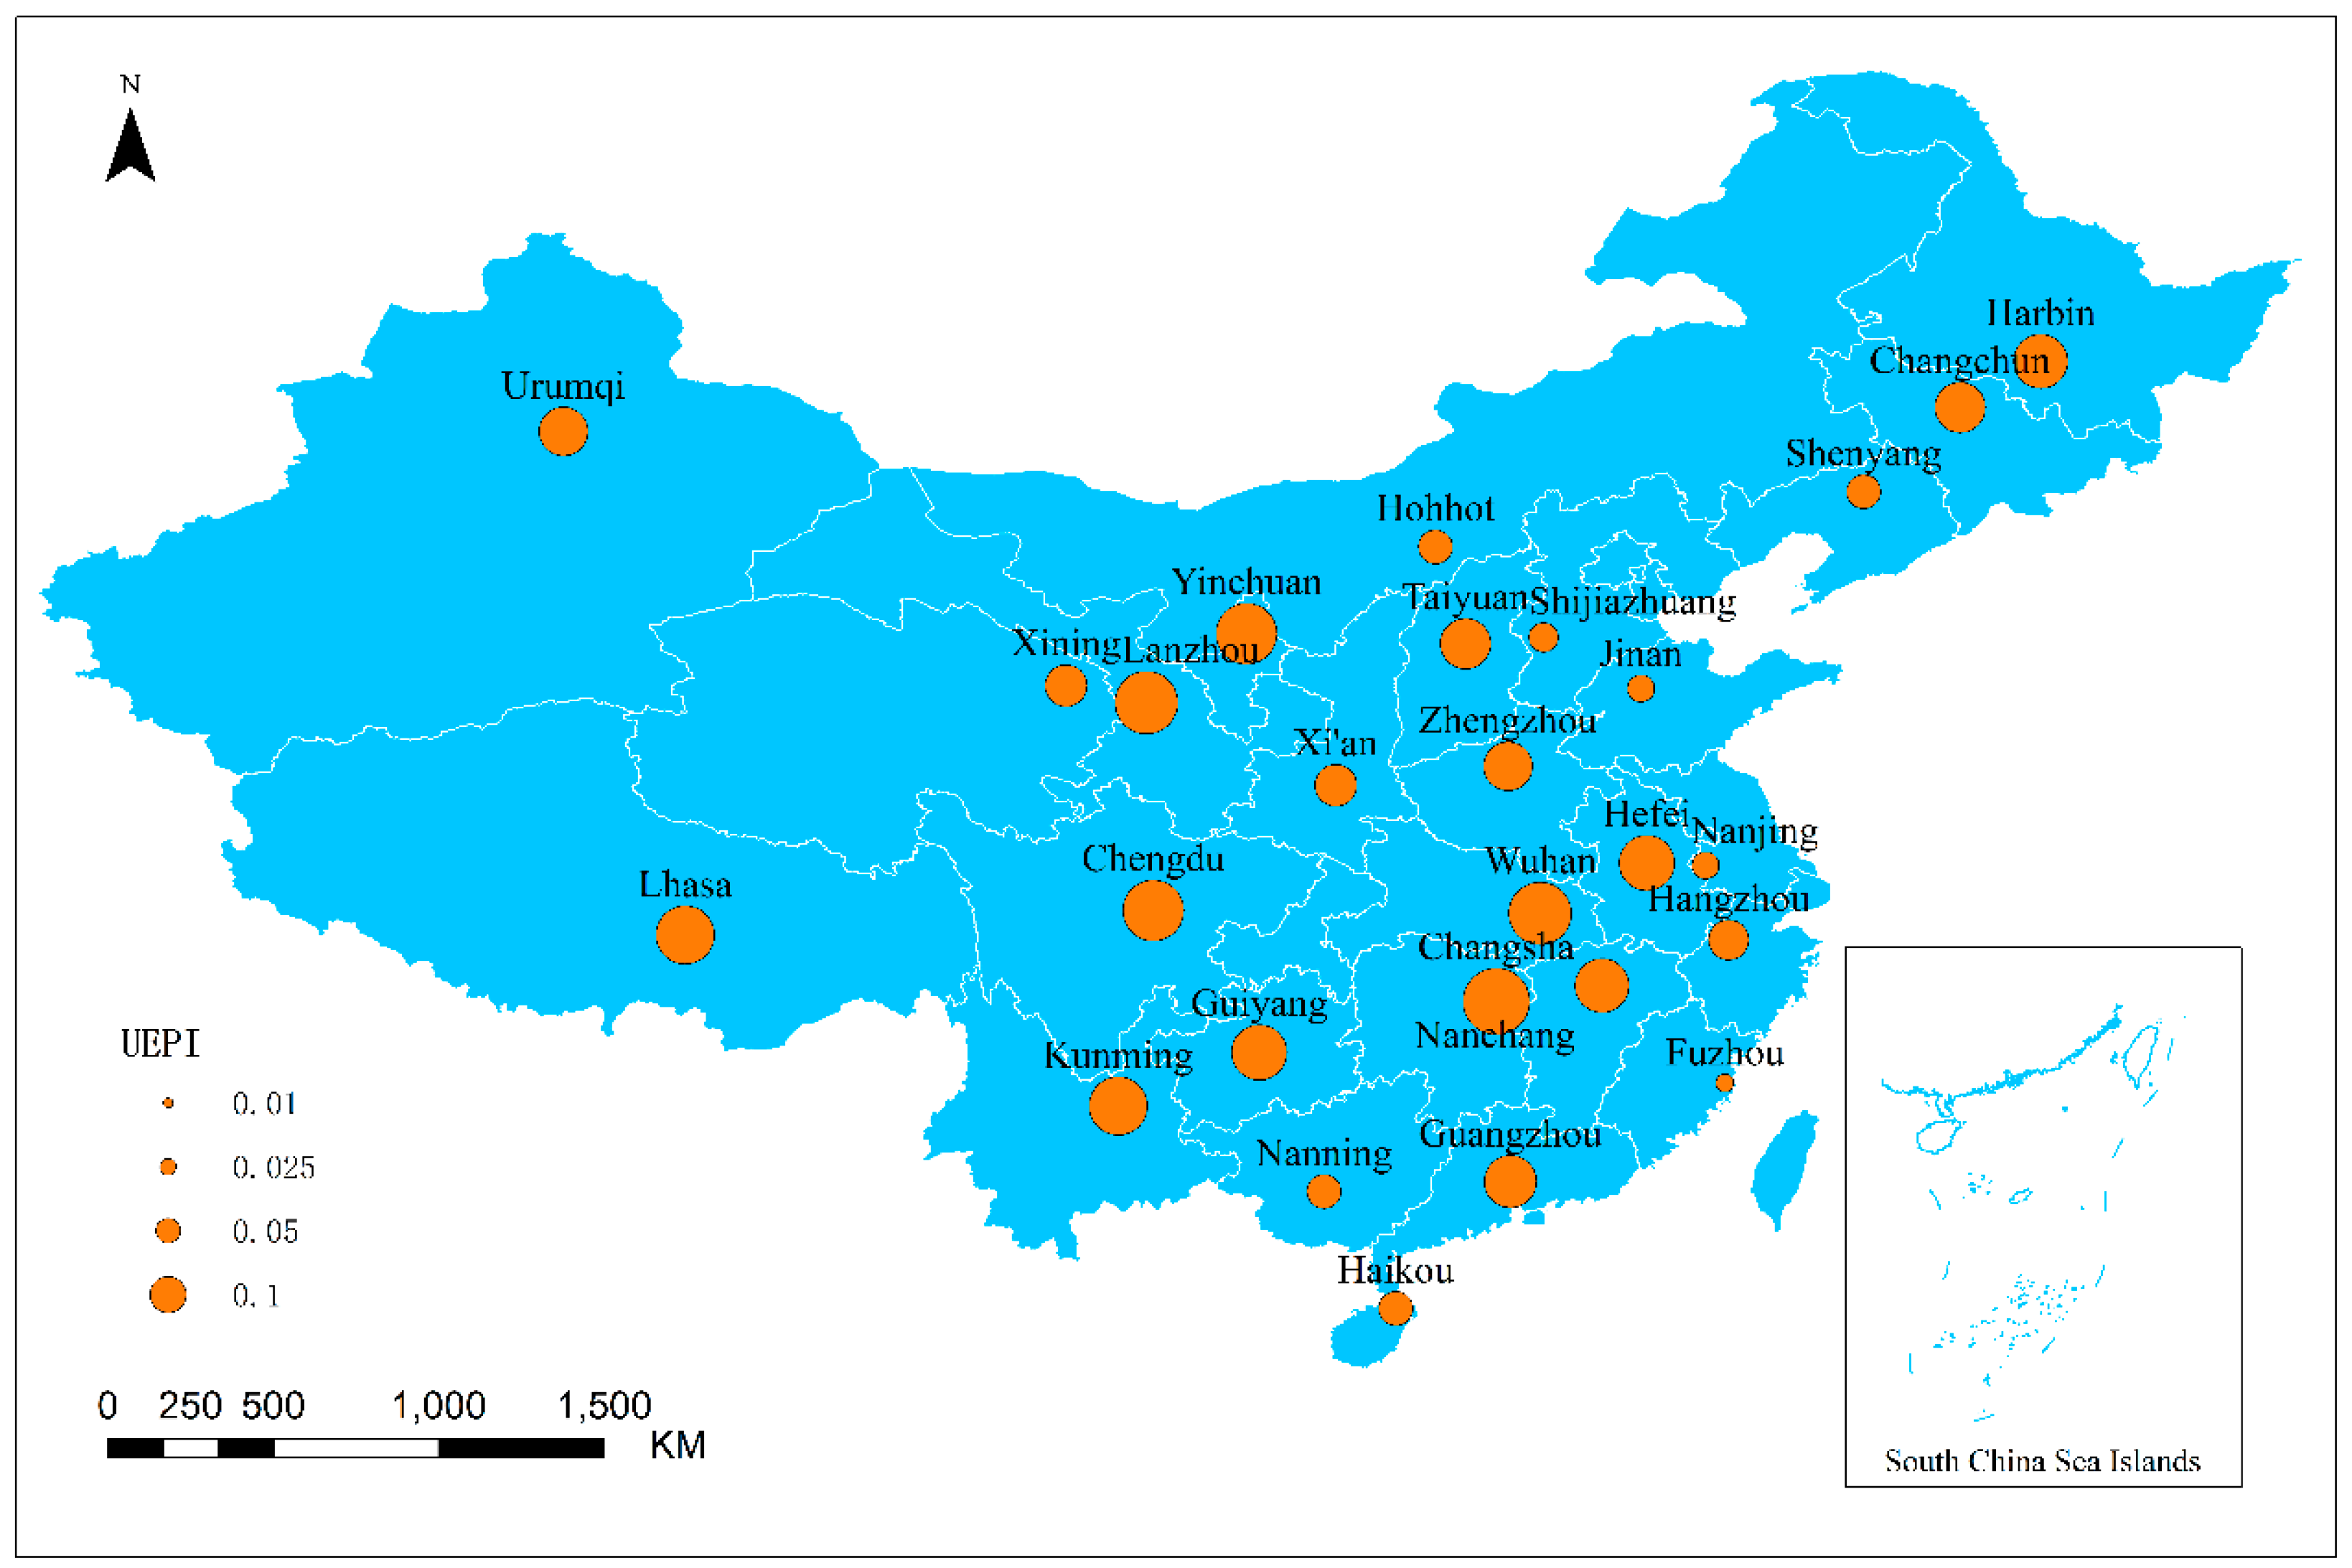
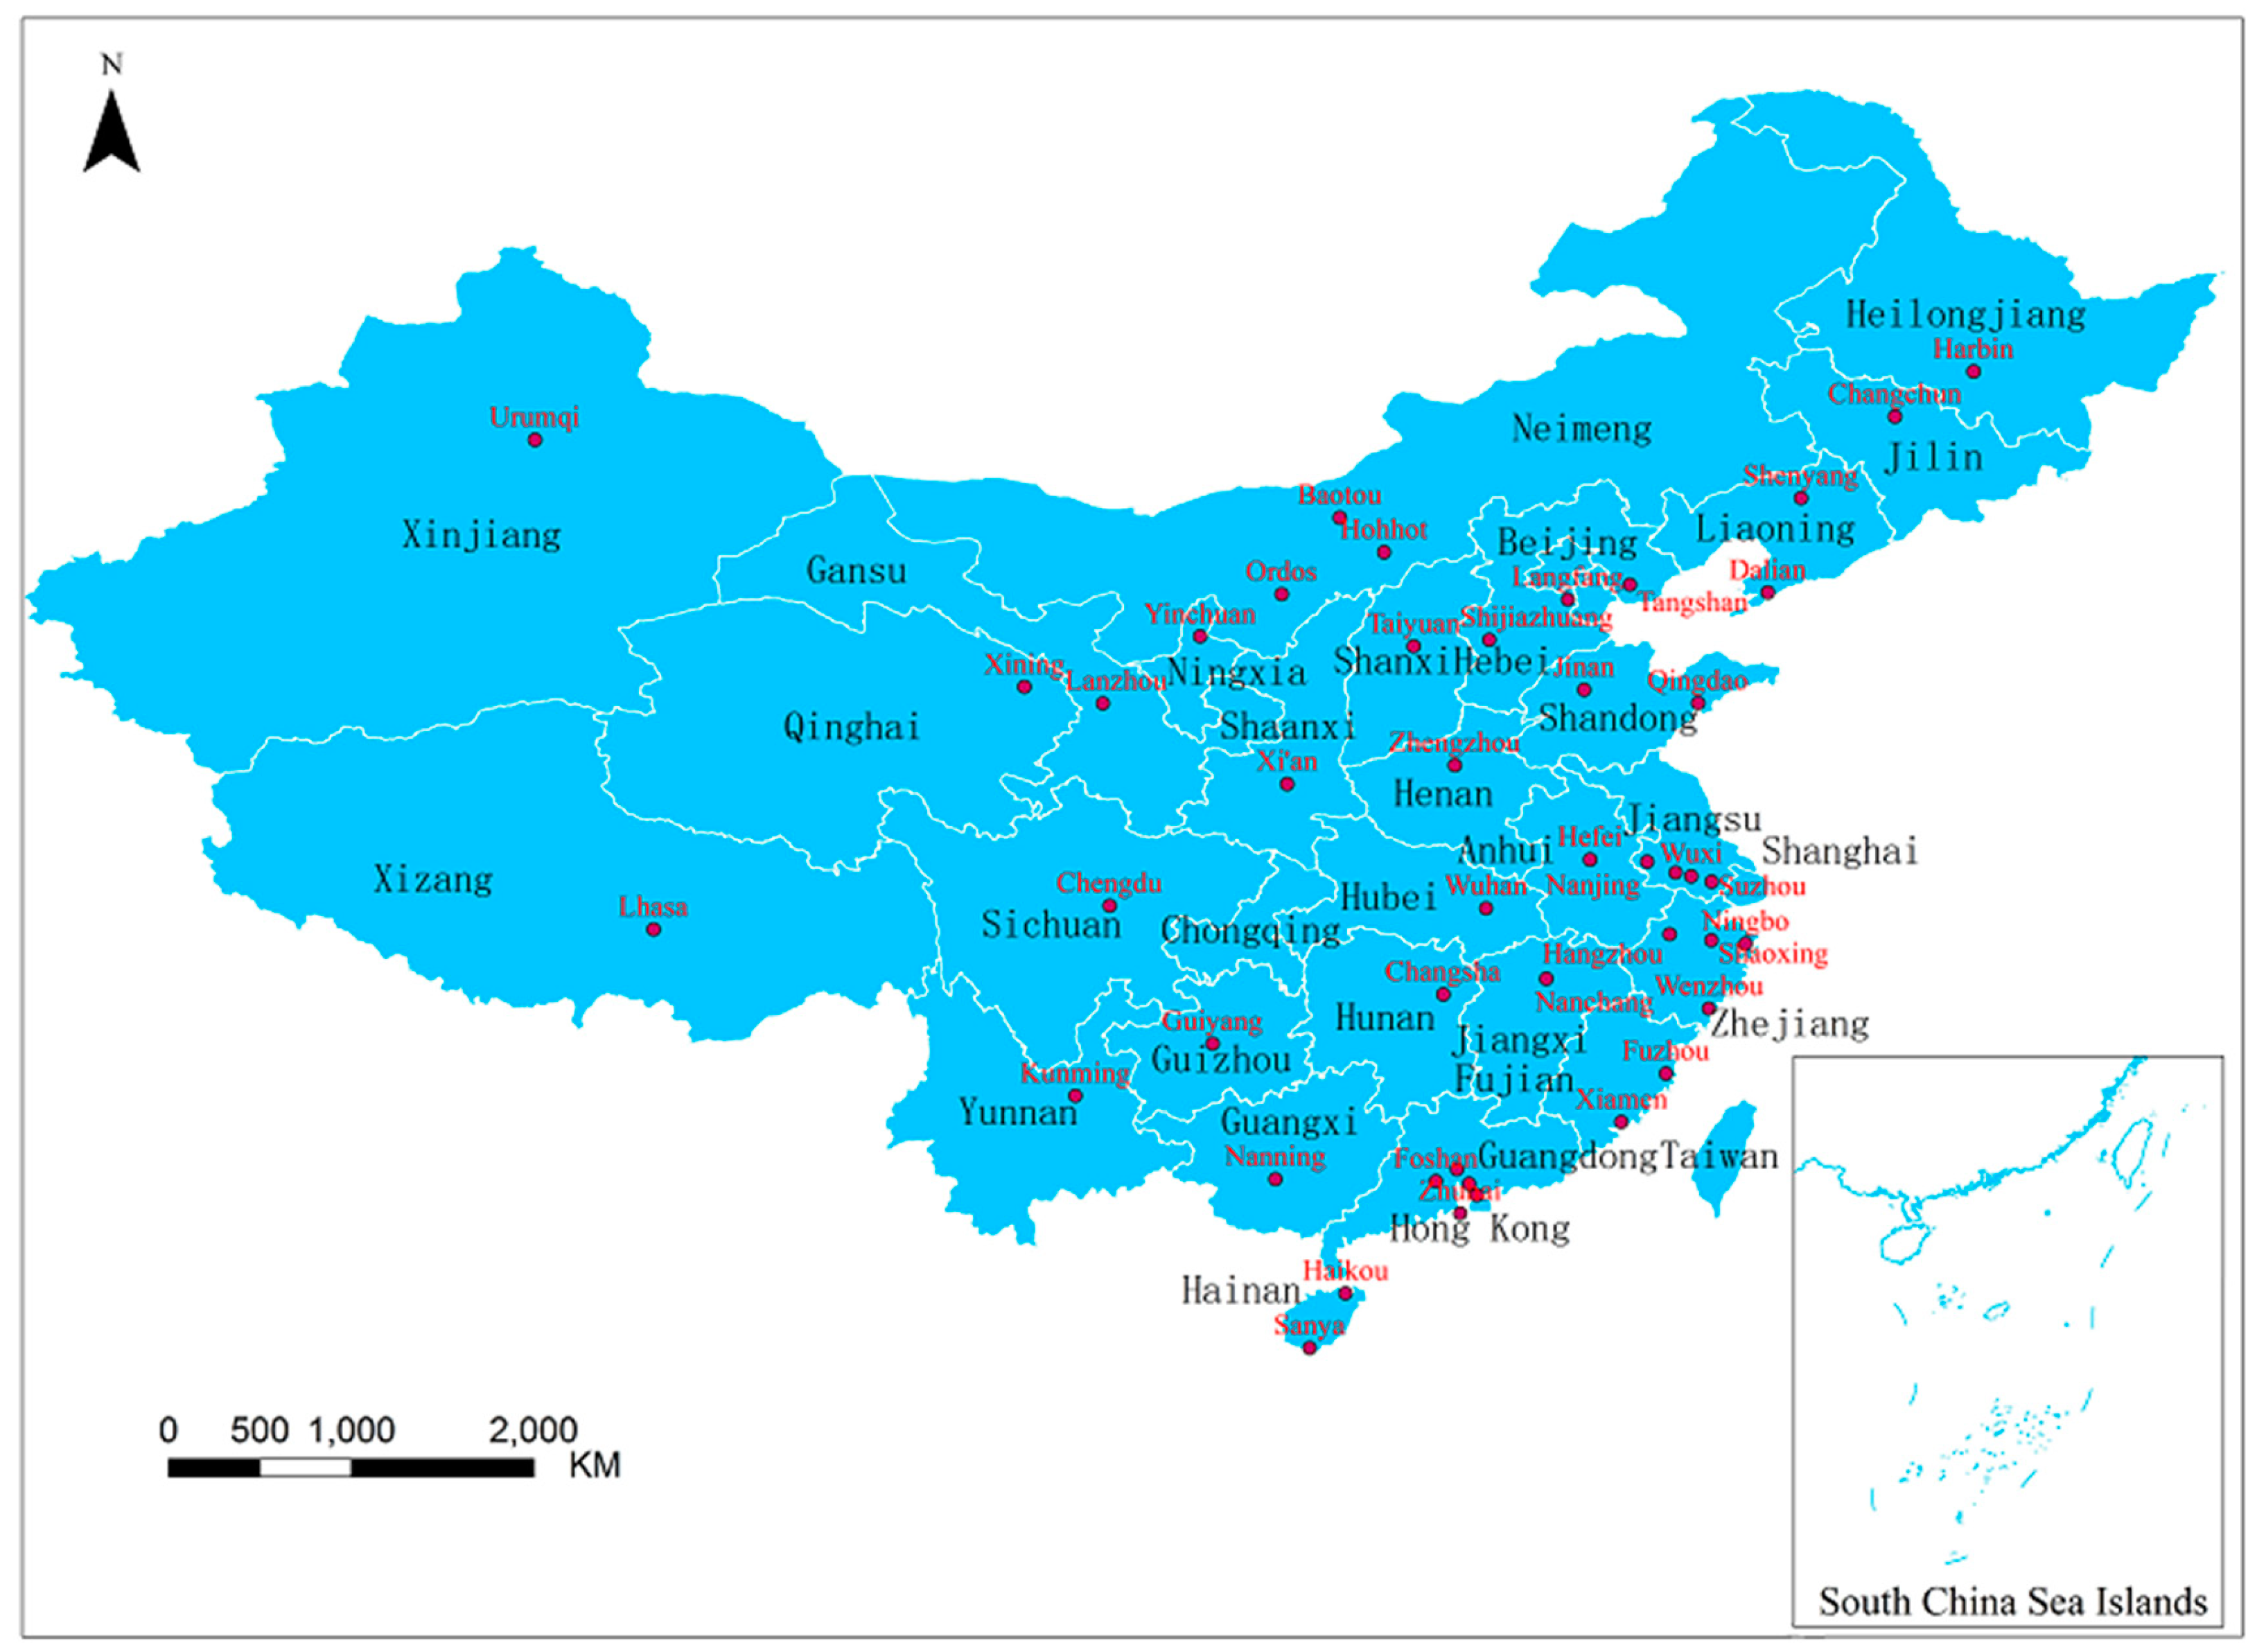
The UEPI values of 27 provincial capitals in 2016 were calculated and shown in Figure 2. The spatial location of all cities is shown in Figure 3, which facilitates the analysis of cities in combination with spatial location. Figure 4 shows that in the past 10 years, the UEPI of each city varied slightly from year to year, showing a small fluctuation trend. By comparing the values with the evaluation criteria, the economic polarization categories of cities are classified (Table 3).
From a social and economic point of view, cities in China are classified as follows: vice-provincial cities are second-tier and prefecture-level cities are third-tier. From 2015 to 2016, cities with an average GDP of more than 600 billion yuan are considered economically developed, cities with an average annual GDP of 400 to 600 billion yuan are medium-sized, and cities with an average annual GDP of fewer than 400 billion yuan are weaker. Based on this classification and combined with the current situation of economic development in the provinces, the unbalanced characteristics of different cities and their provinces can be analyzed.
Among the cities whose economic polarization is inapparent, there are three second-tier developed cities (Nanjing, Shenyang, Jinan), two third-tier medium-sized cities (Fuzhou, Shijiazhuang) and three third-tier weaker cities (Nanning, Hohhot, Haikou). The cities’ common features are that the total size of the population and GDP ranks higher, but the per capita GDP is in the middle or slightly higher in their respective provinces. Although there are other cities with weak economic strength and comprehensive productivity in their respective provinces, there are still some cities with a stronger economic status. Compared with the stronger cities, the main factors that support urban economic growth are constrained in these cities. On the one hand, the location conditions are not as good as in the stronger cities. As shown in Figure 4, Shijiazhuang in Hebei province is less well-located than Tangshan and Langfang in the Beijing-Tianjin-Tangshan metropolitan area. Nanjing is less well-located than Suzhou, Wuxi, and Changzhou, which are close to the core of the Yangtze River Delta. On the other hand, resources and environmental conditions are not as good as in other cities. For example, Hohhot is less abundant in terms of underground mineral resources than Ordos in the Inner Mongolia autonomous region and Baotou in the Hetao Plain. According to the data in 2017, the local raw coal output of Ordos is 602 million tons and the proved reserves are 15 billion tons, accounting for one-sixth of the national coal reserves [40]. Shenyang is inferior to Dalian, with a developed marine economy in Liaodong Bay. Jinan is inferior to Qingdao, which has a developed marine economy in Shandong Province. Haikou is not as rich in tourism resources as Sanya in Hainan Province. Finally, economic extroversion is worse than in other cities. For example, Fuzhou is less open than Xiamen, which has obvious economic characteristics of overseas Chinese people and strong foreign investment. In 2017, there were 1145 new foreign-invested enterprises in Xiamen, with a contract foreign investment of 32.81 billion yuan. The actual scale of foreign investment ranks first in the province [41]. Constrained by different factors, the agglomeration capacity and economic radiation of these cities are limited, resulting in a relatively balanced provincial economy.
Among the cities whose economic polarization is obvious, there are four second- and third-tier developed cities (Guangzhou, Hangzhou, Xi’an, and Zhengzhou), two second-tier medium-sized cities (Harbin, Changchun), one third-tier medium-sized city (Nanchang), and three third-tier weaker cities (Taiyuan, Urumqi, and Xining). The total scale of the urban economy and population is in the leading position in the cities’ respective provinces. However, the average per capita level is only slightly higher than the provincial average, which is not significantly different from most other cities in the province. Urban agglomeration capacity is always confronted with interference caused by competition from other cities. The cities’ agglomeration effect depends on the competitive relationship between agglomeration and interference. Because of the competitive relationship between strong agglomeration and strong interference, the urban agglomeration effect in developed areas is limited. For example, the strong agglomeration of Guangzhou is composed of many factors, including the core city of the Pearl River Delta, the southern educational and scientific research center, and the highly optimized industrial structure. At the same time, the agglomeration is also subject to the common interference of Shenzhen, Dongguan, Foshan, Zhuhai, and other cities with the same highly optimized industrial structure and prominent export-oriented characteristics. Hangzhou has a strong agglomeration force consisting of comprehensive factors such as a developed network information industry, an important educational and scientific research center in the Yangtze River Delta, and a complete modern industrial system. At the same time, it is disturbed by Ningbo, Wenzhou, Shaoxing, and other cities that have a developed marine economy and prominent export-oriented characteristics. For example, Ningbo is one of the first open coastal cities in China. In 2017, the total output value of Ningbo’s marine economy reached 470456 million yuan, accounting for 14.44% of the GDP [42]. Because of the comparative relationship between weak agglomeration and weak interference, the agglomeration effect of inland cities is also limited. This includes cities such as Xi’an, Zhengzhou, Nanchang, Taiyuan, Urumqi, and Xining with traditional industries as the main industries and slow structural upgrading, as well as cities such as Changchun and Harbin that have difficulties with industrial transformation and upgrading of declining areas. The limited agglomeration effect results in obviously polarized cities and a provincial economy with a slightly unbalanced spatial pattern.
Among the cities whose economic polarization is prominent, there are two third-tier medium-sized cities (Hefei, Kunming) and three third-tier weaker cities (Guiyang, Lhasa, Yinchuan). The population size and comprehensive output scale of these cities rank first in their provinces. Per capita GDP is more than twice that of the other regions. What these cities have in common is that their provinces are slow in terms of economic development and have difficulties with industrial transformation because of a mountainous topography, cold environment (Kunming, Guiyang, Lhasa), or long-term belonging to agricultural provinces (Hefei). By making use of relatively good policy preferences, these cities can promote industrial restructuring and upgrading as well as scientific and technological innovation to achieve faster economic growth, thus establishing relatively prominent advantages. However, at the same time, the polarization effect of these cities has also caused the obvious shrinkage of other surrounding cities due to the outflow of population, resources, and capital. The coexistence of urban polarization and urban atrophy results in the obvious imbalance of economic urbanization.
Among the cities whose economic polarization is striking, there are three second- and third-tier developed cities (Wuhan, Chengdu, Changsha) and one third-tier weaker city (Lanzhou). The total population and GDP of these cities are the highest in the province. Per capita GDP is 2–5.2 times that of the other cities. The polarization driving factors and the polarization process have policies, industrial structures, scientific and technological innovation, location, resource and environmental conditions, historical origin, and other factors in common. The resource conditions and historical origins have created large cities with relatively suitable conditions in arid areas. Resources, environmental conditions and historical origins have created large cities with relatively suitable conditions in arid areas such as Lanzhou, which benefits from irrigation by the Yellow River. Traffic location, abundant resources, and historical origins have created inland metropolitan cities such as Wuhan, which has the advantages of both Jianghan water conservancy and Beijing-Guangzhou railway transportation, and Changsha, which is on the shore of Xiangjiang River. Based on the current situation, the dominant factors promoting urban polarization are policy, planning, and institutional factors, including the Changsha development planning of “Changsha-Zhuzhou-Xiangtan Integration” and the Wuhan planning of “Building an Important Central City”. These powerful factors in the current system give these cities unparalleled agglomeration capacity, while other cities are relatively shrinking.
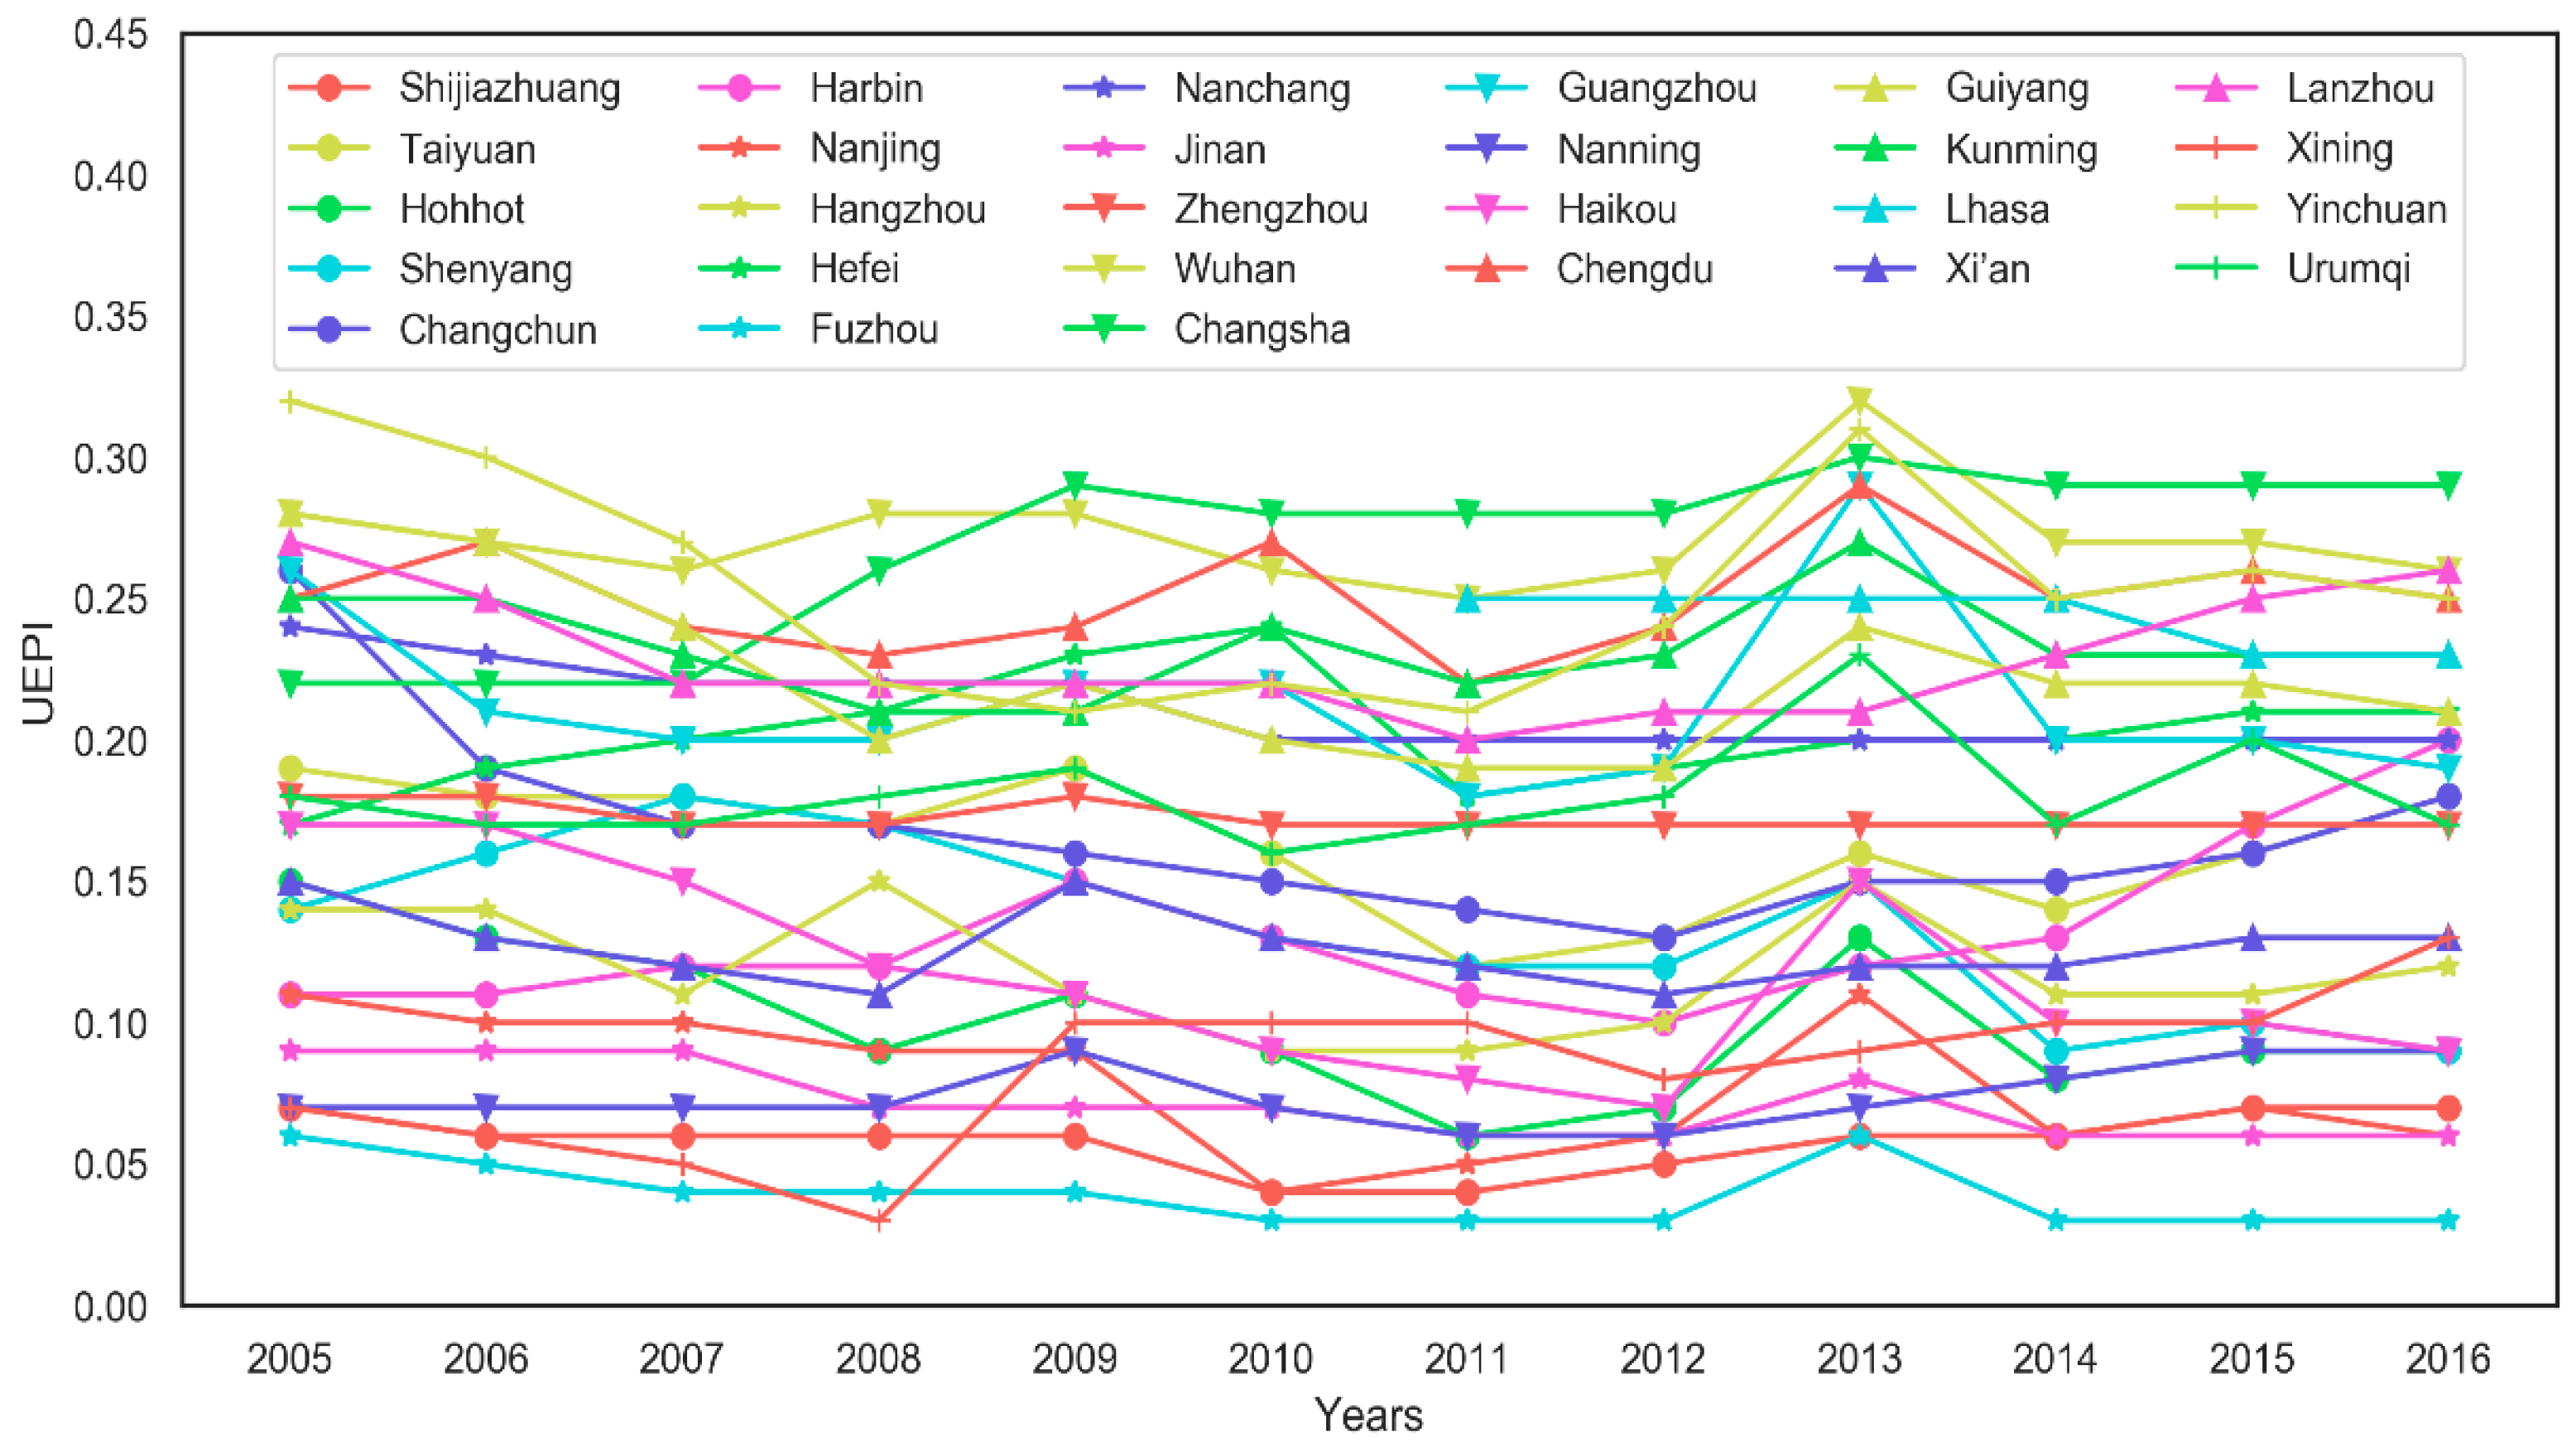
As shown in Figure 5, during the study period, the time series of the UEPI is changeable. A substantial change occurred in many of the cities only in 2008 and 2013. The choice of the urbanization path in China before 2008 was controversial. Except for a few cities showing an upward trend in the UEPI, most cities followed the idea of “controlling big cities and developing small and medium-sized towns” and exhibited a downward trend in the UEPI. Until 2008, most UEPIs were at their lowest level as a result of the global financial crisis. Subsequently, due to the active fiscal and monetary policies adopted by the government to mitigate external shocks, the UEPI of most cities rose sharply. However, a year later, the UEPI returned to a decline and was in a state of fluctuation, which reflected the short-term effect of the policy. The fluctuation also reflected the polarization and anti-polarization relationship between provincial capitals and other cities. In 2013, with the implementation of the “Integration of Urban and Rural Construction Land Market” and the “Silk Road” strategy, the UEPI in most cities rose again and then entered a volatile trend.
4. Discussion
There was no cross-category change in the UEPI of cities, which indicates that the relationship between the competitiveness of provincial capitals and other cities in their territory had been formed. From Table 4 it can be seen that the UEPI of cities has not changed much since 2008 and that it fluctuated only slightly in their respective polarization categories. This phenomenon indicates that cities with no obvious polarization were always in an equal or slightly advantageous competitive relationship in the process of economic urbanization. The steady change in the UEPI indicates that the competition relationship was relatively stable. The competition of Xi’an in the province was relatively stable, which was closely related to the implementation of the “development planning of Guanzhong Plain Urban Agglomeration” by the National Development and Reform Commission [43]. The purpose of the plan is to further enhance the comprehensive bearing capacity of Baoji, Tongchuan, Weinan, Yangling and other cities with Xi’an as the center. Under the coordinated development of these cities, the agglomeration and anti-agglomeration effect of Xi’an is stable. That the UEPI trend declined first and then rose or continued rising indicates that the competition relationship was tilting towards the provincial capital, that the imbalance situation was increasing, and that the horse-state effect was highlighted. For example, in 2007, Changsha was approved as the “national resource-saving and environment-friendly society construction comprehensive supporting reform pilot area”. Through the long-term dividend of the policy, Changsha has gradually become one of the engines of the rise of central cities. It is also reasonable to find that the degree of economic polarization in Changsha has continued to increase. In 2010, the Zhejiang provincial government approved the “development plan of Hangzhou urban economic circle” [44]. The implementation of the Hangzhou-centered policy has made the city’s economic structure transform rapidly. Especially since the new century, with the drive of Alibaba and other high-tech enterprises, the internet economy has become a new economic growth point in Hangzhou. The trend of the UEPI first rising and then falling indicates that the competition relationship was changing towards equality and moderation, which was beneficial for the balanced economy of regions. Wuhan is the core city of the Yangtze River economic belt. Relying on the opportunity to build a National Center City [45], Wuhan is constantly improving its high-level innovation ability, business logistics ability and international communication ability. However, based on the change trends in the UEPI, Wuhan’s economic polarization level had reached the threshold, and the radiation effect has become highlighted. Taking Wuhan as the fulcrum of driving the coordinated progress of Huangshi, Huanggang, Xiaogan, Tianmen and other cities makes the economy develop in a balanced direction.
There is no doubt that competition will inevitably develop among non-provincial capitals through the transmission mechanism, thus establishing their respective urban status. Cities in a region in a disadvantaged position show the status of lower agglomeration capacity, a net outflow of production factors, weak or persistent shrinkage of development, and lower economic level. This is a kind of regional relative poverty, which is more serious in Central and Western China. Compared with the micro-poverty problem involved in precise poverty alleviation, it is more difficult to solve and should be prioritized by the state and provincial governments.
In addition to the law of universality, there are often particularities. The UEPI of a few cities was rising in a straight line. While the polarization was increasing, the overall productivity and the total economic output were still growing at a high speed. This is a meaningful and complex economic issue involving the impact of special imbalances on global economic development. These problems are not deeply analyzed in this article, but this will be the direction of our efforts in the future.
5. Conclusions
In this paper, by designing the UEPI, the economic polarization level of Chinese capitals is divided into four categories: inapparent, obvious, prominent, and striking. Based on the natural and socio-economic backgrounds of the provinces, this paper diagnoses the inducing factors and mechanisms of the economic polarization of the provincial capitals. Resources and environment, policies, industrial structure, investment, scientific and technological innovation, and location and export orientation are important factors affecting economic urbanization. However, the importance of each factor affecting urban agglomeration capacity is different. Cities with the highest degree of economic extroversion have the strongest agglomeration capacity. From the perspective of location, urban agglomeration capacity in metropolitan areas is also relatively strong. This phenomenon may be related to the high degree of external dependence of China’s current economy and the agglomeration of high-tech industries in some cities.
UEPI has relative stability in provincial space and high sensitivity in time variation, which can accurately and effectively indicate the actual polarization level and its variation of the research city. The change of UEPI is consistent with the change of policy and institutional factors. The government guides the process of economic urbanization through the invisible hand such as through policies, which is a distinct feature of China’s economic urbanization. At the provincial level, the planned development model of cities with prominent and striking polarization was the result of the role played by policies and institutions. The market competition mode of cities with inapparent polarization was also the result of policy choices after weighing the comprehensive driving factors such as resources, environment, and location of cities in the region. At the national level, the changes of UEPI in most cities before 2008 showed convergence, which reveals the dominant effect of national guiding policies and planning on China’s economic urbanization. Overall, the leading role of the government has effectively promoted the process of urbanization in China’s economy.
The competitive mode of economic urbanization has an important impact on economic growth. Under different competition modes, the homogeneity and overall development level of the provincial economy are different. Cities with inapparent polarization are mostly located in eastern China. In these areas, the process of economic urbanization is not obviously dependent on preferential policies. Furthermore, the provincial capitals are in an equal and free competitive environment with other cities. The competition of this market mode not only makes the provincial capitals develop themselves but also enables the brilliant achievements of a relatively balanced provincial development and ranking at the forefront of China’s total economic output. Cities with prominent and striking polarization embody a directive and planned development model. The growth efficiency and fairness of these cities are obviously dwarfed.
Based on the fluctuation of urban polarization, it is necessary to adjust the economic policy in the process of economic urbanization. The long-term goal of the policy should be to ensure efficiency, balance, and sustainability. Policies should encourage competition and apply and protect market models. After the planned policies have achieved moderate results, these policies need to be weakened. In this way, the change in urban polarization will enter the stage of a weakening trend, which is conducive to economic equilibrium and global coordinated development.
Author Contributions
All authors contributed to the work in this paper. Conceptualization, Bingzhong Zhou; methodology, Xiangyang Cao.; software, Xiaowen Pei; investigation, Bingzhong Zhou; data curation, Xiaowen Pei; writing—original draft preparation, Bingzhong Zhou; writing—review and editing, Yishao Shi; visualization, Xiangyang Cao; supervision, Yishao Shi; project administration, Yishao Shi; funding acquisition, Yishao Shi. All authors have read and agreed to the published version of the manuscript.
Funding
This paper was funded by the projects for the China National R&D Program (No. 2017YFA0603102) and one of the key projects for Shanghai General Land Use Planning Revision (2015(D)-002(F)-11).
Conflicts of Interest
The authors declare no conflict of interest.
References
- Brueckner, J.K. Analyzing third world urbanization: A model with empirical evidence. Econ. Dev. Cult. Chang. 1990, 38, 587–610. [Google Scholar] [CrossRef]
- Kasarda, J.D.; Crenshaw, E.M. Third world urbanization: Dimensions, theories, and determinants. Annu. Rev. Sociol. 1991, 17, 467–501. [Google Scholar] [CrossRef] [PubMed]
- Pacione, M. Urban Geography: A Global Perspective; Routledge: London, UK; Taylor & Francis Group: New York, NY, USA, 2013. [Google Scholar]
- Nations, U. World Urbanization Prospects: The 2018 Revision; United Nations Department of Economic and Social Affairs: New York, NY, USA, 2018. [Google Scholar]
- Seto, K.C.; Güneralp, B.; Hutyra, L.R. Global forecasts of urban expansion to 2030 and direct impacts on biodiversity and carbon pools. Proc. Natl. Acad. Sci. USA 2012, 109, 16083–16088. [Google Scholar] [CrossRef] [PubMed] [Green Version]
- Schneider, A.; Mertes, C.; Tatem, A.; Tan, B.; Sulla-Menashe, D.; Graves, S.; Patel, N.; Horton, J.; Gaughan, A.; Rollo, J. A new urban landscape in East–Southeast Asia, 2000–2010. Environ. Res. Lett. 2015, 10, 034002. [Google Scholar] [CrossRef]
- Rimal, B.; Zhang, L.; Stork, N.; Sloan, S.; Rijal, S. Urban expansion occurred at the expense of agricultural lands in the tarai region of Nepal from 1989 to 2016. Sustainability 2018, 10, 1341. [Google Scholar] [CrossRef] [Green Version]
- Jiao, L. Urban land density function: A new method to characterize urban expansion. Landsc. Urban Plan. 2015, 139, 26–39. [Google Scholar] [CrossRef]
- Bradshaw, Y.W. Urbanization and underdevelopment: A global study of modernization, urban bias, and economic dependency. Am. Sociol. Rev. 1987, 52, 224–239. [Google Scholar] [CrossRef]
- Li, Y.; Jia, L.; Wu, W.; Yan, J.; Liu, Y. Urbanization for rural sustainability–rethinking China’s urbanization strategy. J. Clean. Prod. 2018, 178, 580–586. [Google Scholar] [CrossRef]
- Yang, Y.; Liu, J.; Zhang, Y. An analysis of the implications of China’s urbanization policy for economic growth and energy consumption. J. Clean. Prod. 2017, 161, 1251–1262. [Google Scholar] [CrossRef]
- Lang, W.; Long, Y.; Chen, T.; Li, X. Reinvestigating China’s urbanization through the lens of allometric scaling. Phys. A Stat. Mech. Appl. 2019, 525, 1429–1439. [Google Scholar] [CrossRef]
- Rondinelli, D.A. Population distribution and economic development in Africa: The need for urbanization policies. Popul. Res. Policy Rev. 1985, 4, 173–196. [Google Scholar] [CrossRef]
- Zhang, P. Urban Regeneration: Theory and Practice in China’s New Urbanization. City Plan. Rev. 2004, 4, 7. [Google Scholar]
- Cheshire, P. A new phase of urban development in Western Europe? The evidence for the 1980s. Urban Stud. 1995, 32, 1045–1063. [Google Scholar] [CrossRef]
- Scott, A.J. Industrialization and urbanization: A geographical agenda. Ann. Assoc. Am. Geogr. 1986, 76, 25–37. [Google Scholar] [CrossRef]
- Shahbaz, M.; Lean, H.H. Does financial development increase energy consumption? The role of industrialization and urbanization in Tunisia. Energy Policy 2012, 40, 473–479. [Google Scholar] [CrossRef] [Green Version]
- Gollin, D.; Jedwab, R.; Vollrath, D. Urbanization with and without industrialization. J. Econ. Growth 2016, 21, 35–70. [Google Scholar] [CrossRef]
- Allington, G.R.H.; Li, W.; Brown, D.G. Urbanization and environmental policy effects on the future availability of grazing resources on the Mongolian Plateau: Modeling socio-environmental system dynamics. Environ. Sci. Policy 2017, 68, 35–46. [Google Scholar] [CrossRef] [Green Version]
- Dorning, M.A.; Koch, J.; Shoemaker, D.A.; Meentemeyer, R.K. Simulating urbanization scenarios reveals tradeoffs between conservation planning strategies. Landsc. Urban Plan. 2015, 136, 28–39. [Google Scholar] [CrossRef] [Green Version]
- Behera, S.R.; Dash, D.P. The effect of urbanization, energy consumption, and foreign direct investment on the carbon dioxide emission in the SSEA (South and Southeast Asian) region. Renew. Sustain. Energy Rev. 2017, 70, 96–106. [Google Scholar] [CrossRef]
- Wu, Y.; Chen, C. The impact of foreign direct investment on urbanization in China. J. Asia Pac. Econ. 2016, 21, 339–356. [Google Scholar] [CrossRef]
- Shi, L.; Taubenböck, H.; Zhang, Z.; Liu, F.; Wurm, M. Urbanization in China from the end of 1980s until 2010–spatial dynamics and patterns of growth using EO-data. Int. J. Digit. Earth 2019, 12, 78–94. [Google Scholar] [CrossRef]
- Antoni, J.-P.; Vuidel, G.; Omrani, H.; Klein, O. Geographic Cellular Automata for Realistic Urban form Simulations: How Far Should the Constraint be Contained? In The Mathematics of Urban Morphology; Springer: Berlin/Heidelberg, Germany, 2019; pp. 147–162. [Google Scholar]
- Tong, X.; Feng, Y. How current and future urban patterns respond to urban planning? An integrated cellular automata modeling approach. Cities 2019, 92, 247–260. [Google Scholar] [CrossRef]
- Wu, J.; Jenerette, G.D.; Buyantuyev, A.; Redman, C.L. Quantifying spatiotemporal patterns of urbanization: The case of the two fastest growing metropolitan regions in the United States. Ecol. Complex. 2011, 8, 1–8. [Google Scholar] [CrossRef]
- Xu, X.; Min, X. Quantifying spatiotemporal patterns of urban expansion in China using remote sensing data. Cities 2013, 35, 104–113. [Google Scholar] [CrossRef]
- Li, X.; Gong, P. Urban growth models: Progress and perspective. Sci. Bull. 2016, 61, 1637–1650. [Google Scholar] [CrossRef]
- Kafy, A.A.; Ferdous, L.; Faisal, A.A.; Khan, H.A.H.; Sheel, P.K. Exploring The Association of Surface Water Body Change and Rapid Urbanization in Rajshahi City Corporation (RCC) Area Using RS and GIS. In Proceedings of the 1st National Conference on Water Resources Engineering (NCWRE), Chittagong, Bangladesh, 21–22 March 2018. [Google Scholar]
- Farhan, Y.; Al-Shawamreh, S. Impact of Rapid Urbanization and Changing Housing Patterns on Urban Open Public Spaces of Amman, Jordan: A GIS and RS Perspective. J. Environ. Prot. 2019, 10, 57–79. [Google Scholar] [CrossRef] [Green Version]
- Wan, L.; Zhang, Y.; Qi, S.; Li, H.; Chen, X.; Zang, S. A study of regional sustainable development based on GIS/RS and SD model—Case of Hadaqi industrial corridor. J. Clean. Prod. 2017, 142, 654–662. [Google Scholar] [CrossRef]
- Tolley, G.S.; Graves, P.E.; Garner, J.L. Urban Growth Policy in a Market Economy; Academic Press: New York, NY, USA, 1979. [Google Scholar]
- Yuan, Z.; Bi, J.; Moriguichi, Y. The Circular Economy: A New Development Strategy in China. J. Ind. Ecol. 2006, 10, 5. [Google Scholar] [CrossRef] [Green Version]
- Jefferson, M. The Law of the Primate City. Geogr. Rev. 1939, 29, 226–232. [Google Scholar] [CrossRef]
- Shi, Y.; Cao, X.; Shi, D.; Wang, Y. The “one-city monopoly index”: Measurement and empirical analysis of China. Cities 2020, 96, 102434. [Google Scholar] [CrossRef]
- Zhou, Y. On the relationship between urbanization and gross national product. Chin. Sociol. Anthropol. 1988, 21, 3–16. [Google Scholar]
- Christopoulos, K.A.; Hartogensis, W.; Glidden, D.V.; Pilcher, C.D.; Gandhi, M.; Geng, E.H. Limitations of using the Lorenz curve framework to understand the distribution of population viral load: authors’ reply. AIDS 2017, 31, 742–743. [Google Scholar] [CrossRef] [PubMed]
- Folch, D.C.; Rey, S.J. The centralization index: A measure of local spatial segregation. Pap. Reg. Sci. 2016, 95, 555–576. [Google Scholar] [CrossRef]
- Abdul-Sathar, E.I.; Renjini, K.R.; Rajesh, G.; Jeevanand, E.S. Bayes estimation of Lorenz curve and Gini-index for power function distribution. S. Afr. Stat. J. 2015, 49, 21–33. [Google Scholar]
- Ordos Municipal People’s Government. Into Erdos. Available online: http://www.ordos.gov.cn/zjordos/zrzy/ (accessed on 12 September 2019). (In Chinese)
- Ministry of Commerce of the People’s Republic of China Special Commissioner’s Office in Fuzhou. In 2017, Xiamen’s Actual Use of Foreign Capital Ranked First in the Province. Available online: http://fztb.mofcom.gov.cn/article/ae/ag/201802/20180202714824.shtml (accessed on 5 September 2019).
- Xinhua Net. Ningbo: Proofing for the Development of Marine Economy. Available online: http://www.xinhuanet.com//fortune/2018-09/17/c_1123443848.htm (accessed on 10 September 2019). (In Chinese).
- National Development and Reform Commission. Development Planning of Guanzhong Plain Urban Agglomeration. Available online: http://www.ndrc.gov.cn/fzgggz/fzgh/zcfg/201802/t20180207_876919.html (accessed on 10 September 2019). (In Chinese)
- Zhejiang Provincial People’s Government. Development Plan of Hangzhou Urban Economic Circle. Available online: https://www.pishu.com.cn/skwx_ps/literature/896762.html (accessed on 7 September 2019). (In Chinese).
- National Development and Reform Commission. To Promote the Rise of Central China “13th Five-Year”. Available online: http://www.ndrc.gov.cn/zcfb/zcfbtz/201612/t20161226_832527.html (accessed on 10 September 2019). (In Chinese)
Figure 1.
Geometric representation of the urban economic polarization phenomenon.

Figure 2.
The urban economic polarization index (UEPI) of 27 provincial capitals in 2016.

Figure 3.
Urban spatial distribution and the latest UEPI.

Figure 4.
The urban location map used in the analysis.

Figure 5.
Change trends in the UEPI of cities from 2005 to 2016.


Table 1.
GDP and population of some provincial capitals and the corresponding provinces or autonomous prefectures.
Table 1.
GDP and population of some provincial capitals and the corresponding provinces or autonomous prefectures.
| No | City/Province | GDP (100 Million Yuan) | Population (10,000 People) | ||||||
|---|---|---|---|---|---|---|---|---|---|
| 2010 | 2012 | 2014 | 2016 | 2010 | 2012 | 2014 | 2016 | ||
| 1 | Lanzhou | 1100.39 | 1563.82 | 2000.94 | 2264.23 | 323.56 | 362.20 | 365.33 | 369.93 |
| Gansu | 4120.75 | 5650.20 | 6836.82 | 7200.37 | 2557.41 | 2570.84 | 2586.47 | 2604.77 | |
| 2 | Xi’an | 3241.49 | 4366.10 | 5492.64 | 6257.18 | 845.44 | 853.32 | 861.00 | 876.88 |
| Shanxi | 10,123.48 | 14,453.68 | 17,689.94 | 19,399.59 | 3731.06 | 3747.97 | 3769.51 | 3802.72 | |
| 3 | Yinchuan | 769.42 | 1150.93 | 1388.62 | 1617.71 | 185.31 | 203.60 | 210.58 | 217.76 |
| Ningxia | 1689.65 | 2341.29 | 2752.10 | 3168.59 | 629.06 | 643.32 | 657.86 | 671.40 | |
| 4 | Xining | 628.28 | 851.09 | 1065.78 | 1248.17 | 221.01 | 223.77 | 227.92 | 232.19 |
| Qinghai | 1350.43 | 1893.54 | 2303.32 | 2572.49 | 560.00 | 570.67 | 580.61 | 590.96 | |
| 5 | Guiyang | 1121.82 | 1700.30 | 2497.27 | 3157.70 | 430.52 | 442.25 | 453.90 | 465.93 |
| Guizhou | 4602.16 | 6852.20 | 9266.39 | 11,776.73 | 3508.01 | 3476.51 | 3505.08 | 3542.30 | |
| 6 | Chengdu | 5551.33 | 8138.94 | 10,056.59 | 12,170.23 | 1144.37 | 1412.42 | 1436.27 | 1581.37 |
| Sichuan | 17,185.48 | 23,872.80 | 28,536.66 | 32,934.54 | 8113.25 | 8062.96 | 8123.62 | 8233.02 | |
| 7 | Wuhan | 5565.93 | 8003.82 | 10,069.48 | 11,912.61 | 944.00 | 1007.00 | 1027.50 | 1068.69 |
| Hubei | 15,967.61 | 22,250.45 | 27,379.22 | 32,665.38 | 5721.93 | 5768.55 | 5807.45 | 5868.21 | |
| 8 | Changsha | 4547.06 | 6399.91 | 27,627.33 | 9356.91 | 684.35 | 711.87 | 515.71 | 753.85 |
| Hunan | 16,037.96 | 22,154.23 | 27,037.32 | 31,551.37 | 6488.11 | 6617.15 | 6713.84 | 6802.50 | |
| 9 | Changchun | 3329.03 | 4456.64 | 5342.43 | 5986.42 | 757.70 | 759.34 | 753.61 | 753.63 |
| Jilin | 8667.58 | 11,939.24 | 13,803.14 | 14,776.80 | 2742.99 | 2750.03 | 2751.82 | 2743.15 | |
| 10 | Harbin | 3664.85 | 4550.22 | 5340.07 | 6101.61 | 991.81 | 993.28 | 991.25 | 961.72 |
| Heilongjiang | 10,368.60 | 13,691.58 | 15,039.38 | 15,386.09 | 3829.44 | 3834.00 | 3834.03 | 3805.42 | |
Table 2.
Reference criteria for urban economic polarization levels.
| Polarization Category | Reference Range of UEPI | Characteristics | Reference City |
|---|---|---|---|
| inapparent | The comprehensive productivity is roughly balanced with the provincial economy; the effect of industrial agglomeration is roughly equal to that of the province; the urban economy has no advantages in the province. | Shijiazhuang, Nanning | |
| obvious | The urban comprehensive productivity is obviously higher than the average of other regions; the accumulation rate of economic wealth is relatively fast; the driving force of economic urbanization is relatively strong; the effect of urban economic agglomeration is obvious. | Changchun, Urumqi | |
| prominent | The effect of the industrial agglomeration is much higher than that of other areas; the cities often have high comprehensive productivity and outstanding advantages. | Hefei | |
| striking | The driving effect of economic urbanization is outstanding; the industrial agglomeration capacity is strong; the spillover effect of the urban economy is prominent; the cities have unparalleled advantages in their regions. | Wuhan |
Table 3.
Evaluation results of urban economic polarization.
| Polarization Category | Reference Range of the UEPI | City |
|---|---|---|
| inapparent | Shijiazhuang, Hohhot, Shenyang, Nanjing, Fuzhou, Jinan, Nanning, Haikou | |
| obvious | Taiyuan, Changchun, Harbin, Hangzhou, Nanchang, Zhengzhou, Guangzhou, Xi’an, Urumqi, Xining | |
| prominent | Yinchuan, Hefei, Guiyang, Kunming, Lhasa | |
| striking | Lanzhou, Chengdu, Changsha, Wuhan |
Table 4.
Classification of urban economic polarization and trends in the UEPI changes.
| Classification Trend | Inapparent | Obvious | Prominent | Striking |
|---|---|---|---|---|
| continuously rise | Changsha, Xining | |||
| first decrease and then rise | Shijiazhuang, Hohhot, Nanning, Haikou | Taiyuan, Changchun, Harbin, Hangzhou | Hefei | Lanzhou |
| stable | Xi’an | |||
| smooth after the fall | Nanjing, Fuzhou | Nanchang, Zhengzhou | Yinchuan, Guiyang, Kunming | Chengdu, Lhasa |
| first rise and then fall | Urumqi, Guangzhou | Wuhan | ||
| continuously decline | Shenyang, Jinan |
© 2019 by the authors. Licensee MDPI, Basel, Switzerland. This article is an open access article distributed under the terms and conditions of the Creative Commons Attribution (CC BY) license (http://creativecommons.org/licenses/by/4.0/).
Share and Cite
MDPI and ACS Style
Cao, X.; Zhou, B.; Shi, Y.; Pei, X. The Unbalanced Analysis of Economic Urbanization—A Case Study of Typical Cities in China. ISPRS Int. J. Geo-Inf. 2020, 9, 13. https://0-doi-org.brum.beds.ac.uk/10.3390/ijgi9010013
AMA Style
Cao X, Zhou B, Shi Y, Pei X. The Unbalanced Analysis of Economic Urbanization—A Case Study of Typical Cities in China. ISPRS International Journal of Geo-Information. 2020; 9(1):13. https://0-doi-org.brum.beds.ac.uk/10.3390/ijgi9010013
Chicago/Turabian StyleCao, Xiangyang, Bingzhong Zhou, Yishao Shi, and Xiaowen Pei. 2020. "The Unbalanced Analysis of Economic Urbanization—A Case Study of Typical Cities in China" ISPRS International Journal of Geo-Information 9, no. 1: 13. https://0-doi-org.brum.beds.ac.uk/10.3390/ijgi9010013
Note that from the first issue of 2016, this journal uses article numbers instead of page numbers. See further details here.