Evaluation of Augmented Reality-Based Building Diagnostics Using Third Person Perspective


1
Department of Computer and Geospatial Sciences, University of Gävle, 801 76 Gävle, Sweden
2
Centre for Image Analysis, Uppsala University, 751 05 Uppsala, Sweden
*
Author to whom correspondence should be addressed.
ISPRS Int. J. Geo-Inf. 2020, 9(1), 53; https://0-doi-org.brum.beds.ac.uk/10.3390/ijgi9010053
Submission received: 27 November 2019
/
Revised: 2 January 2020
/
Accepted: 13 January 2020
/
Published: 16 January 2020
(This article belongs to the Special Issue Advances in Augmented Reality and Virtual Reality for Smart Cities)
Abstract
:Comprehensive user evaluations of outdoor augmented reality (AR) applications in the architecture, engineering, construction and facilities management (AEC/FM) industry are rarely reported in the literature. This paper presents an AR prototype system for infrared thermographic façade inspection and its evaluation. The system employs markerless tracking based on image registration using natural features and a third person perspective (TPP) augmented view displayed on a hand-held smart device. We focus on evaluating the system in user experiments with the task of designating positions of heat spots on an actual façade as if acquired through thermographic inspection. User and system performance were both assessed with respect to target designation errors. The main findings of this study show that positioning accuracy using this system is adequate for objects of the size of one decimeter. After ruling out the system inherent errors, which mainly stem from our application-specific image registration procedure, we find that errors due to a human’s limited visual-motoric and cognitive performance, which have a more general implication for using TPP AR for target designation, are only a few centimeters.
1. Introduction
Today, the sustainability of cities around the world is facing severe challenges posed by constant growth of population. According to [1], 68.4% of the world’s population will dwell in urban areas by the year 2050. Such rapid urbanization has strained the already limited resources and assets cities can offer. To mitigate the contradiction between supply and demand so that cities can continue growing healthily, both the research community and the industry have settled on the solution of smart city, whose technology aspect involves effectively managing urban resources and assets through employment of information and communication technologies (ICT) [2]. Thanks to the ICT-enabled infrastructures and services, citizens of modern metropolises are able to access a plethora of real-time information regarding their surroundings for making effective decisions. However, as ubiquitous information access becomes more and more prevalent, it has met with increasing resistance from the conventional human-computer interface and associated interaction techniques due to an interaction seam pointed out by [3]. The seam demands users to constantly switch their attention between the physical world they live in and the cyberspace they have grown tightly attached to. The swift popularization of ubiquitous information access promoted by smart cities calls for a type of more natural user interface (UI) that can seamlessly bridge these two worlds and the answer is augmented reality (AR). AR is an emerging computer UI technology that superimposes virtual information directly on user senses. Unlike its origin—virtual reality, which replaces user senses completely with a virtual world, AR seeks to enhance our senses with the virtual information. In other words, it would appear that both the real and the virtual objects coexisted in the same space [4]. Theoretically, all human senses such as vision, hearing, smell, etc. can be augmented, but most research works (including this one) are concerned with vision augmentation. After all, most information we receive is through our visual sense.
Energy fuels all sorts of human activities. Concentration of a large population resulting from urbanization thus requires an immense supply of energy while excessive energy consumption exacerbates the depletion of natural resources and inflicts negative impacts on the environment and the climate. Therefore, smart energy management has always been an integral part of smart city solutions [5]. Within the urban context, buildings account for 40% of primary energy consumption while contributing more than 30% CO2 emission globally [6]. According to [7], over half of the energy consumption is attributed to the purposes of heating, ventilation and air conditioning (HVAC). Hence, ensuring HVAC systems are functioning efficiently plays a crucial role in meeting the stringent requirements of smart energy. Since the thermal behaviors of HVAC systems often reflect their working conditions, the most common practice nowadays for inspecting and maintaining HVAC systems is through the aid of infrared (IR) thermography technology [8,9] due to its non-destructive and non-contact nature.
Facility maintenance field workers employing IR thermography, however, perform plenty of traversals over the aforementioned interaction seam. As pointed out by Iwai and Sato [10], thermal inspectors need to frequently switch their focus from objects in the real world to the displayed images on a screen because they need to comprehend the heat distribution on the surfaces of the physical objects. By superimposing IR information directly over physical objects of interest, AR addresses the mental mapping challenges adequately.
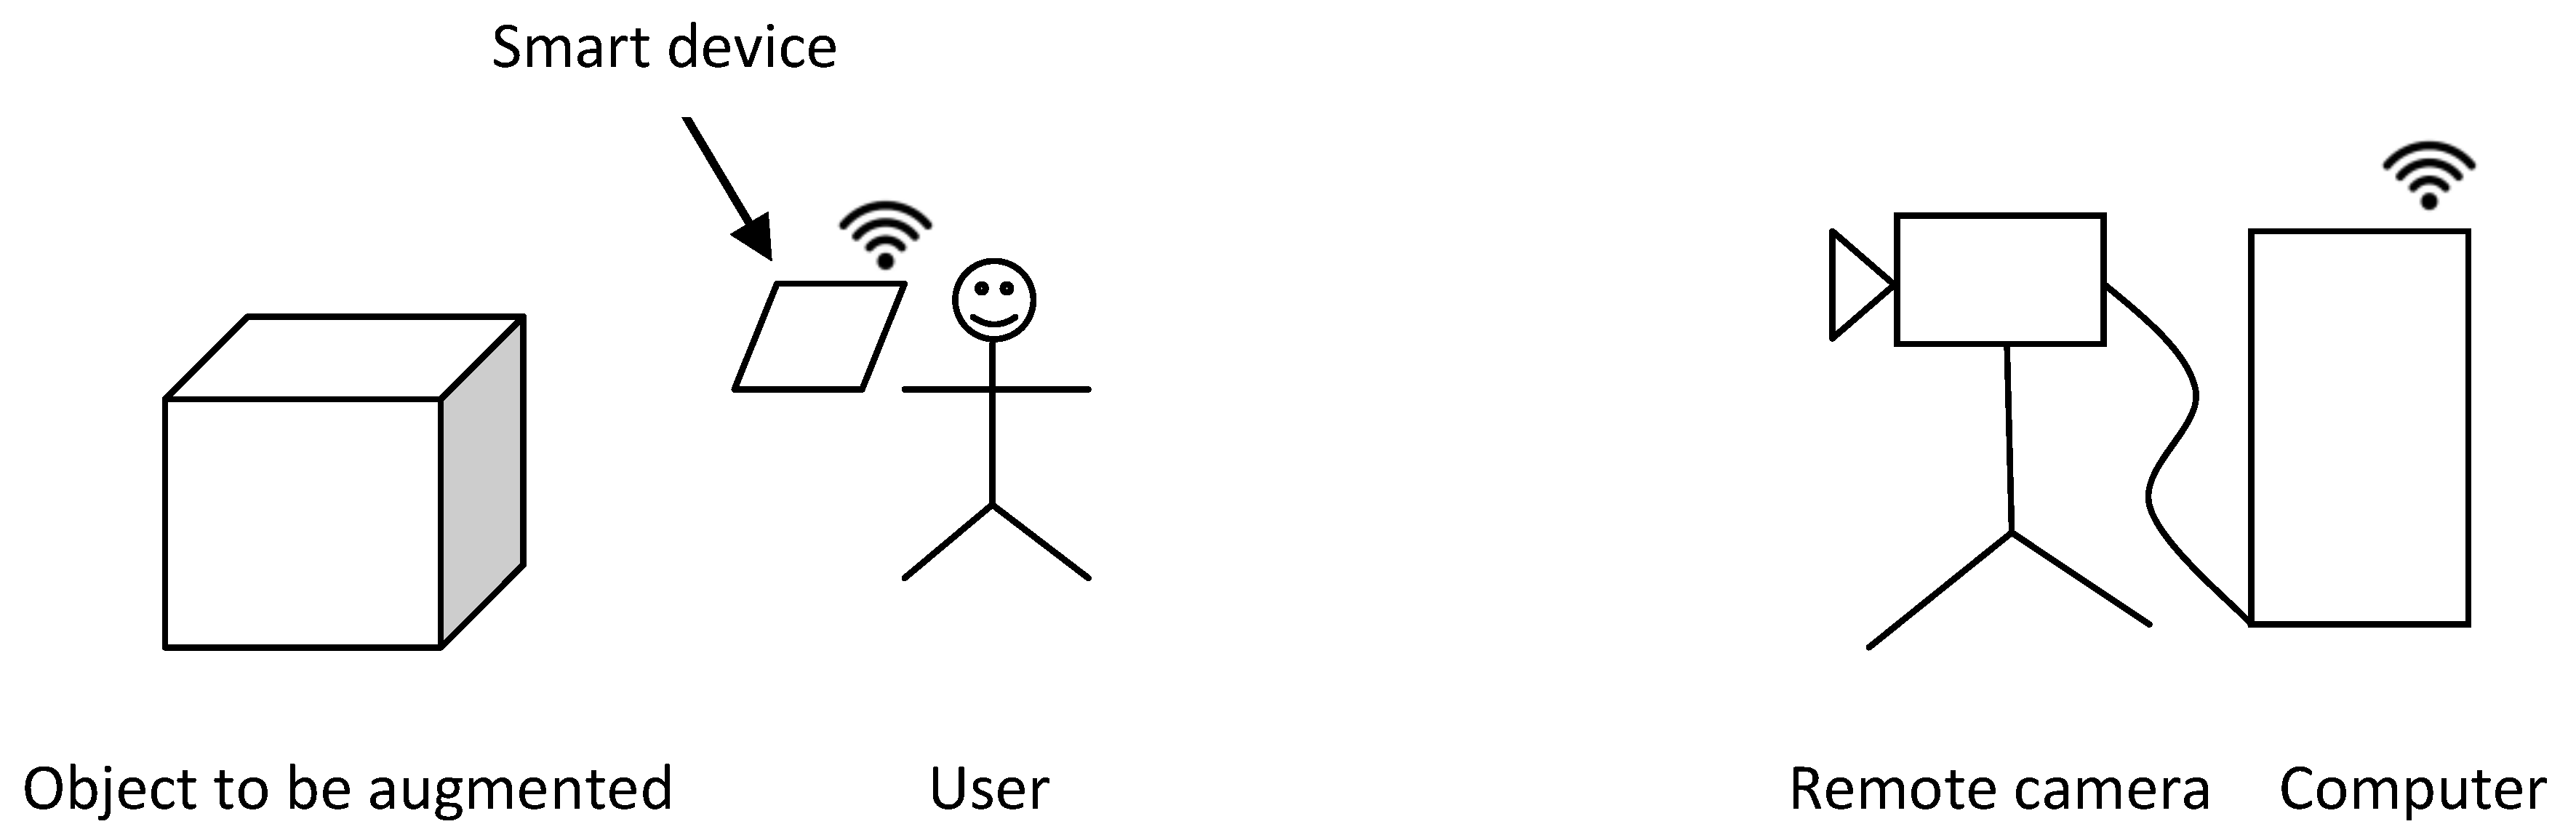
In this paper, we introduce AR into the traditional façade thermographic inspection process and investigate how user performance of designating positions of IR targets is affected by taking this unconventional approach. Given the popularity of powerful hand-held smart devices nowadays, such as smartphones and tablet computers, we are interested in building our AR system on these devices so that our experiment results can have more practical implications. However, the built-in cameras in these hand-held devices usually have a rather limited field of view [11,12]. This creates a dilemma for AR-based target designation applications regarding large physical objects, such as façades in this study: on one hand, a user needs to stay within an arm’s reach of the façade in order to designate (by, for example, marking up) the target positions; on the other hand, he has to back off from the façade for more visual context as well as more features for the tracking system. To overcome this dilemma, we opted for the uncommon third person perspective (TPP) AR [13]. In this type of setting, a remotely placed camera captures both the façade and the user himself. The video is then augmented with desired virtual information (in this case, IR targets) and sent to a smart device held by the user. The TPP AR provides the user with a broader view of the scene while it allows him to stay in front of the physical object to interact with it using the TPP video as a guide. The concept of TPP AR employed to build this system is visualized in Figure 1.
The IR targets represent imaginary thermal anomalies on a façade whose positions need to be identified for subsequent maintenance operations. Accurately locating maintenance targets can increase work efficiency through reducing operation time, costs and, in extreme cases, it can even avoid endangering workers’ lives [14,15]. However, when the task of locating target positions is aided by AR, the accuracy is not only influenced by the adopted AR tools but also by user-related factors. Therefore, this work focuses on evaluating user performance in relation to the new thermal inspection paradigm. To that end, we devised and conducted extensive user experiments, within which target designation accuracy, precision and task completion time were measured and analyzed. To further ground the study in reality, the experiments were carried out on an actual façade in an outdoor setting. The research objective is to provide a detailed error study of AR application in building IR thermography inspection in order to ascertain the viability of this new computer-assisted approach to building diagnostics. Through analyzing the experiment results, we are able to identify and quantify various error sources from the system aspect as well as the aspects of human perception and cognition.
The remainder of this paper is organized as follows: we start with surveying and discussing related work in Section 2. Section 3 introduces our AR system and describes the simulation process of those thermal anomalies used in this study as IR targets. Section 4 is concerned with user experiments and their results, while supplementary benchmark tests with the purpose of identifying various errors are described in Section 5 together with the test results. Finally, we discuss and conclude the study in Section 6.
2. Related Work
2.1. Urban Outdoor AR
There are many obstacles to overcome before AR becomes a viable consumer-level computer interface [16]. As for outdoor AR, some prominent challenges are: reliable wide-area tracking in a complex and unprepared environment; portable form factor versus stringent processing power and energy consumption demand; display visibility in strong or low lighting conditions and natural means to interact with AR systems. Despite these hurdles, the inevitable trend of ubiquitous computing and AR’s innate compatibility with it have still elicited numerous research interests within the area. Indeed, within the urban outdoor context, AR is often employed for tourism, onsite construction management and geo-referenced data interaction, to name a few. Besharat et al. [17] proposed a navigation assistance prototype, which overlays virtual symbols representing popular points of interest and suggested routes to them on a physical map when it is viewed through a mobile device. An Android AR app was developed by Leach et al. [18] for the public to view a destroyed medieval castle on its modern site. In order to obtain proper occlusion and registration of the virtual castle, a 3D model of the region needs to be manually aligned with the user’s current view first. Other examples of recent AR applications for cultural heritage, which draw on off-the-shelf AR toolkits, have been reported in [19,20]. While outdoor location-based AR games are not a new concept, Pokémon Go is among the very few commercialized examples that have enjoyed global success. The studies presented in [21,22] shed some light on different aspects of social acceptance, which is a largely unexplored yet important topic within AR research.
Projects from the architecture, engineering, construction and facilities management (AEC/FM) industry involve a large volume of data which require spatial referencing and AR has been proven to be effective with spatial data interaction. Zollmann et al. [23] employed AR to visualize 3D building models reconstructed from aerial images for construction progress monitoring. In [24], computer vision techniques were applied to video feed from both global and personal perspective to detect potential hazards on construction sites. The identified hazardous information is then overlain on worker’s view through AR. Gomez-Jauregui et al. presented CEsARe [25], a mobile AR application for visualizing virtual models on construction sites. An up-to-date survey on mobile AR applications in construction can be found in [26].
Another important category of spatial data within urban environment pertains to geographic information, such as roads, buildings and underground public infrastructure. As these type of data become readily available, there is an emerging trend of adopting AR for geospatial data interaction. Schall et al. [14] described an AR system for underground utility surveying, which demands high registration accuracy. Pierdicca et al. [27] combined geographical information system (GIS) with AR to devise a mobile solution for buffer strips monitoring and maintenance along riverbanks. According to [28], GIS-based spatial analysis has been used for evacuation assessments at different scales. Through introducing AR into this process, the authors demonstrated the feasibility and the efficacy of visually linking evacuation simulations to the corresponding built environment. Some challenges arising from geo-referenced data visualization were identified in [29] and the solutions were also provided.
2.2. IR Applications with AR
Studies on AR incorporating thermal IR technology are less common. Kurz [30] turned physical objects into touch input interfaces for AR through detecting residual heat left by finger touches. Several efforts have been made to spatially combine thermal information with its related physical objects in order to cope with the inconveniences in thermographic inspection brought about by the aforementioned disconnection. In [10], IR information was associated with corresponding physical objects through direct projection. Ham and Golparvar-Fard [31] registered visible and thermal 3D point cloud models of a building, which were both constructed from respective 2D image sources. With the resulting 3D spatial-thermal model, energy auditors can visually compare and analyze actual energy performance against a simulated one in a common 3D environment. A hand-held 3D thermal mapping prototype was presented in [32]. The prototype consists of a Microsoft Kinect (Microsoft Corporation, Redmond, WA, USA) with an IR camera attached to it. Registered visible and thermal video frames are mapped onto the reconstructed 3D model of a scene so that the model can be represented with two schemes, Intensity-Hue Mapping and Thermal Highlighting. VisMerge from [33] is an AR thermal imaging system devised to combat poor visibility in low light situations. The authors also described five new image fusion algorithms used in the system and compared them with existing similar algorithms through user experiments.
2.3. AR-Assisted Inspection and Maintenance for Facilities
Equipment inspection and maintenance is a classic application for AR. With the recognition of significant efficiency boost and cost reduction, research on employing AR for facility inspection and maintenance tasks has seen increasing popularity. Kim et al. [34] detailed a conceptual frame for adopting mobile AR for building damage assessment after a disaster. The study from Khalek et al. [35] suggests that AR-based building information modeling (BIM) applications are conducive to better decision-making towards facility maintainability during the design phase. Both AR solutions proposed in [36] and [37] utilized indoor natural features and built-in sensors on iOS devices to provide facility workers with routes and instructions for maintenance tasks. Zhou et al. [38] contrasted the conventional method for tunnel segment displacement inspection with an AR-based counterpart and reported that the AR-based method took substantially less labor time for the task.
2.4. Contributions of Our Study
Different application purposes impose varied precision and accuracy requirements on AR systems being developed. For instance, AR for displaying name labels of landmarks [29], visualizing location-based historical content [20] or rendering creatures for players to interact with [21,22] does not require the virtual content to be perfectly aligned with associated real world objects. On the other hand, stakeholders would be more interested in system inherent errors if AR tools are involved in revealing models of underground utilities related to a street for surveying [14] or measuring discrepancy between as-built and as-planned construction components [38]. Through literature review, we have identified that most existing works concerning AR inspection and maintenance stay at the level of proof of concept without comprehensive user evaluations of respective proposed systems. When it comes to tasks that rely on tool precision and accuracy, reports on the impact of system inherent errors are naturally scarcer. Although studies like [14,25] indeed comprise detailed error analysis, the authors only considered errors stemming from the systems while factors introduced by users were neglected. However, we believe that, like any other tools, no matter how well-crafted an AR system is, it will eventually have to be put into a user’s hands to realize its purpose and hence user factors such as perception and cognition also play an integral part in evaluating the overall task performance. In the light of this belief, our goal is to not only provide an AR solution to façade thermographic inspection, but more importantly to report both system inherent and human errors, as well as how they affect the precision and the accuracy of task performance through extensive user task experiments. In order to corroborate the practicality of the proposed AR approach, we have devised our experiment in a realistic setting as well.
3. AR-Based Thermal Target Displaying System
3.1. Façade Image Registration Using Quadrilateral Features
The process of registration is to ensure that virtual objects are convincingly overlain on their real world counterparts, which is crucial for AR to create an illusion where both the real and the virtual worlds coexist seamlessly. A common approach to achieving registration is tracking the AR camera, through which its position and orientation are recovered so that the rendering system is able to generate virtual content with correct perspectives [39] (Chapter 3). However, in terms of our specific application, it is not necessary to adopt such an approach to registration because the virtual content in question, namely IR information, is presented in the form of 2D images. Instead, we can utilize techniques developed for image registration to align IR targets with video frames captured by a visible-light camera.
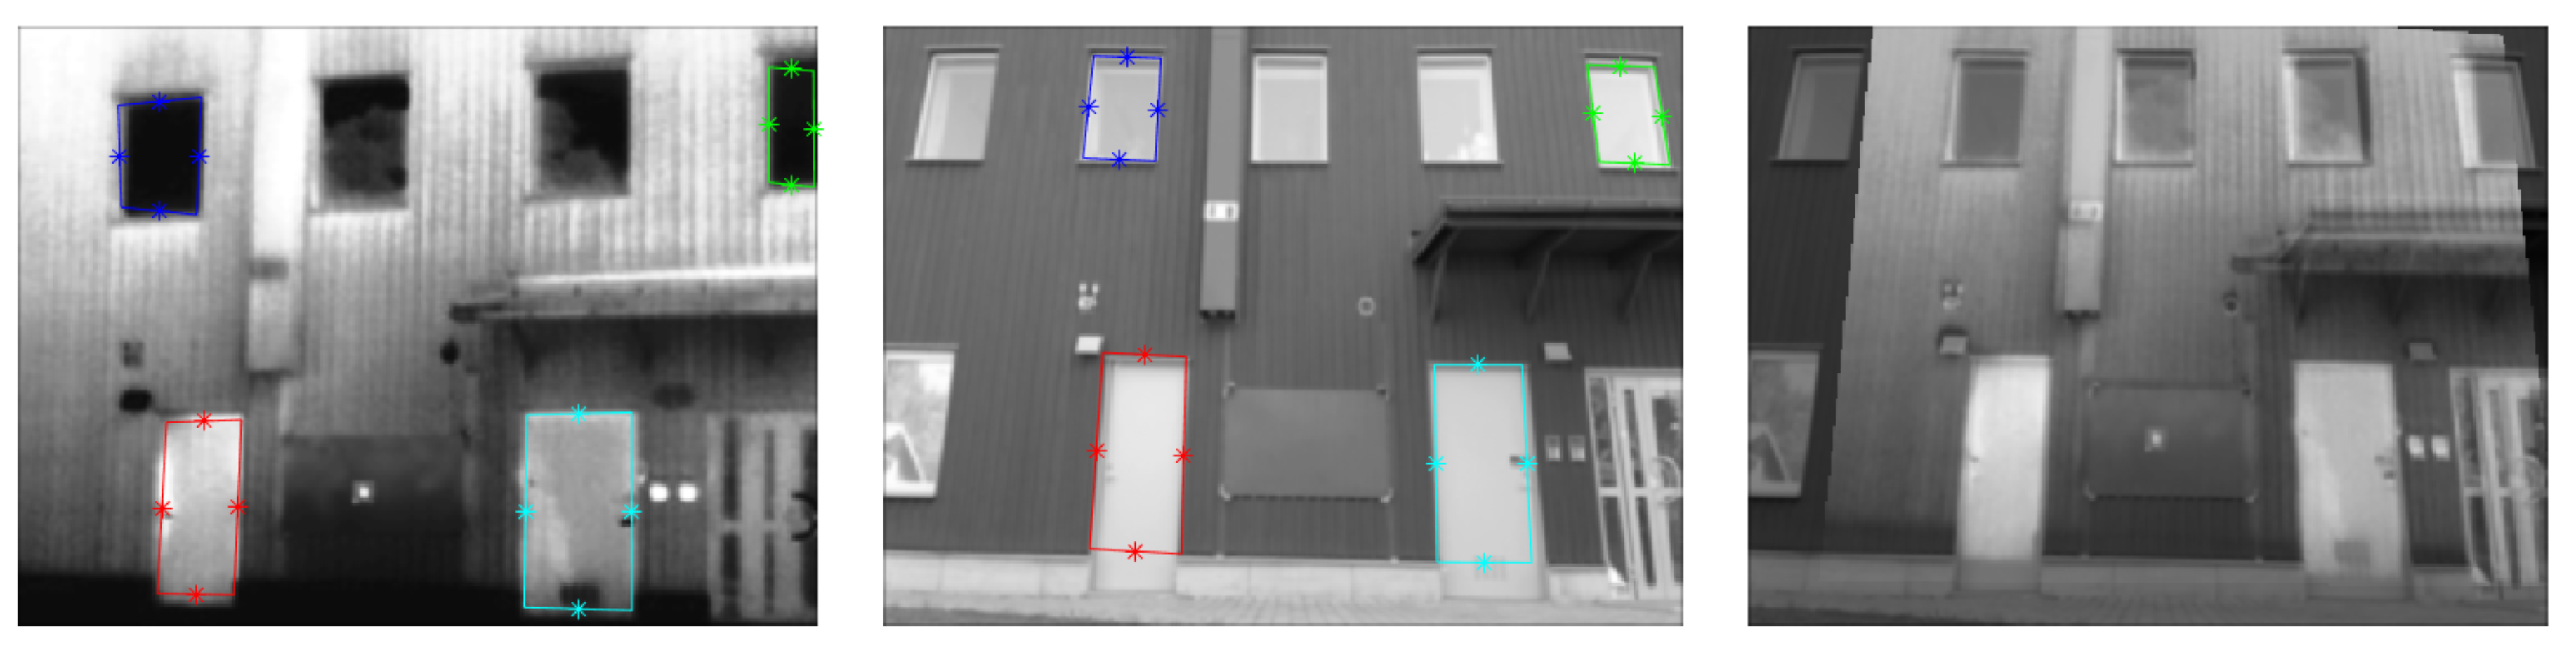
More specifically, we took advantage of our IR/visible façade image registration method previously developed in [40]. The method draws on image horizontal and vertical line segments to form quadrilateral features that usually represent façade elements such as windows and doors. Examples of such features are shown in Figure 2 (Left and Middle) as highlighted regions. Corresponding features in both IR and visible images (coded with the same colors in Figure 2 Left and Middle) are then established to infer the geometric relation between the two image so that they can be spatially aligned and the registration result is demonstrated in Figure 2 Right.
3.2. Hardware Implementation
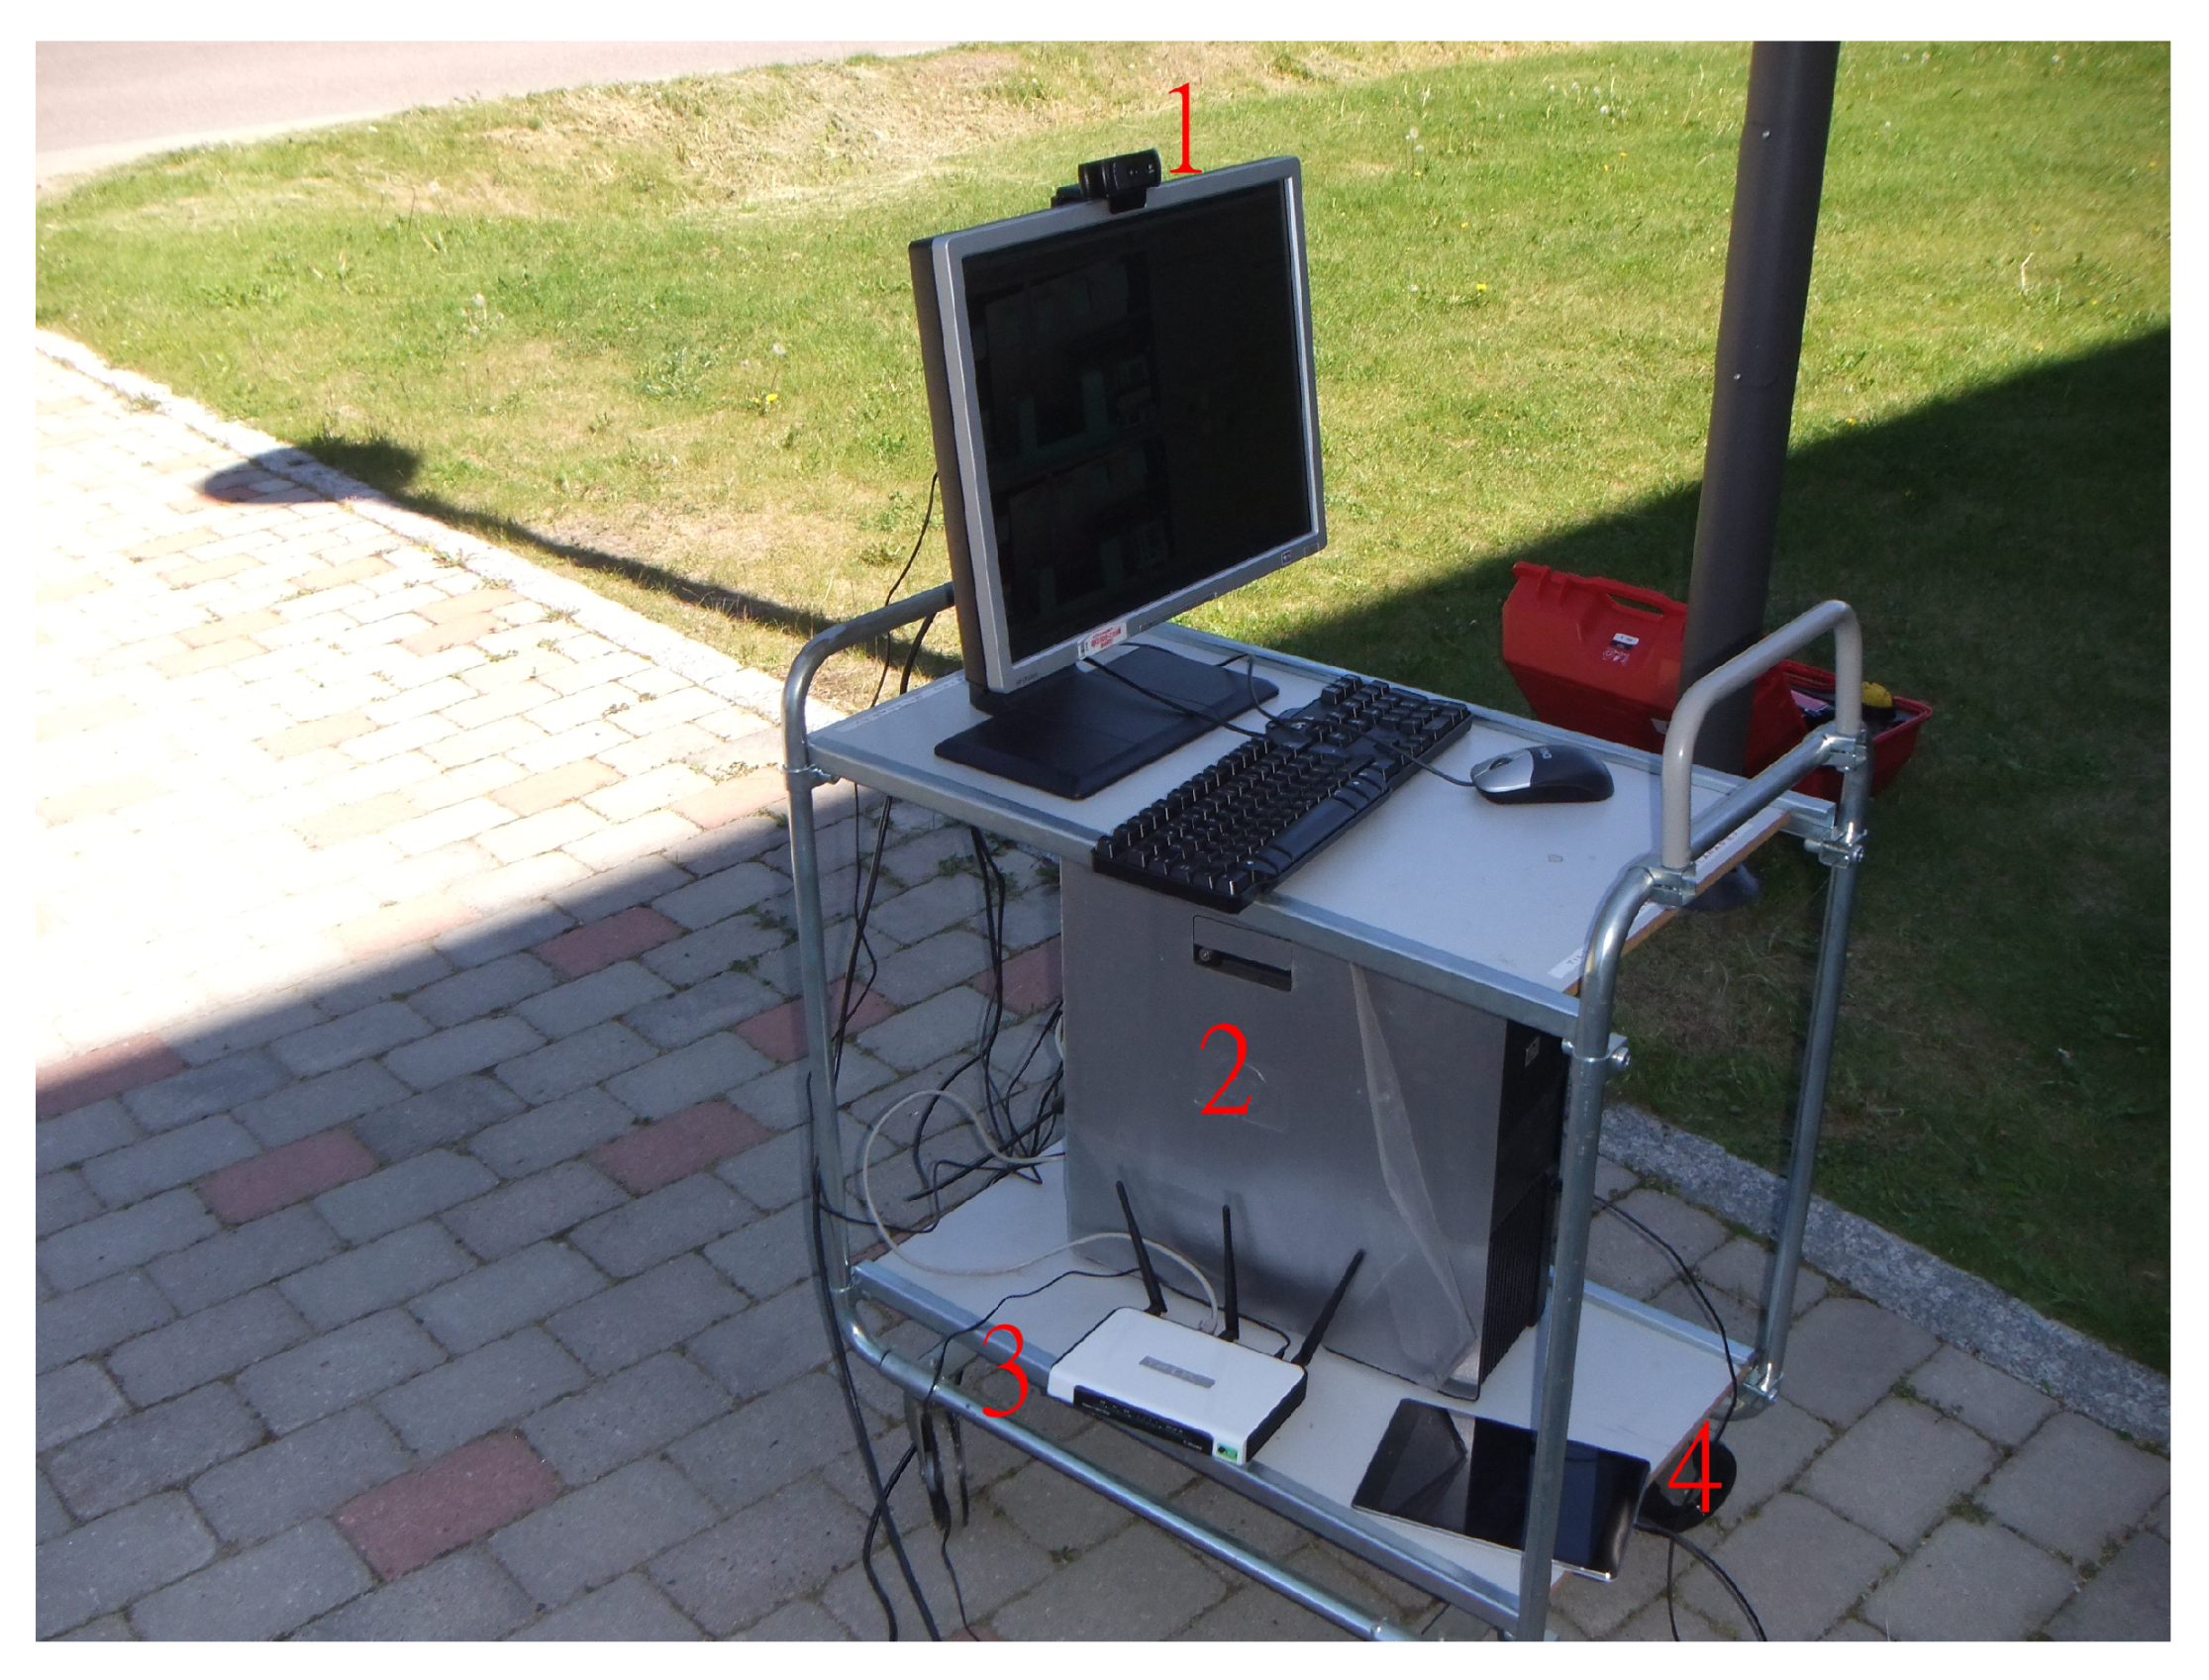
The overall system design is similar to the one presented in our previous work on indoor TPP AR experiments [41]. In terms of hardware (see Figure 3), we offloaded the video augmentation operation onto a desktop computer, HP Z600 workstation (HP Inc., Palo Alto, CA, USA), for improved system performance. A Logitech C920 HD Pro webcam (Logitech International S.A., Lausanne, Switzerland) was attached to the computer for video capture. A frequent comment we received from user experiments in [41] was that the screen of the smartphone was too small so it was difficult to discern the virtual targets. Therefore, in this implementation, the augmented video was sent to a tablet computer, Google Nexus 9 (Google LLC, Mountain View, CA, USA), featuring an 8.9 inch display at the resolution of 2048 × 1536. These two computers are connected through a wireless local network. It is worth noting that the TPP AR system as described herein is a research prototype for the purpose of experimentally validating registration performance (both algorithms and users). For a real product of TPP AR, all software of the system would be optimized to run on the hand-held smart device alone with only a portable wireless (or Bluetooth) camera as an additional component.
As reported in [40], our registration algorithm can not quite run at real-time. As a result, after we set up the experiment environment every day (which amounts to an experiment session and will be referred to as such henceforth), the trolley with hardware shown in Figure 3 remained still during the entire session. Moreover, we did not allow any movement of the webcam as well. In this way, since the façade view in the video did not change, we only needed to register all IR images with one of the video frames once at the start of each experiment session and used the registration results throughout the session. We believe this approach is justifiable considering the purpose of this study is not about real-time natural feature tracking and registration for AR. Furthermore, in TPP AR setting, the scene captured by the camera is quite large thanks to the remote placement of the camera. Consequently, unless a specific viewing angle is required during the operation, the camera does not have to be moved once deployed.
3.3. The Desktop and Tablet Applications
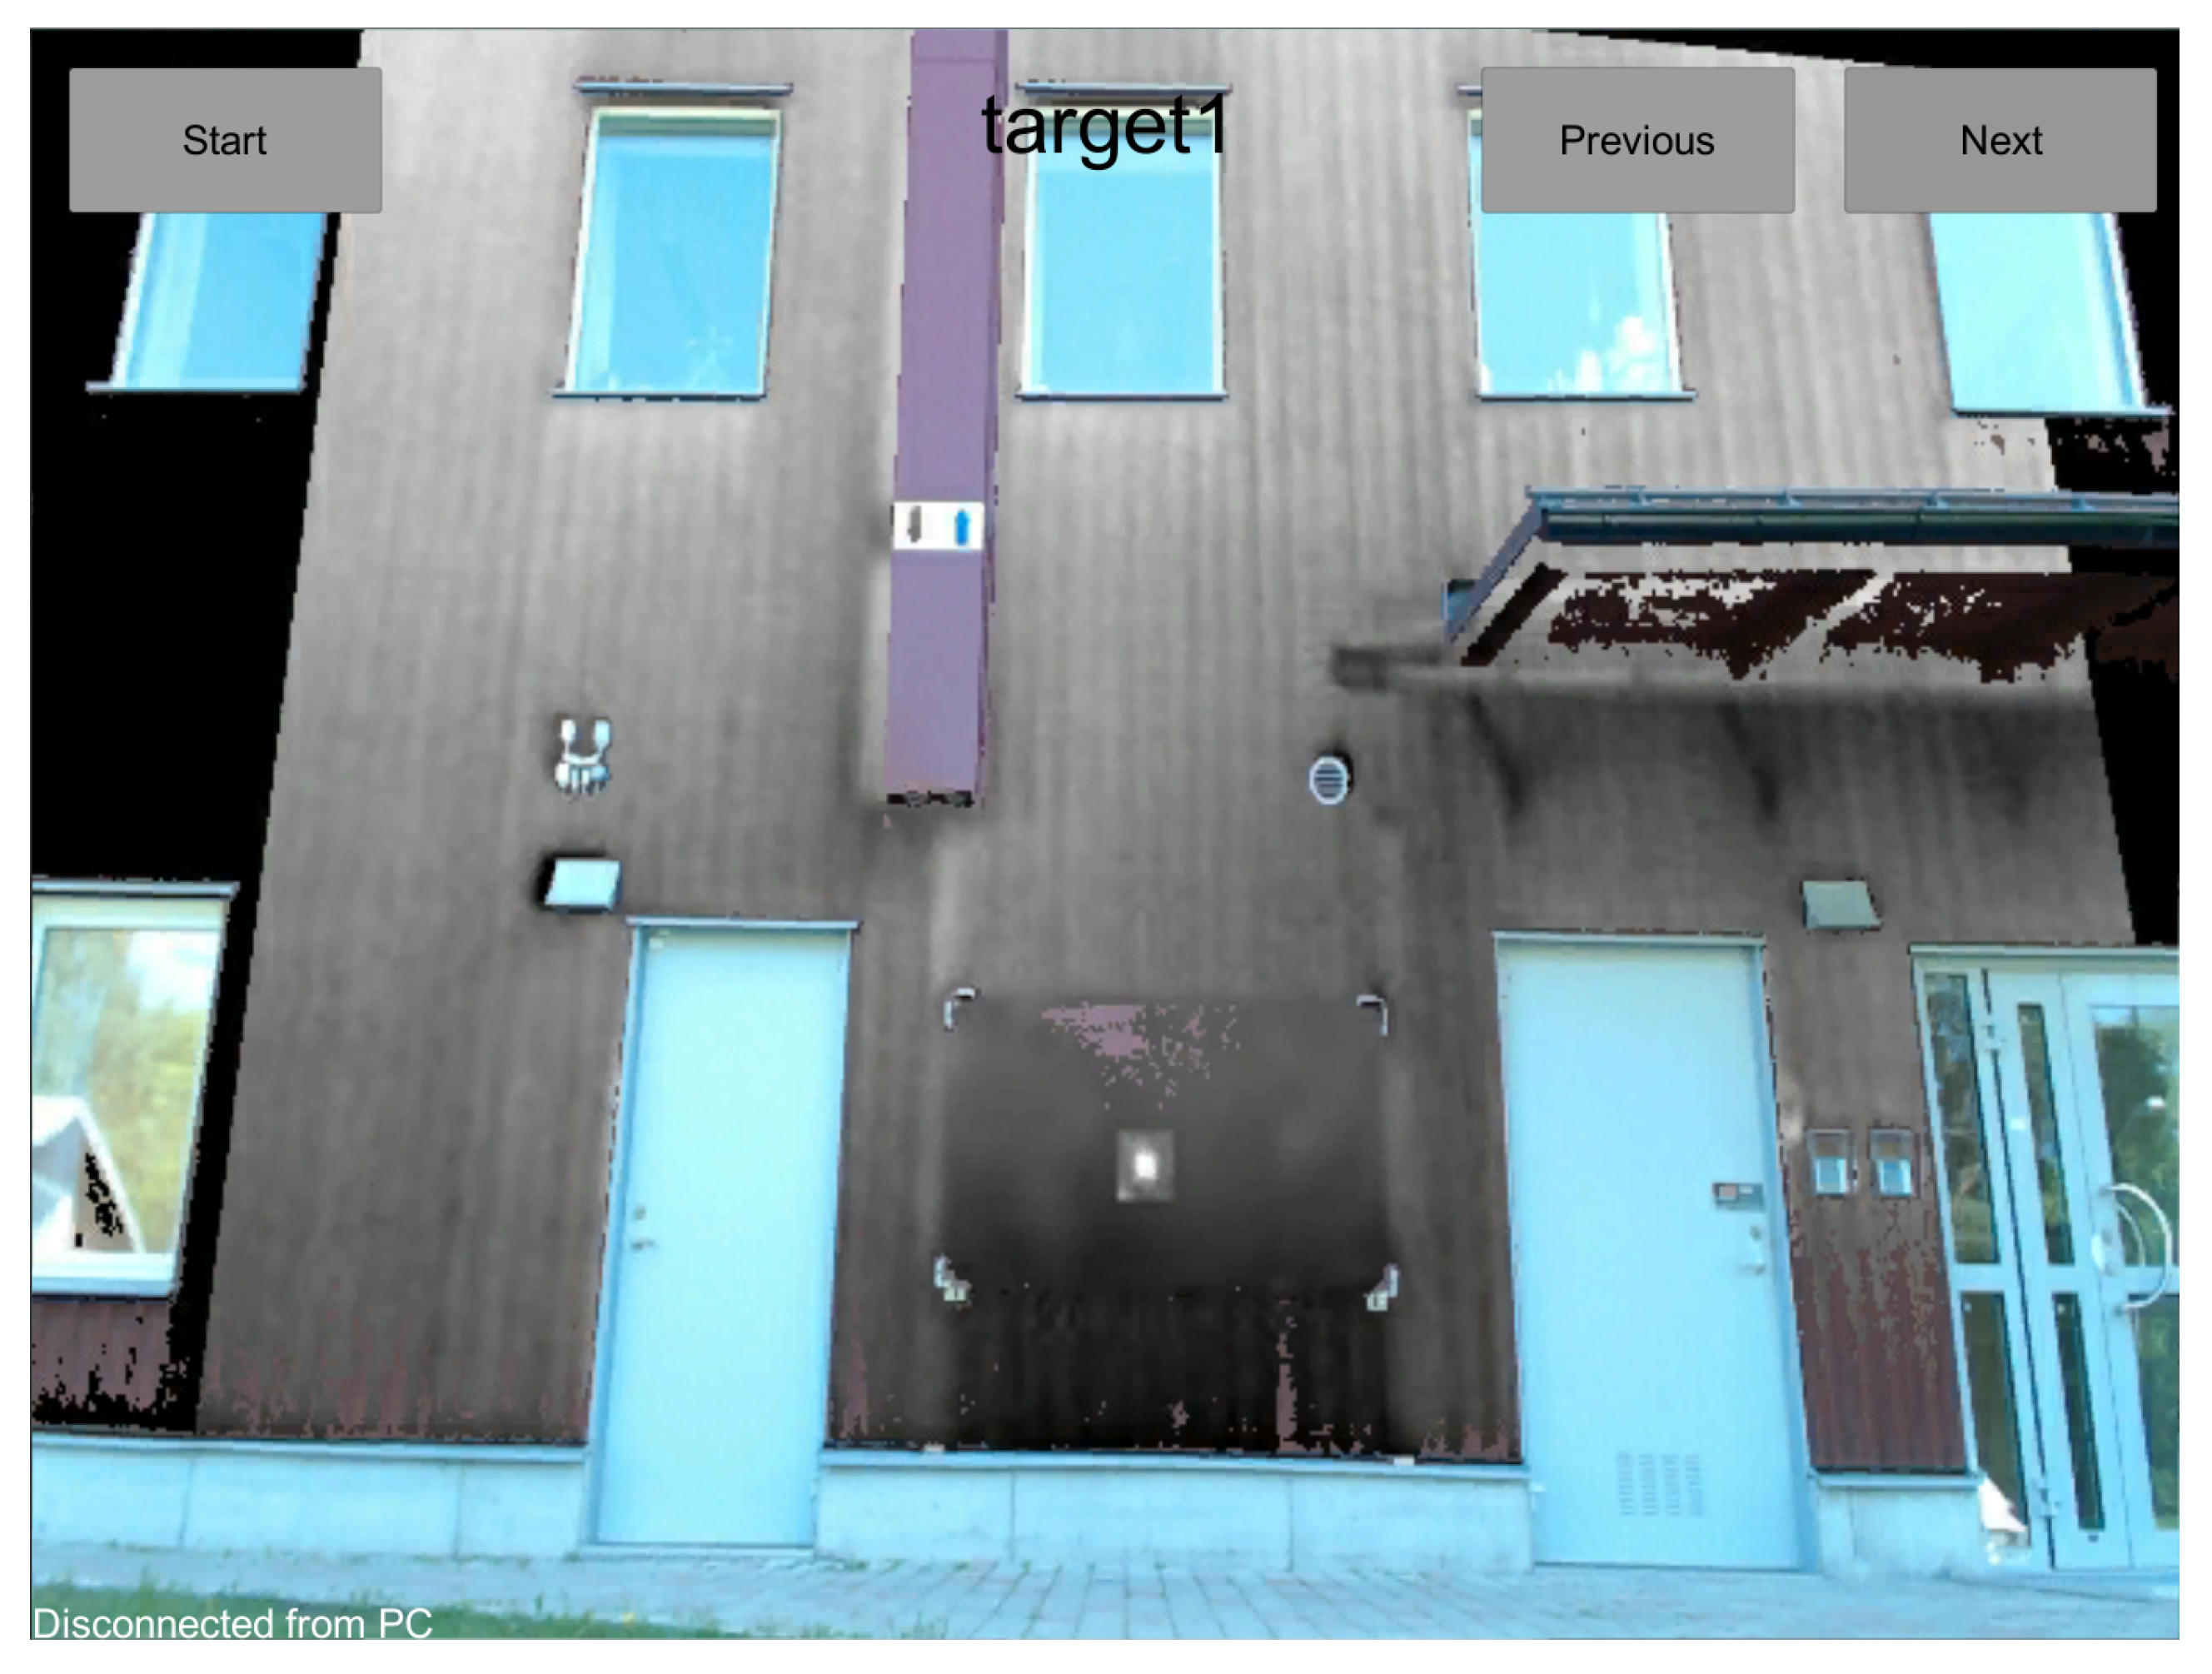
Both applications were developed with Unity game engine. The application on the tablet side has rather simple functionality, which is mainly presenting the augmented video to users. It also has a user interface consisting of two text labels and three buttons illustrated in Figure 4. The text label at the left bottom of the screen displays connection status with the desktop computer while the one at the top center shows users the identification number of the current IR target, which needs to be designated. As for the buttons, we have the “Start” button for connecting to or disconnecting from the desktop computer, the “Previous” and the “Next,” buttons for users to scroll through all the IR targets during the experiments. Users can also zoom in or out on the video through pinching, a most requested interaction from [41].
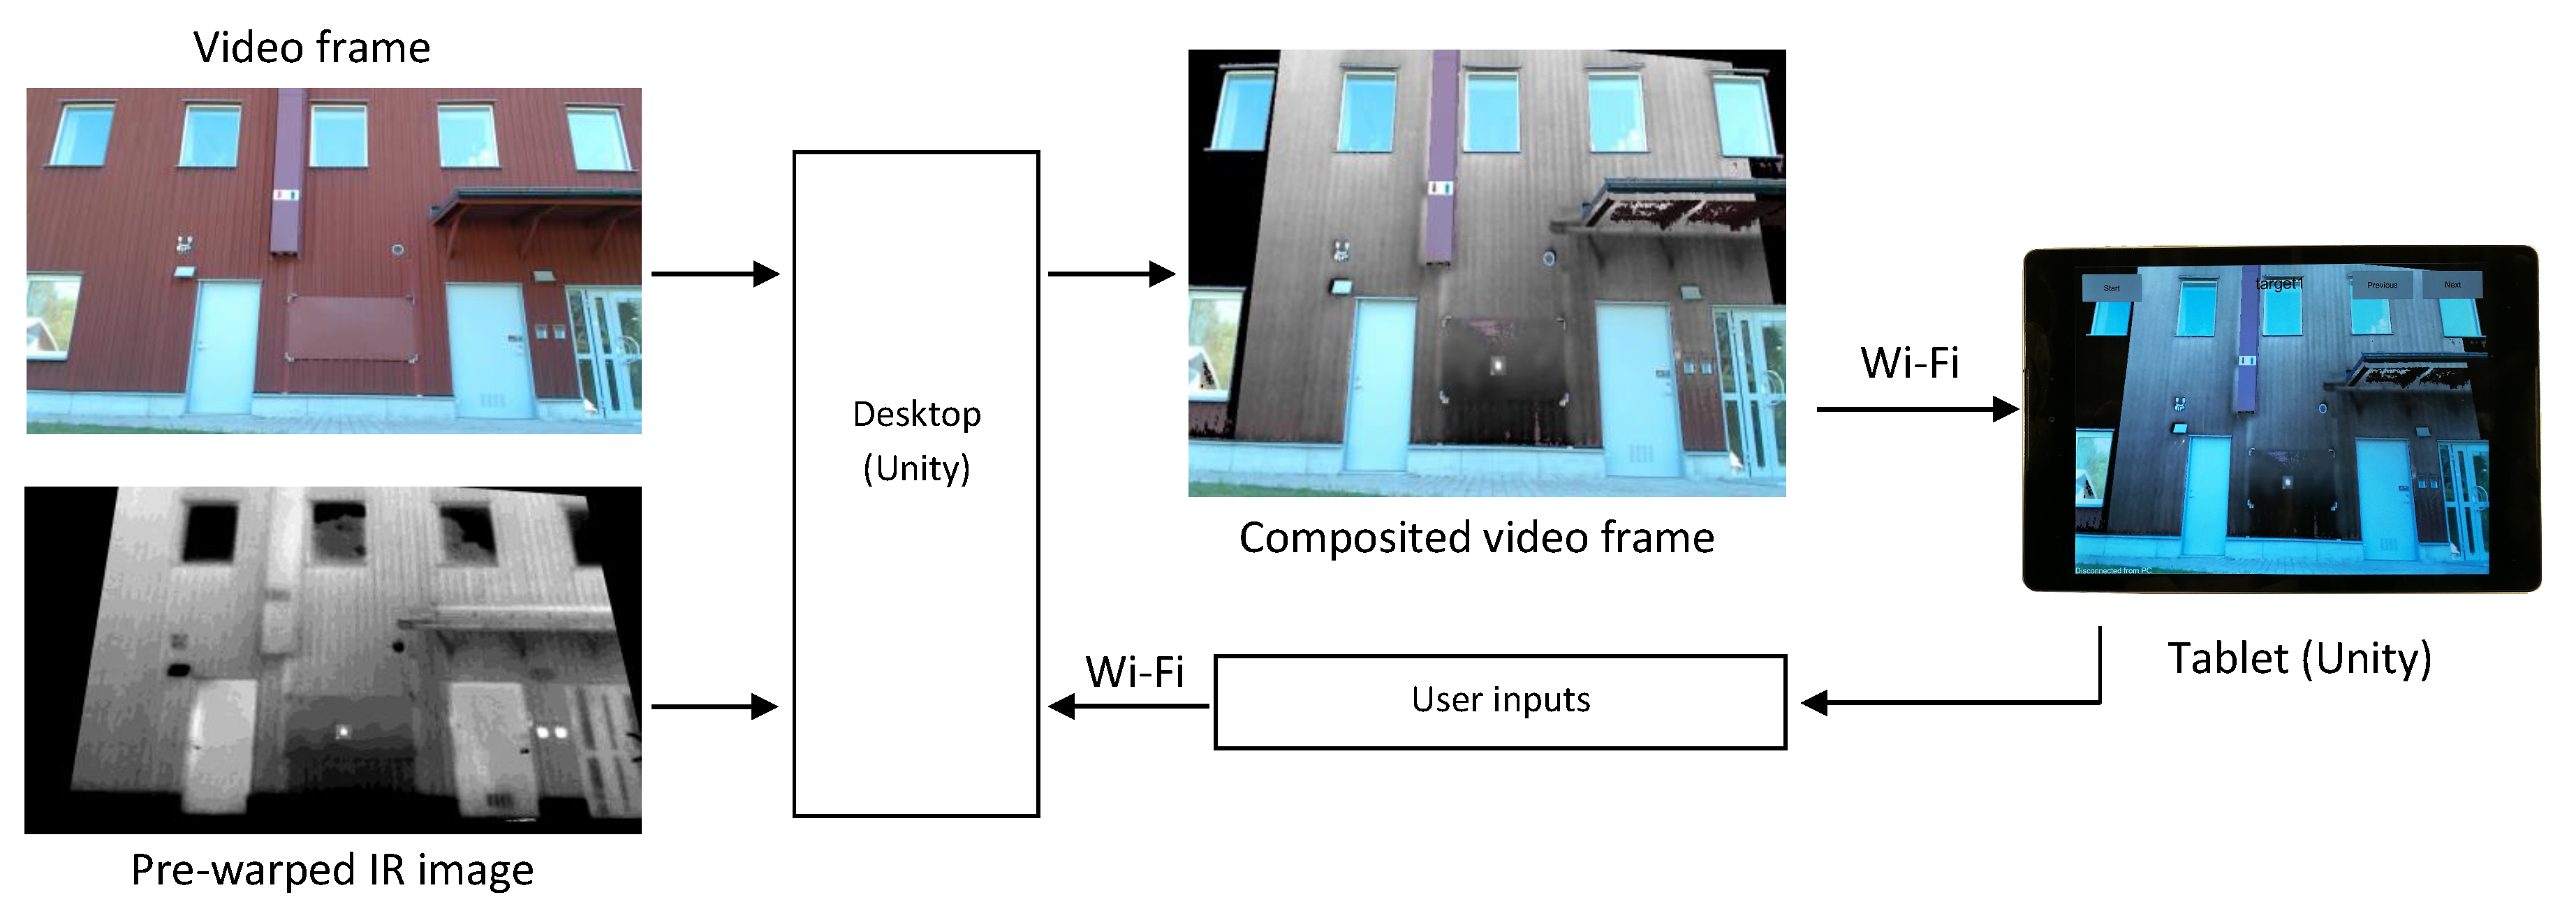
The 13 pre-warped IR images were imported into Unity and composited with the video through customized OpenGL shaders at the rate of 24 frames per second. Since the façade of interest is uniformly red, we also implemented chroma keying technique in the shaders to handle the occlusion of users. The composited video is transmitted to the tablet as well as being displayed on the screen of the desktop computer for monitoring purpose. Finally, we realized a timing mechanism in the application, which records the duration of display time for each IR target. A high-level overview of the system architecture is depicted in Figure 5.
3.4. Simulation of the Thermal Anomalies
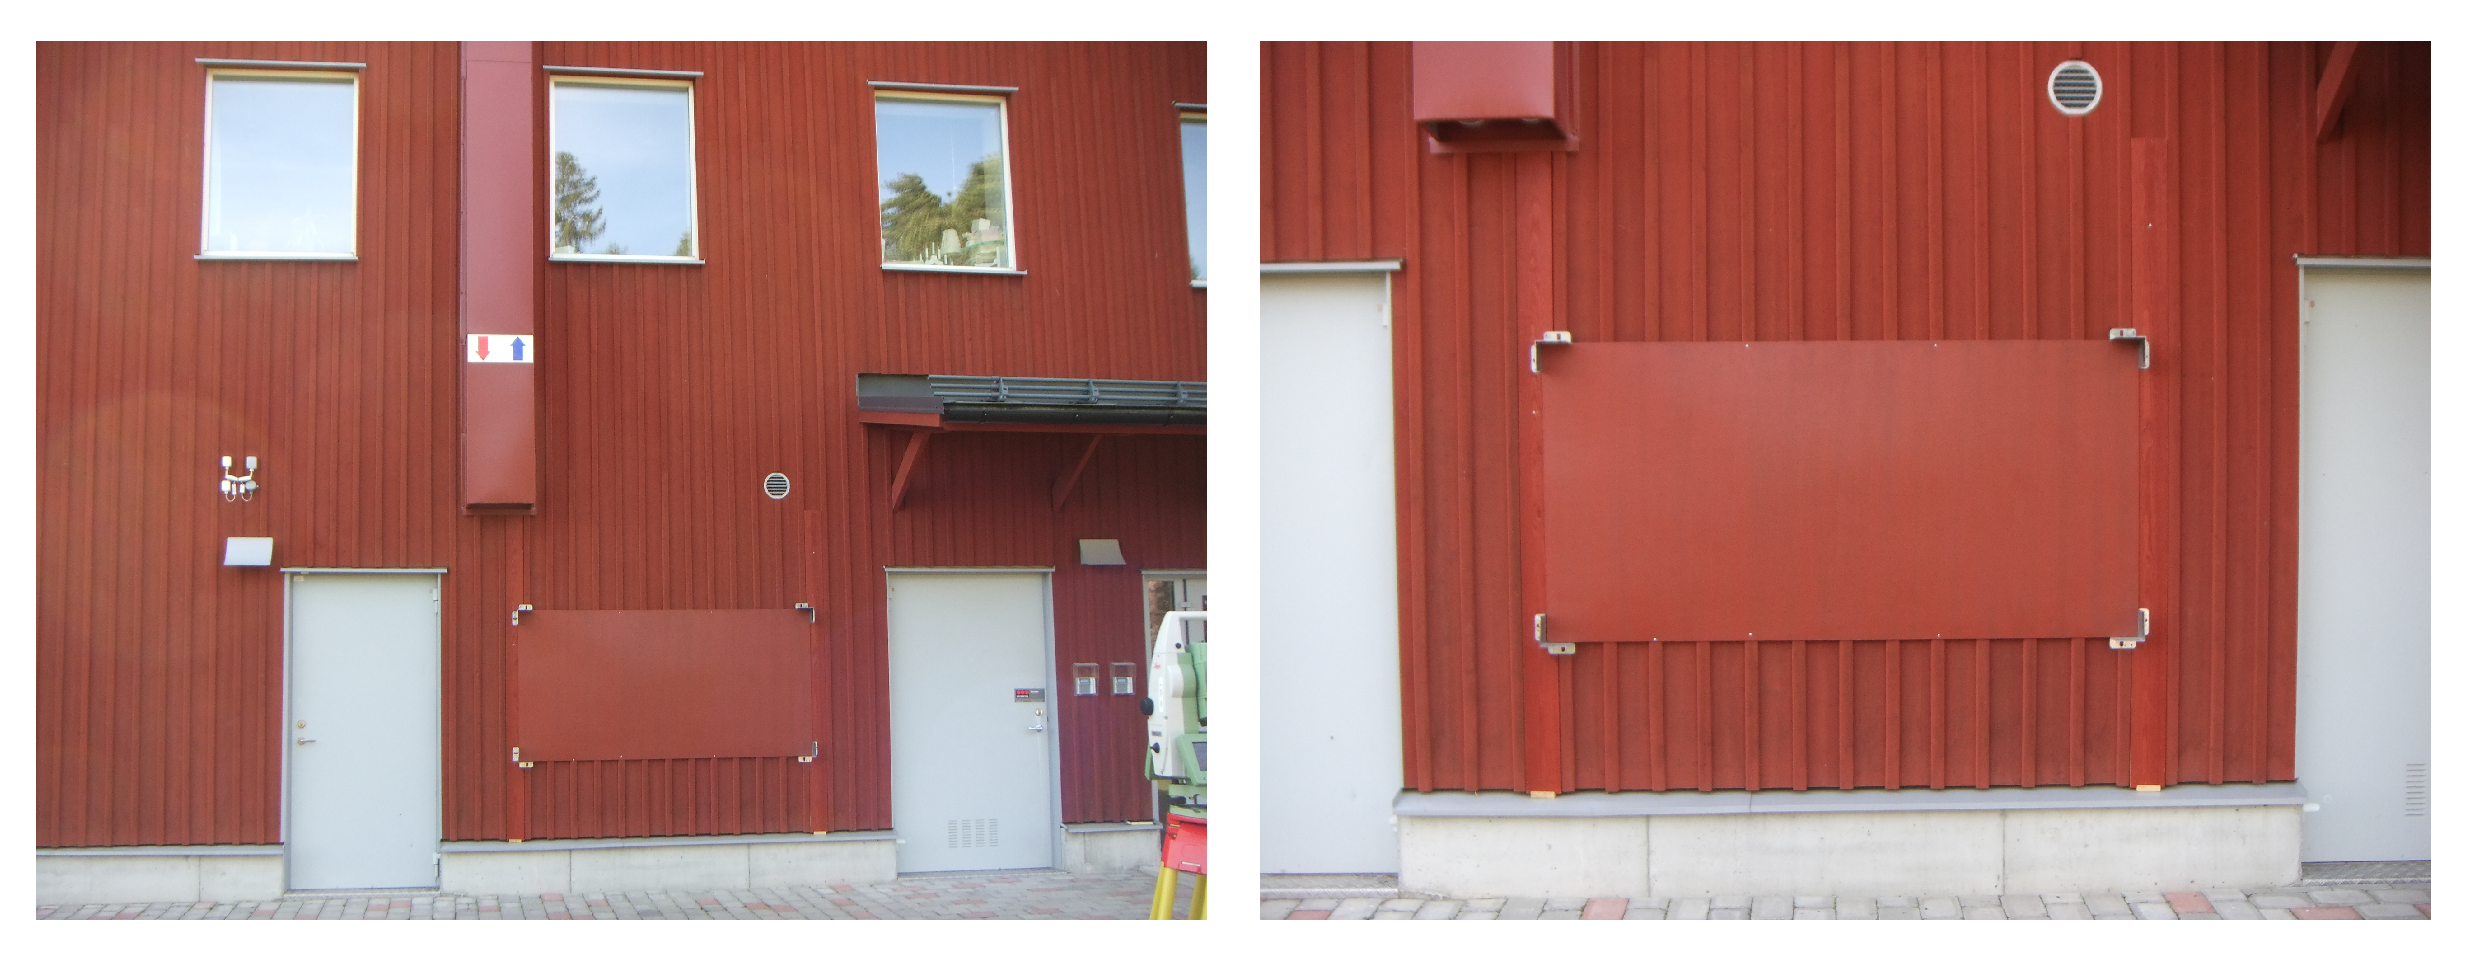
Thermal targets are artificial thermal anomalies created on a façade for this study. We first selected a façade on our campus and installed a thin plywood board on it (see Figure 6). The board serves as the working area of the experiments and all the targets are to be displayed within it. We painted the board with a similar color of the façade and the paint contains metallic compounds so subjects can stick magnetic markers on it to designate the targets (more details on this will be described in Section 4).
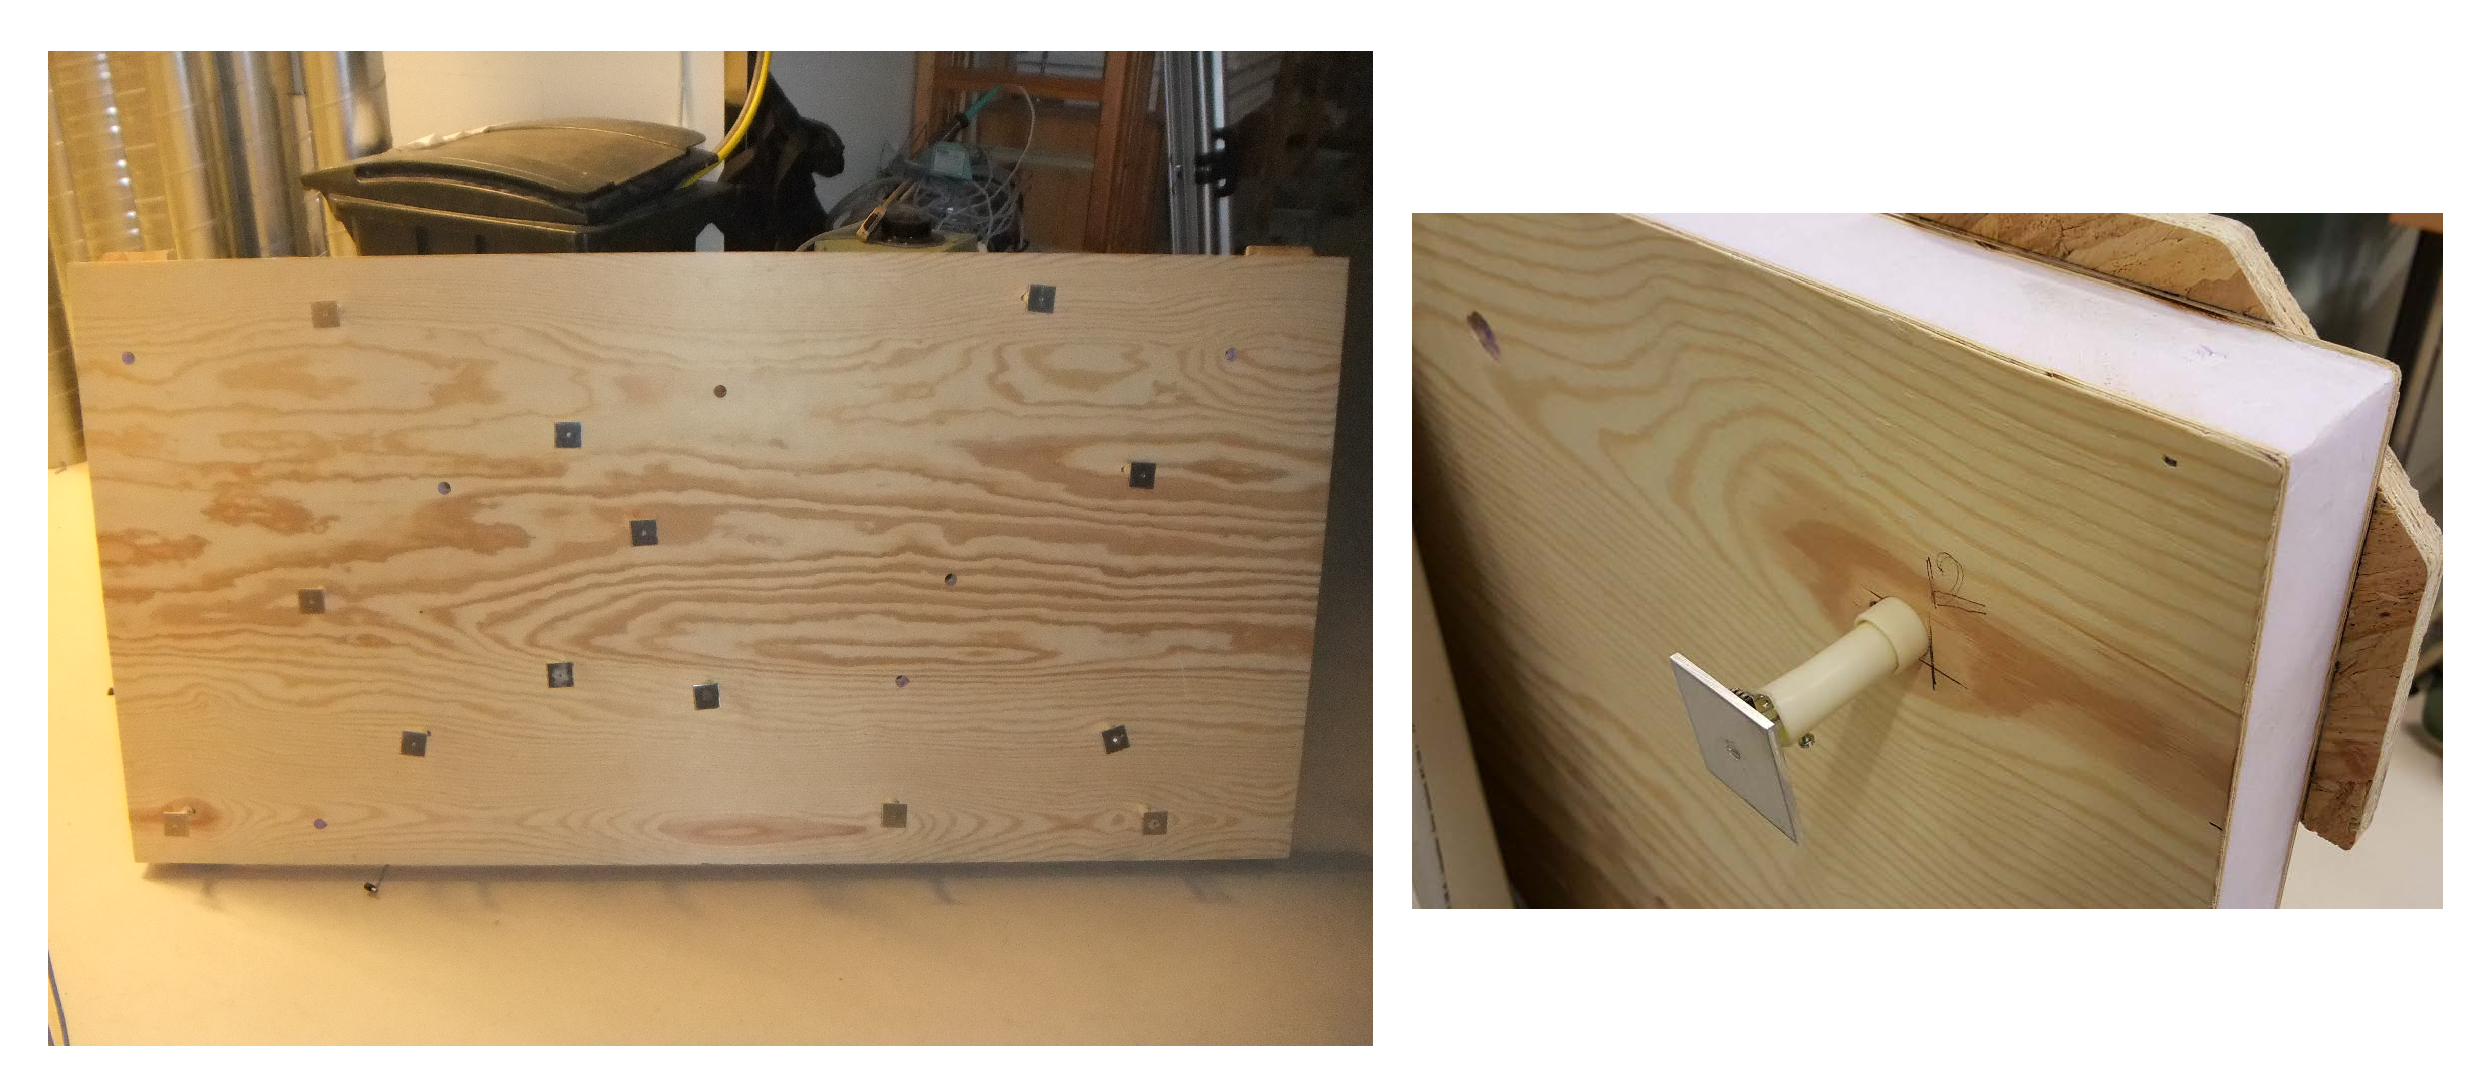
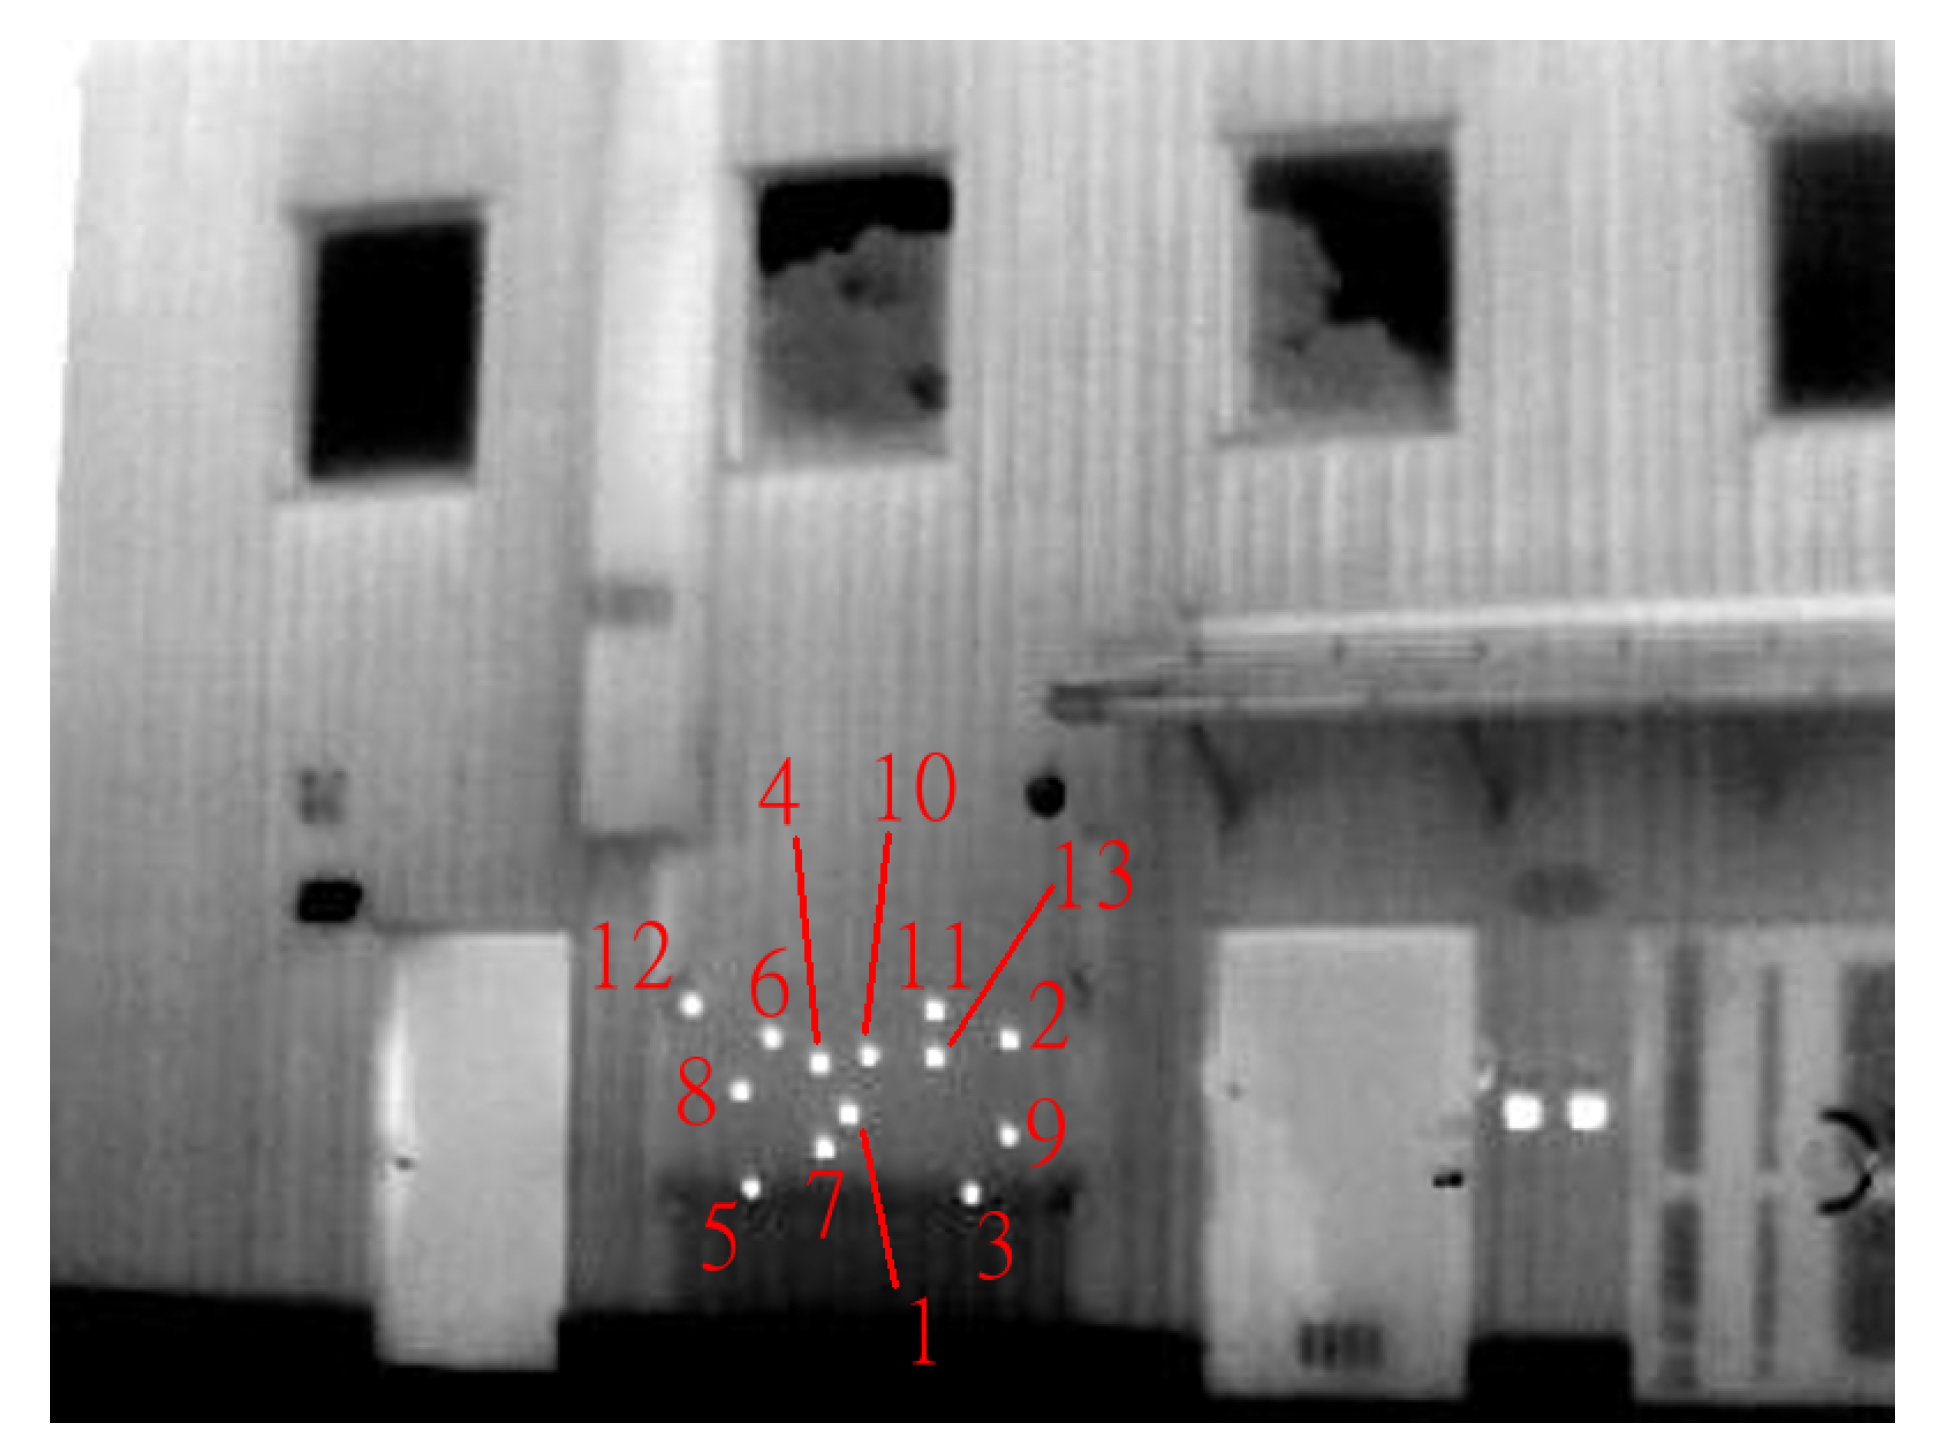
The next step was to simulate thermal anomalies by warming up certain locally defined spots within the working area so that those positions would show up in IR images of the façade, thus serving as thermal targets. To this end, we manufactured a heating rig shown in Figure 7 Left. We planned to have 13 thermal targets so there were 13 heating devices (Figure 7 Right) in total installed in the rig. Each heating device contained an electrical heat generator attached to a 4 cm × 4 cm aluminum chip. The positions of the heating devices were selected at random during the manufacture and spread out across the entire rig. We designated one corner of the rig as the origin of a local coordinate system, here denoted as , and measured the 2D coordinates of these heating devices using high quality steel rulers with an estimated accuracy of 1–2 mm. These coordinates served as the ground truth positions for later analysis. To acquire the thermal targets, we first warmed up the heating devices on the rig and then pressed the rig against the working area for a couple of seconds. Afterwards, we removed the rig and gathered IR images of the façade with an FLIR E60 thermal camera (FLIR Systems, Wilsonville, OR, USA) at 11 different positions in front of the façade. We selected one of the images with the best quality in terms of both the façade and the targets for the later experiments, which is shown in Figure 8. Subsequently, the chosen image was duplicated 13 times and each copy was edited in such a way that it only contains one IR target.
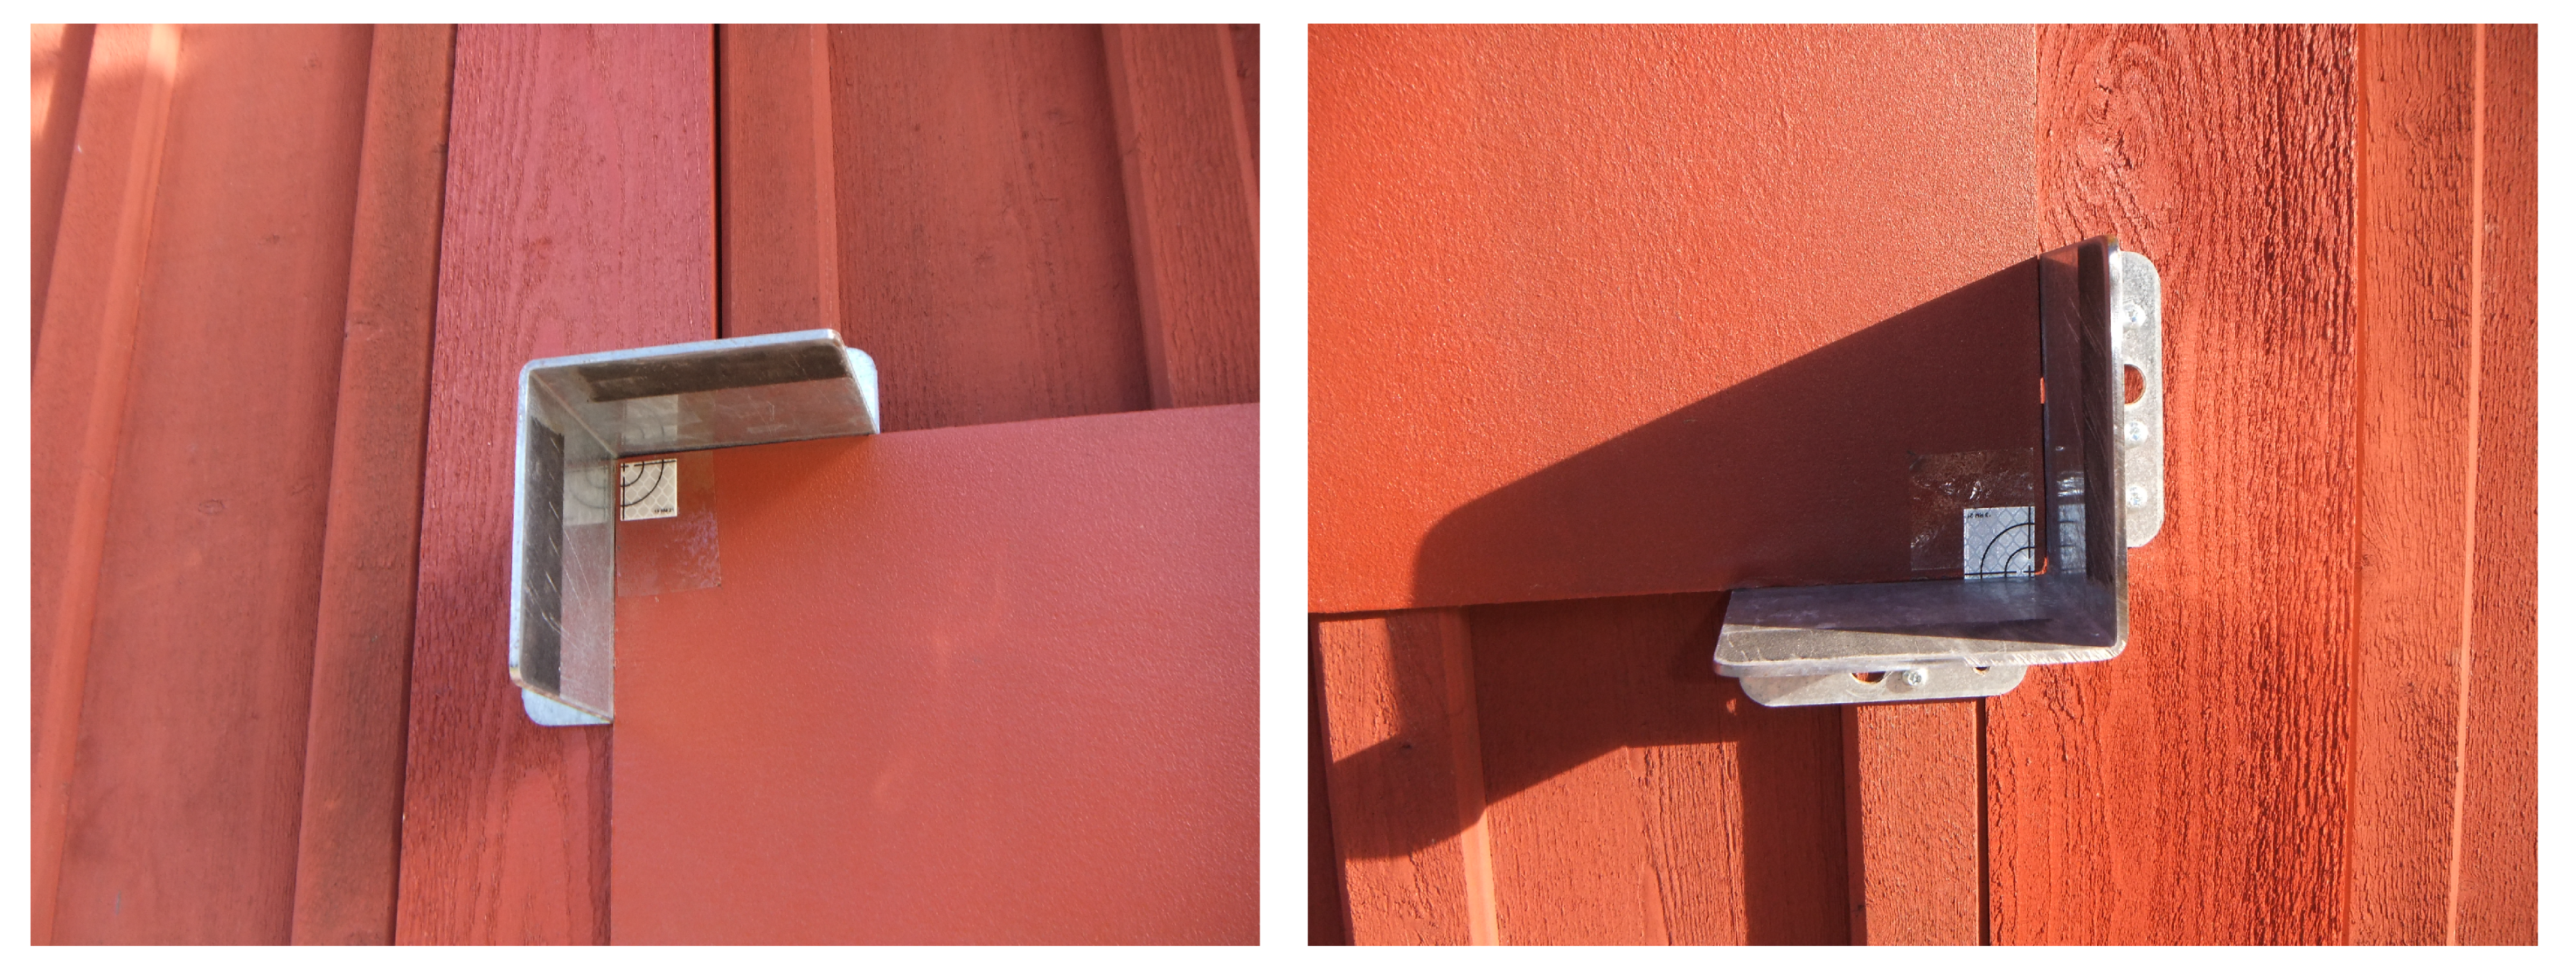
The rig was designed to be exactly the same size of the working area so that the positions of the heating devices with respect to the rig are equivalent to the thermal target positions in terms of the working area. To further ensure this, we mounted four metal stands at each corner of the working area (illustrated in Figure 9) so the rig would be confined by these stands when we pressed it against the working area. This meticulous alignment is necessary for minimizing one system intrinsic error source that will affect the target designation accuracy.
4. User Experiments
4.1. Subjects
We recruited 23 volunteers in total for this study, 10 females and 13 males. The youngest subject was 17 years old while the oldest was 65, with 39.7 years old on average. Three of them were from the building industry (two facility maintenance workers and one contractor). Ten of them were university students or teaching staff related to various fields in built environment, such as urban planning, building engineering, and indoor climate. The remaining of them comprised four lecturers in computer science, five high school students in natural science and an administrative worker. As for the previous experience with AR, seven of them had no experience at all; 12 of them had seen AR on various media and four had personally used AR applications.
4.2. User Task
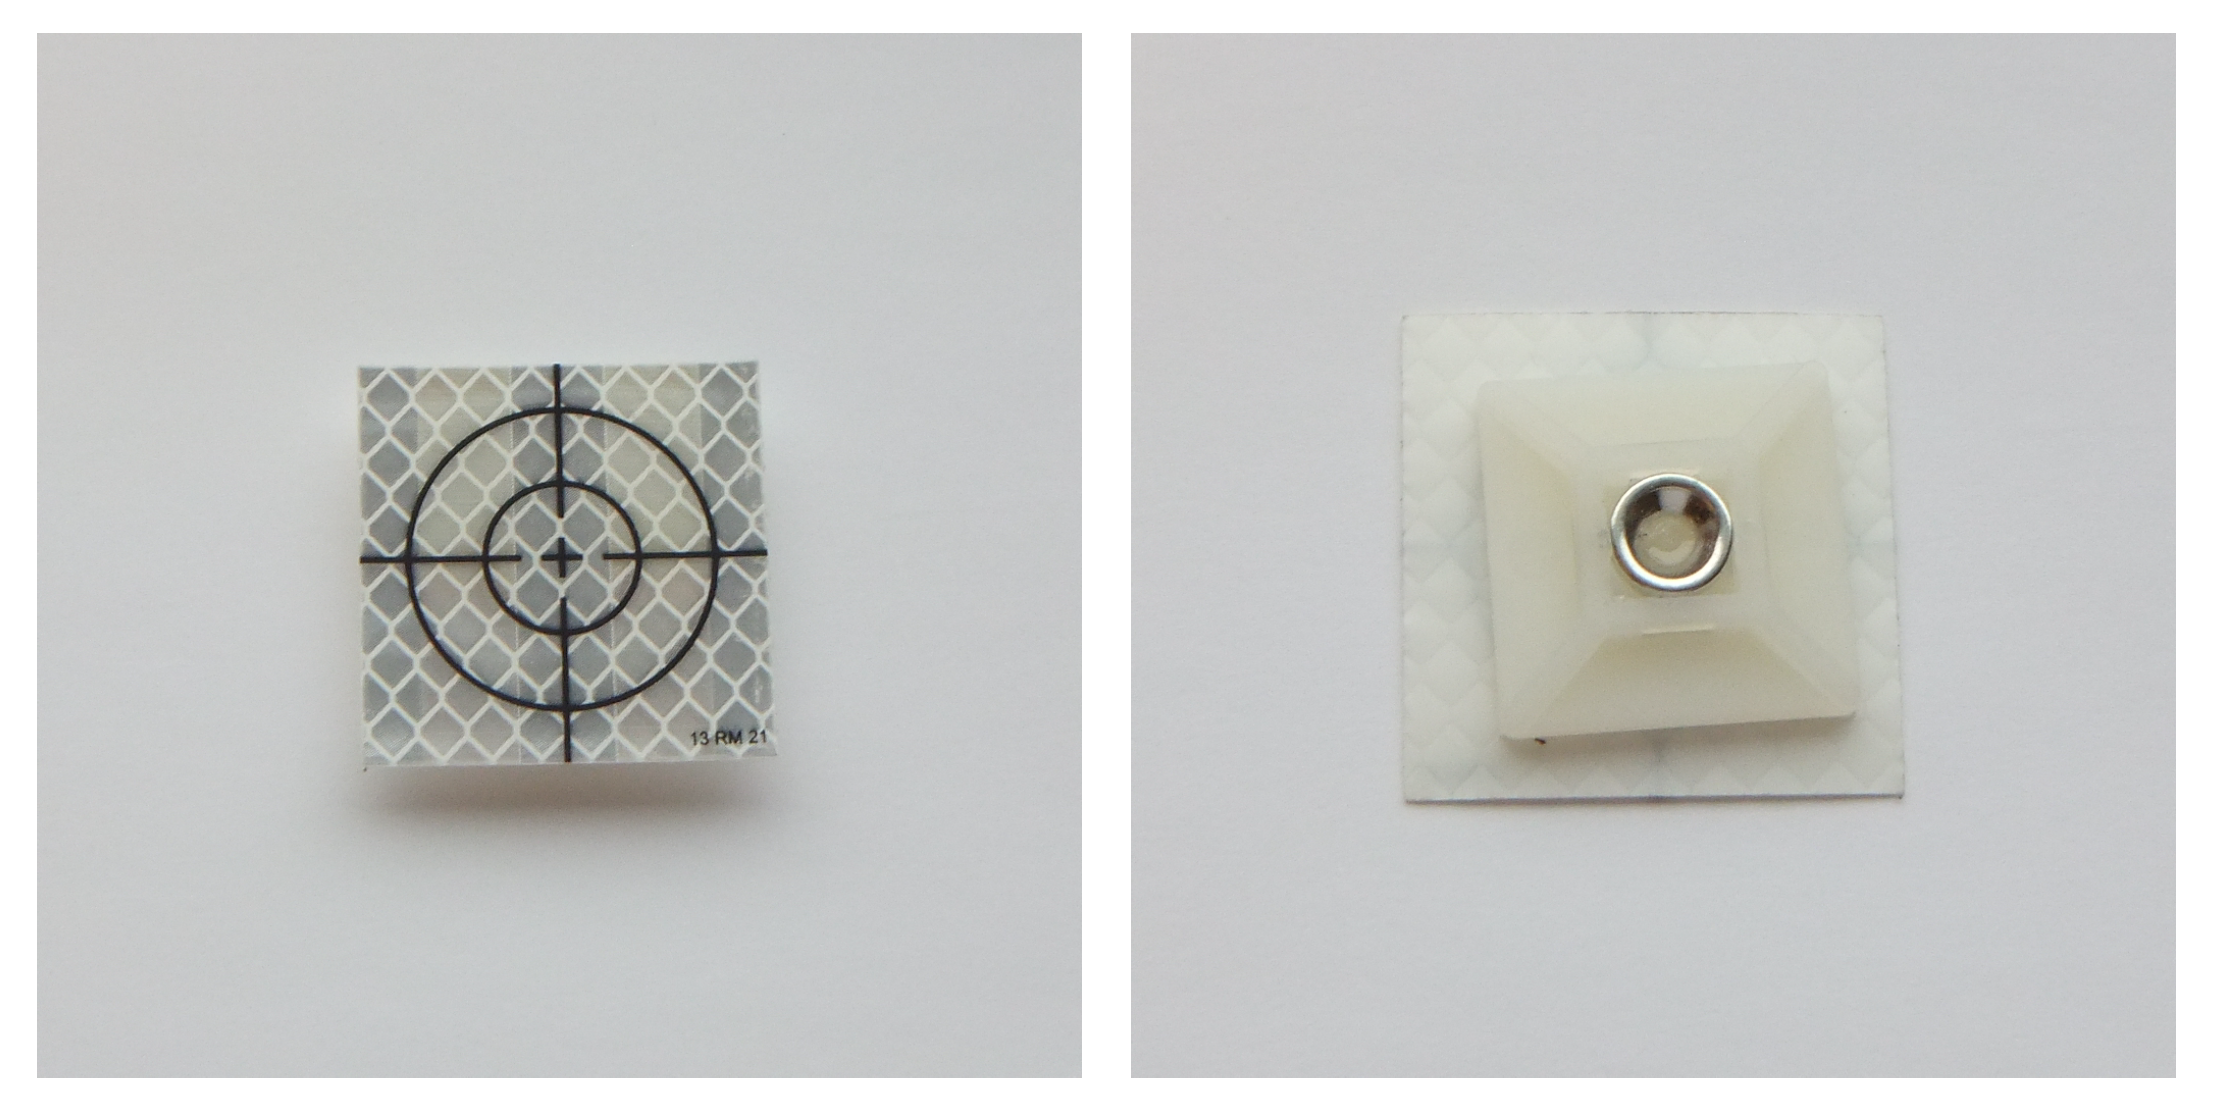
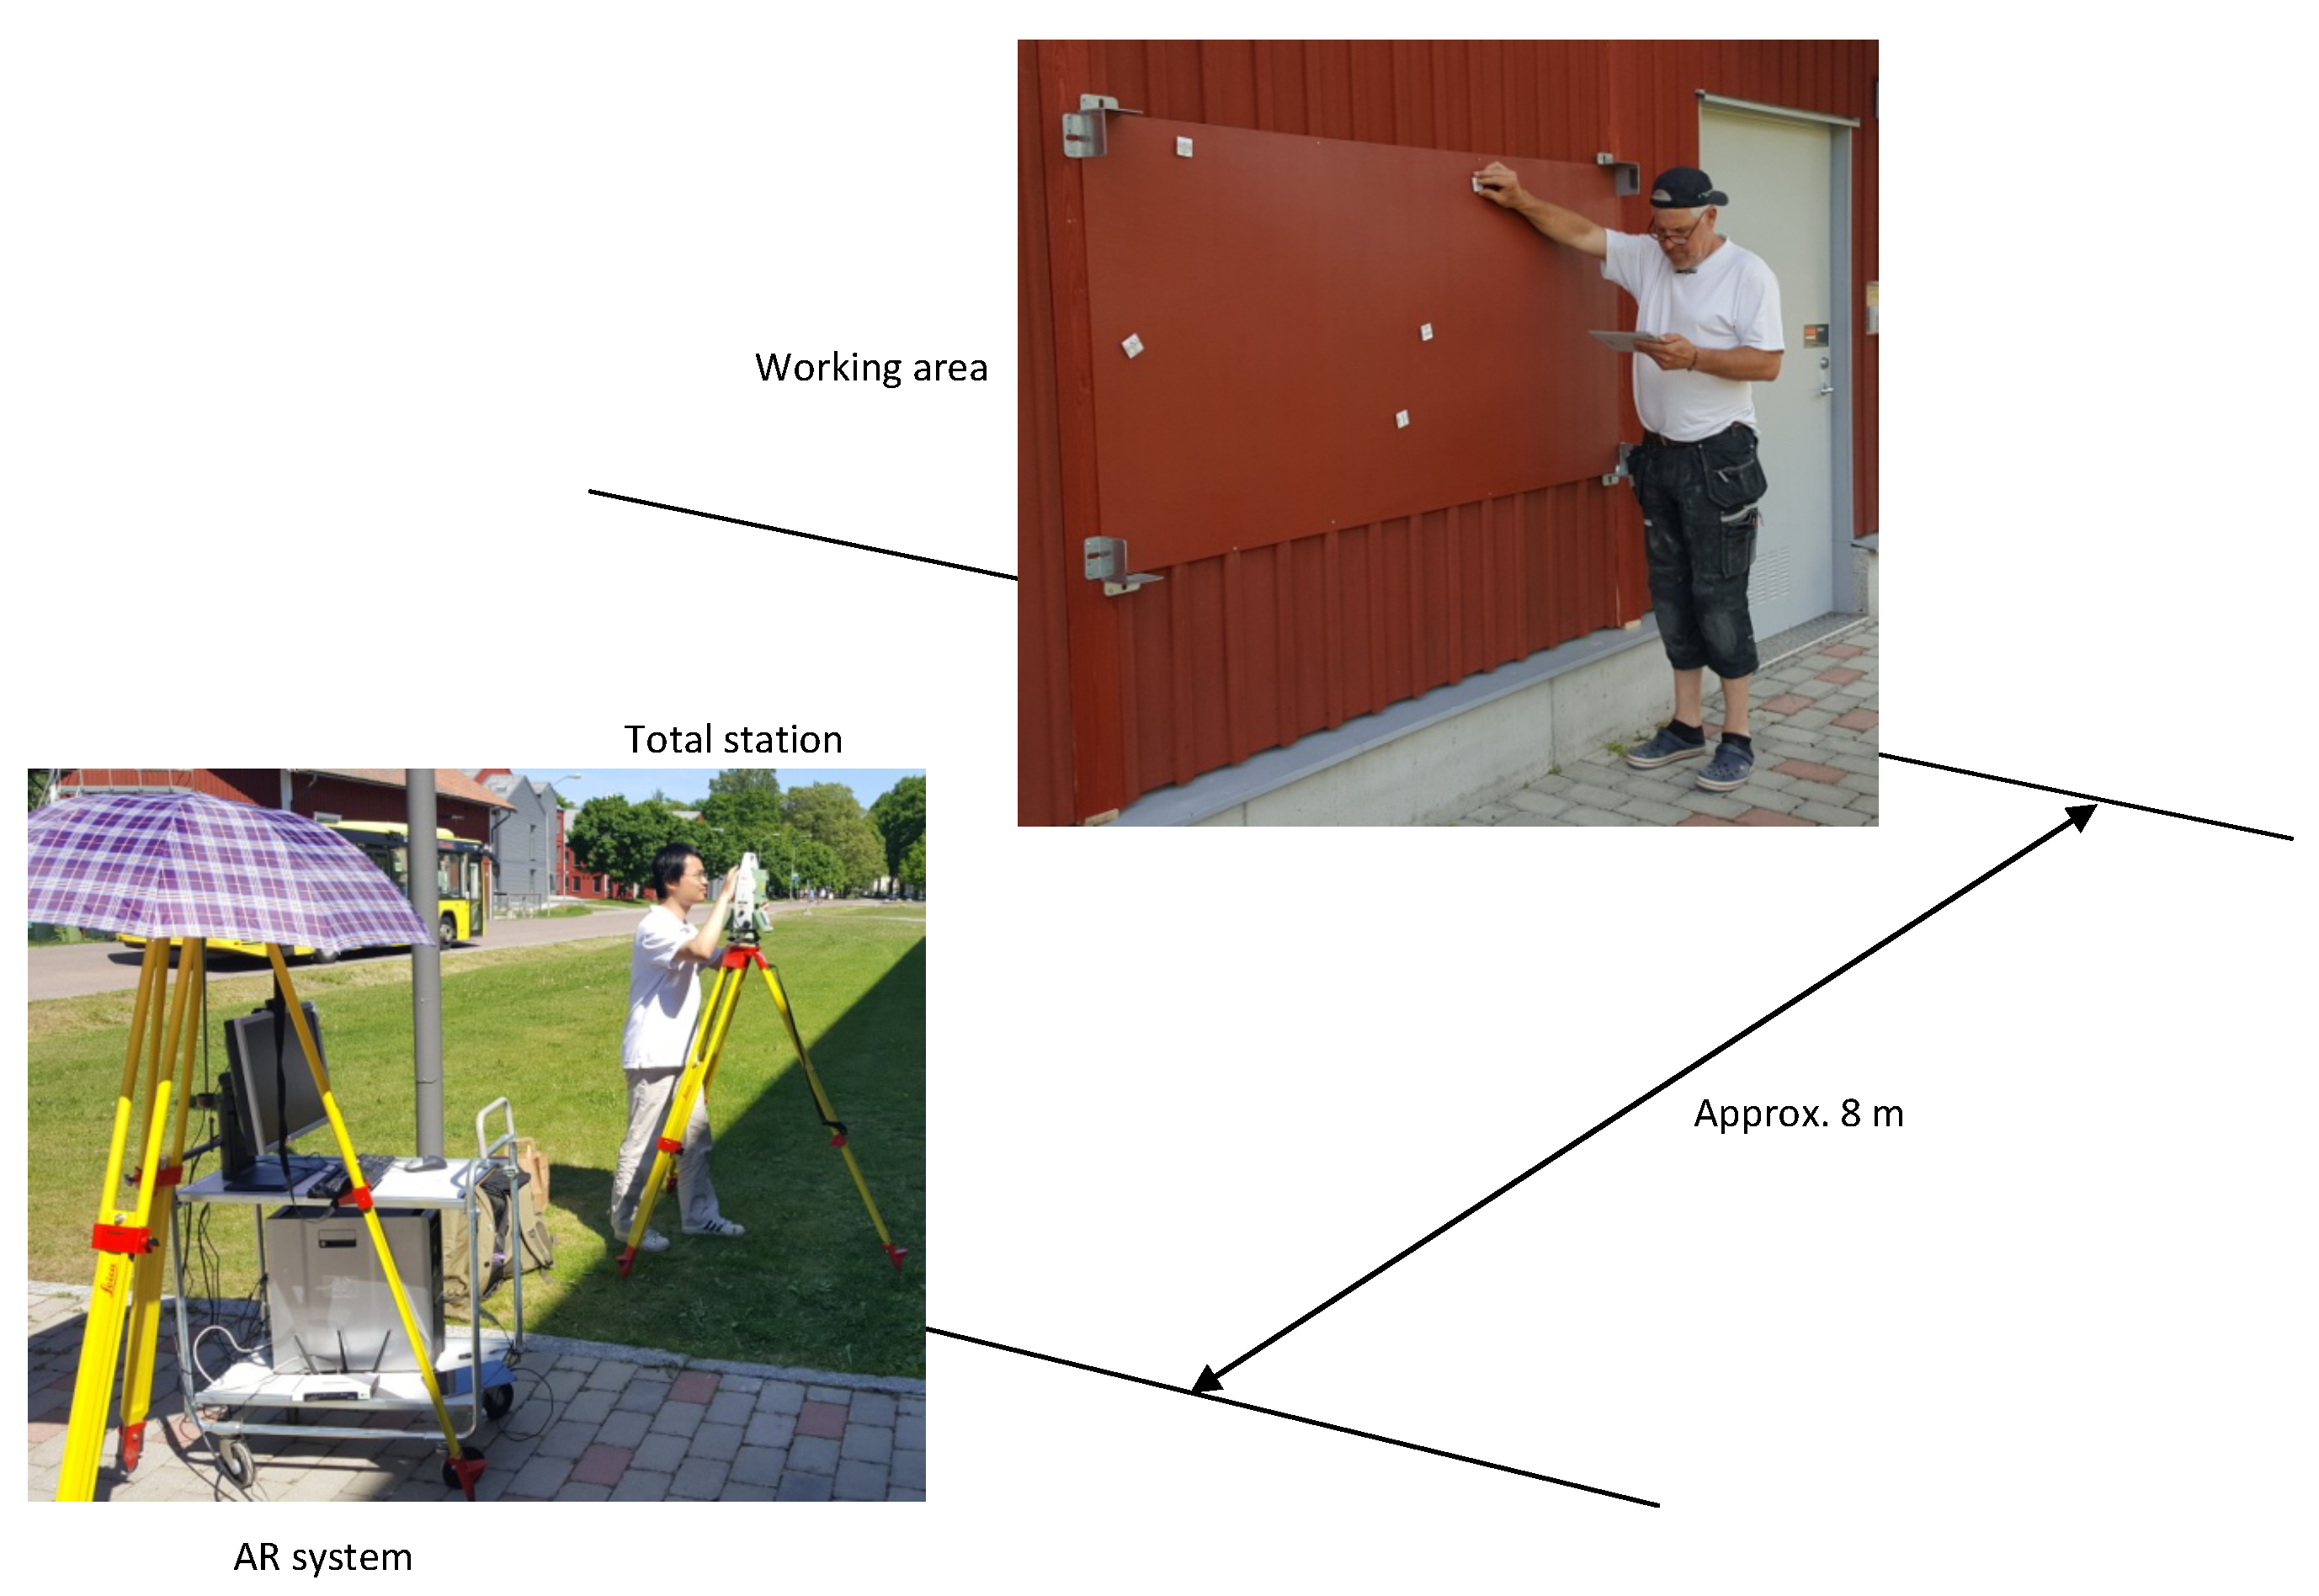
The task for subjects in our study was to designate 13 IR targets, which are displayed on the façade through the TPP AR system. A subject started the experiment by standing in front of the working area while holding the tablet computer. The task comprised 13 steps with only one target shown at each step and to advance to the next step, subjects needed to push the “Next,” button on the screen. The 13 targets were presented sequentially in the order of their identification numbers denoted in Figure 8. The order was designed in such a way that no subsequent targets were spatially close to each other. At each step, the subject picked up a marker and tried to align it with the target center as seen via the augmented video. The markers were made from a laser reflector adhered to a magnet (see Figure 10) so they would stick to the working area which was covered with metallic paint, as mentioned in Section 3.4. Once subjects were satisfied with the marker placement, they proceeded to the next step until all 13 targets were designated. No time limits were imposed on subjects during this experiment. Figure 11 illustrates a typical arrangement of the AR system in relation to the working area during the experiments. The figure also shows a subject performing the target designation task.
4.3. Experimental Procedure
Prior to the arrival of the first subject for each session, we performed two procedures to prepare for the experiments. The first one was setup of the AR system, which started with our moving the trolley to a pre-determined location in front of the façade. This ensured that the façade view captured by the webcam did not vary much between experiment sessions and the registration results were nearly the same for all the subjects, thus avoiding unnecessary system inherent errors. Next, we used the webcam to take a picture of the façade and registered it with all the IR targets by running the method implemented in [40]. Here, we also included five extra arbitrary targets for a practice session. We made sure these five practice targets did not coincide with any of the 13 targets used in the test. All 18 pre-warped IR images were then imported into our Unity application running on the desktop computer. The second procedure involved establishing a mechanism for retrieving the designated positions in the working area as marked up by subjects. We opted for a total station to measure the positions due to its high accuracy. Positions reported by a total station are expressed in terms of its own coordinate system, hereby denoted as . Hence, to transform coordinates in to the coordinate system of the working area, (wherein the ground truth of target positions were measured), we need to calibrate the total station. To this end, we first set up the total station and then measured the coordinates of the bottom left corner, the bottom right corner and the top left corner of the working area in . These corners were visually identified by laser reflectors (the white markers inside the metal stands shown in Figure 9), which could be sensed by the total station. With these three reference coordinates established, coordinates can subsequently be transformed between the two coordinate systems and .
A subject’s experiment began with a short interview, wherein we inquired such basic information as age, occupation, previous experience with AR and eyesight condition. Afterwards, we introduced the subject to the task and the tablet application. The subject was informed that the time of designating each target was recorded, but we also explicitly instructed him to mark the target as precisely as he could. Apart from that, no other user-testing protocols were adopted. These instructions were followed by the practice session where the five practice targets were displayed in turn and the subject took him time to familiarize himself with the task. Once he felt ready, he could proceed to the actual task with the 13 real targets. During this phase, we did not have any further interaction with the subject and he completed the task independently. There was another short interview upon the completion of the task, wherein we asked the subject to rate the difficulty of designating the targets, the impression about the correctness of the designation (both on a Likert scale of 1 to 6) and to answer two open questions: “What do you think could be improved with this application?” and “What was most difficult in performing the task?”. At the end of the subject’s experiment, we measured the coordinates of those 13 markers in the working area using the total station. During the measurement, we aimed the reticle of the telescope at the center cross of each marker.
4.4. Experimental Results
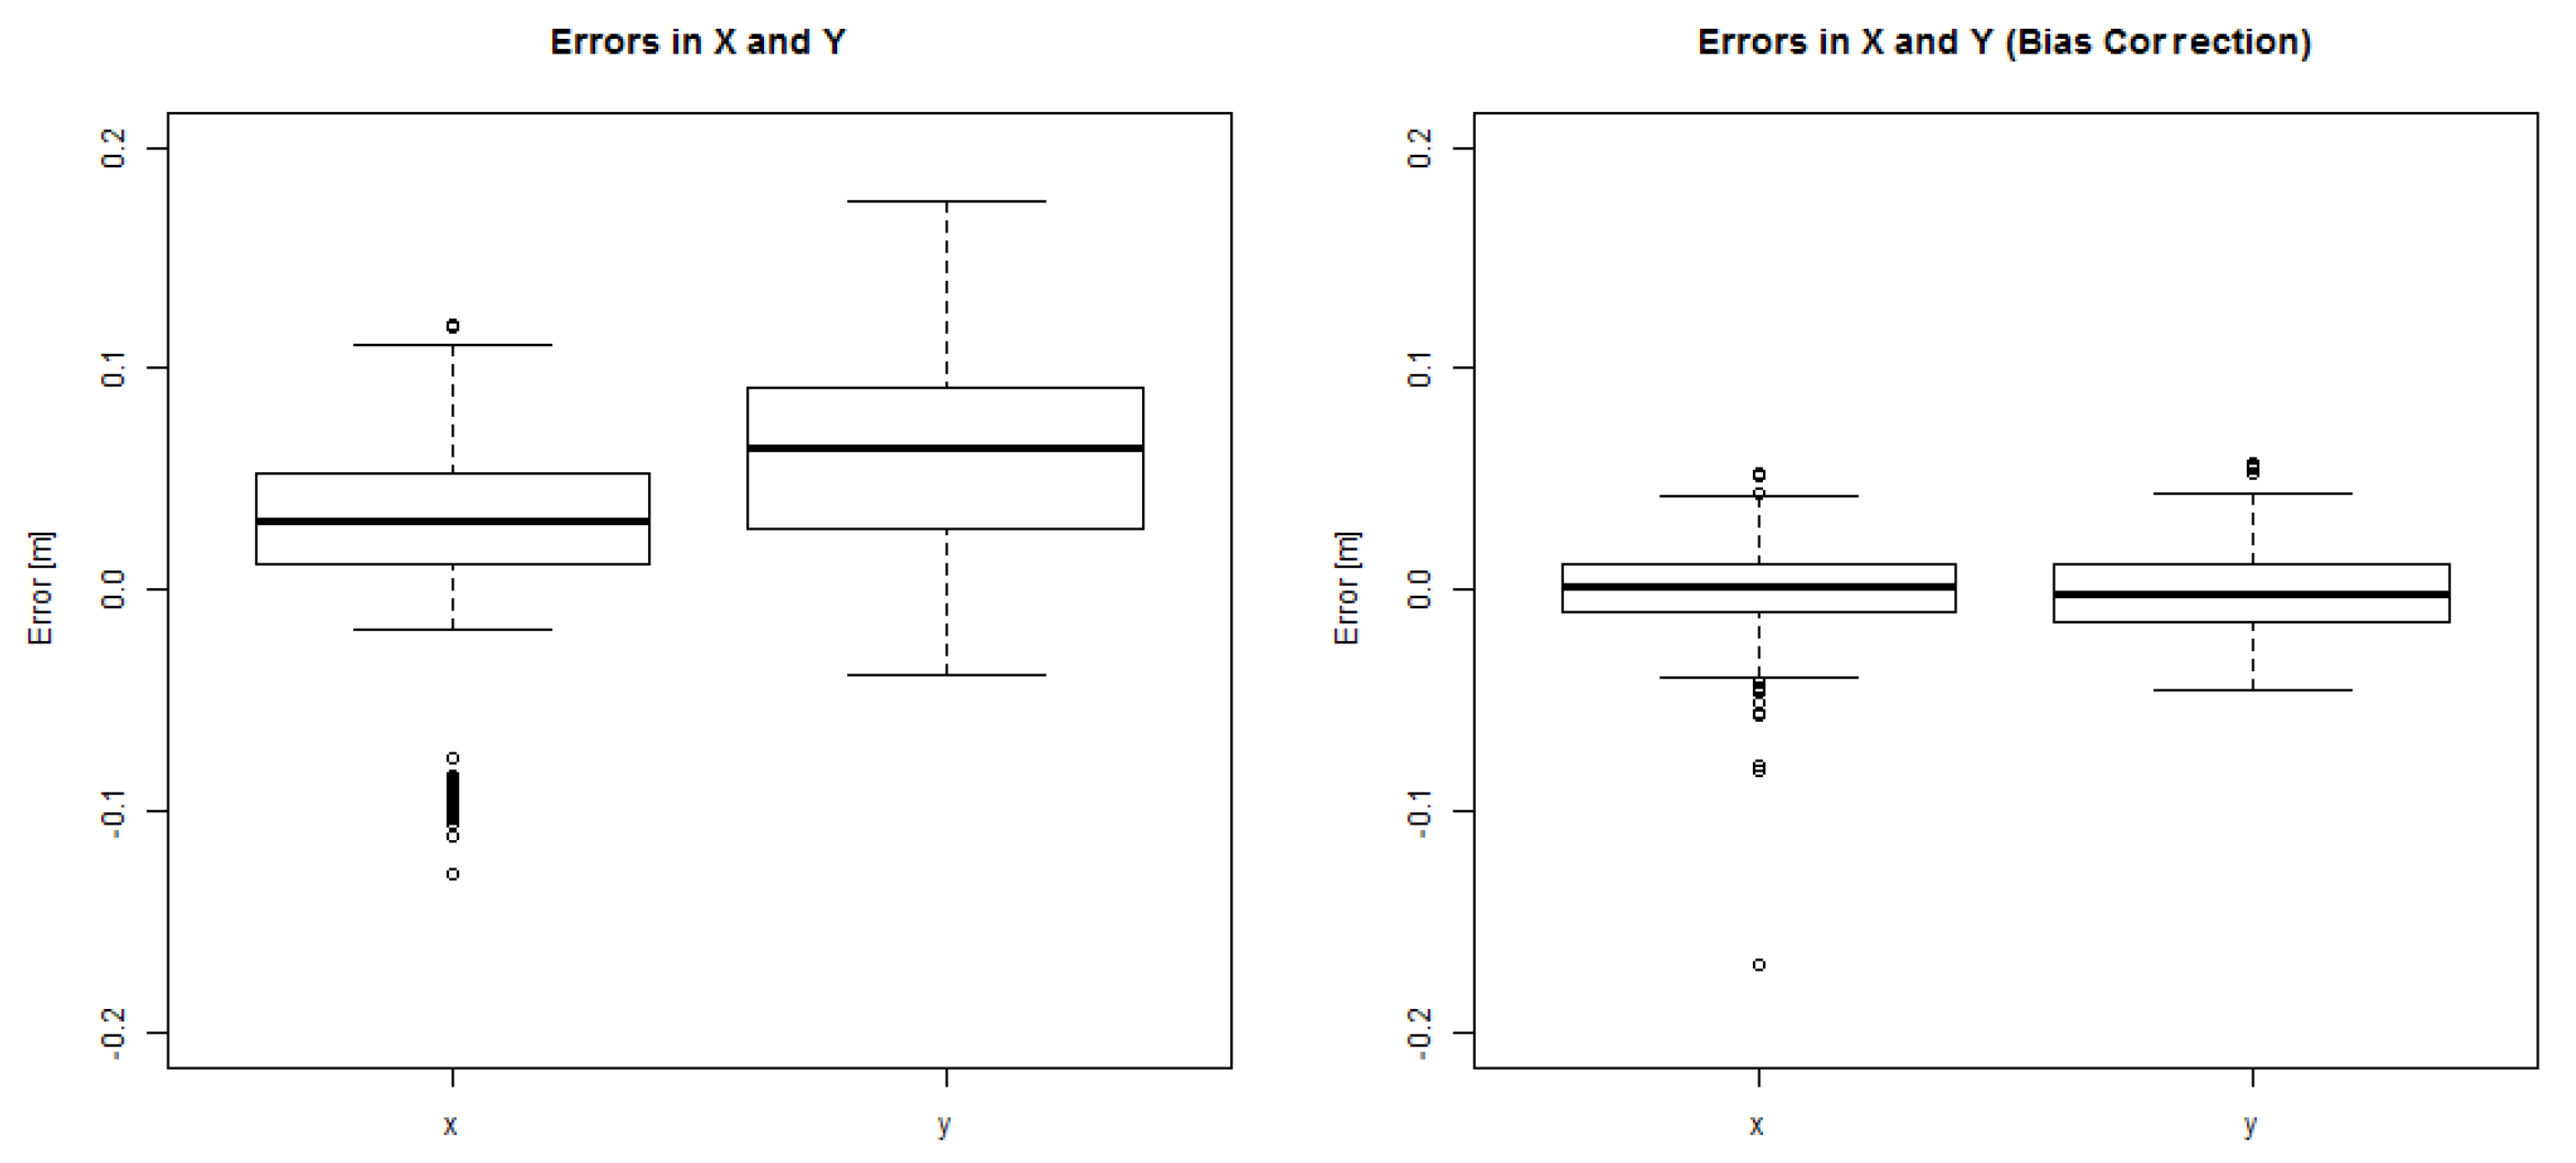
Observations of the user experiment comprise measured positions and completion times recorded for 13 targets from 23 participants in our study, altogether 299 observations. The raw 3D positions acquired by the total station were transformed into the local 2D coordinate system of the working area based on acquisition of aforementioned three reference points after every setup of the total station. For evaluation of precision and accuracy, the deviations in X (horizontal) and Y (vertical) of the measured positions from the known target positions were determined. The boxplot in Figure 12 (left) shows deviations in X and Y for all 299 observations. Median deviation in X is 3.1 cm and the interquartile range (IQR) is 4.0 cm. For the deviation in Y, the median is 6.4 cm and the IQR is 6.4 cm. In terms of Euclidean distance, the deviations correspond to a median of 7.6 cm with an interquartile IQR of 7.5 cm. Under normal conditions positioning errors are expected to occur similarly to either side of the true target position, but a bias exists here apparently. Measured target positions are positively shifted both in the X and Y directions. In addition, the dispersion is notably larger in the vertical direction (Y).
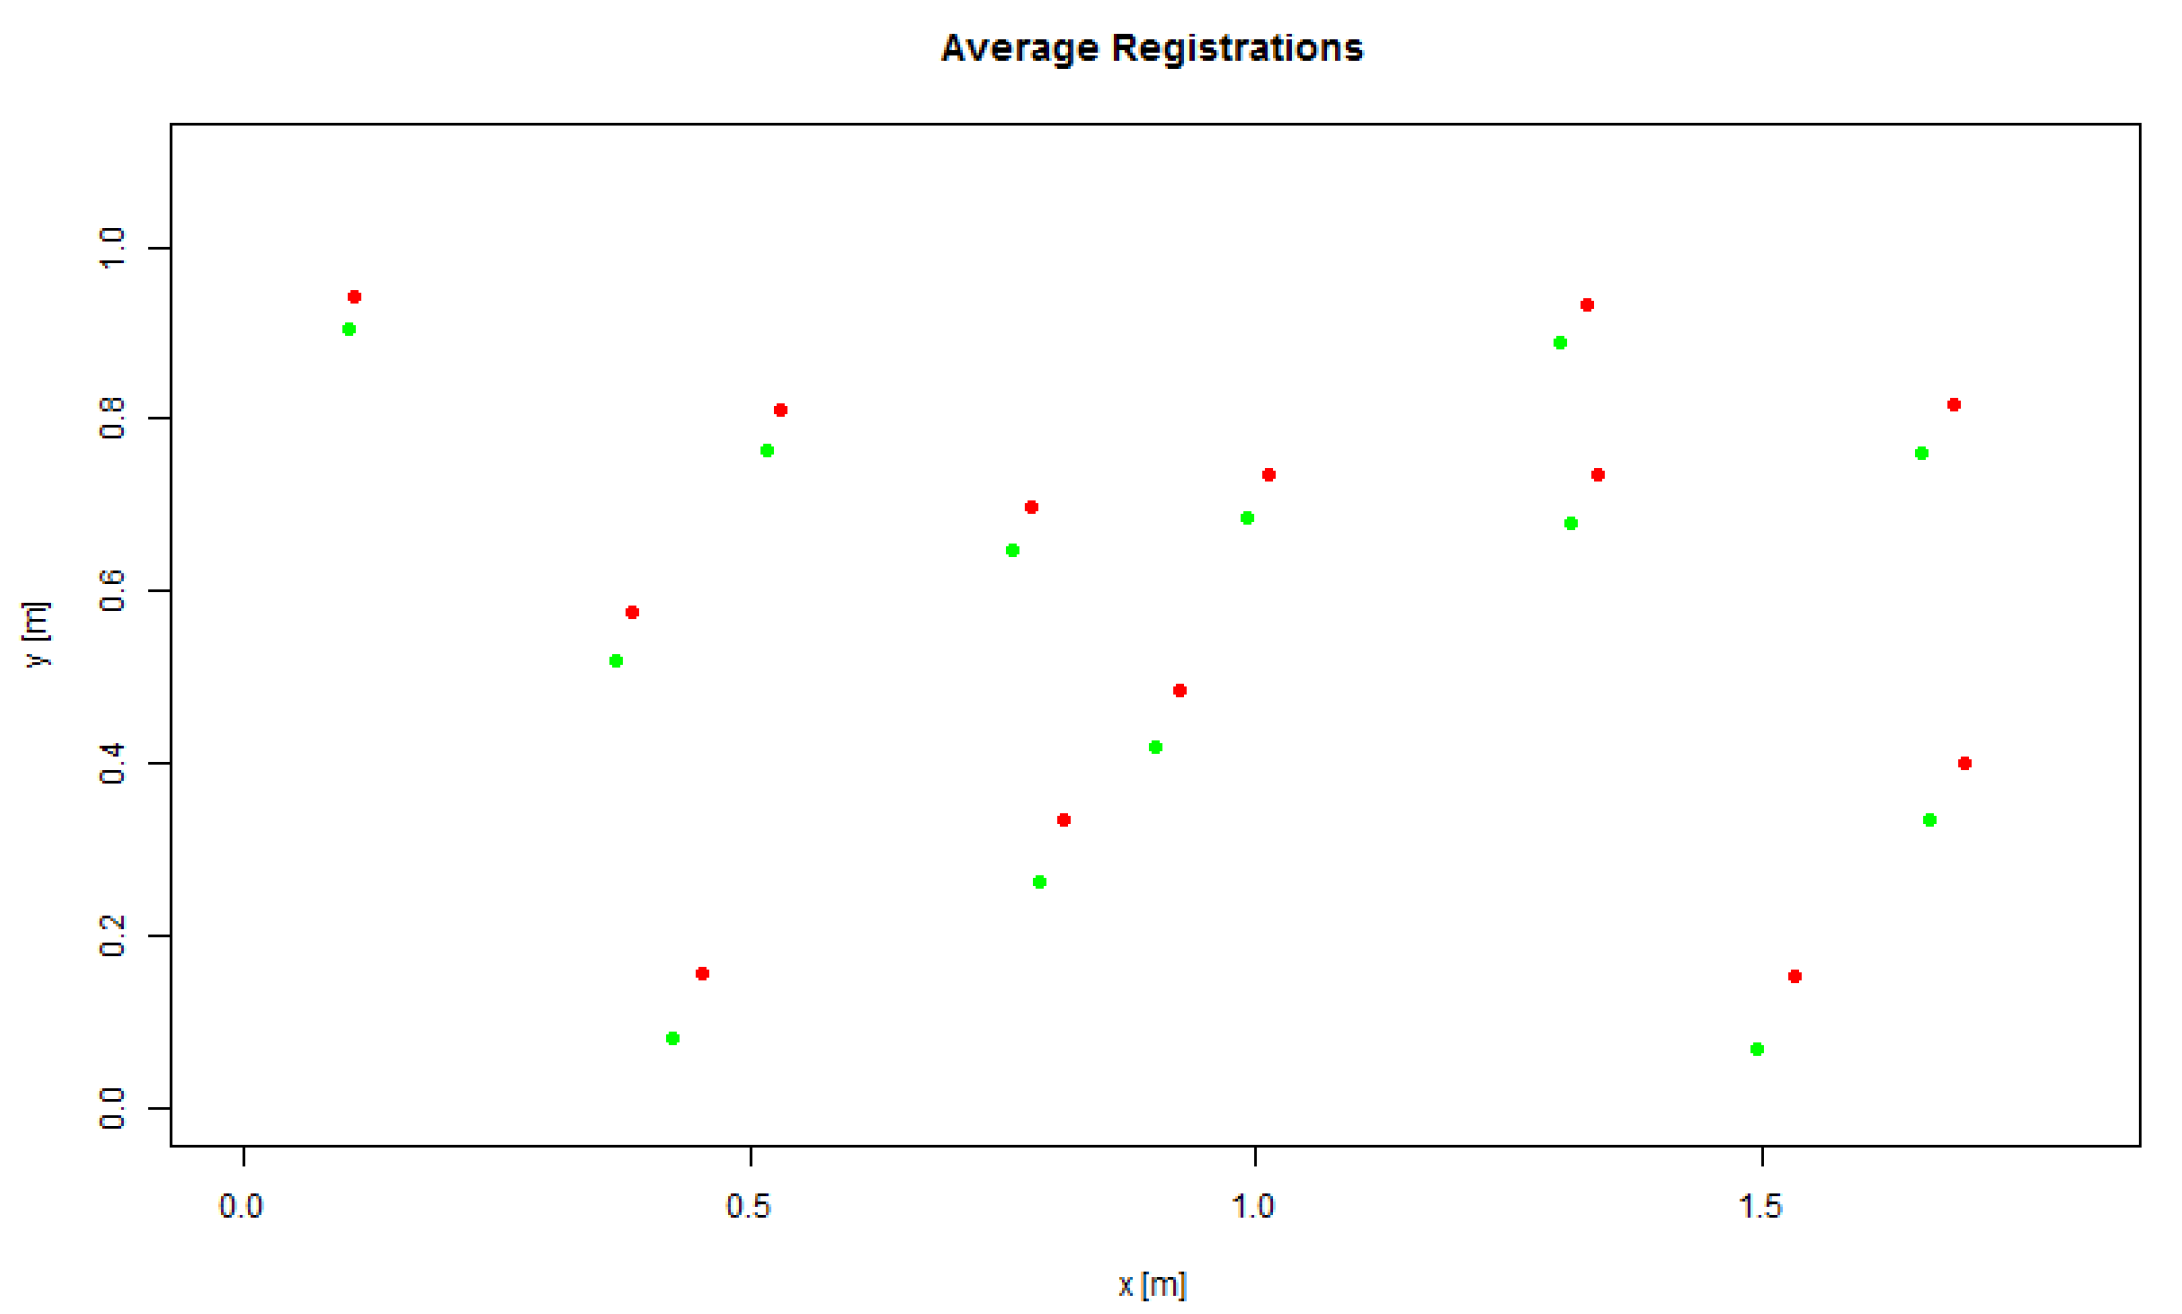
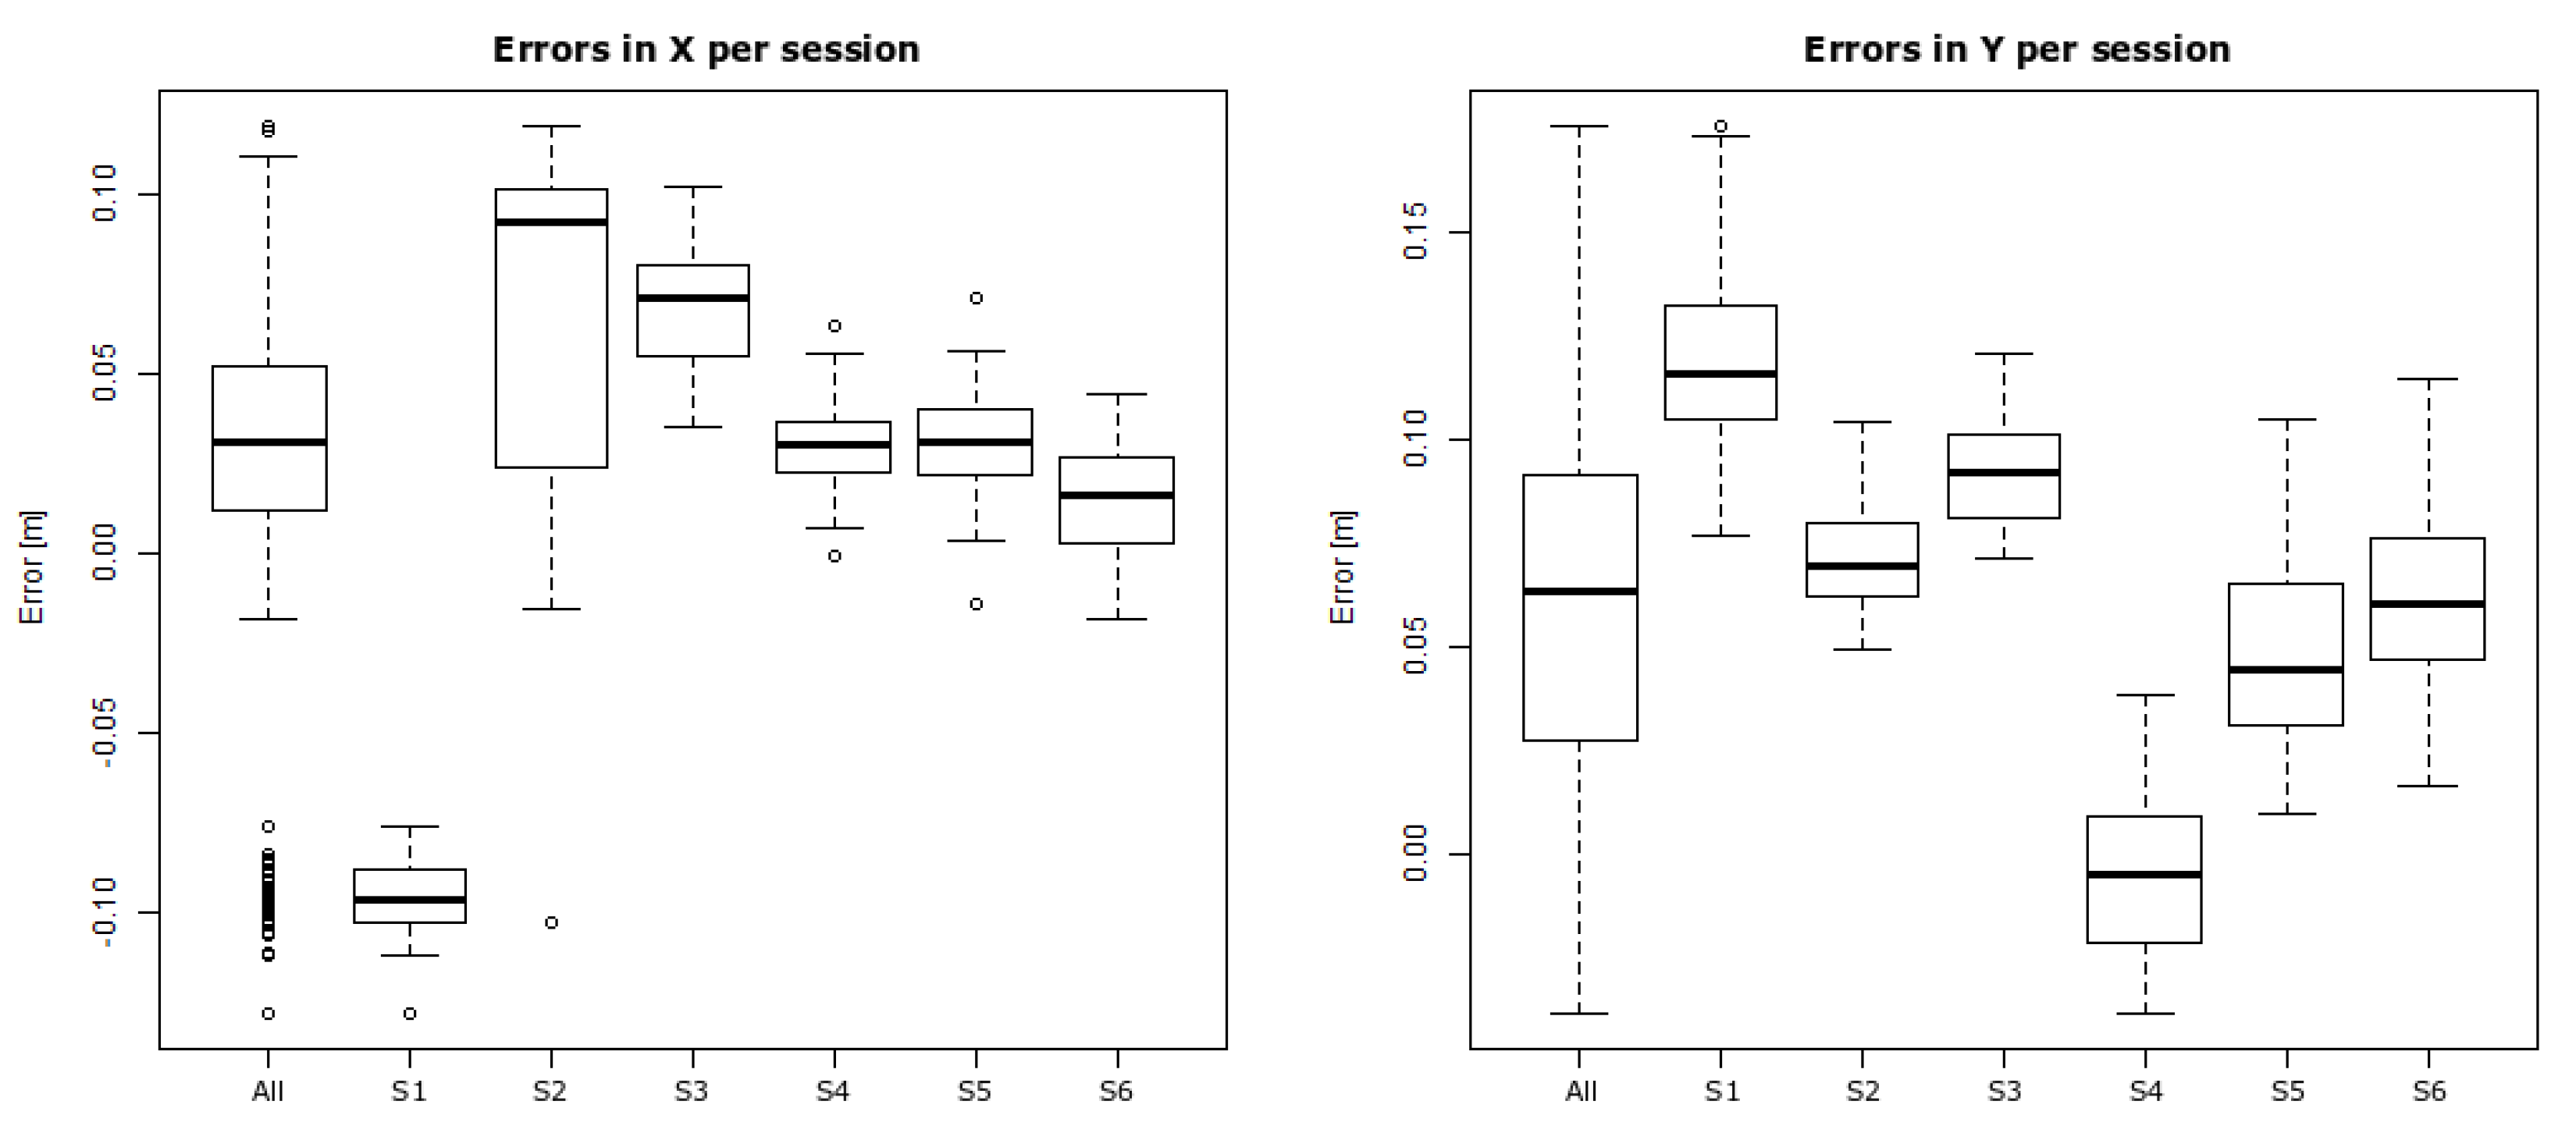
To identify the source of this potentially systematic bias, we further plot in Figure 13 the average measured positions for each target together with the ground truth positions. Visual inspection of this plot reveals that the suspected shift is consistent and nearly constant in magnitude and direction for all targets. Namely, it does not depend on target positions. A systematic bias of the kind seen here can be either explained by systematic errors of the measuring procedure using the total station or by errors in the AR software calibration, which is the spatial co-registration of the visible and IR images. Measuring errors from the total station are here dismissed because the distances measured between the three reference points within the working area were verified to be close to their true values in all experiment sessions. To further analyze those systematic errors, we group the data by each experiment session. Figure 14 shows boxplots of deviations in X and Y per session. The plots reveal that bias varied largely between subsequent sessions and that dispersion within each session is much less in comparison with the entire dataset.
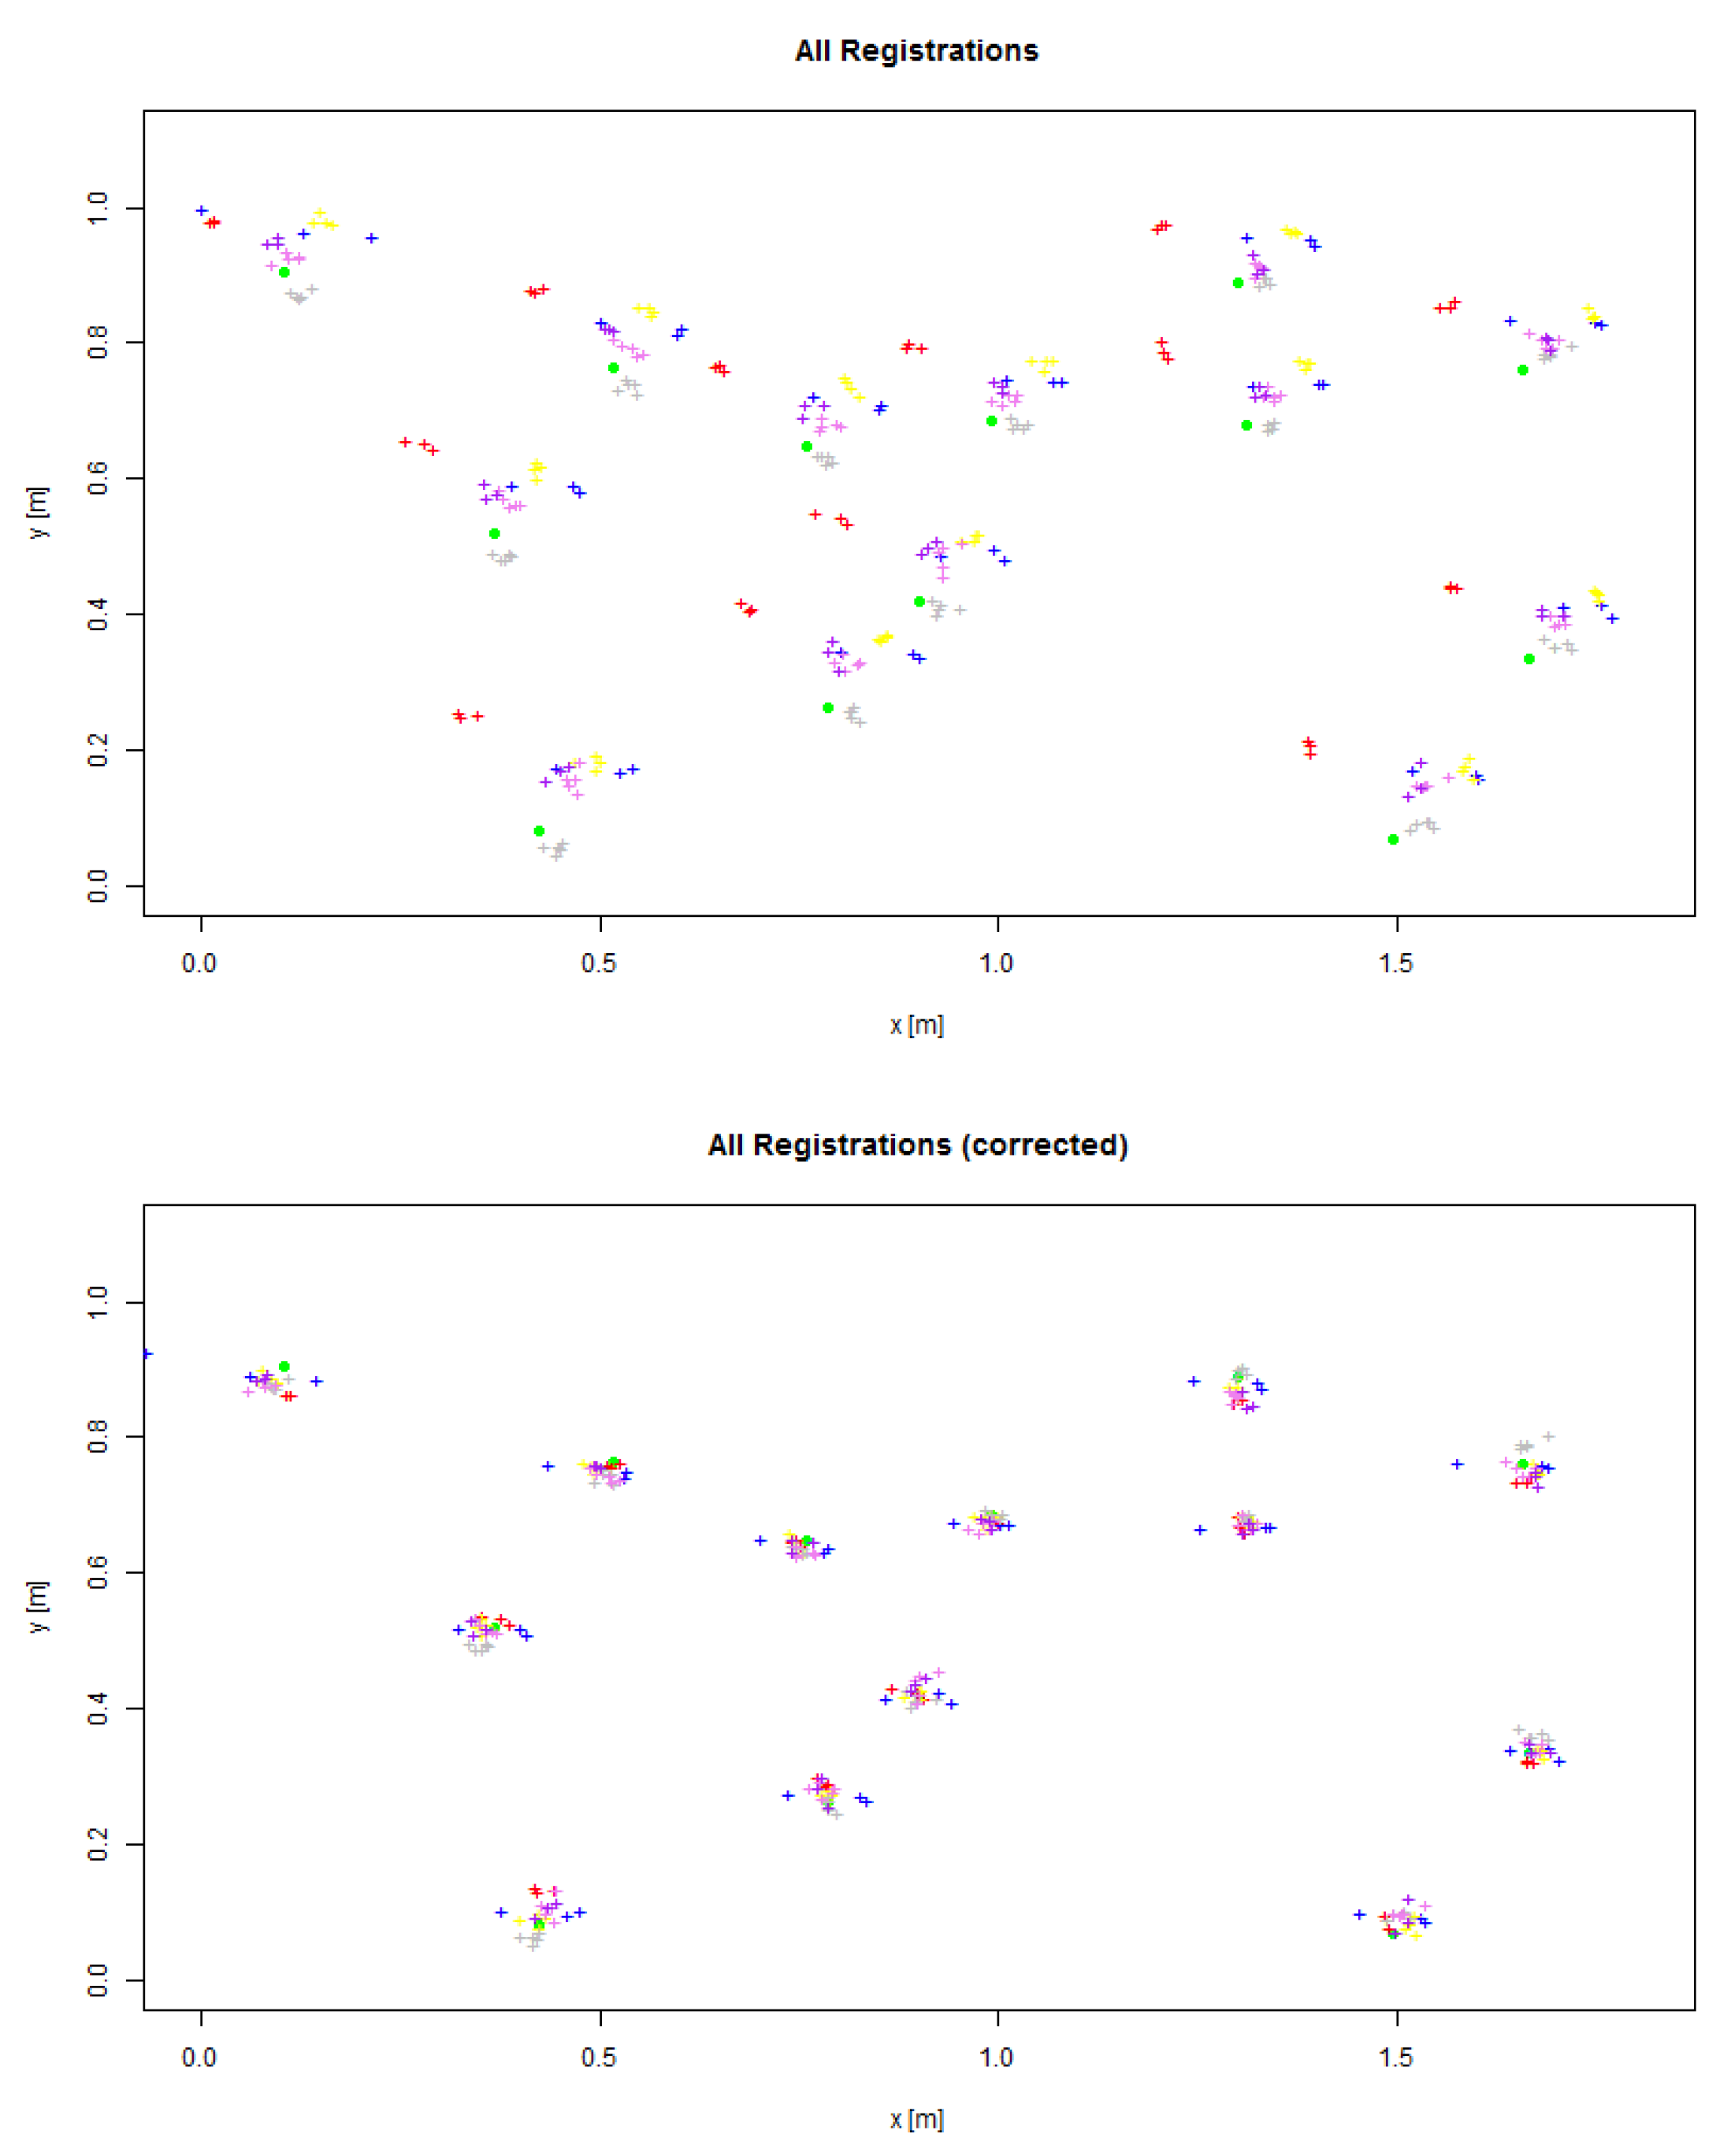
To further verify that bias, again, is consistent for all targets within one experiment session, a more detailed plot is reproduced in Figure 15 (top) where all observations are plotted (as color-coded crosses) in comparison to the ground truth positions (filled green circle), with colors indicating experiment sessions. As this plot clearly shows, different biases were introduced per experiment session and affected positioning of all targets within that session almost equally. Hence, we attribute those varying biases to the registration of the infrared images with the real images—a process that was carried out before every experiment session given the position of the third person camera. To quantify this registration error further and to separate it from users’ imprecision of acquiring target positions through the AR interface, we perform a bias correction of measured target positions per experiment session. The correction vectors are hereby hypothetically composed of the mean deviations (in X and Y) from the ground truth in each session as shown in the boxplots in Figure 14. Table 1 lists exact coordinates of those correction vectors. After session-wise bias correction, measured target positions are on average more closely centered on the true positions (see Figure 15, bottom). Boxplots of bias-corrected data i.e., the residual errors are seen in Figure 12, right. The per-session bias adjustment not only leads to a close to zero centering of the observations, it also reduces dispersion of the residual errors. The IQR for X is now 2.1 cm and for Y it is 2.6 cm. Medians are now 0.1 cm in X, and −0.2 cm in Y. In terms of residual distance errors (expressed by Euclidean distance), which are more relevant to describe users’ precision when they interact with the AR system, the median is 2.2 cm and the IQR is 1.8 cm.
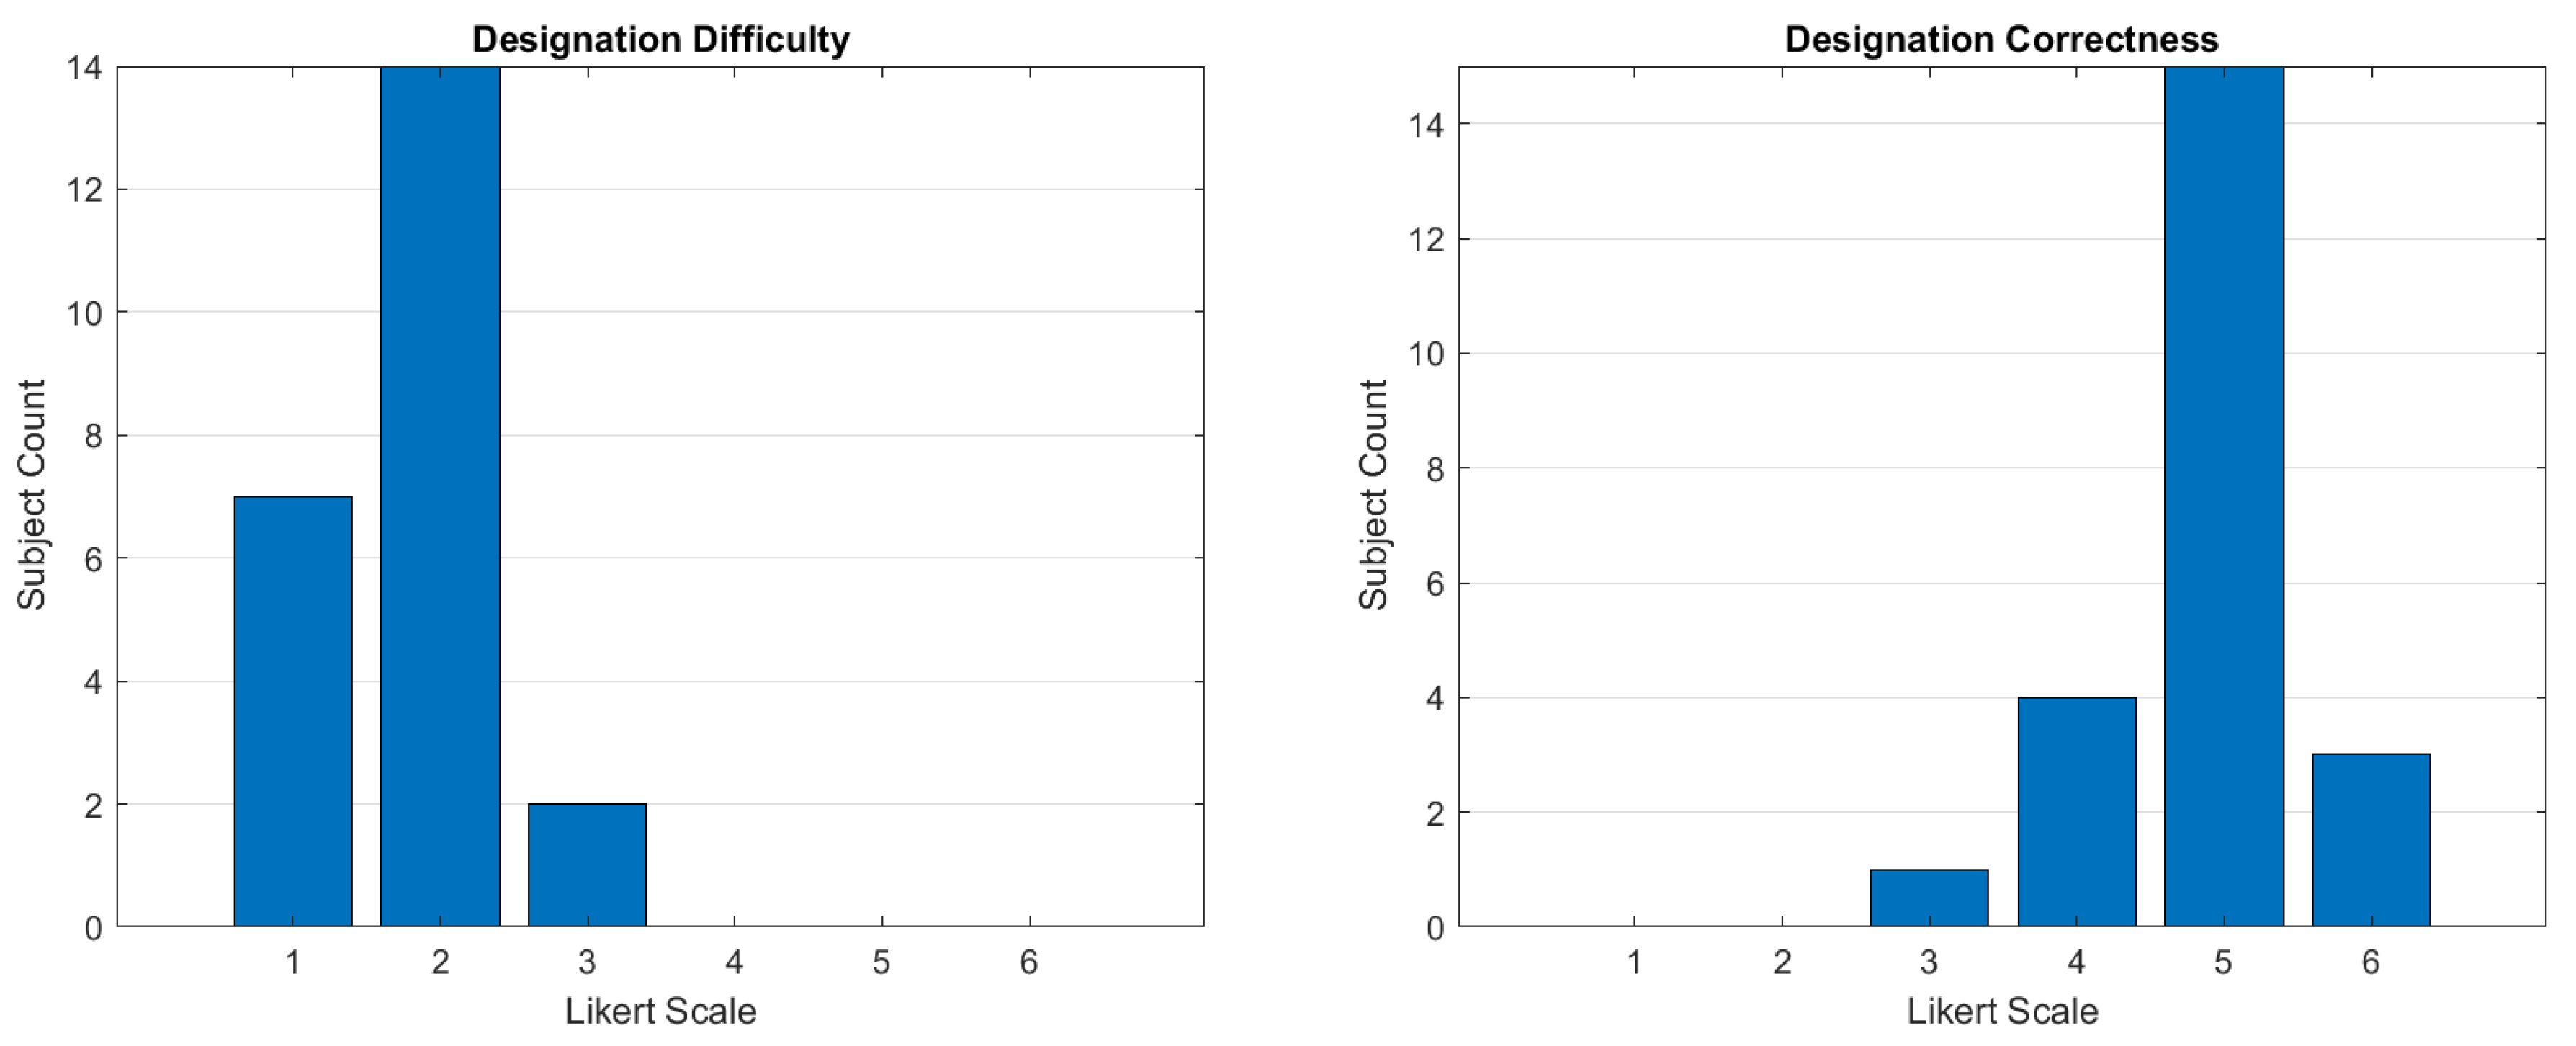
In regard to observed times for target designation using the AR tool, our data analysis did not indicate any statistically relevant association between designation times and errors, nor between times and target or experiment sessions. To summarize time observations, overall, subjects took on average 17.92 s per target, but there was huge variation between individual subjects with the fastest subject spending on average 7.57 s per target, while the slowest subject used on average 30.46 s per target. Again, no correlation could be found between subjects’ speed and errors. Lastly, responses to the two open questions at the end of each experiment, namely, “What do you think could be improved with this application?” and “What was most difficult in performing the task?” can be summarized as follows: video resolution was low and it was difficult to determine whether the markers had been placed accurately. Nevertheless, the majority of subjects still believed that the system was easy to use and they had designated the targets accurately, as indicated by the other two Likert scale-based ratings performed along side those two open questions (see Figure 16).
5. Registration Experiments
Overall target designation errors as observed in the user experiment are, as shown in the previous analysis, subject to several sources of errors. To ascertain the sources and magnitudes of contributing factors, we executed a number of experiments to establish benchmarks for various potential sources.
5.1. Benchmark Tests
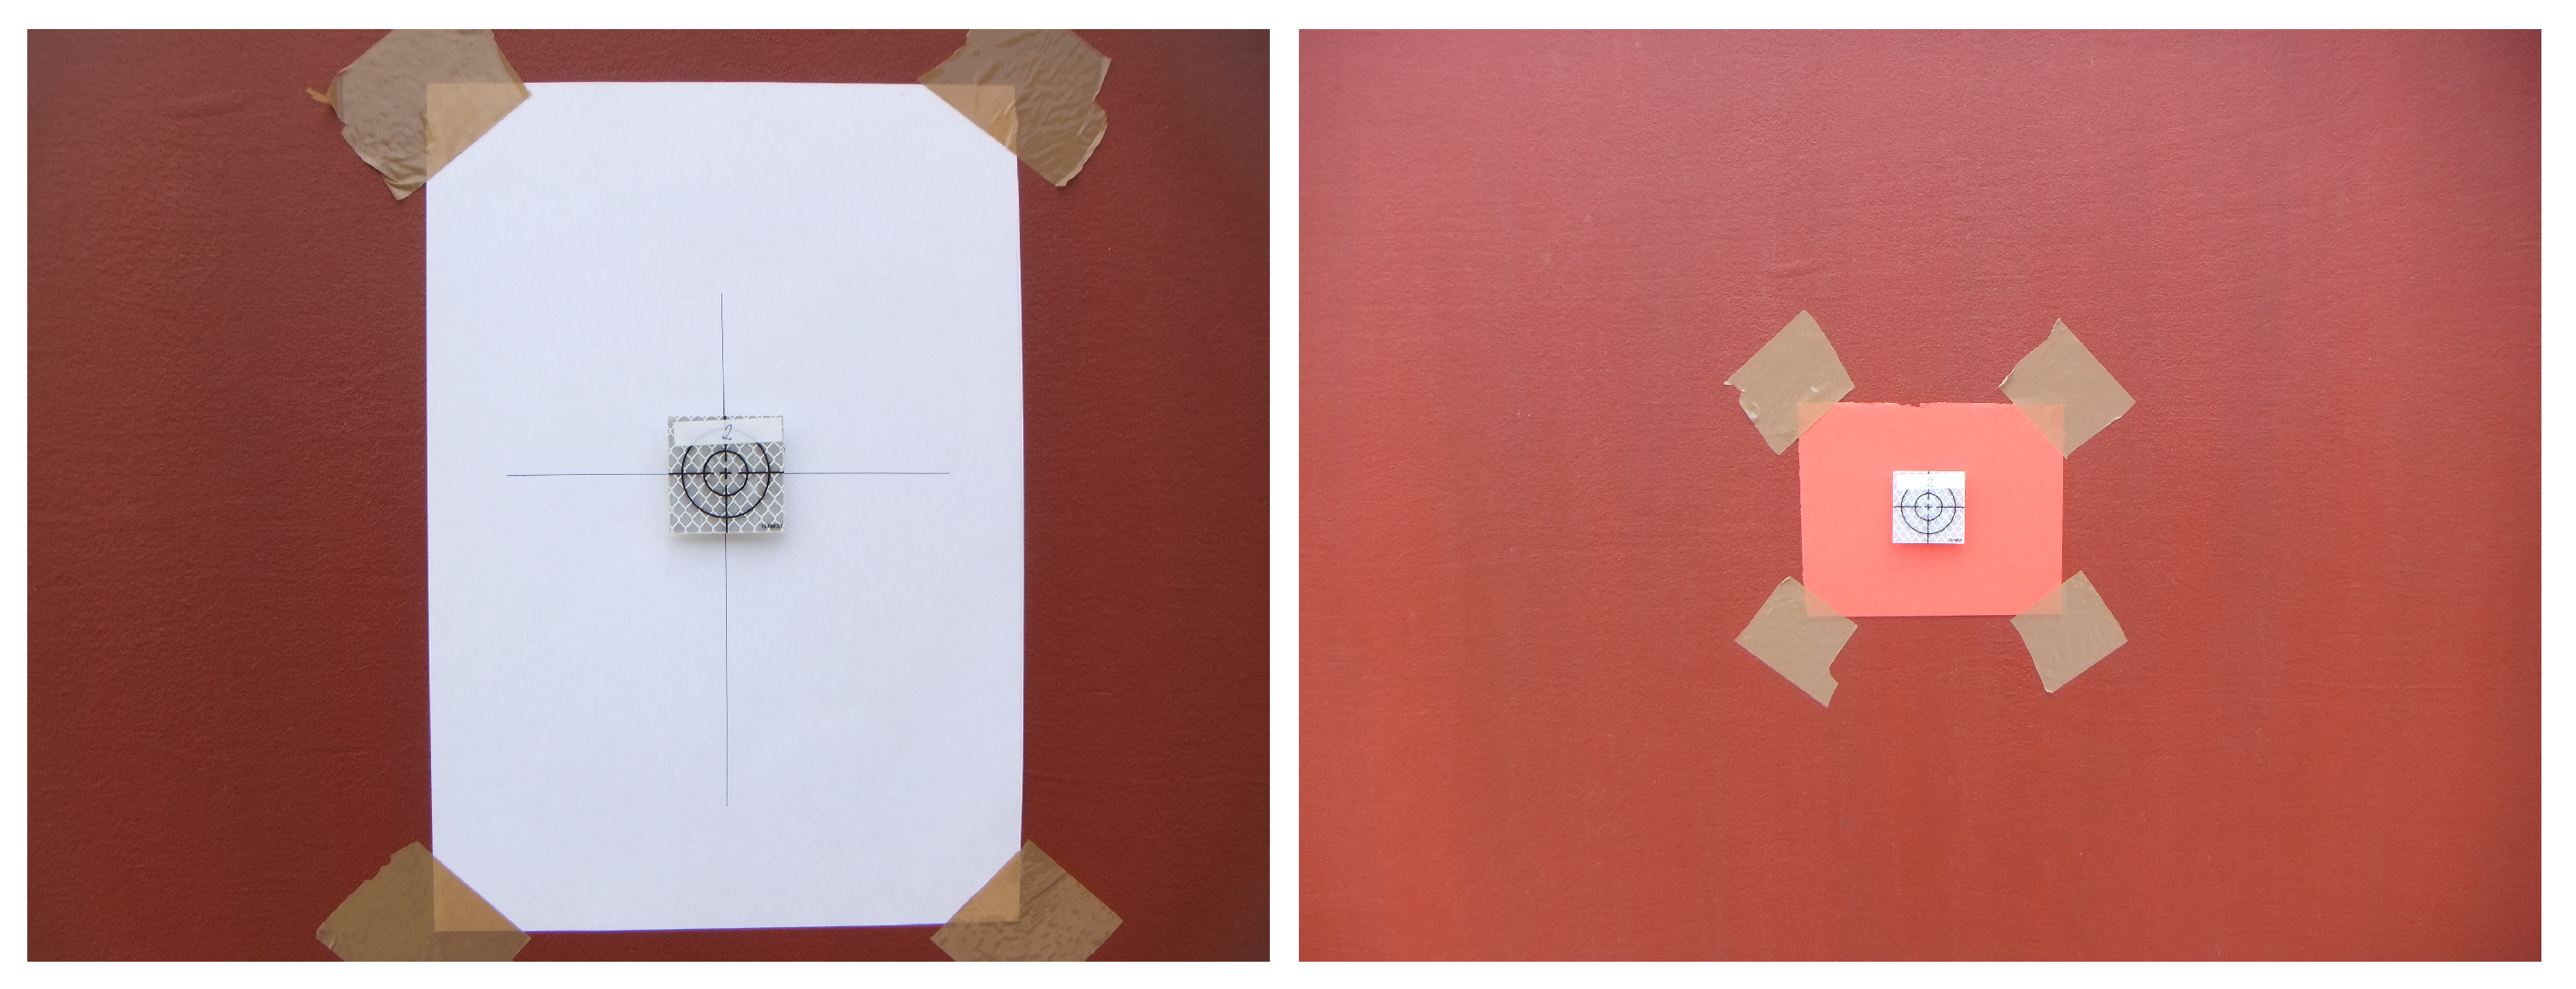
In the first benchmark test (B1), we were interested in finding a human user’s precision in repeatedly repositioning the reflective marker on a given fixed target within the working area under the best circumstance. It characterizes the human’s visual-motoric skills to mark a visual target under an ideal condition. To that end, we chose a highly contrasted crosshair printed on paper and attached it to the working area and asked a user to place the magnetic marker so that it is centered with the crosshair as accurate as possible (see Figure 17, left). The position of the magnetic marker was then measured using the total station. Thereafter, the marker was removed and this procedure was repeated over for one hundred times.
While the target center marked by a crosshair in B1 is ideal to distinguish, the true center of a heat spot as mediated through the AR interface in the real experiment is of course much less clearly defined. Instead, due to the limited pixel resolution of the AR display and the distance of the third person camera from the working area, a heat spot to be designated by the user has some significant footprint in the real world (on the façade). More precisely, given the resolution of the IR images (320 × 240 pixels) and the horizontal span of the façade being captured by the camera (approximately 8 m), the footprint size of an image pixel on the façade corresponds to roughly 2.5 cm. With the typical size of a heat spot in the IR images between 4 and 5 pixels, we determined the footprint to be of about 12 cm × 10 cm. In a subsequent benchmark test, B2, we therefore used a clearly distinguishable piece of paper of this size as the target to be repeatedly marked by the same user (see Figure 17, right). The intention was to find out how well a user would visually determine (estimate) and reproduce the center of a target with such large defined area. As in the previous benchmark, the test person performed one hundred such repeated target designations, whereby the designated position was measured using the total station between any successive attempt.
Any potential imprecision in the benchmarks described so far is affected both by human perceptual and motoric limits, but also by imprecision inherent to the (human controlled) measuring procedure using the total station. In order to quantify the latter, we let the test leader (who conducted all measurements using the total station) perform one hundred repeated measurements of a fixed reflective target in another benchmark test (B3), whereby the reticle of the total station was pointed to a random position after each measurement.
Although the described imprecision of target designation and registration up to now is in many regards affected by human factors, there also exist sources of errors that are purely AR system related. The co-registration of visual images with IR images based on an automatic natural feature detection and matching method has already been pointed out as one source of systematic error. To validate this hypothesis, we finally performed a benchmark test (B4) to examine the accuracy of digital image registration. In this procedure, we gathered visible images of the same façade inspected during the experiment from five camera positions which were different from the positions in the experiment. In addition to those visible images, we captured seven different IR images of the same façade under different viewing angles, hence producing notable different perspectives. In those images, we manually marked up 10 pairs of corresponding points (CPs) that served as references for validation. We then let our automatic image registration method, which is agnostic to the manually established CPs, perform image registration based on natural feature extraction and matching. After registration, we used the CPs to determine registration errors in terms of Euclidean distance between the visible images and their corresponding IR images.
5.2. Results
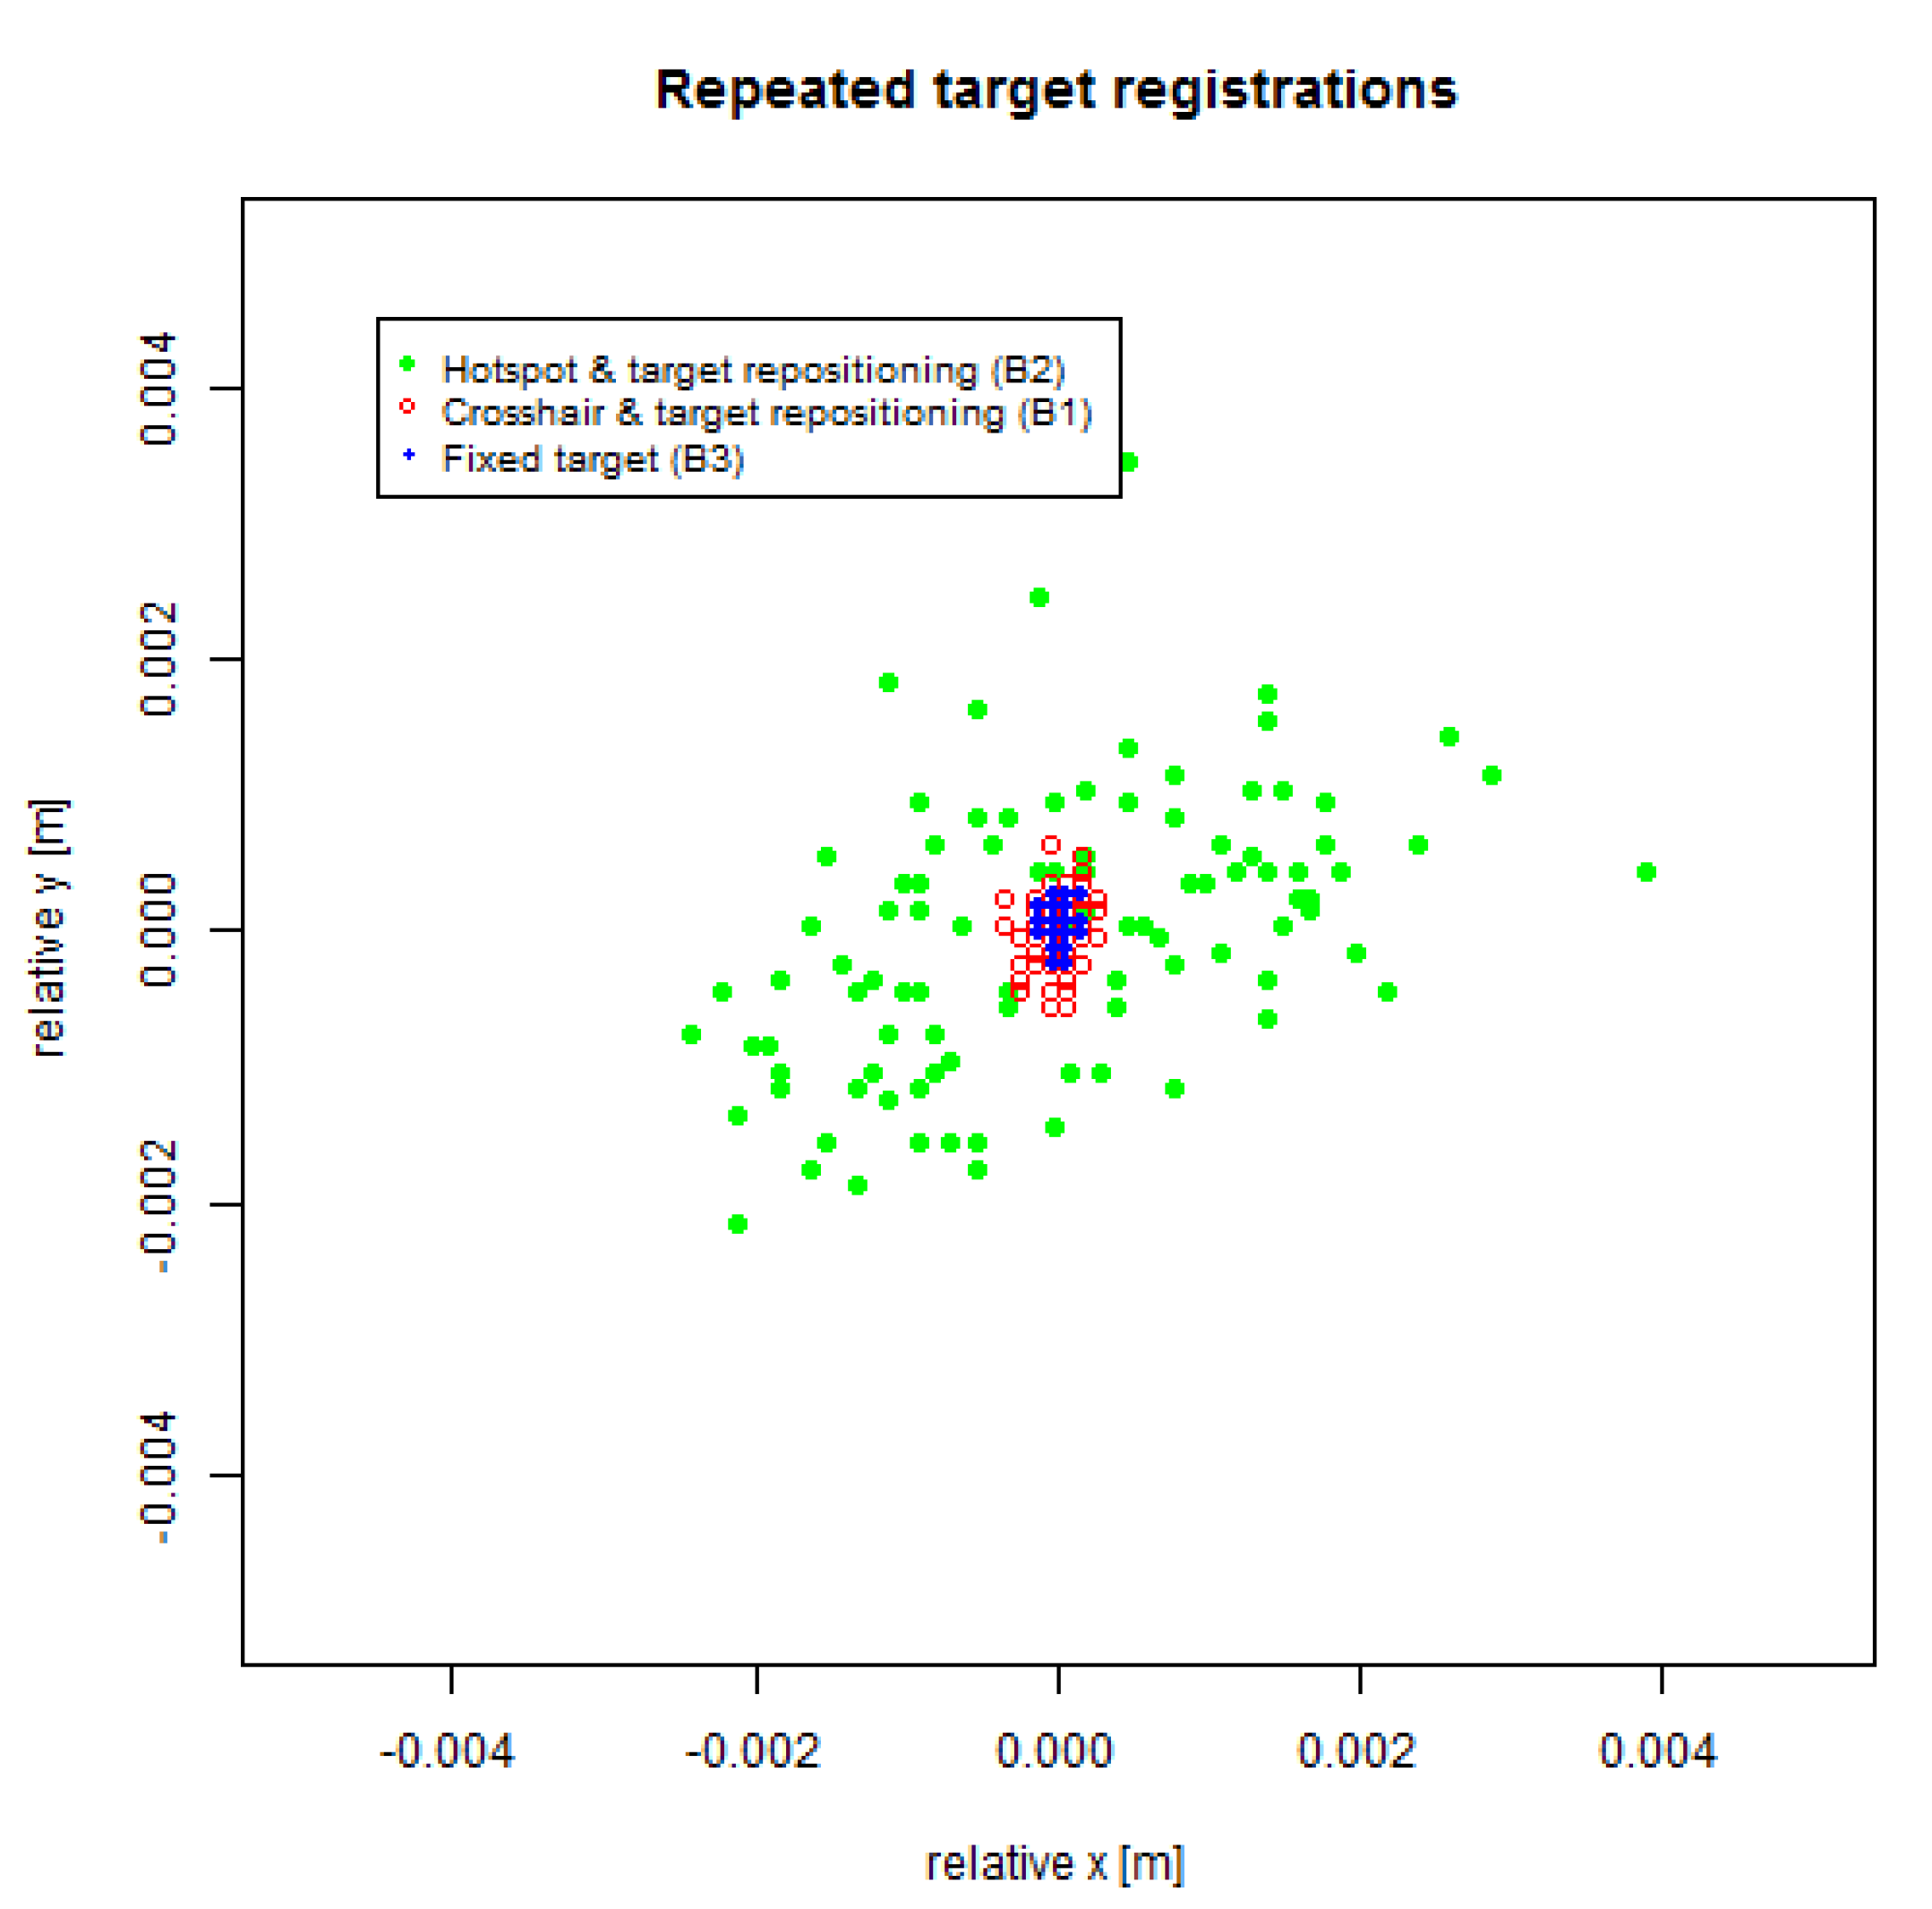
A graphical representation of the repeated manual target registrations is shown in Figure 18. Table 2 summarizes relevant quantitative measures in millimeters. As expected, the lowest dispersion and highest precision is observed for repeated measurements of one fixed marker using the total station. Although these measurements require human intervention in terms of sighting through the telescope of the total station, the maximum deviation of any measurement from the center is less than a third of a millimeter. The dispersion (in terms of span) horizontally is below 0.2 mm and below 0.3 mm vertically. By comparison, in test B1 with repeated designation of targets using a crosshair as a target, observed deviation and spans are roughly twice as large, meaning that the manual placement of a marker in our experiment under ideal circumstances (target is the most discernible) contributes only with another fraction of a millimeter to the error. For a more diffusely defined target such as the one in test B2, where the actual target center for registration must be visually extrapolated from the overall shape of a larger target footprint, deviations were an order of magnitude larger as compared with the crosshair target. Nevertheless and quite remarkably, those deviations from the center were always below 4 mm despite the fairly large footprint size (12 cm × 10 cm) of the target.
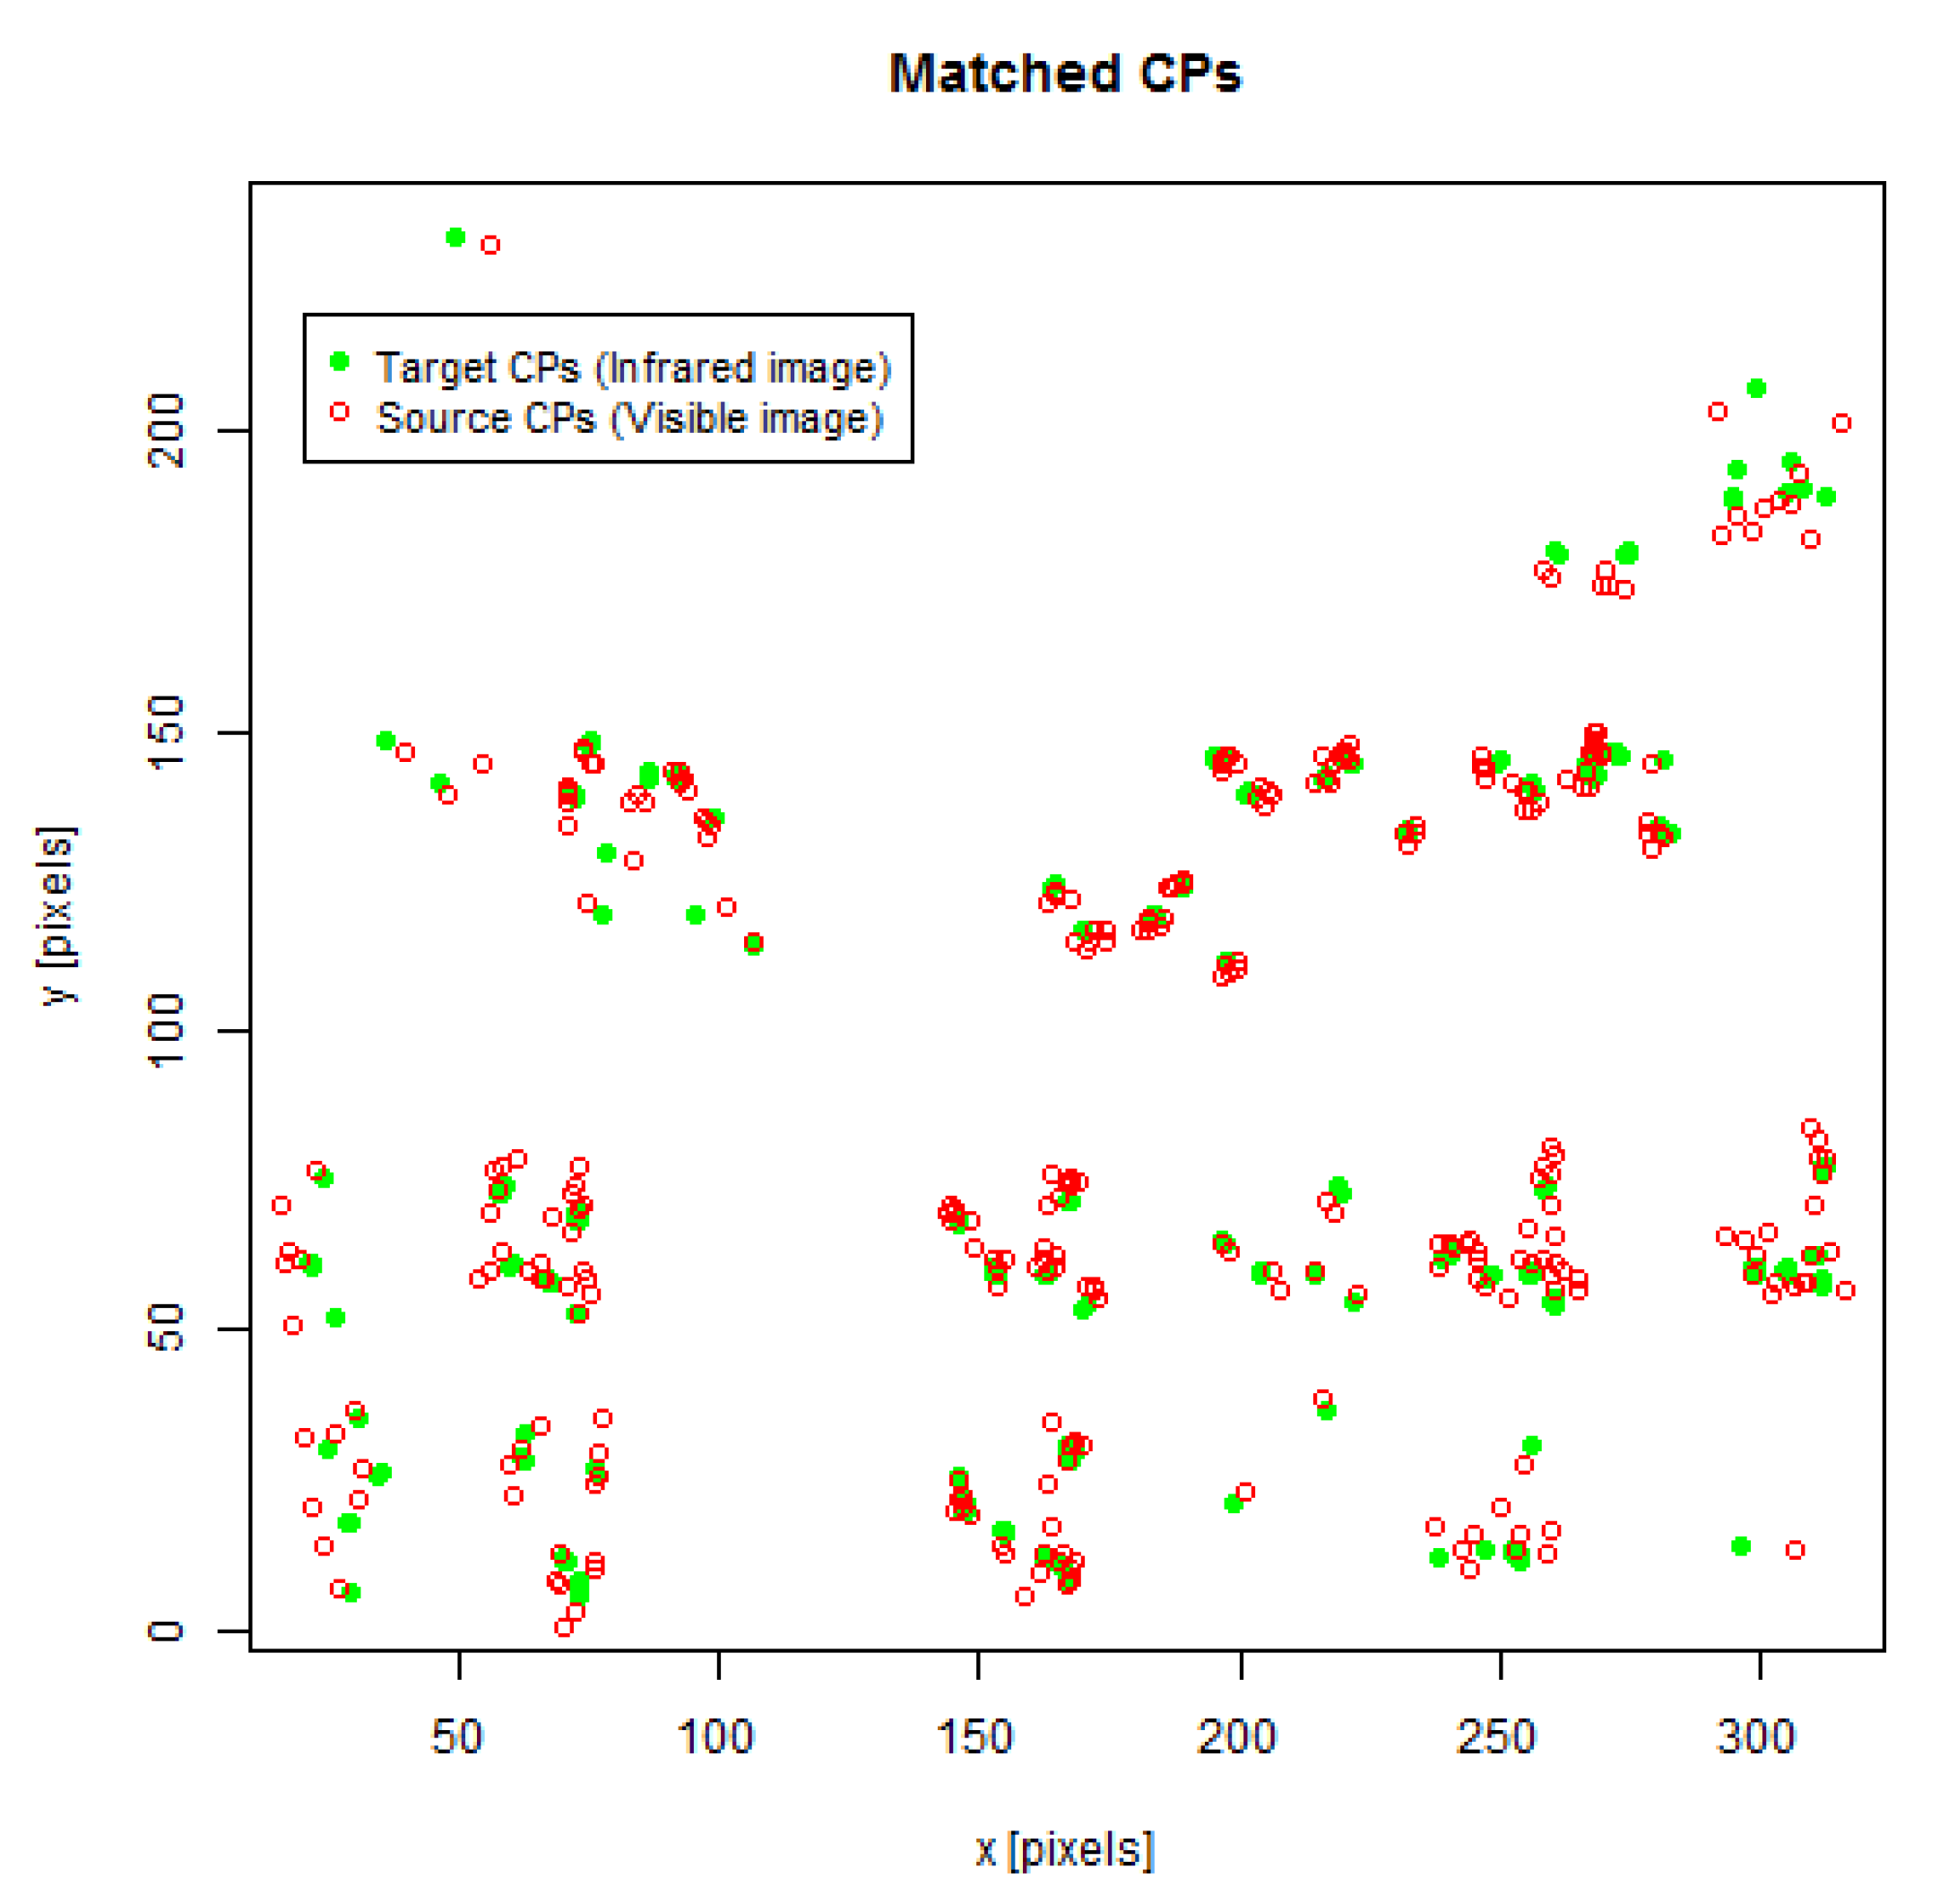
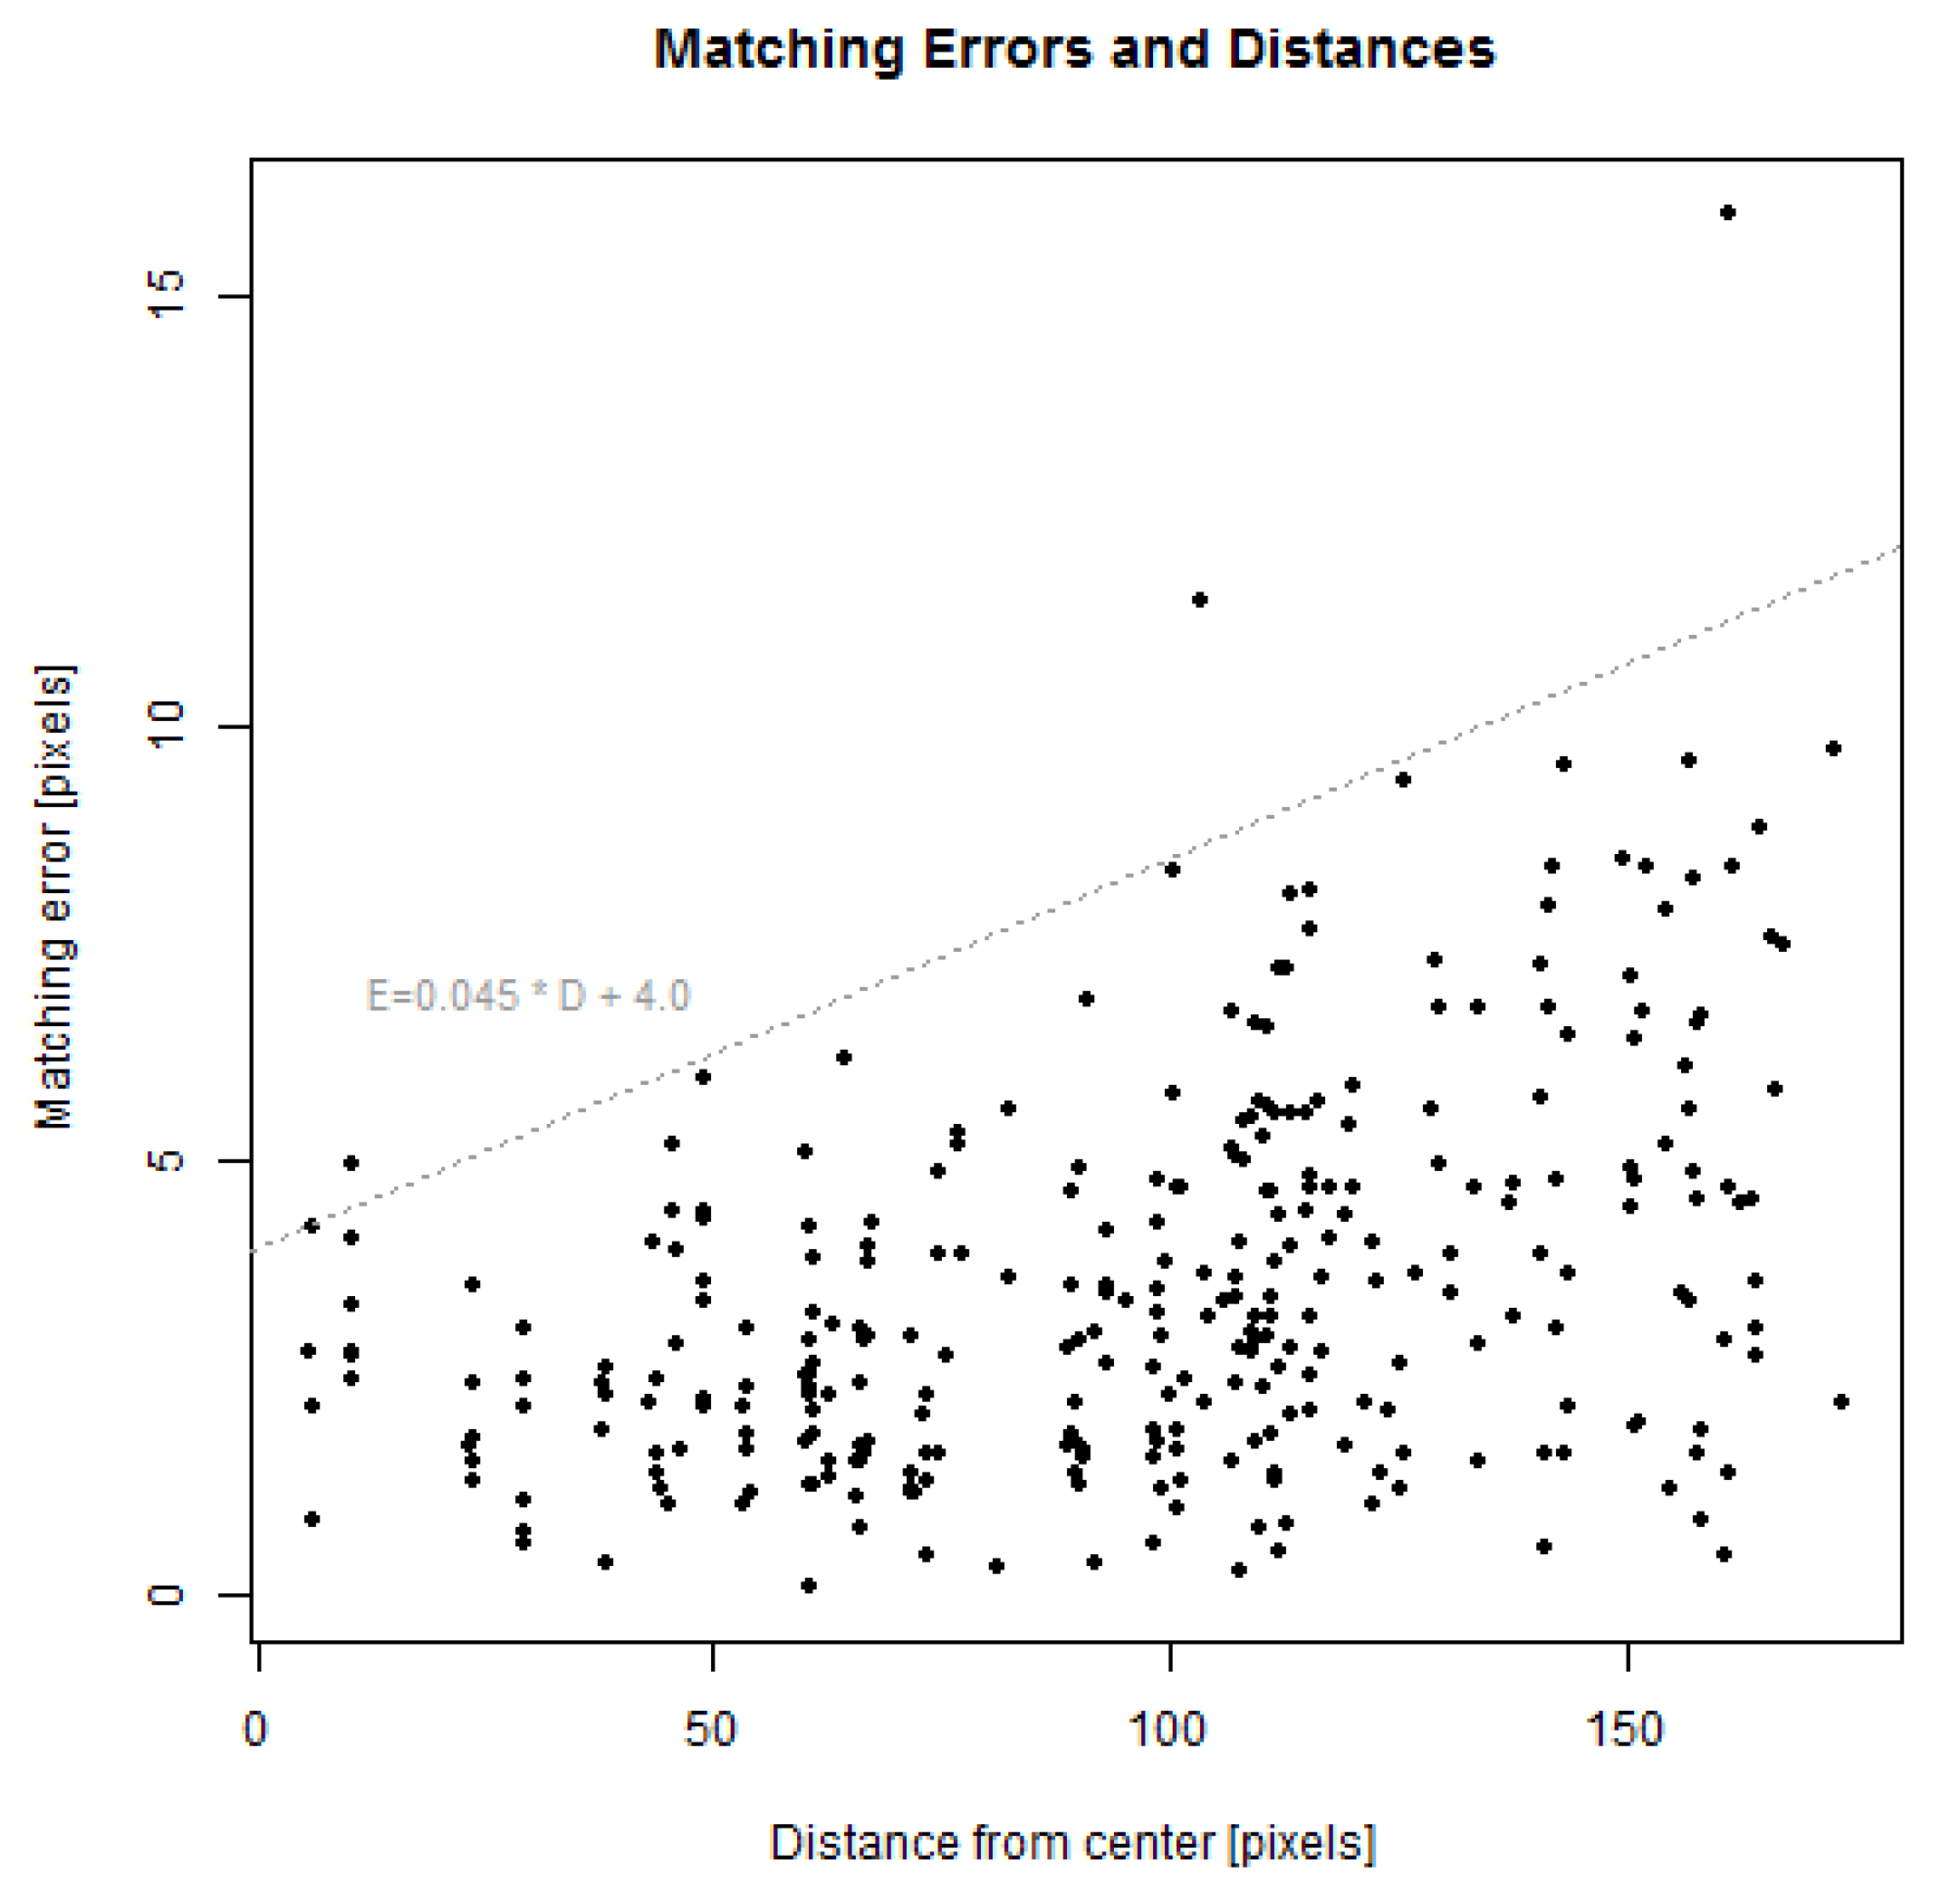
The results from test B4 (image registration errors) comprise matched sets of CPs for 31 out of the 35 possible combinations of visible and IR images because the matching algorithm did not succeed in four cases. Figure 19 depicts graphically all 310 manually selected CPs in target image space (green points) as well as their corresponding co-registered CPs from the source image (red). At first glance, it seems like the matching process based on natural feature extraction yields in the central parts of the images best results with smallest errors in terms of the Euclidean distance between two CPs. A plot of errors against the CPs’ distances from the image center can be seen in Figure 20. Although there exists no strict linear correlation between distances and errors, the error gradually spreads increasingly with growing distance. For this particular test, matching errors are (except for three outliers) below a line with the slope of 0.045 pixels matching error per one pixel distance from the image center with an intercept at four pixels. The median error for all CPs was 3.1 pixels with an IQR of 2.9 pixels. Considering only CPs in the central parts of the image (with a distance of fewer than 80 pixels from the image center), the median error was 2.3 pixels with an IQR of 1.7 pixels.
6. Discussion and Conclusions
This study presented and evaluated an AR system for designation of thermographic targets in a façade inspection task. The evaluation comprised a comprehensive analysis of various errors through a case study conducted in an actual outdoor setting. Experiments and tests in the study have established that overall errors in terms of deviations from true positions (i.e., accuracy) are on average around 7.6 cm with designation dispersion (i.e., precision) of 7.5 cm described by IQR. These errors are within the size of most façade defects that can be detected by IR thermography, such as thermal bridging, thermal insulation components, air/water leakage, etc. [9] Thanks to natural feature-based image registration for augmenting live video, our system overcomes the typical difficulty in tracking when AR is adopted outdoors. Furthermore, the unconventional TPP approach towards AR enables us to combat the trade-off between close field interaction with façades and the need for contextual, large field image capture from a greater distance. Both elements are the central pieces of our solution to AR for building inspection and the study results have demonstrated its viability for the designated application scenario.
A deeper analysis of the results identified that the largest influencing factor in this process was image registration. Errors observed in the registration of IR and visible images in benchmark test B4 vary within the image plane and increase from the center of the image towards the borders. For the entire image, registration errors correspond on average to 3.1 pixels, which is well in accordance with the overall registration error of 3.23 pixels found in our previous study [40]. However, in the central part of the image, which comprises the working area of this experiment, the error is some 2.3 pixels on average. Based on the previously established pixel-to-length conversion rate (roughly 1 pixel to 2.5 cm), we estimate the overall positioning errors entailed by the image registration procedure on average to be around 5–6 cm.
Apart from system-related error sources discussed above, which are obviously application specific, this study also reveals what we believe to be of general relevance to hand-held AR applications that adopt the TPP approach, namely, the residual errors separated from the systematic errors of image registration. These errors can largely be attributed to the actual visual-motoric and cognitive limits of humans when using such AR systems as in this study. More specifically, isolated distance errors (accuracy) are found to be around 2.2 cm on average, precision (again in terms of IQR) around 2.1 cm in the horizontal direction and 2.6 cm in the vertical direction. Upon further dissection, a part of this imprecision results from motoric and visual imprecision when users were placing the markers. For well delineated and distinguishable targets (in B1), this imprecision was found to be less than a millimeter and thus it is practically irrelevant. On the other hand, for larger targets without a clearly defined center (such as in the case of IR heat spots in this study and B2), the visual estimation of the target center brings about an error of less than 5 mm. In view of the established sources and magnitudes of errors, we can conclude that the imprecision in target designation as a consequence of users’ cognitive capacity required to mentally transform target positions between the exocentric coordinate space of the TPP imagery and the local coordinate system of the physical working area is indeed fairly small, and we estimate it to be around 2 cm. This performance should be appreciated in recognition to the size of the simulated heat spots on the façade. Based on the design of the heating devices (Section 3.4) and due to heat diffusion in the outer layer of the façade material, the size of these artificial defects can be assumed to be substantially larger than 4 cm. Human induced target designation errors are thus clearly below the size of the artifacts to be marked up. Finally, it is worth pointing out that the reasoning above has neglected the imprecision in measuring marker positions with the total station. Although it involved human interaction, those errors were only around fractions of a millimeter on average (B3).
For future work, we plan to draw on state-of-the-art computer vision and machine learning techniques in order to improve the performance of our façade image registration process, both in terms of execution time and registration accuracy. We hope the upgraded version, together with more advanced hardware, could achieve real-time performance on a single hand-held device, thus fulfilling our original envision of a TPP AR tool for façade inspection, which consists of only a wireless camera and a hand-held device. The next step is then to incorporate more professional users from the field of facility management (FM) to identify other practical problems that can be solved by our system while we refine the usability aspect of the system and tackles new challenges that emerge along the process. In view of the more general nature of the TPP approach to AR, we are also interested in finding out whether it can be applied in other industrial sectors than FM.
In conclusion, given the unexpectedly small human errors, it is our belief that TPP AR is a viable approach to outdoor AR when the trade-off between close range interaction and the need for large field image capture at a greater distance for richer context must be tackled. For the specific application in thermographic façade inspection, our study has shown that the system inherent errors from, among others, image registration are also at an acceptable level, thus bringing hand-held AR a step closer to smart facility operation and maintenance.
Author Contributions
Conceptualization, Fei Liu and Stefan Seipel; methodology, Fei Liu and Stefan Seipel; software, Fei Liu; validation, Fei Liu and Stefan Seipel; formal analysis, Fei Liu and Stefan Seipel; investigation, Fei Liu and Torsten Jonsson; resources, Torsten Jonsson; data curation, Fei Liu; writing–original draft preparation, Fei Liu; writing–review and editing, Fei Liu, Torsten Jonsson and Stefan Seipel; visualization, Fei Liu and Stefan Seipel; supervision, Stefan Seipel; funding acquisition, Stefan Seipel. All authors have read and agreed to the published version of the manuscript.
Funding
This research was supported by funding from the Faculty of Engineering and Sustainable Development at University of Gävle and partly by the European Regional Development Fund (ERDF), contract ID 20201871.
Acknowledgments
The authors would like to thank Mikael Sundberg for fruitful discussions on the design of the heating rig and the eventual manufacture of it. The authors also want to express their gratitude to the anonymous reviewers for their helpful comments to improve the quality of the original manuscript.
Conflicts of Interest
The authors declare no conflict of interest. The funders had no role in the design of the study; in the collection, analyses, or interpretation of data; in the writing of the manuscript, or in the decision to publish the results.
References
- United Nations, Department of Economic and Social Affairs, Population Division. World Urbanization Prospects: The 2018 Revision. 2018. Available online: https://population.un.org/wup/ (accessed on 8 August 2019).
- Nam, T.; Pardo, T.A. Conceptualizing smart city with dimensions of technology, people, and institutions. In Proceedings of the 12th Annual International Digital Government Research Conference: Digital Government Innovation in Challenging Times, College Park, MD, USA, 12–15 June 2011; pp. 282–291. [Google Scholar]
- Ishii, H.; Ullmer, B. Tangible bits: towards seamless interfaces between people, bits and atoms. In Proceedings of the ACM SIGCHI Conference on Human Factors In Computing Systems, Atlanta, GA, USA, 22–27 March 1997; pp. 234–241. [Google Scholar]
- Azuma, R.T. A survey of augmented reality. Presence Teleoperators Virtual Environ. 1997, 6, 355–385. [Google Scholar] [CrossRef]
- Silva, B.N.; Khan, M.; Han, K. Towards sustainable smart cities: A review of trends, architectures, components, and open challenges in smart cities. Sustain. Cities Soc. 2018, 38, 697–713. [Google Scholar] [CrossRef]
- Costa, A.; Keane, M.M.; Torrens, J.I.; Corry, E. Building operation and energy performance: Monitoring, analysis and optimisation toolkit. Appl. Energy 2013, 101, 310–316. [Google Scholar] [CrossRef]
- Yang, L.; Yan, H.; Lam, J.C. Thermal comfort and building energy consumption implications–a review. Appl. Energy 2014, 115, 164–173. [Google Scholar] [CrossRef]
- Kylili, A.; Fokaides, P.A.; Christou, P.; Kalogirou, S.A. Infrared thermography (IRT) applications for building diagnostics: A review. Appl. Energy 2014, 134, 531–549. [Google Scholar] [CrossRef]
- Lucchi, E. Applications of the infrared thermography in the energy audit of buildings: A review. Renew. Sustain. Energy Rev. 2018, 82, 3077–3090. [Google Scholar] [CrossRef]
- Iwai, D.; Sato, K. Optical superimposition of infrared thermography through video projection. Infrared Phys. Technol. 2010, 53, 162–172. [Google Scholar] [CrossRef]
- Baričević, D.; Höllerer, T.; Sen, P.; Turk, M. User-perspective augmented reality magic lens from gradients. In Proceedings of the 20th ACM Symposium on Virtual Reality Software and Technology, Edinburgh, UK, 11–13 November 2014; pp. 87–96. [Google Scholar]
- Pucihar, K.C.; Coulton, P.; Alexander, J. Evaluating dual-view perceptual issues in handheld augmented reality: device vs. user perspective rendering. In Proceedings of the 15th International Conference on Multimodal Interaction, Sydney, Australia, 9–13 December 2013; pp. 381–388. [Google Scholar]
- Côté, S.; Trudel, P. Third person perspective augmented reality for high accuracy applications. In Proceedings of the 2013 IEEE International Symposium on Mixed and Augmented Reality (ISMAR), Adelaide, Australia, 1–4 October 2013; pp. 247–248. [Google Scholar]
- Schall, G.; Zollmann, S.; Reitmayr, G. Smart Vidente: advances in mobile augmented reality for interactive visualization of underground infrastructure. Pers. Ubiquitous Comput. 2013, 17, 1533–1549. [Google Scholar] [CrossRef]
- Talmaki, S.A.; Dong, S.; Kamat, V.R. Geospatial databases and augmented reality visualization for improving safety in urban excavation operations. Constr. Res. Congr. 2010, 2010, 91–101. [Google Scholar]
- Azuma, R.T. The most important challenge facing augmented reality. Presence Teleoperators Virtual Environ. 2016, 25, 234–238. [Google Scholar] [CrossRef]
- Besharat, J.; Komninos, A.; Papadimitriou, G.; Lagiou, E.; Garofalakis, J. Augmented paper maps: Design of POI markers and effects on group navigation. J. Ambient. Intell. Smart Environ. 2016, 8, 515–530. [Google Scholar] [CrossRef] [Green Version]
- Leach, M.; Maddock, S.; Hadley, D.; Butterworth, C.; Moreland, J.; Dean, G.; Mackinder, R.; Pach, K.; Bax, N.; Mckone, M.; et al. Recreating Sheffield’s Medieval Castle In Situ using Outdoor Augmented Reality. In Proceedings of the International Conference on Virtual Reality and Augmented Reality, London, UK, 22–23 October 2018; pp. 213–229. [Google Scholar]
- Blanco-Pons, S.; Carrión-Ruiz, B.; Duong, M.; Chartrand, J.; Fai, S.; Lerma, J.L. Augmented Reality markerless multi-image outdoor tracking system for the historical buildings on Parliament Hill. Sustainability 2019, 11, 4268. [Google Scholar] [CrossRef] [Green Version]
- Boboc, R.G.; Duguleană, M.; Voinea, G.D.; Postelnicu, C.C.; Popovici, D.M.; Carrozzino, M. Mobile Augmented Reality for Cultural Heritage: Following the Footsteps of Ovid among Different Locations in Europe. Sustainability 2019, 11, 1167. [Google Scholar] [CrossRef] [Green Version]
- Harborth, D.; Pape, S. Exploring the hype: Investigating technology acceptance factors of Pokémon Go. In Proceedings of the 2017 IEEE International Symposium on Mixed and Augmented Reality (ISMAR), Nantes, France, 9–13 October 2017; pp. 155–168. [Google Scholar]
- Rauschnabel, P.A.; Rossmann, A.; tom Dieck, M.C. An adoption framework for mobile augmented reality games: The case of Pokémon Go. Comput. Hum. Behav. 2017, 76, 276–286. [Google Scholar] [CrossRef] [Green Version]
- Zollmann, S.; Hoppe, C.; Kluckner, S.; Poglitsch, C.; Bischof, H.; Reitmayr, G. Augmented reality for construction site monitoring and documentation. Proc. IEEE 2014, 102, 137–154. [Google Scholar] [CrossRef]
- Kim, K.; Kim, H.; Kim, H. Image-based construction hazard avoidance system using augmented reality in wearable device. Autom. Constr. 2017, 83, 390–403. [Google Scholar] [CrossRef]
- Gomez-Jauregui, V.; Manchado, C.; Jesús, D.; Otero, C. Quantitative evaluation of overlaying discrepancies in mobile augmented reality applications for AEC/FM. Adv. Eng. Softw. 2019, 127, 124–140. [Google Scholar] [CrossRef] [Green Version]
- Zaher, M.; Greenwood, D.; Marzouk, M. Mobile augmented reality applications for construction projects. Constr. Innov. 2018, 18, 152–166. [Google Scholar] [CrossRef] [Green Version]
- Pierdicca, R.; Frontoni, E.; Zingaretti, P.; Mancini, A.; Malinverni, E.S.; Tassetti, A.N.; Marcheggiani, E.; Galli, A. Smart maintenance of riverbanks using a standard data layer and Augmented Reality. Comput. Geosci. 2016, 95, 67–74. [Google Scholar] [CrossRef]
- Lochhead, I.; Hedley, N. Mixed reality emergency management: bringing virtual evacuation simulations into real-world built environments. Int. J. Digit. Earth 2019, 12, 190–208. [Google Scholar] [CrossRef]
- Zollmann, S.; Poglitsch, C.; Ventura, J. VISGIS: Dynamic situated visualization for geographic information systems. In Proceedings of the 2016 International Conference on Image and Vision Computing New Zealand (IVCNZ), Palmerston North, New Zealand, 21–22 November 2016; pp. 1–6. [Google Scholar]
- Kurz, D. Thermal touch: Thermography-enabled everywhere touch interfaces for mobile augmented reality applications. In Proceedings of the 2014 IEEE International Symposium on Mixed and Augmented Reality (ISMAR), Munich, Germany, 10–12 September 2014; pp. 9–16. [Google Scholar]
- Ham, Y.; Golparvar-Fard, M. EPAR: Energy Performance Augmented Reality models for identification of building energy performance deviations between actual measurements and simulation results. Energy Build. 2013, 63, 15–28. [Google Scholar] [CrossRef]
- Vidas, S.; Moghadam, P.; Bosse, M. 3D thermal mapping of building interiors using an RGB-D and thermal camera. In Proceedings of the 2013 IEEE International Conference on Robotics and Automation (ICRA), Karlsruhe, Germany, 6–10 May 2013; pp. 2311–2318. [Google Scholar]
- Orlosky, J.; Kim, P.; Kiyokawa, K.; Mashita, T.; Ratsamee, P.; Uranishi, Y.; Takemura, H. Vismerge: Light adaptive vision augmentation via spectral and temporal fusion of non-visible light. In Proceedings of the 2017 IEEE International Symposium on Mixed and Augmented Reality (ISMAR), Nantes, France, 9–13 October 2017; pp. 22–31. [Google Scholar]
- Kim, W.; Kerle, N.; Gerke, M. Mobile augmented reality in support of building damage and safety assessment. Nat. Hazards Earth Syst. Sci. 2016, 16, 287–298. [Google Scholar] [CrossRef] [Green Version]
- Khalek, I.A.; Chalhoub, J.M.; Ayer, S.K. Augmented Reality for Identifying Maintainability Concerns during Design. Adv. Civ. Eng. 2019, 2019, 1–12. [Google Scholar] [CrossRef]
- Neges, M.; Koch, C.; König, M.; Abramovici, M. Combining visual natural markers and IMU for improved AR based indoor navigation. Adv. Eng. Inform. 2017, 31, 18–31. [Google Scholar] [CrossRef]
- Diao, P.H.; Shih, N.J. BIM-Based AR Maintenance System (BARMS) as an Intelligent Instruction Platform for Complex Plumbing Facilities. Appl. Sci. 2019, 9, 1592. [Google Scholar] [CrossRef] [Green Version]
- Zhou, Y.; Luo, H.; Yang, Y. Implementation of augmented reality for segment displacement inspection during tunneling construction. Autom. Constr. 2017, 82, 112–121. [Google Scholar] [CrossRef]
- Schmalstieg, D.; Hollerer, T. Augmented Reality: Principles and Practice; Addison-Wesley Professional: Boston, MA, USA, 2016. [Google Scholar]
- Liu, F.; Seipel, S. Infrared-visible image registration for augmented reality-based thermographic building diagnostics. Vis. Eng. 2015, 3, 1–15. [Google Scholar] [CrossRef]
- Liu, F.; Seipel, S. On the Precision of Third Person Perspective Augmented Reality for Target Designation Tasks. Multimed. Tools Appl. 2016, 76, 1–18. [Google Scholar] [CrossRef] [Green Version]
Figure 1.
Conceptual illustration of third person perspective augmented reality (TPP AR) adopted by our system.
Figure 1.
Conceptual illustration of third person perspective augmented reality (TPP AR) adopted by our system.

Figure 2.
Quadrilateral features derived from horizontal and vertical line segments are used for registering infrared (IR) and visible image pairs in this study. The edge center points of each quadrilateral (indicated by asterisks) serve as control points to establish correspondences (encoded by the same colors) and to calculate the underlying geometric transformation. Left: IR image. Middle: visible image. Right: composited image after registration.

Figure 3.
Hardware of the prototype TPP AR system. 1: webcam; 2: desktop computer; 3: wireless router; 4: tablet computer.
Figure 3.
Hardware of the prototype TPP AR system. 1: webcam; 2: desktop computer; 3: wireless router; 4: tablet computer.

Figure 4.
A screenshot of the application running on the tablet viewed by users. Notice the façade region is replaced by IR information due to chroma keying composition and the IR image of target No. 1 (the bright spot between the two doors) is correctly registered with the visible video frames.
Figure 4.
A screenshot of the application running on the tablet viewed by users. Notice the façade region is replaced by IR information due to chroma keying composition and the IR image of target No. 1 (the bright spot between the two doors) is correctly registered with the visible video frames.

Figure 5.
Overview of the system architecture.

Figure 6.
Left: the chosen façade with the working area mounted. Right: close-up of the working area.
Figure 6.
Left: the chosen façade with the working area mounted. Right: close-up of the working area.

Figure 7.
Left: the heating rig with individual heating devices. Right: close-up of a heating device.
Figure 7.
Left: the heating rig with individual heating devices. Right: close-up of a heating device.

Figure 8.
13 heat spots (targets) prepared for this study and their identification numbers.

Figure 9.
Metal stands at the top left and the bottom right corner of the working area.

Figure 10.
A marker used by subjects to designate the IR targets in the working area. Left: front side. Right: back side.
Figure 10.
A marker used by subjects to designate the IR targets in the working area. Left: front side. Right: back side.

Figure 11.
The user experiment environment. The AR system (Lower) is placed approximately 8 m away from the working area (Upper) and is transmitting augmented video frames (refer to Figure 4) to the tablet held by the subject for guiding marker placement.
Figure 11.
The user experiment environment. The AR system (Lower) is placed approximately 8 m away from the working area (Upper) and is transmitting augmented video frames (refer to Figure 4) to the tablet held by the subject for guiding marker placement.

Figure 12.
Boxplots of deviations in X (horizontally) and Y (vertically). Left: Original data. Right: Data after correction of session-wise bias.
Figure 12.
Boxplots of deviations in X (horizontally) and Y (vertically). Left: Original data. Right: Data after correction of session-wise bias.

Figure 13.
Plot of all 13 target positions. Ground truth positions are plotted in green and averages of the 23 measured positions in red.
Figure 13.
Plot of all 13 target positions. Ground truth positions are plotted in green and averages of the 23 measured positions in red.

Figure 14.
Boxplots of deviations in X (left) and Y (right) per experiment session.

Figure 15.
Plot of all measured target positions colored according to experiment sessions in comparison with ground truth positions (green). Original registrations (top) and measured positions after session-wise bias correction (bottom).
Figure 15.
Plot of all measured target positions colored according to experiment sessions in comparison with ground truth positions (green). Original registrations (top) and measured positions after session-wise bias correction (bottom).

Figure 16.
Results of the post-experiment subjective ratings. Left: “What is the difficulty level of designate the targets? (1 = very easy, 6 = very hard)”. Right: “What is your impression on the correctness of designating the targets? (1 = significantly wrong, 6 = very accurate).
Figure 16.
Results of the post-experiment subjective ratings. Left: “What is the difficulty level of designate the targets? (1 = very easy, 6 = very hard)”. Right: “What is your impression on the correctness of designating the targets? (1 = significantly wrong, 6 = very accurate).

Figure 17.
Different targets used in the registration benchmark tests B1 (left) and B2 (right).

Figure 18.
Distribution of manually measured target positions for the benchmark tests (B1–B3). Measured positions are plotted in relation to their averaged centers.
Figure 18.
Distribution of manually measured target positions for the benchmark tests (B1–B3). Measured positions are plotted in relation to their averaged centers.

Figure 19.
Plot of corresponding points in target coordinate space. Corresponding points (CP) from target images are plotted in green and CPs from source images after registration and transformation are shown in red.
Figure 19.
Plot of corresponding points in target coordinate space. Corresponding points (CP) from target images are plotted in green and CPs from source images after registration and transformation are shown in red.

Figure 20.
Matching errors in test B4.


Table 1.
Vector components and lengths used for bias correction of measured target positions from different experiment sessions. Values are stated in meters.
Table 1.
Vector components and lengths used for bias correction of measured target positions from different experiment sessions. Values are stated in meters.
| Correction | Session 1 | Session 2 | Session 3 | Session 4 | Session 5 | Session 6 |
|---|---|---|---|---|---|---|
| −0.09587 | 0.067032 | 0.070359 | 0.030509 | 0.030222 | 0.014507 | |
| 0.118215 | 0.072014 | 0.092282 | −0.00544 | 0.04896 | 0.062083 | |
| 0.152206 | 0.098383 | 0.116045 | 0.03099 | 0.057537 | 0.063756 |
Table 2.
The horizontal and vertical spans of measured target positions and maximum distances from their respective average centers for the three manual registration tests (B1–B3).
Table 2.
The horizontal and vertical spans of measured target positions and maximum distances from their respective average centers for the three manual registration tests (B1–B3).
| Test B1 | Test B2 | Test B3 | |
|---|---|---|---|
| (mm) | 0.247353 | 3.877425 | 0.166134 |
| (mm) | 0.647553 | 3.446156 | 0.266234 |
| (mm) | 0.649167 | 3.900354 | 0.313547 |
© 2020 by the authors. Licensee MDPI, Basel, Switzerland. This article is an open access article distributed under the terms and conditions of the Creative Commons Attribution (CC BY) license (http://creativecommons.org/licenses/by/4.0/).
Share and Cite
MDPI and ACS Style
Liu, F.; Jonsson, T.; Seipel, S. Evaluation of Augmented Reality-Based Building Diagnostics Using Third Person Perspective. ISPRS Int. J. Geo-Inf. 2020, 9, 53. https://0-doi-org.brum.beds.ac.uk/10.3390/ijgi9010053
AMA Style
Liu F, Jonsson T, Seipel S. Evaluation of Augmented Reality-Based Building Diagnostics Using Third Person Perspective. ISPRS International Journal of Geo-Information. 2020; 9(1):53. https://0-doi-org.brum.beds.ac.uk/10.3390/ijgi9010053
Chicago/Turabian StyleLiu, Fei, Torsten Jonsson, and Stefan Seipel. 2020. "Evaluation of Augmented Reality-Based Building Diagnostics Using Third Person Perspective" ISPRS International Journal of Geo-Information 9, no. 1: 53. https://0-doi-org.brum.beds.ac.uk/10.3390/ijgi9010053
Note that from the first issue of 2016, this journal uses article numbers instead of page numbers. See further details here.