1. Introduction
The revitalization of buildings under conservation protection is an area of interest to many investors. Therefore, there is a need to thoroughly, quickly, and accurately inspect the objects while taking their inventory. The results obtained from inspection are necessary elements in the process of designing and obtaining decisions from conservation offices. In order to conduct measurements and research, 3D laser scanning can be applied [
1], which is an active method that works well for examining structures, sites, etc. The extensive use of this technology for the preservation of monuments, architectural inventory, or archaeological research allows one to obtain very precise measurements and information about the object. It also has a significant impact on the time and effort needed to perform these activities in the field.
Traditional methods that are used while taking inventory of historic buildings (e.g., manual mapping and/or visual assessment of the object by an expert) are usually very time and labor consuming. Therefore, terrestrial laser scanning (TLS) technology and image processing methodologies are better alternatives. They enable data to be acquired about an object/facility objectively and quickly. The data obtained allow for the detection of defects and their evolution [
2], identification of deformations, and changes in material [
3,
4]. Additionally, point clouds provided via laser scanning technology can be used as a basis for generating a complete 3D model of the explored object [
5,
6]. Based on the built-in digital camera, complete photographic documentation of the object is collected at the same time. The photographs can be included in the inventory as separate documents, or they can be added to the point cloud as texture, which makes the visualization of the point cloud more realistic. This combination of two documentary methods, i.e., laser scanning and photography, allows the necessary data about the object to be obtained, especially information about defects, gaps, cracks, etc. The need for such a study is clear to architectural designers who work on the revitalization and adaptation of historic architecture. A precise model of the building in 3D space obtained from a point cloud is a very good basis on which to make any additional measurements. It also can be a reliable source for creating cross-sections, schemes of the building, etc. Presentation of the model can also be made from any desired point of view (e.g., top, side, perspective). The effects of using laser scanning in such a field have been presented in many papers. For example, in [
7], the authors showed that a point cloud integrated with data from a camera was used to produce a precise 3D virtual model of the historical Mevlana Museum in Konya, Turkey. In [
8,
9], it was shown how the complete documentation of cultural heritage was created on the basis of laser scanning. Additional data were provided by an unmanned aerial vehicle and digital photogrammetry.
It is worth mentioning that laser scanning is an active remote sensing method; therefore, scanning measurements are not determined or limited by access to daylight. Such independence from a light source is especially valuable for scanning in dark, unlit places like basements, tunnels, and underground areas. Thus, scanning technology is a good tool for making inventories of old, historic objects that are not usually equipped with electricity.
Point clouds obtained from TLS are characterized by very high resolution. Visualization of such a dataset gives the impression of a quasi-continuous surface of the measured object. Almost all visible details of the scanned object can be examined thoroughly. However, there are areas within the object where its structure is less complex; thus, a large number of measured points is not necessary. In order to reduce the number of points in the point cloud and at the same time preserve all necessary data to perform an inventory of the scanned object, automatic down-sampling of the point cloud and its segmentation is proposed. The reduction and segmentation of point clouds is a research topic documented in the literature. In [
10], the proposed reduction method was based on curvature, and the authors in [
11] showed an adaptive down-sampling strategy and discussed its computational efficiency and quality of segmentation. Different approaches to data reduction were presented in [
12]. Here, the focus is on mesh compression. A review of point cloud segmentation and classification is provided in [
13]. Detailed descriptions of the advantages and disadvantages of point cloud segmentation can be found in [
14].
So far, researchers have conducted a thorough and successful research program dedicated to the reduction of datasets from TLS measurements concerning buildings and structures, especially in the context of their technical diagnostics [
15,
16]. In those studies, the OptD method was applied. The OptD method was used to reduce the number of points in homogeneous areas (surfaces without cracks and cavities) and retain more points where there were defects in walls. In the current study, the OptD method was modified in such a way that, apart from down-sampling of the point cloud, the dataset was segmented. The segmentation consisted of separating groups of points and representing different types and size of changes in the surface of the walls. Analysis of the point clouds was performed in the OXYZ coordinate system, which allowed us to detect recesses (cavities and cracks) in the building wall, or in the OXYI coordinate system (“I” stands for the TLS intensity value), which allowed us to detect local surface changes of the wall, such as discoloration, moisture, and bio-deterioration (lichen and moss). Such changes to the buildings and structures are very often associated with poor technical conditions of the surface. It should be noted that the TLS intensity value depends mainly on the physio-chemical properties of the scanned areas, such as color [
17], roughness [
18], and saturation [
19,
20]. The choice of how the dataset is analyzed (in OXYZ or OXYI coordinate systems) depends on the user. It is also possible to perform those two versions of analysis at the same time.
Until now, the OptD method has been used to reduce the size of the dataset, usually on the basis of the classic Douglas–Peucker method [
21], although other generalization methods (e.g., Visvalingham–Whyatt [
22], Opheim [
23]) can also be used. The main aim of this study is to present the potential of a modified OptD method as a tool for automatic detection of threats in building construction. Modification of the OptD method allowed for the detection of cracks/gaps in building walls and for initial assessment of the nature of the examined changes in the structure of the object. The types of changes and their significance and ranges can be set by the user. In this paper, the authors used four classes of changes, namely, 0—harmless, 1—to the inventory, 2—requiring repair, and 3—dangerous. This allowed us to almost immediately indicate the hazardous areas within the measured sites.
The remainder of this paper is organized as follows.
Section 2 introduces the Optimum Dataset method and its modifications that enable simultaneous reduction and segmentation of the point cloud. The characteristics of the test objects are also presented here.
Section 3 covers the processing of point clouds from two locations and shows the effects of detection of the cracks/gaps in building walls. Obtained results are discussed in
Section 4.
Section 5 briefly sums up the aspects of data processing and reveals the field where the modified OptD method can be applied.
2. Materials and Methods
2.1. The Optimum Dataset Method and its Modifications
The algorithm of the OptD method was developed and presented in previous works [
24,
25]. The main aim of the OptD method is to reduce the datasets provided by mass data acquisition technologies (e.g., point clouds from laser scanning) on the basis of cartographic generalization methods. The amount of observation/measurement data can be reduced in the range of 0.05% to 99.95%. The degree of reduction is determined by the user, who makes decisions depending on the purpose of the study and the number of input datasets. The algorithm of the method works in such a way that the measuring strips (L) are created in the plane of the object (in this case, a wall). Within each strip L, an analysis of the points’ locations is conducted. The decision of whether to remove or preserve the given points is made by performing cartographic generalization, which in this paper was conducted using the Douglas–Peucker method [
21].
In this study, the generalization was performed in the OXZ plane; therefore, the changes in height were preserved. Due to the fact that the input data were provided by laser scanning technology, in addition to x, y, and z, the intensity of the laser signal was also recorded. Changes in intensity are related to, among other factors, moisture and bio-deterioration. Thus, the analysis was extended with qualitative tests of the wall surface.
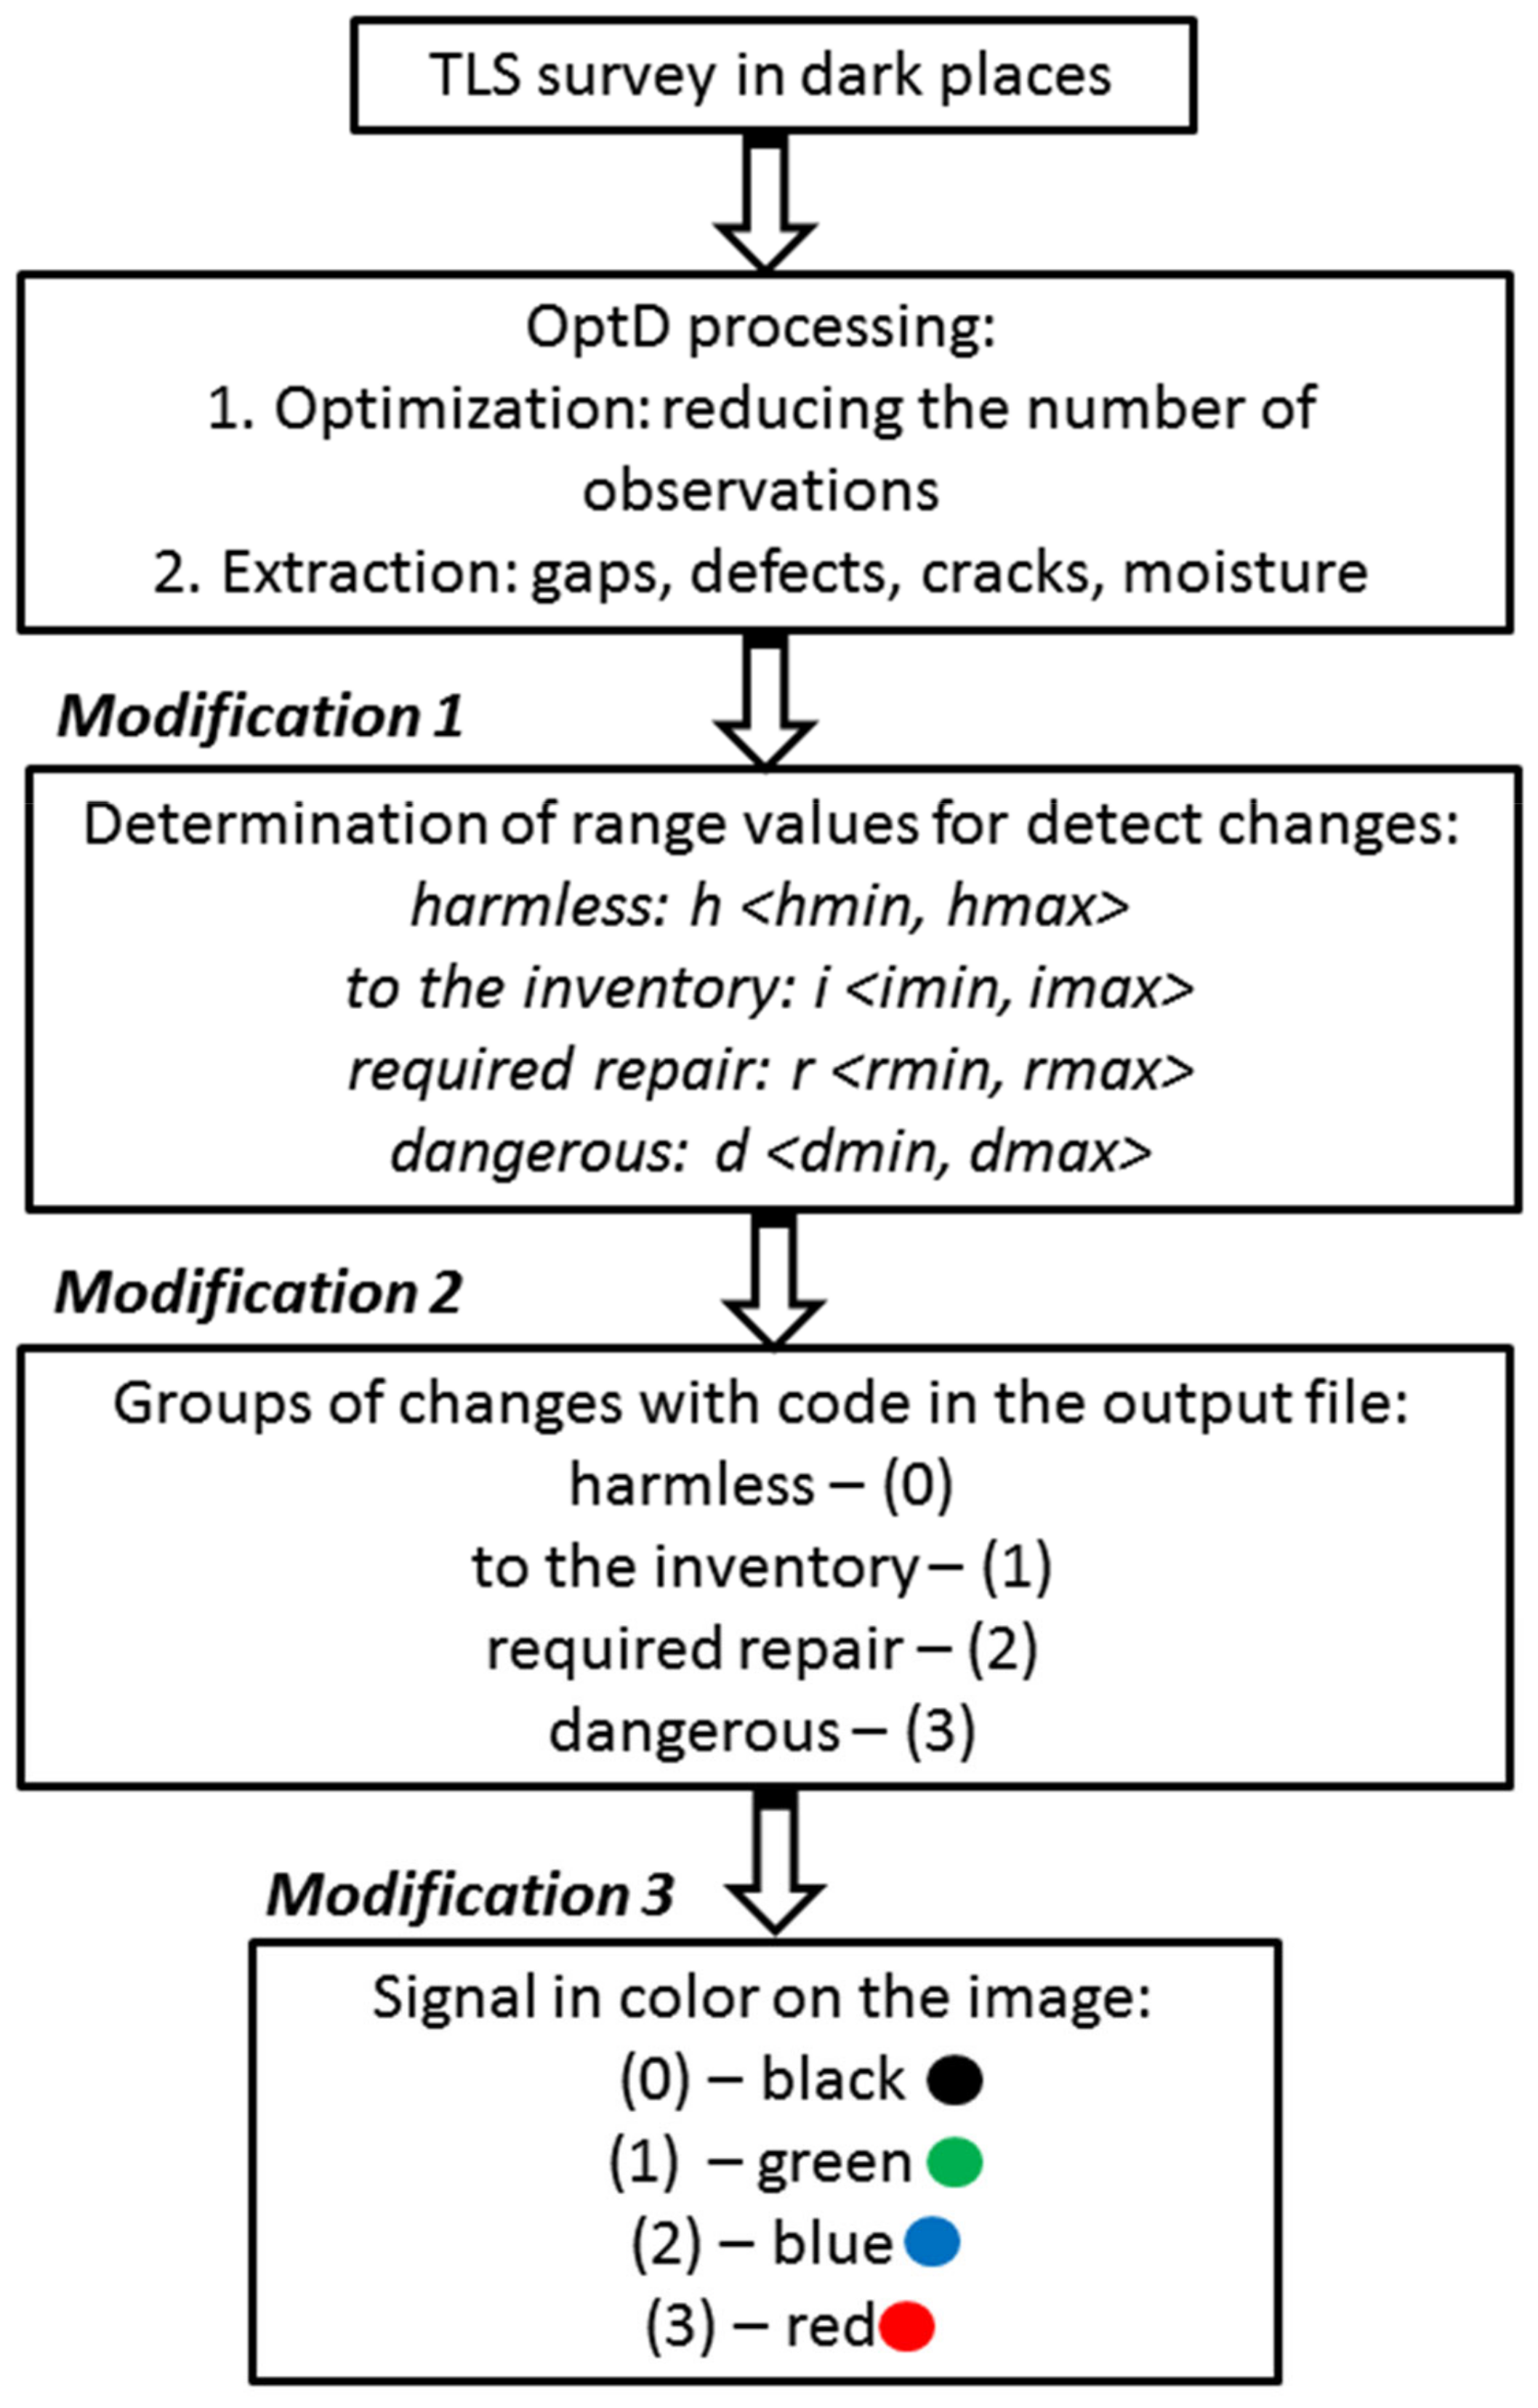
In this study, the OptD method was modified in order to perform automatic dataset segmentation as well as reduction of the point cloud. The degree of reduction and range of segmentation is related to the detection of defects in a building wall. The modification takes place on three levels:
Introduction of additional internal criteria in the Douglas–Peucker algorithm.
Introduction of codes in the output file for modification of the output file.txt. Each point is assigned a code that specifies the type and condition of the defect: 0—harmless, 1—to the inventory, 2—requiring repair, 3—dangerous.
Introduction of colors for the relevant codes for modification of the image. Each color highlights a state of the defect: 0—black, 1—green, 2—blue, 3—red.
The modifications introduced are shown in
Figure 1.
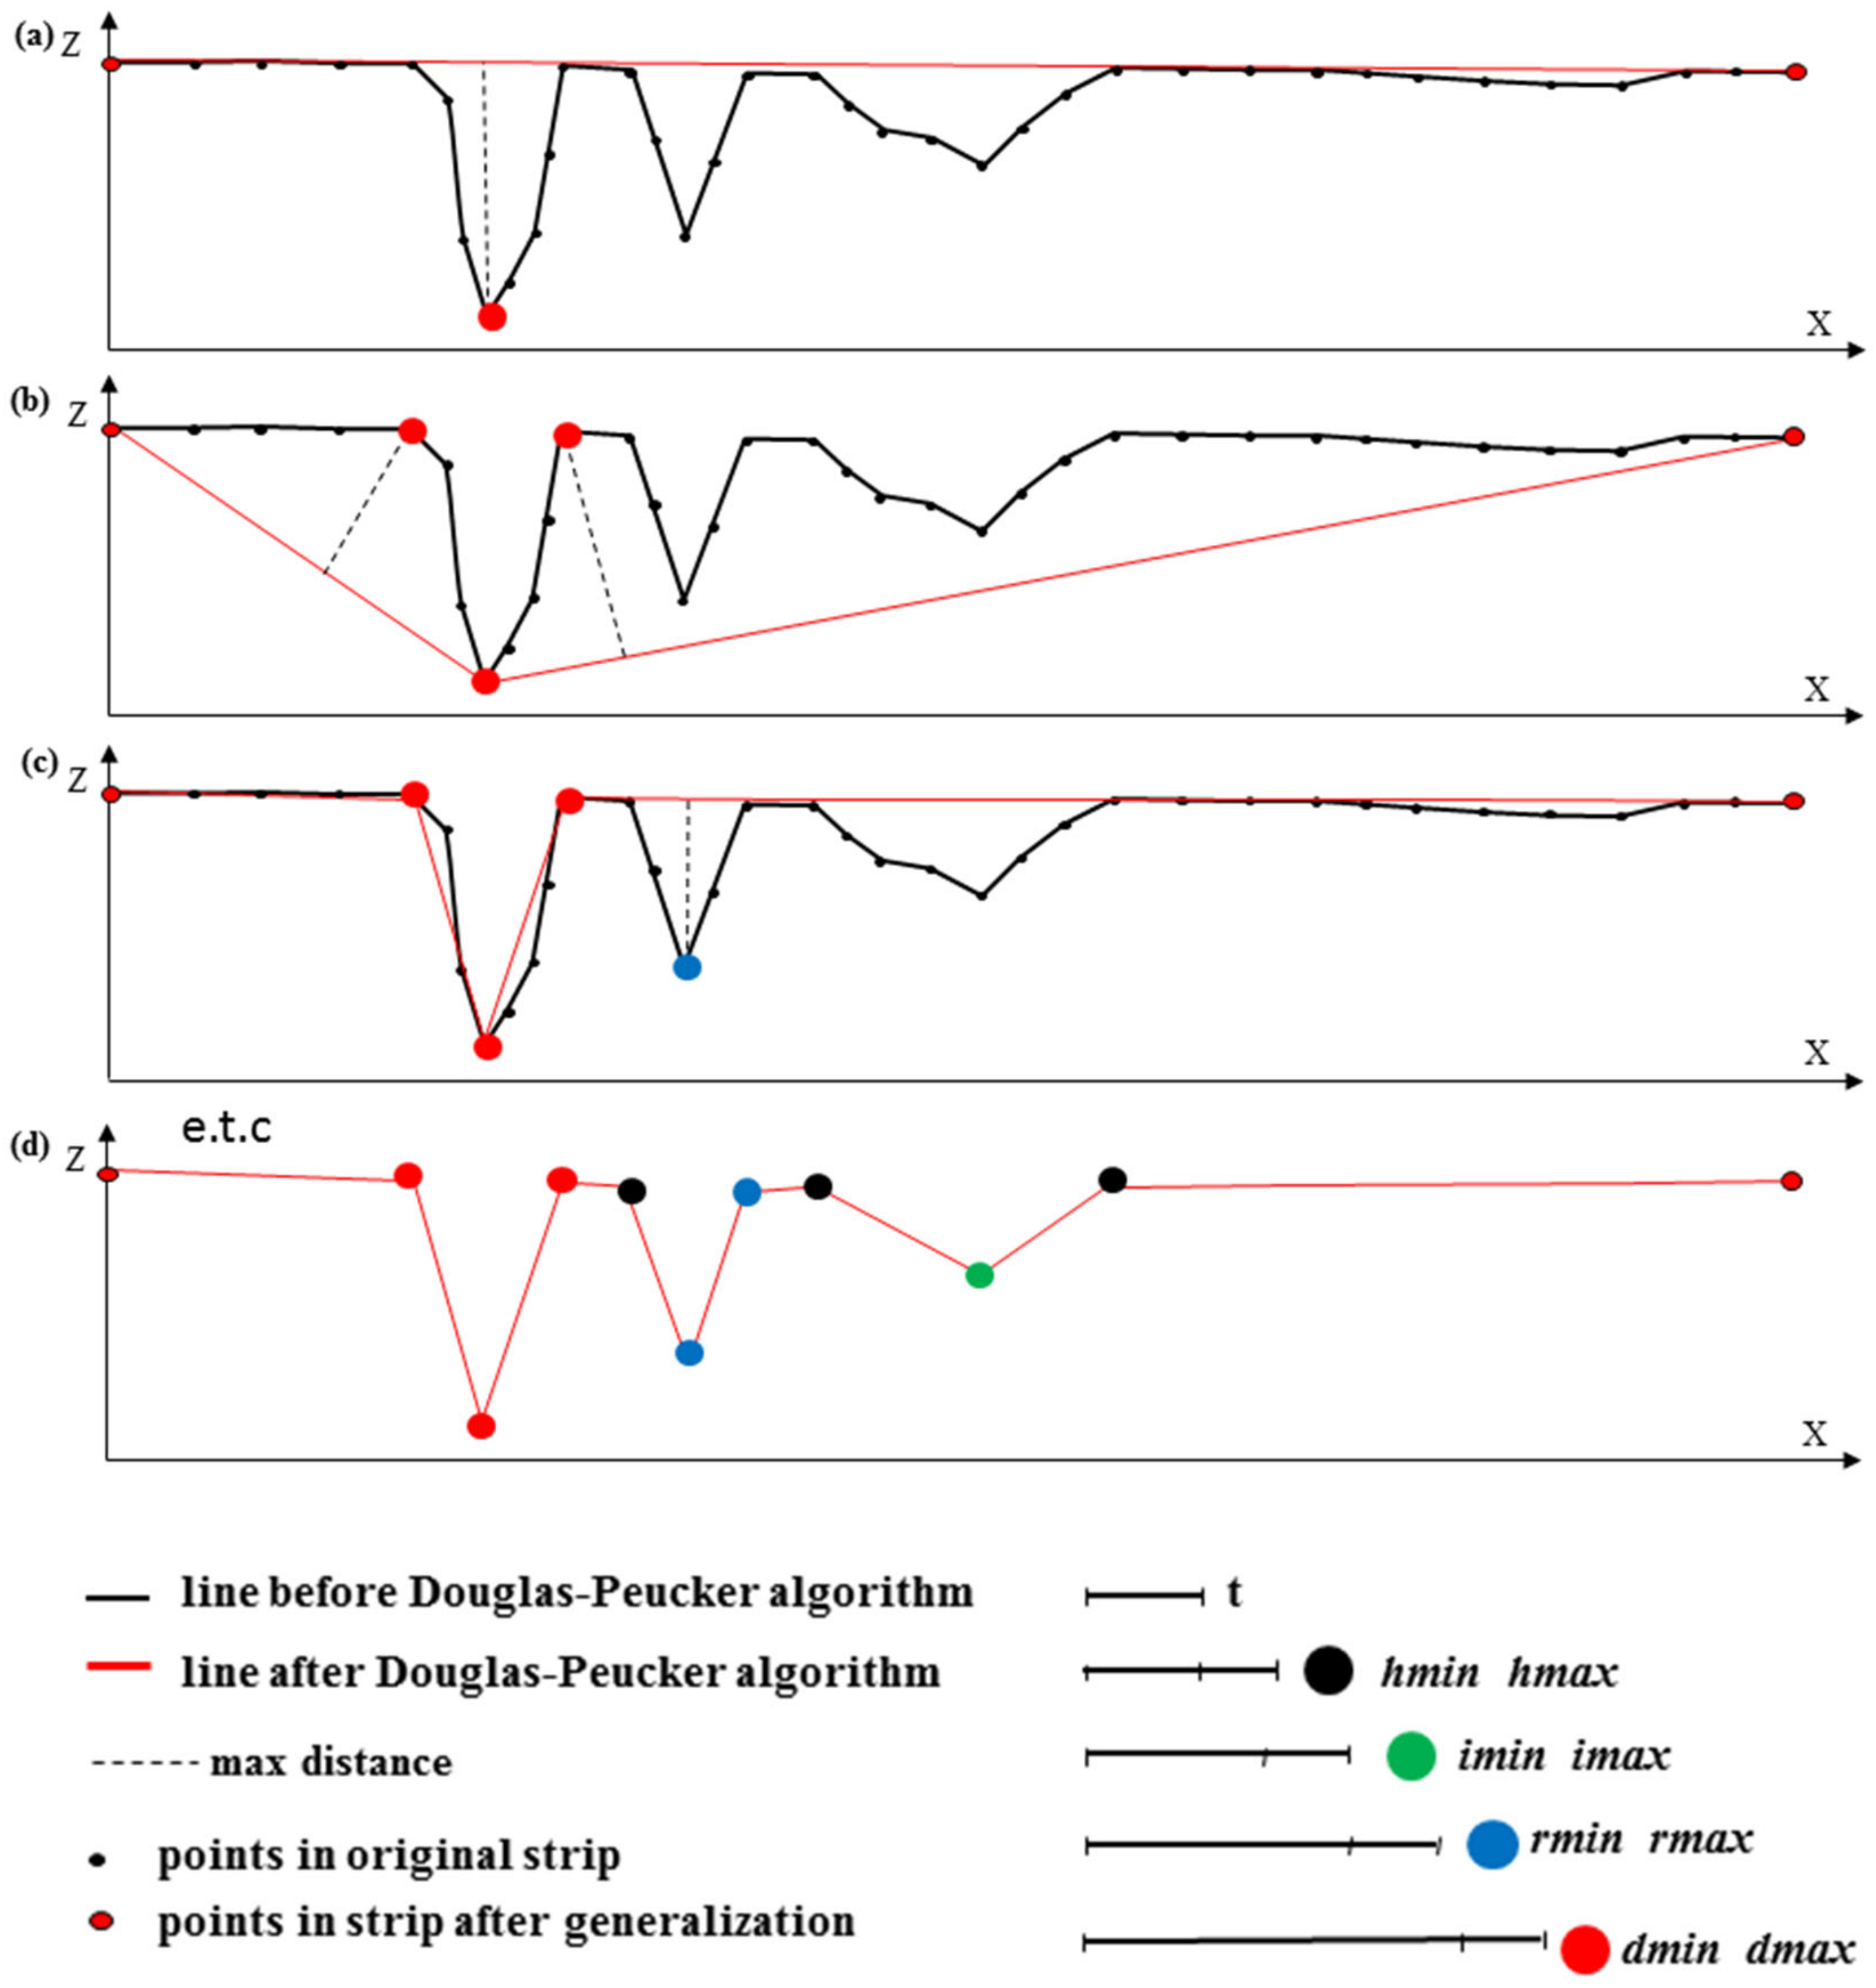
The first modification takes place at the stage of determining whether the analyzed point will be removed or preserved in the dataset. If the distance of the analyzed point to the base line in the Douglas–Peucker algorithm exceeds the tolerance range (t), then it can be assigned to the group of points indicating the type of change in the wall. This is possible because, in addition to the tolerance range (t), the user can enter the values of the intervals to determine the amount of change by introducing the degree of change, namely harmless (
h), to the inventory (
i), requires repair (
r), and dangerous (
d), with min and max values, denoted, respectively, as
hmin and
hmax, imin and
imax, rmin and
rmax, and
dmin and
dmax. The modification of the generalization algorithm is presented in
Figure 2.
The first modification is the basis for the second one. Points representing changes (e.g., cracks and gaps) are indicated in the ‘outputfile.txt’ file by adding a column with codes as follows: h—code 0, i—code 1, r—code 2, and d—code 3.
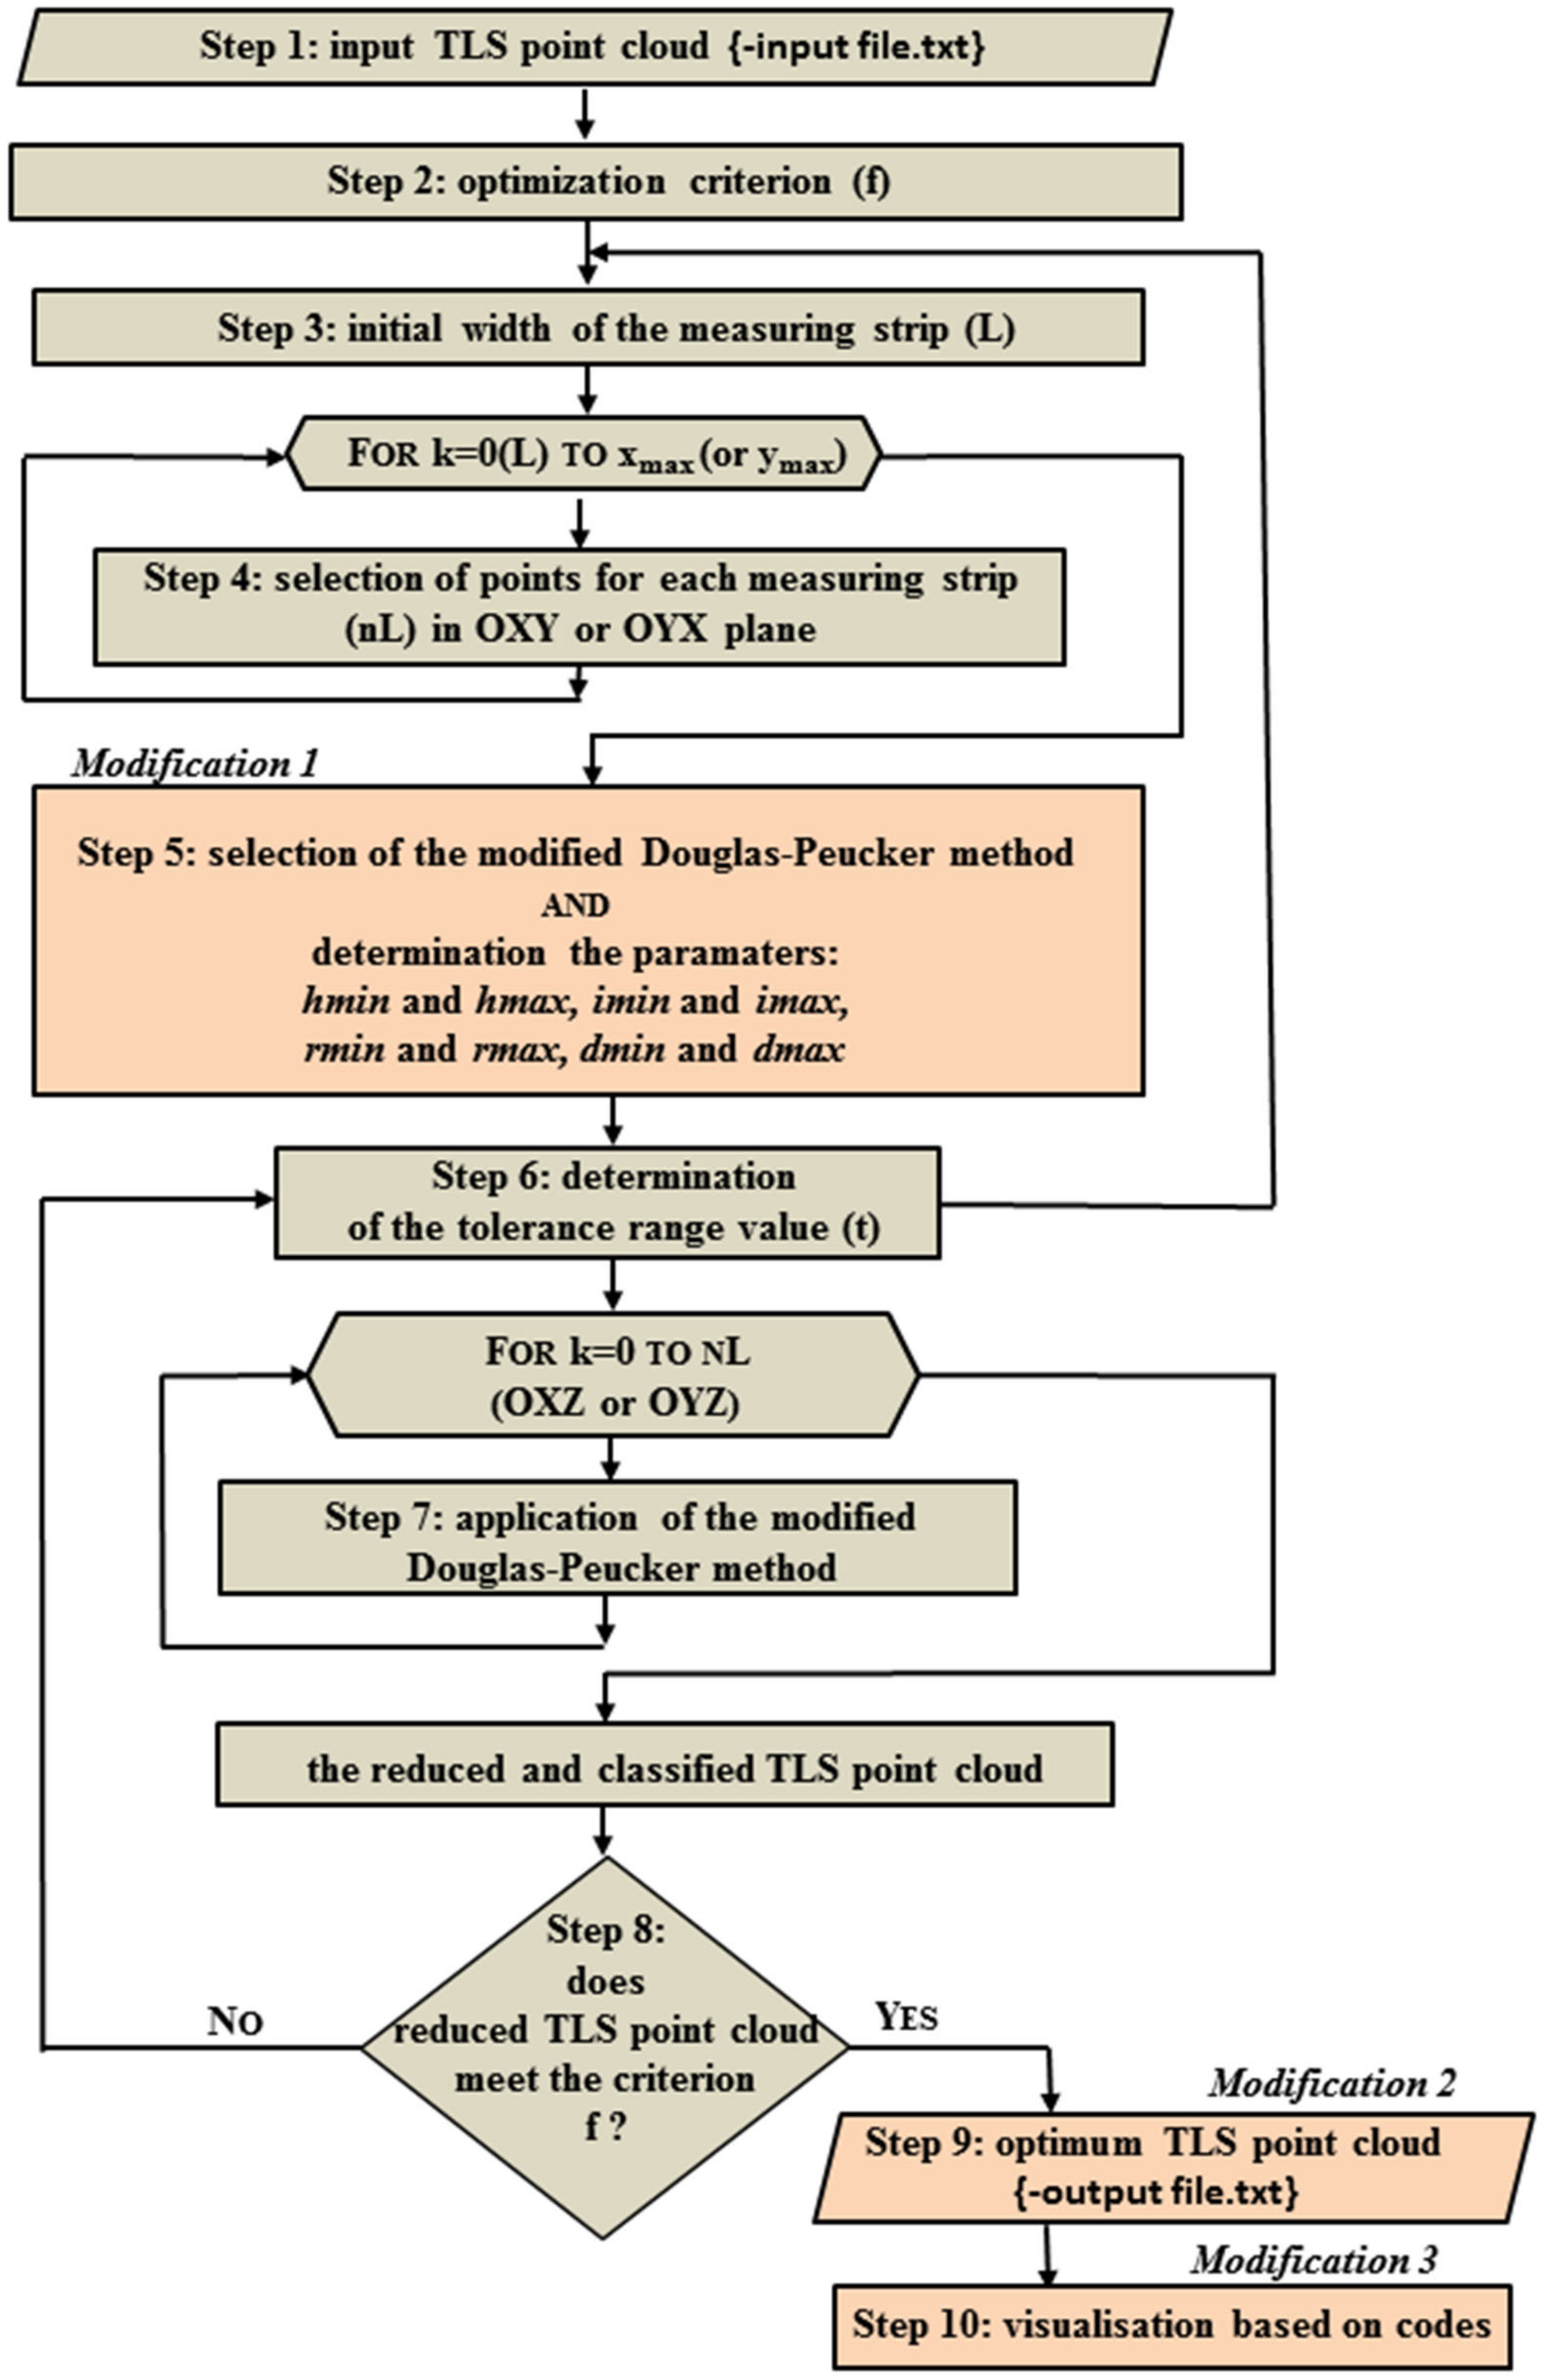
The third modification includes visualization of the types of changes in the wall by adding colors into the point cloud on the basis of the adopted codes. For this paper, the following color scheme was used: 0—black, 1—green, 2—blue, and 3—red. Such an approach makes it possible to quickly assess the condition of the scanned wall and indicate immediately those parts of the wall/building that may be in dangerously poor condition or in need of renovations. The scheme of the workflow with the modified OptD method is shown in
Figure 3.
The OptD method for detecting and classifying the wall defects is carried out in the following stages:
Reading the TLS measurement dataset in *.txt format (step 1).
Setting the optimization criterion (f) (step 2). The value of this criterion depends on the user. The f value for the purpose of detecting the wall defects is assumed to be a percentage of points left in the dataset after reduction.
Determination of the processing area by finding the minimum and maximum coordinates in the OXY plane (2D). In this way, a rectangular processing area is created, which is divided during the processing with OptD into measurement strips (L) (step 3). The strips can be horizontal or vertical. The width of the measurement strip is automatically calculated (without the user’s participation) and adjusted in subsequent iterations.
Each measurement strip is analyzed separately. In each strip there are measuring points that form a curve (step 4). The curve is generalized with the use of generalization methods, which in this paper was the modified Douglas–Peucker method (step 5). The generation of lines created by points in the measurement strips is always performed in the OXZ or OYZ plane. Thus, the changes are detected by analyzing the geometry. In this stage, the tolerance range value (t) is determined (step 6).
The end of OptD processing occurs when the generalization method is applied in all measurement strips (step 7). The saved dataset meets the optimization criterion set in stage 2. The width of the measurement strip and the range of tolerance determine the degree of reduction; therefore, these values are changed during the iteration until the output dataset meets the optimization criterion (step 8).
The optimum TLS point cloud is saved in an output file in .txt format (step 9). Then the user can use the reduced and classified dataset for visualization (step 10).
2.2. Test Objects
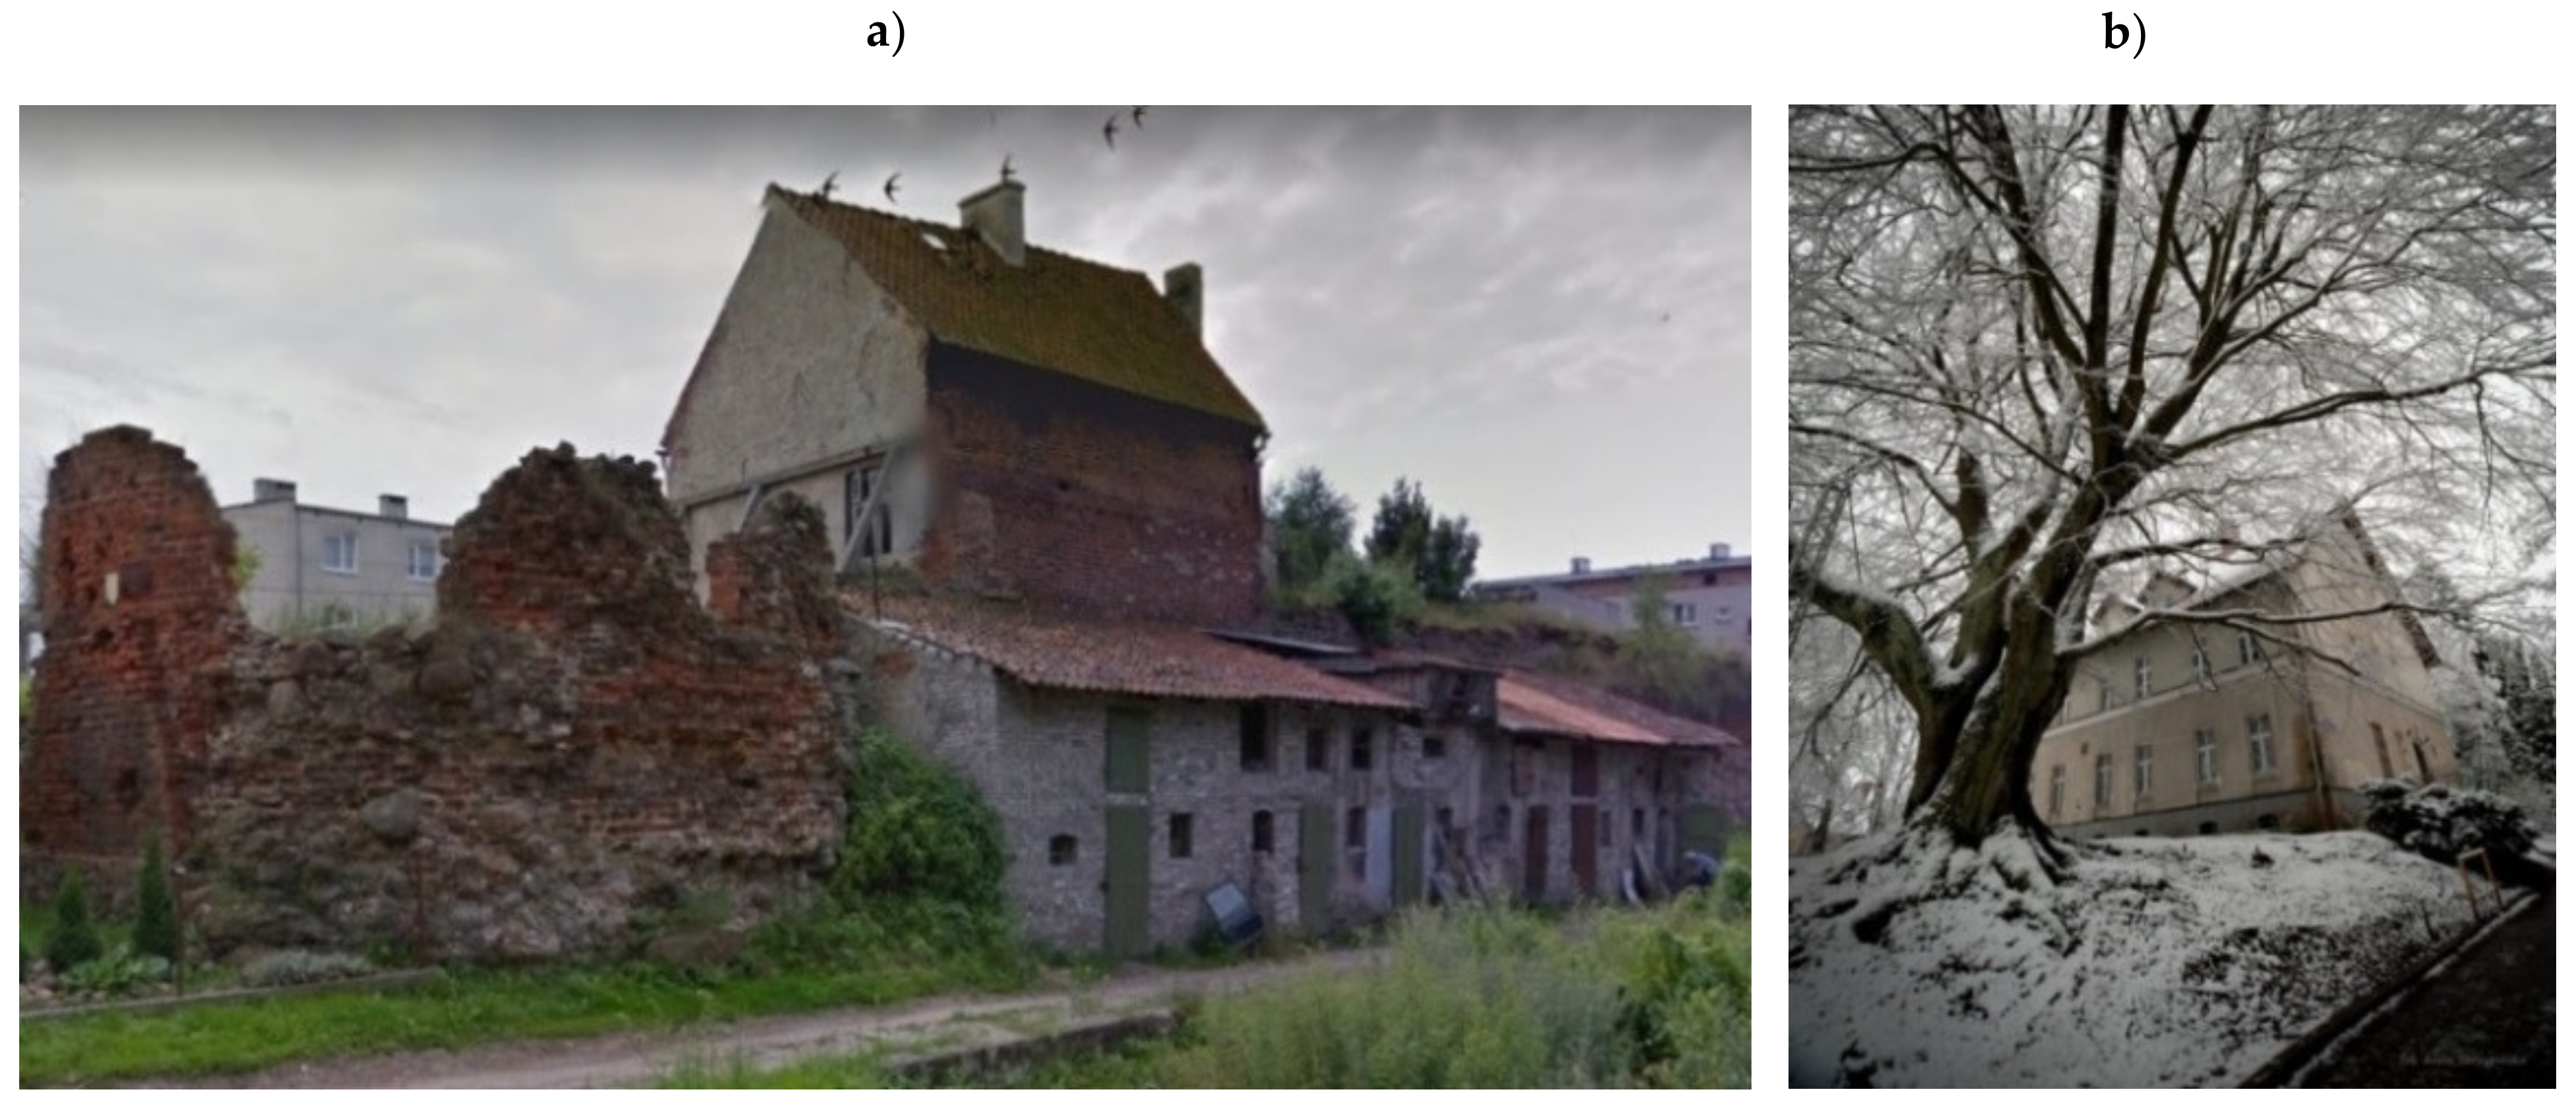
In this study, two test objects were selected. They are located in the Warminsko–Mazurskie Voivodeship in Poland. The first object, which is located in the city of Dobre Miasto, is the ruins of a tower with preserved fragments of medieval walls. The second one, located in the city of Olsztyn, is a building of the headquarters of the Institute of Geodesy, University of Warmia and Mazury. The two test objects, object1 and object2, are shown in
Figure 4.
These buildings are covered by a permanent inventory and are under the protection of a monument conservator. The building of the Institute of Geodesy is in a good condition due to renovation work that was conducted when it was needed, while in the case of the tower ruins, there are only fragments that are not hazardous. In the basements beneath these buildings, there are rooms with no access to daylight. Measurements of the objects were taken with a Leica C-10 scanner. For both objects, fragments of the set of observations were selected, which were then processed by the modified OptD method. The datasets obtained for object1 represented walls, while those for object2 represented basement ceilings and loft walls.
3. Data Processing and Results
In order to correctly establish the criteria for segmentation, the original version of the OptD method was performed, which enabled calculation of the tolerance value and then setting of the criteria for segmentation. The values of L and t, as seen in
Table 1, were obtained in the last iteration.
The results of the second modification are presented in
Table 2. Next to the position of each measured point and its intensity, the code column was added. This is a fragment of the outputfile.txt that belongs to the Object 1 fragment1.
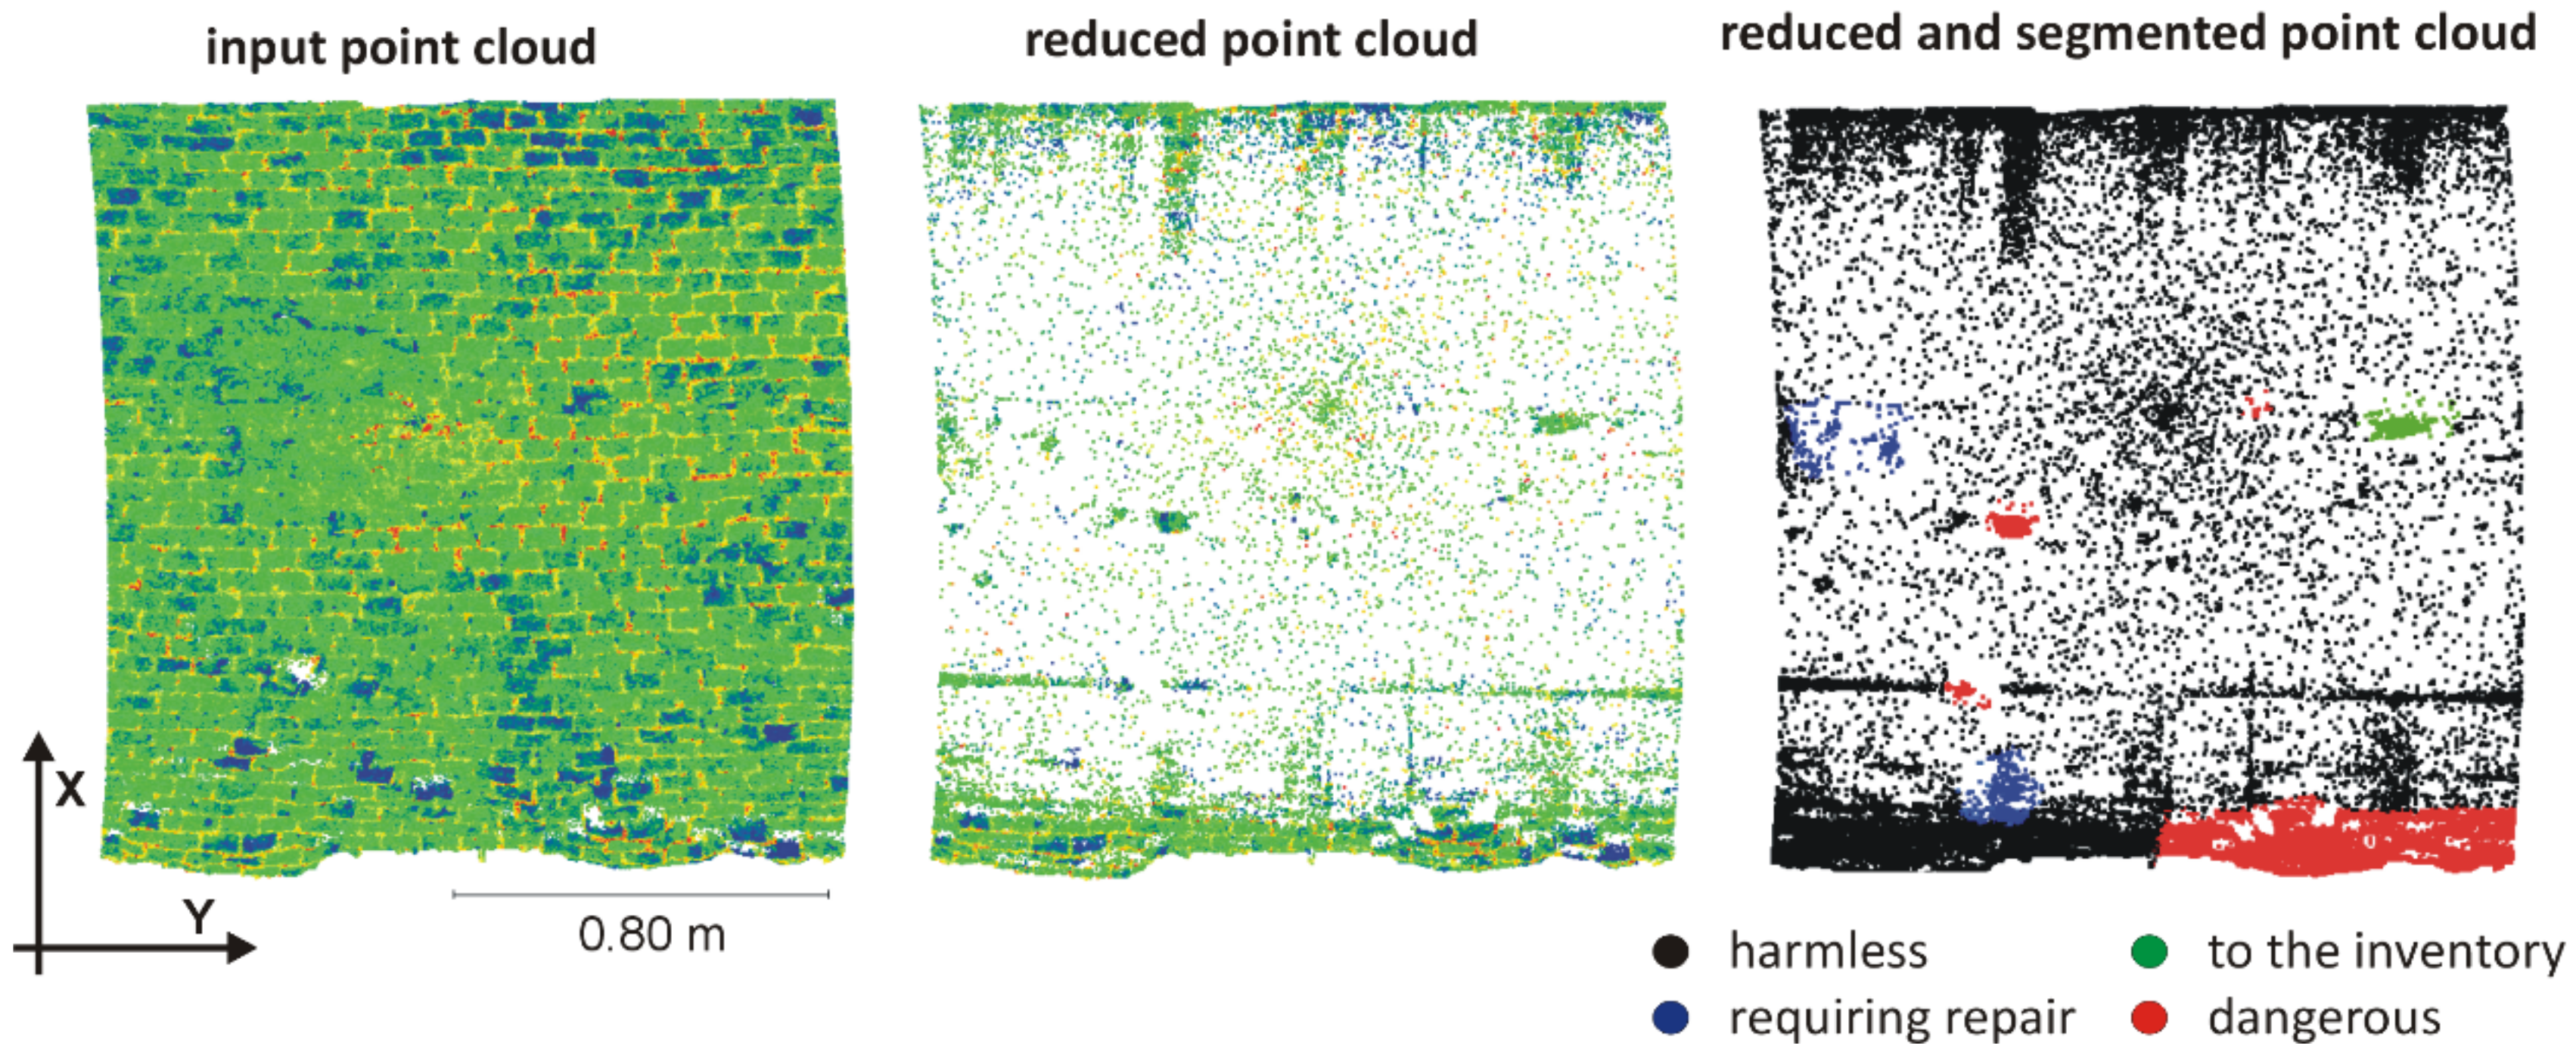
The third modification can be noticed in the visualization of point clouds.
Figure 5 and
Figure 6 show the final results of the performance of the modified OptD method. In the selected fragments of the basement (Object1), different types of changes in the surface were clearly visible. For object1, segmentation was performed in the OXYZ coordinate system, which means that during step 7 of the OptD method in the modified Douglas–Peucker algorithm, the Z coordinate was considered. This allowed the geometric changes of the examined fragments of the wall to be registered.
Figure 5 shows the exact location of cavities in the basement ceiling. As can be seen, dangerous parts of the scanned surface are indicated by red color. Determining defects in a quick and objective way, especially in places important for the structural integrity of the building, allows for a quick diagnosis of the building to be made so that corrective actions can be carried out in order to avoid jeopardizing the object’s stability or even collapse.
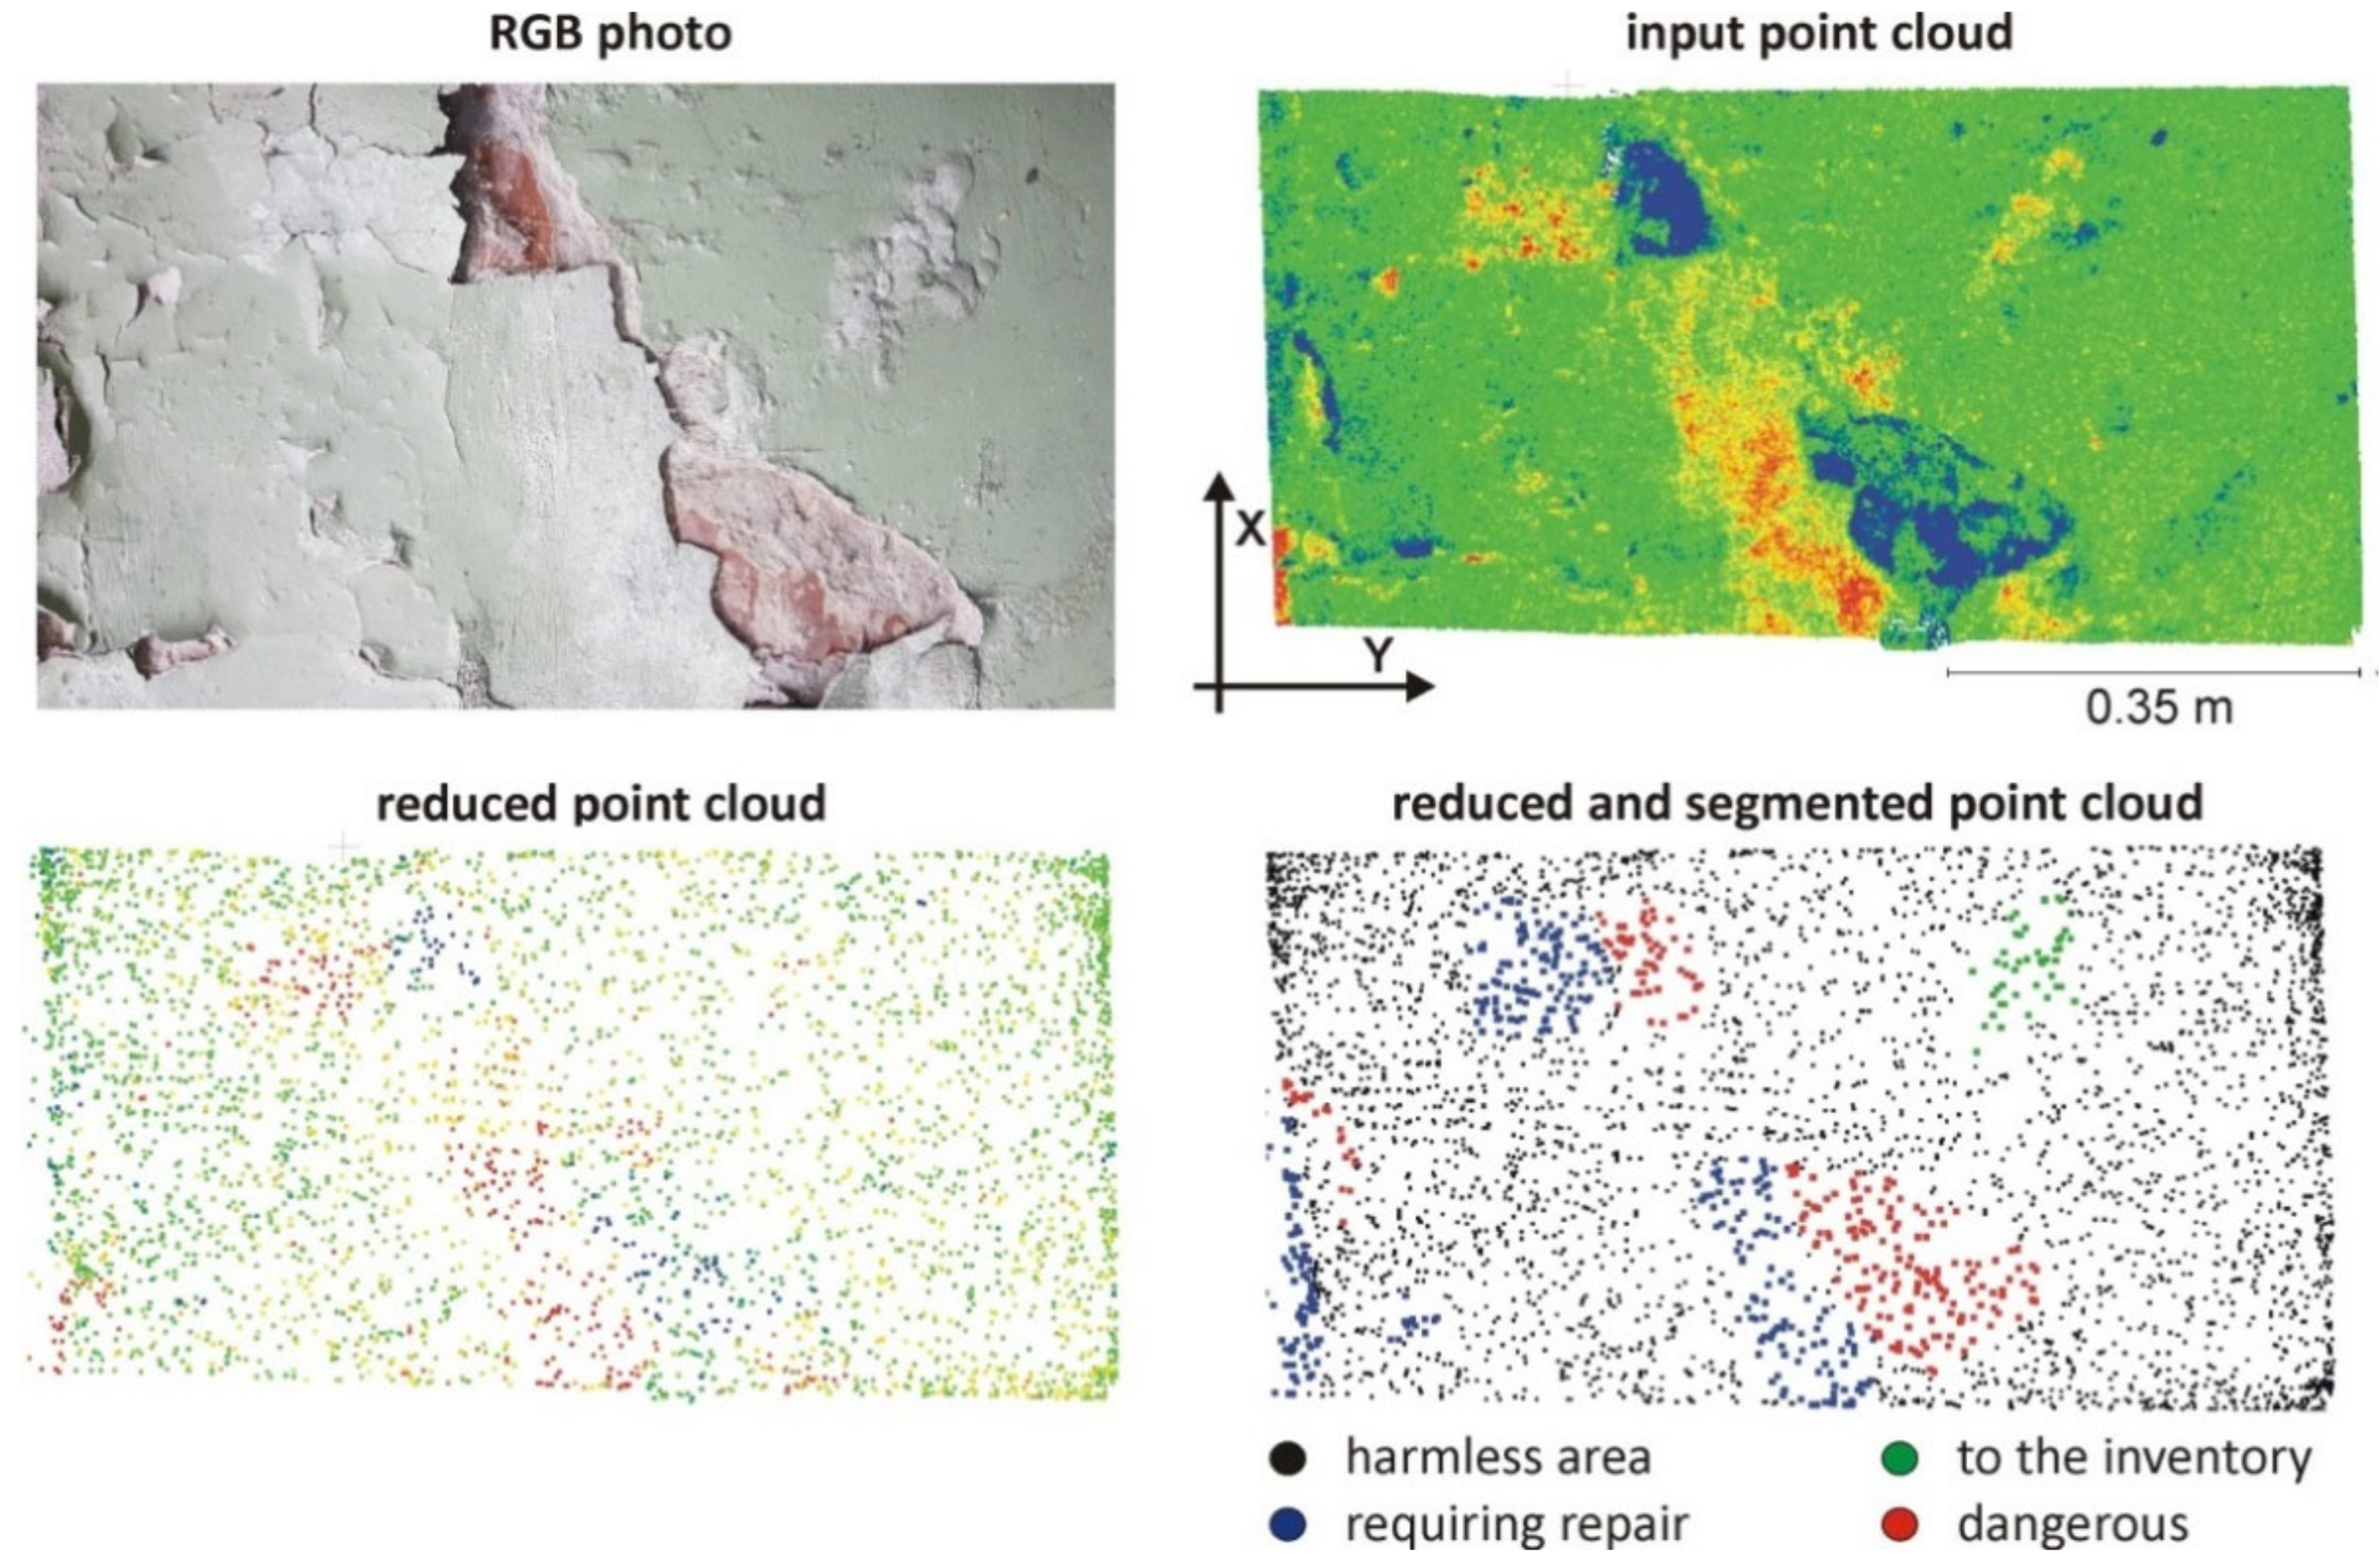
As seen in
Figure 6, the changes were also detected and classified correctly. In areas of falling plaster, a hazard was signaled.
In the case of object2, the situation was different because, inside the basement, the walls did not have cavities, grooves, or holes. The changes on the walls were only of a discoloration nature, including moisture, which was clearly visible in the images and during the inspection of the basement’s condition.
Small cracks, moisture, and discoloration on wall surfaces require a more detailed approach. Usually, these surface defects are impossible to detect by spatial coordinates in the OXYZ plane analysis. Thus, the reduction of point clouds was conducted in a different way, for example, by introducing an additional registered parameter, namely intensity. In that case, segmentation was performed with the modified Douglas–Peucker method in the OXYI coordinate system.
Of course, it should be noted that a change in intensity (which is analyzed while the algorithm is running) can create changes in humidity, roughness, and color. The detected surface imperfection may or may not mean a wall defect. Such a variant of analysis can be treated as additional information about the technical condition of the wall. The assigned codes and colors inform us about the change in the intensity value.
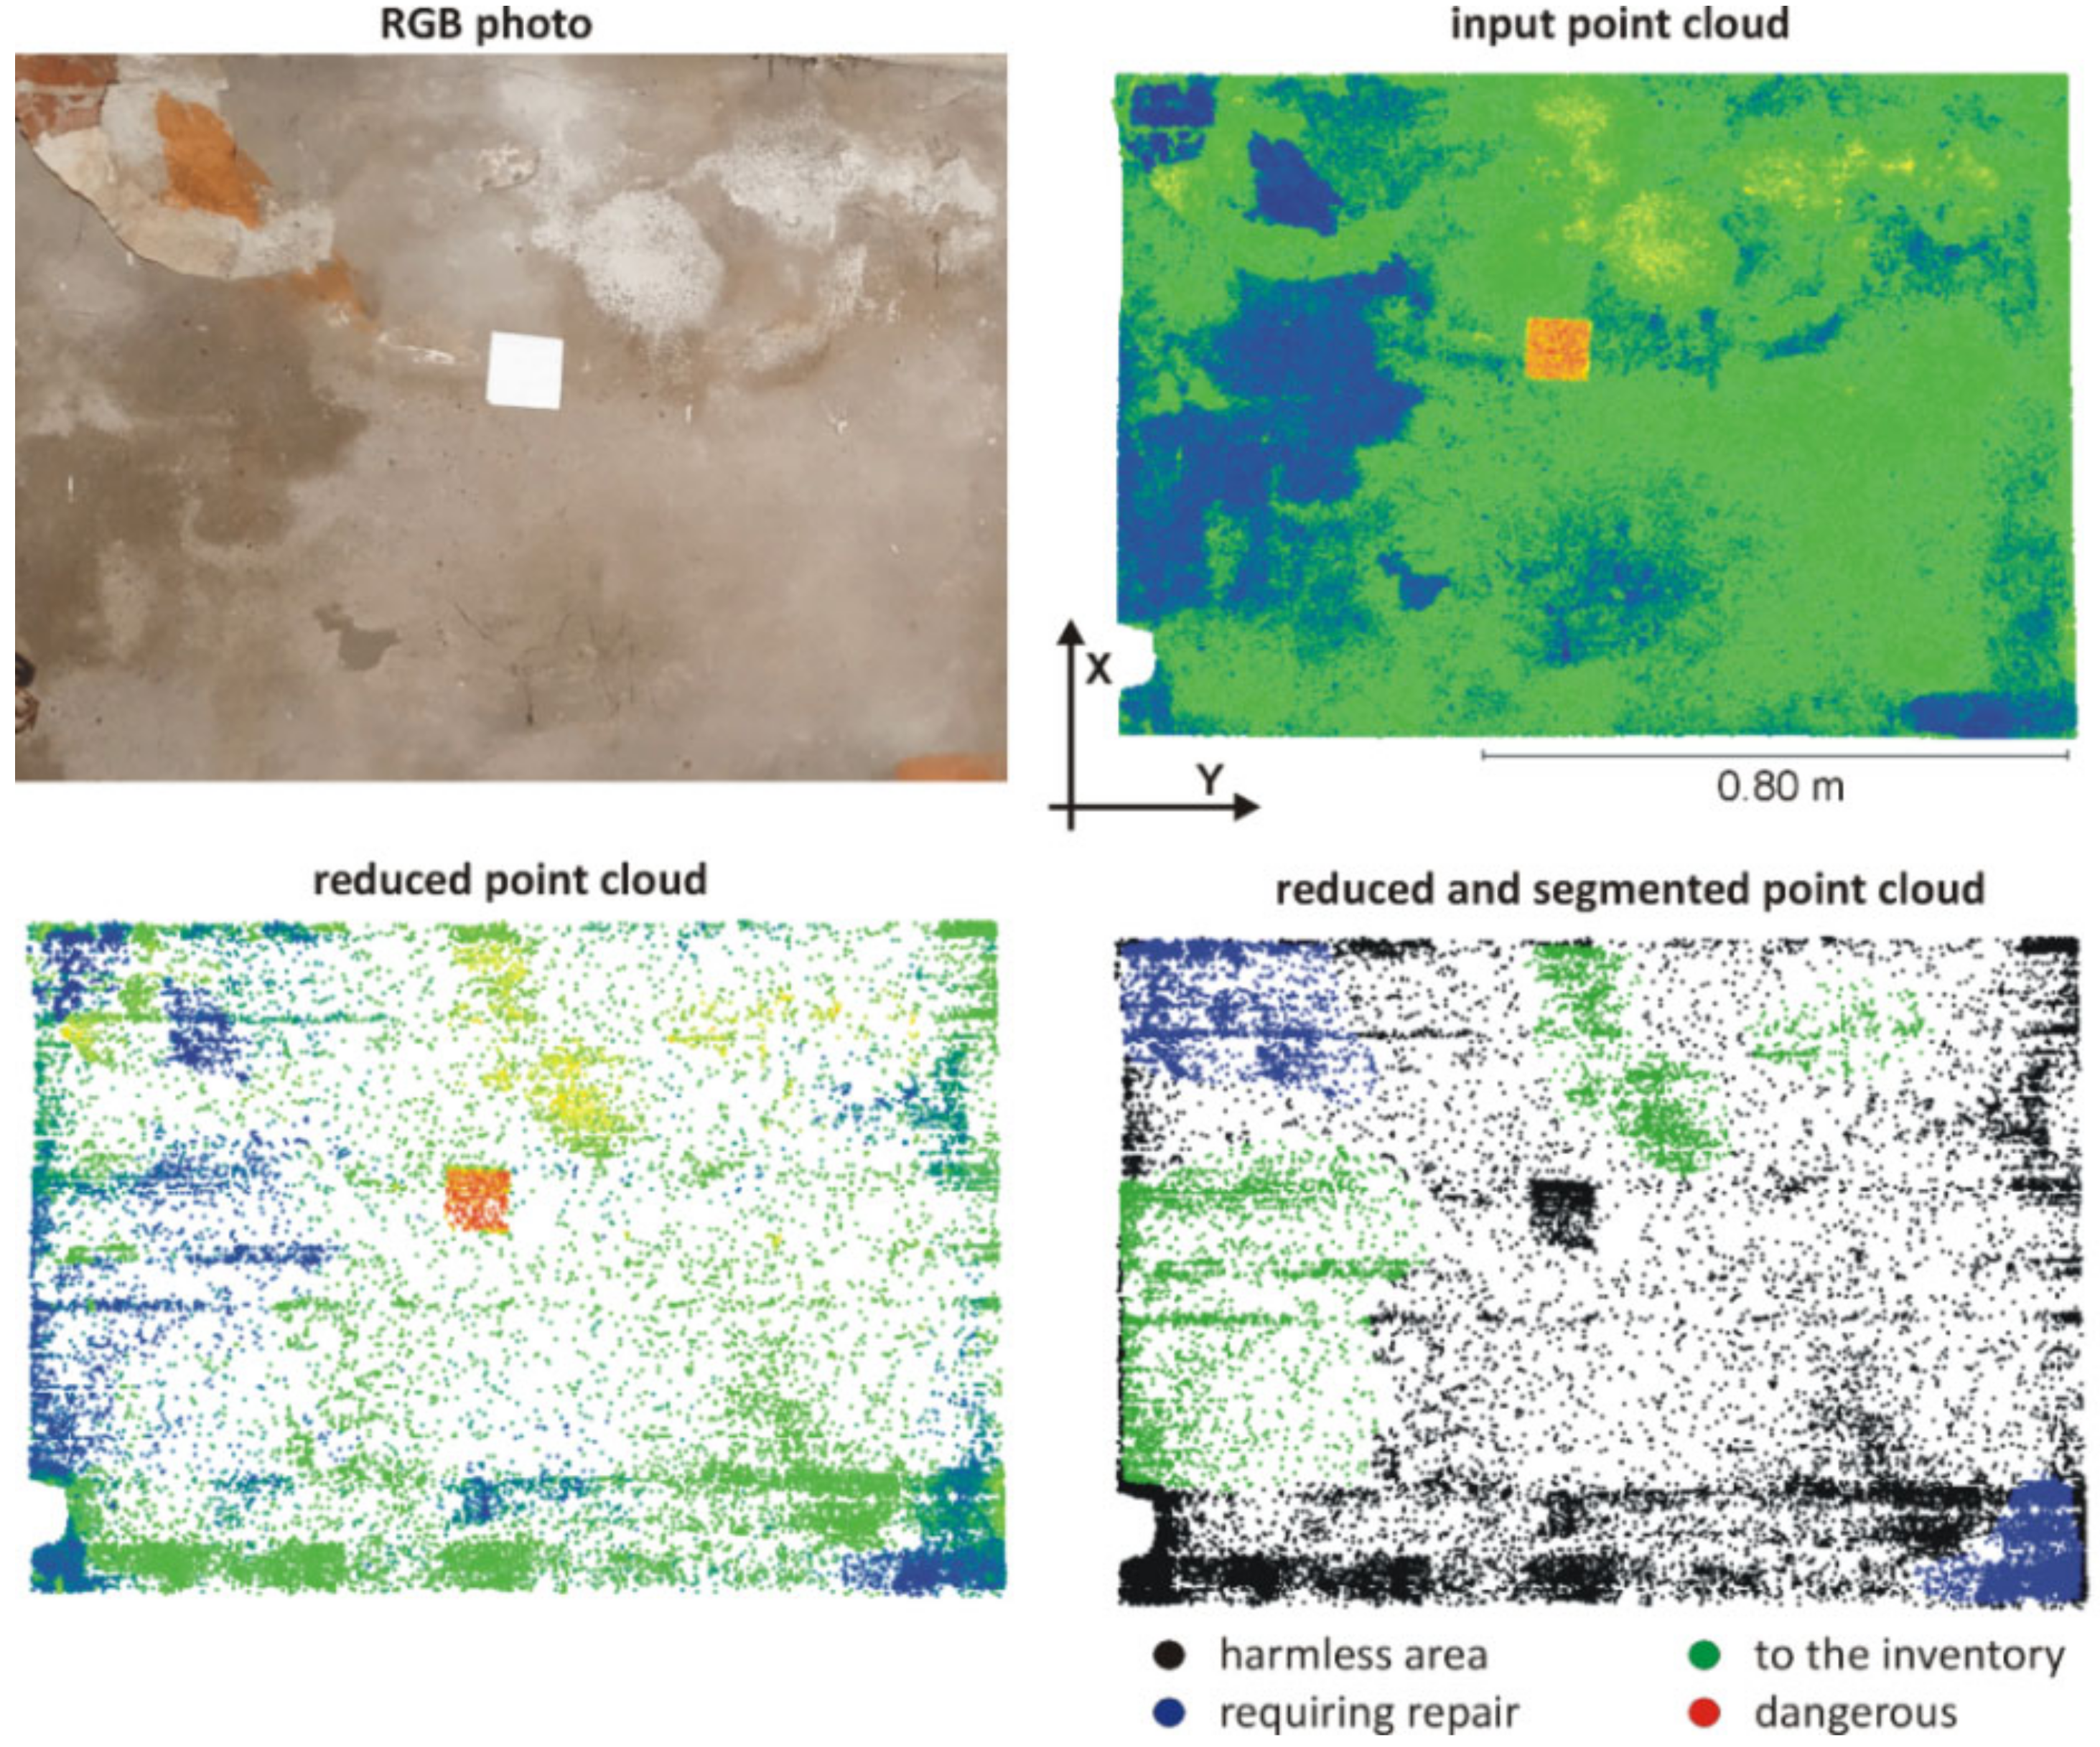
Figure 7 and
Figure 8 show the final results of the performance of the modified OptD method for object2 fragment1 and fragment2, respectively, in the OXYI coordinate system.
As seen in
Figure 7, the locations of moisture changes were indicated. Surface moisture affects the intensity of the reflected laser signal by absorbing the energy of the laser beam [
19]; therefore, wet/humid places are visible in the point cloud. Segmentation was conducted in the OXYI coordinate system, so the radiometric information from the laser beam was analyzed here. Such analysis of the tested surfaces allows corrective actions to be made, in this case, waterproofing. Subsequent scans obtained within a certain period of time can be used to determine whether the moisture of the walls is subsiding, remaining at a similar level, or increasing.
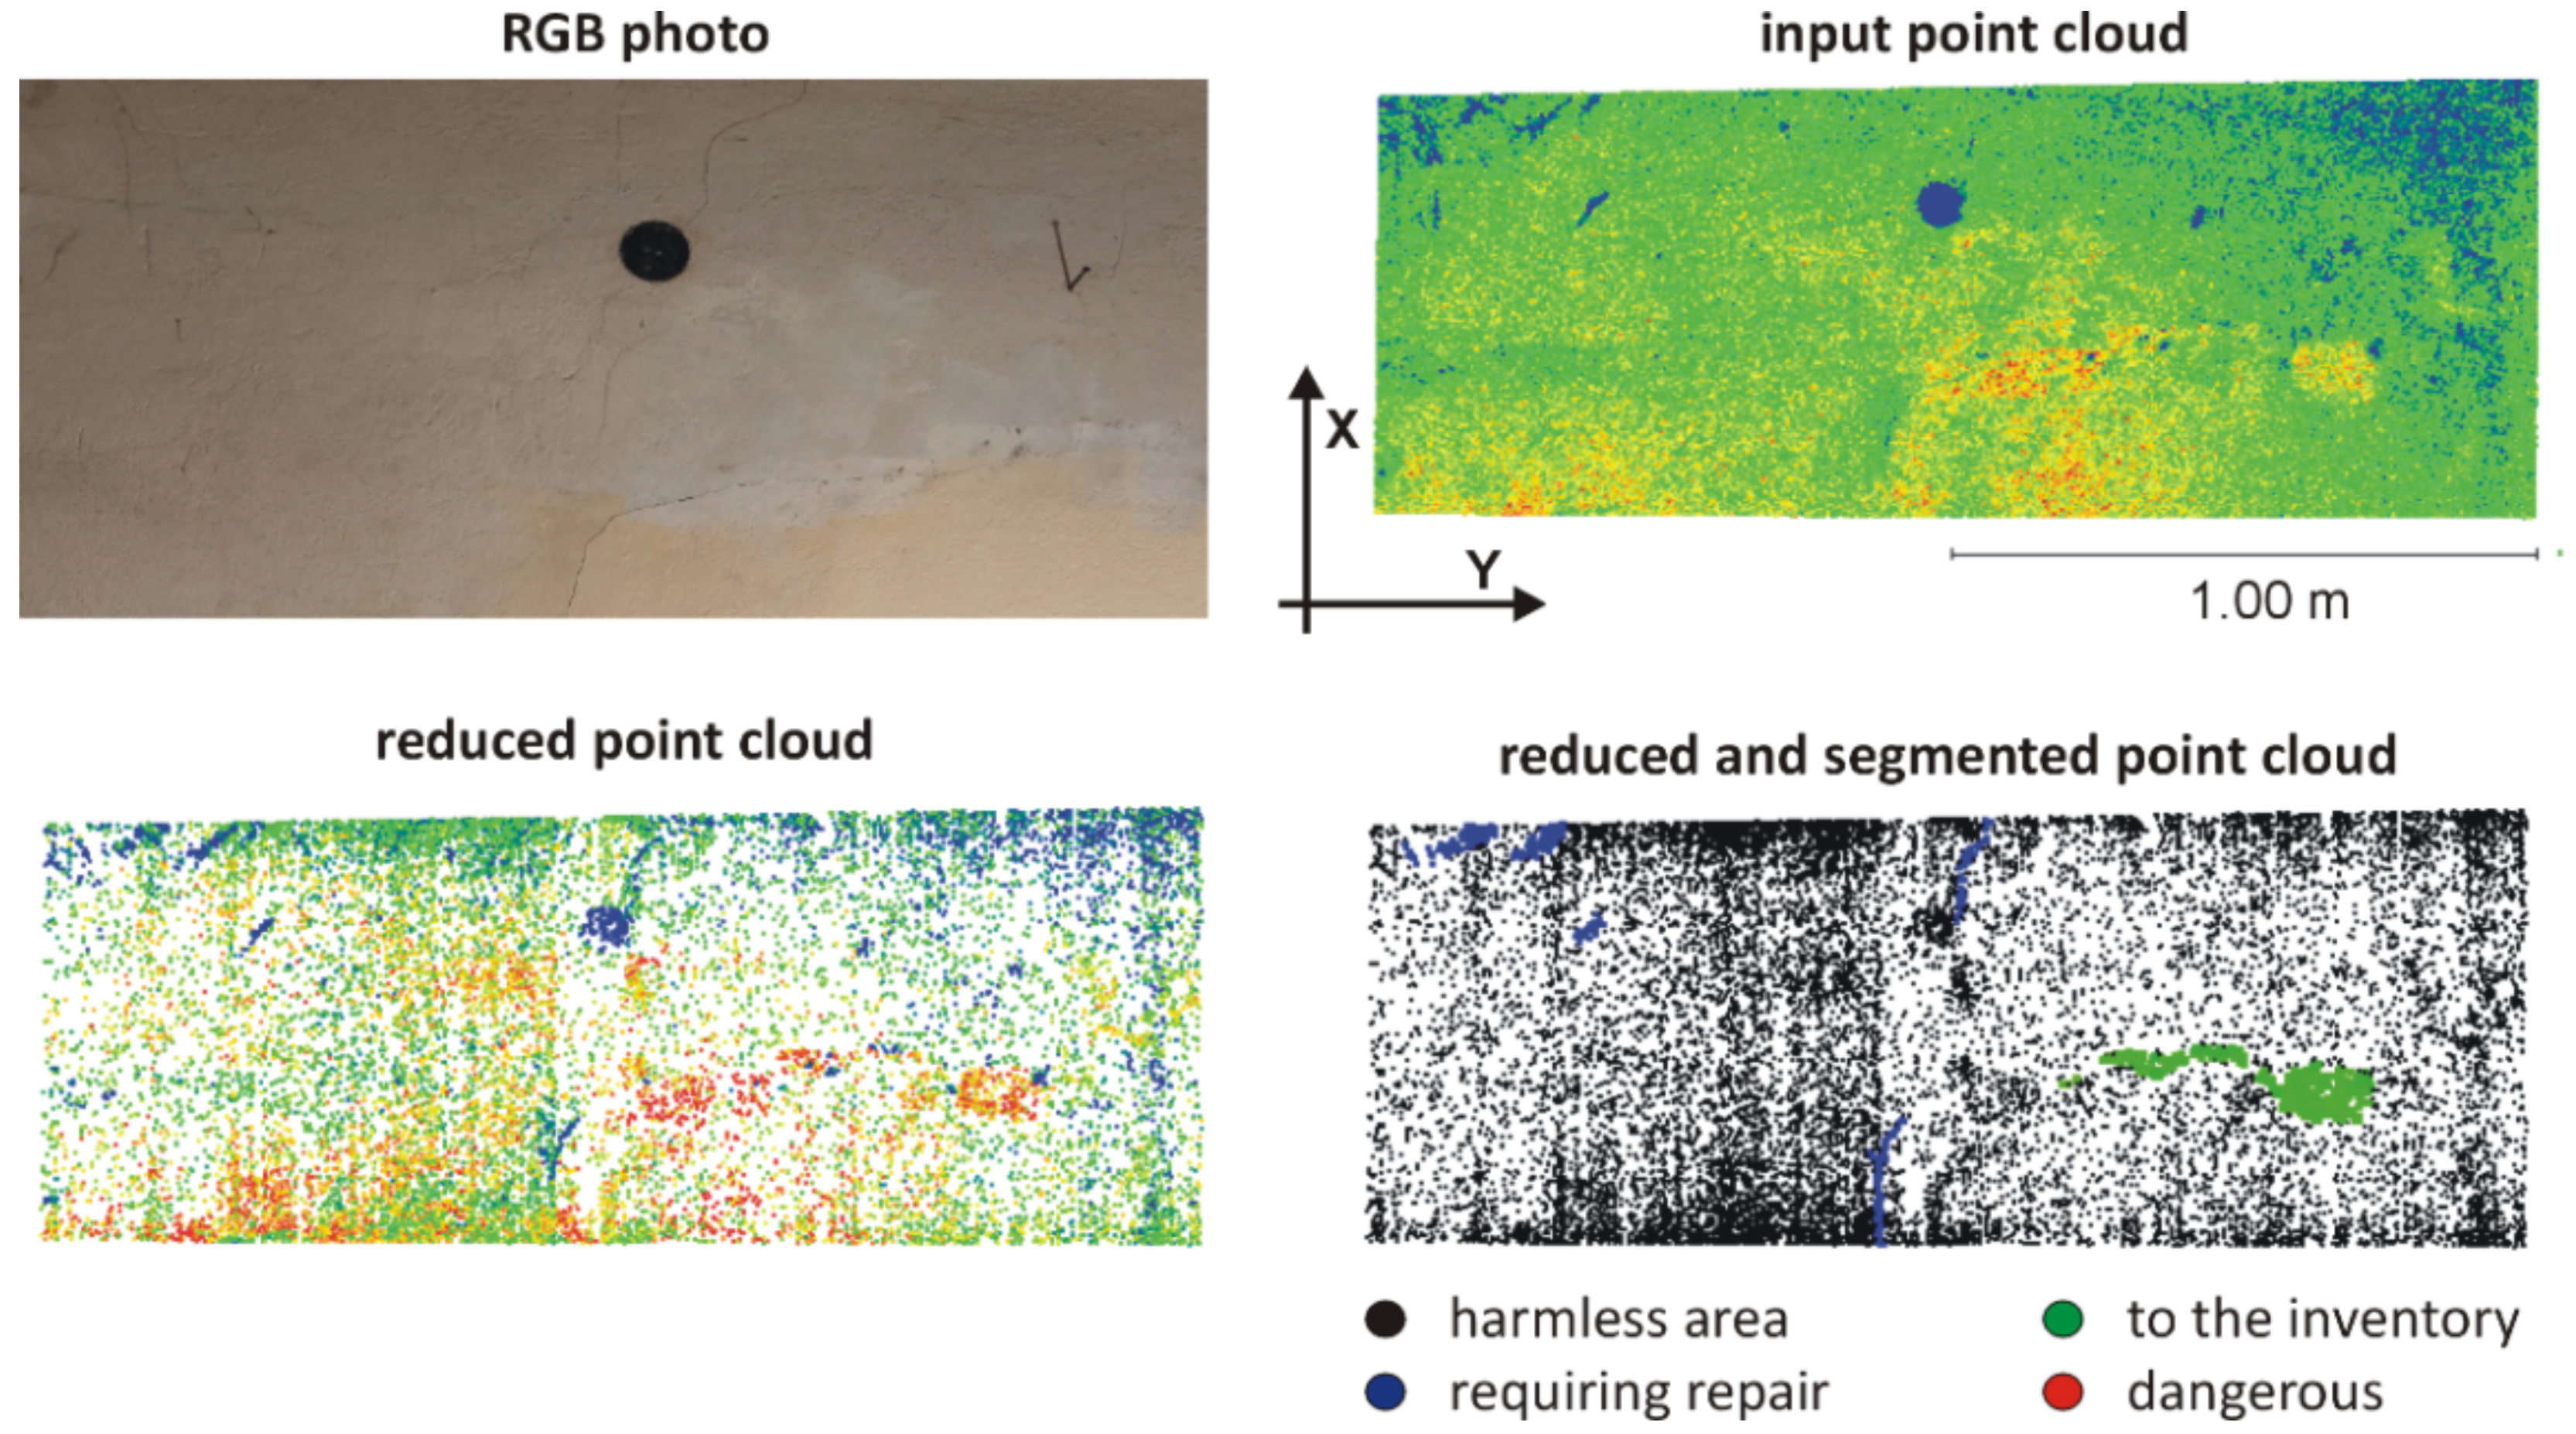
In
Figure 8, it can be observed how the cracks in the wall were detected. The modified OptD very precisely indicated their location, although it was difficult to determine the width of the crack/gap.
The results presented and the ranges introduced for individual classes were intentionally “exaggerated” to show the operation of the method. Tolerance ranges for individual classes can be set depending on the type of building (age, type of structure) and the material of which the building is made and finished (brick, concrete slab, plaster). From the roughness of the walls, as well as from the type of damage, the different values of hmin and hmax, imin and imax, rmin and rmax, and dmin and dmax can be determined.
4. Discussion
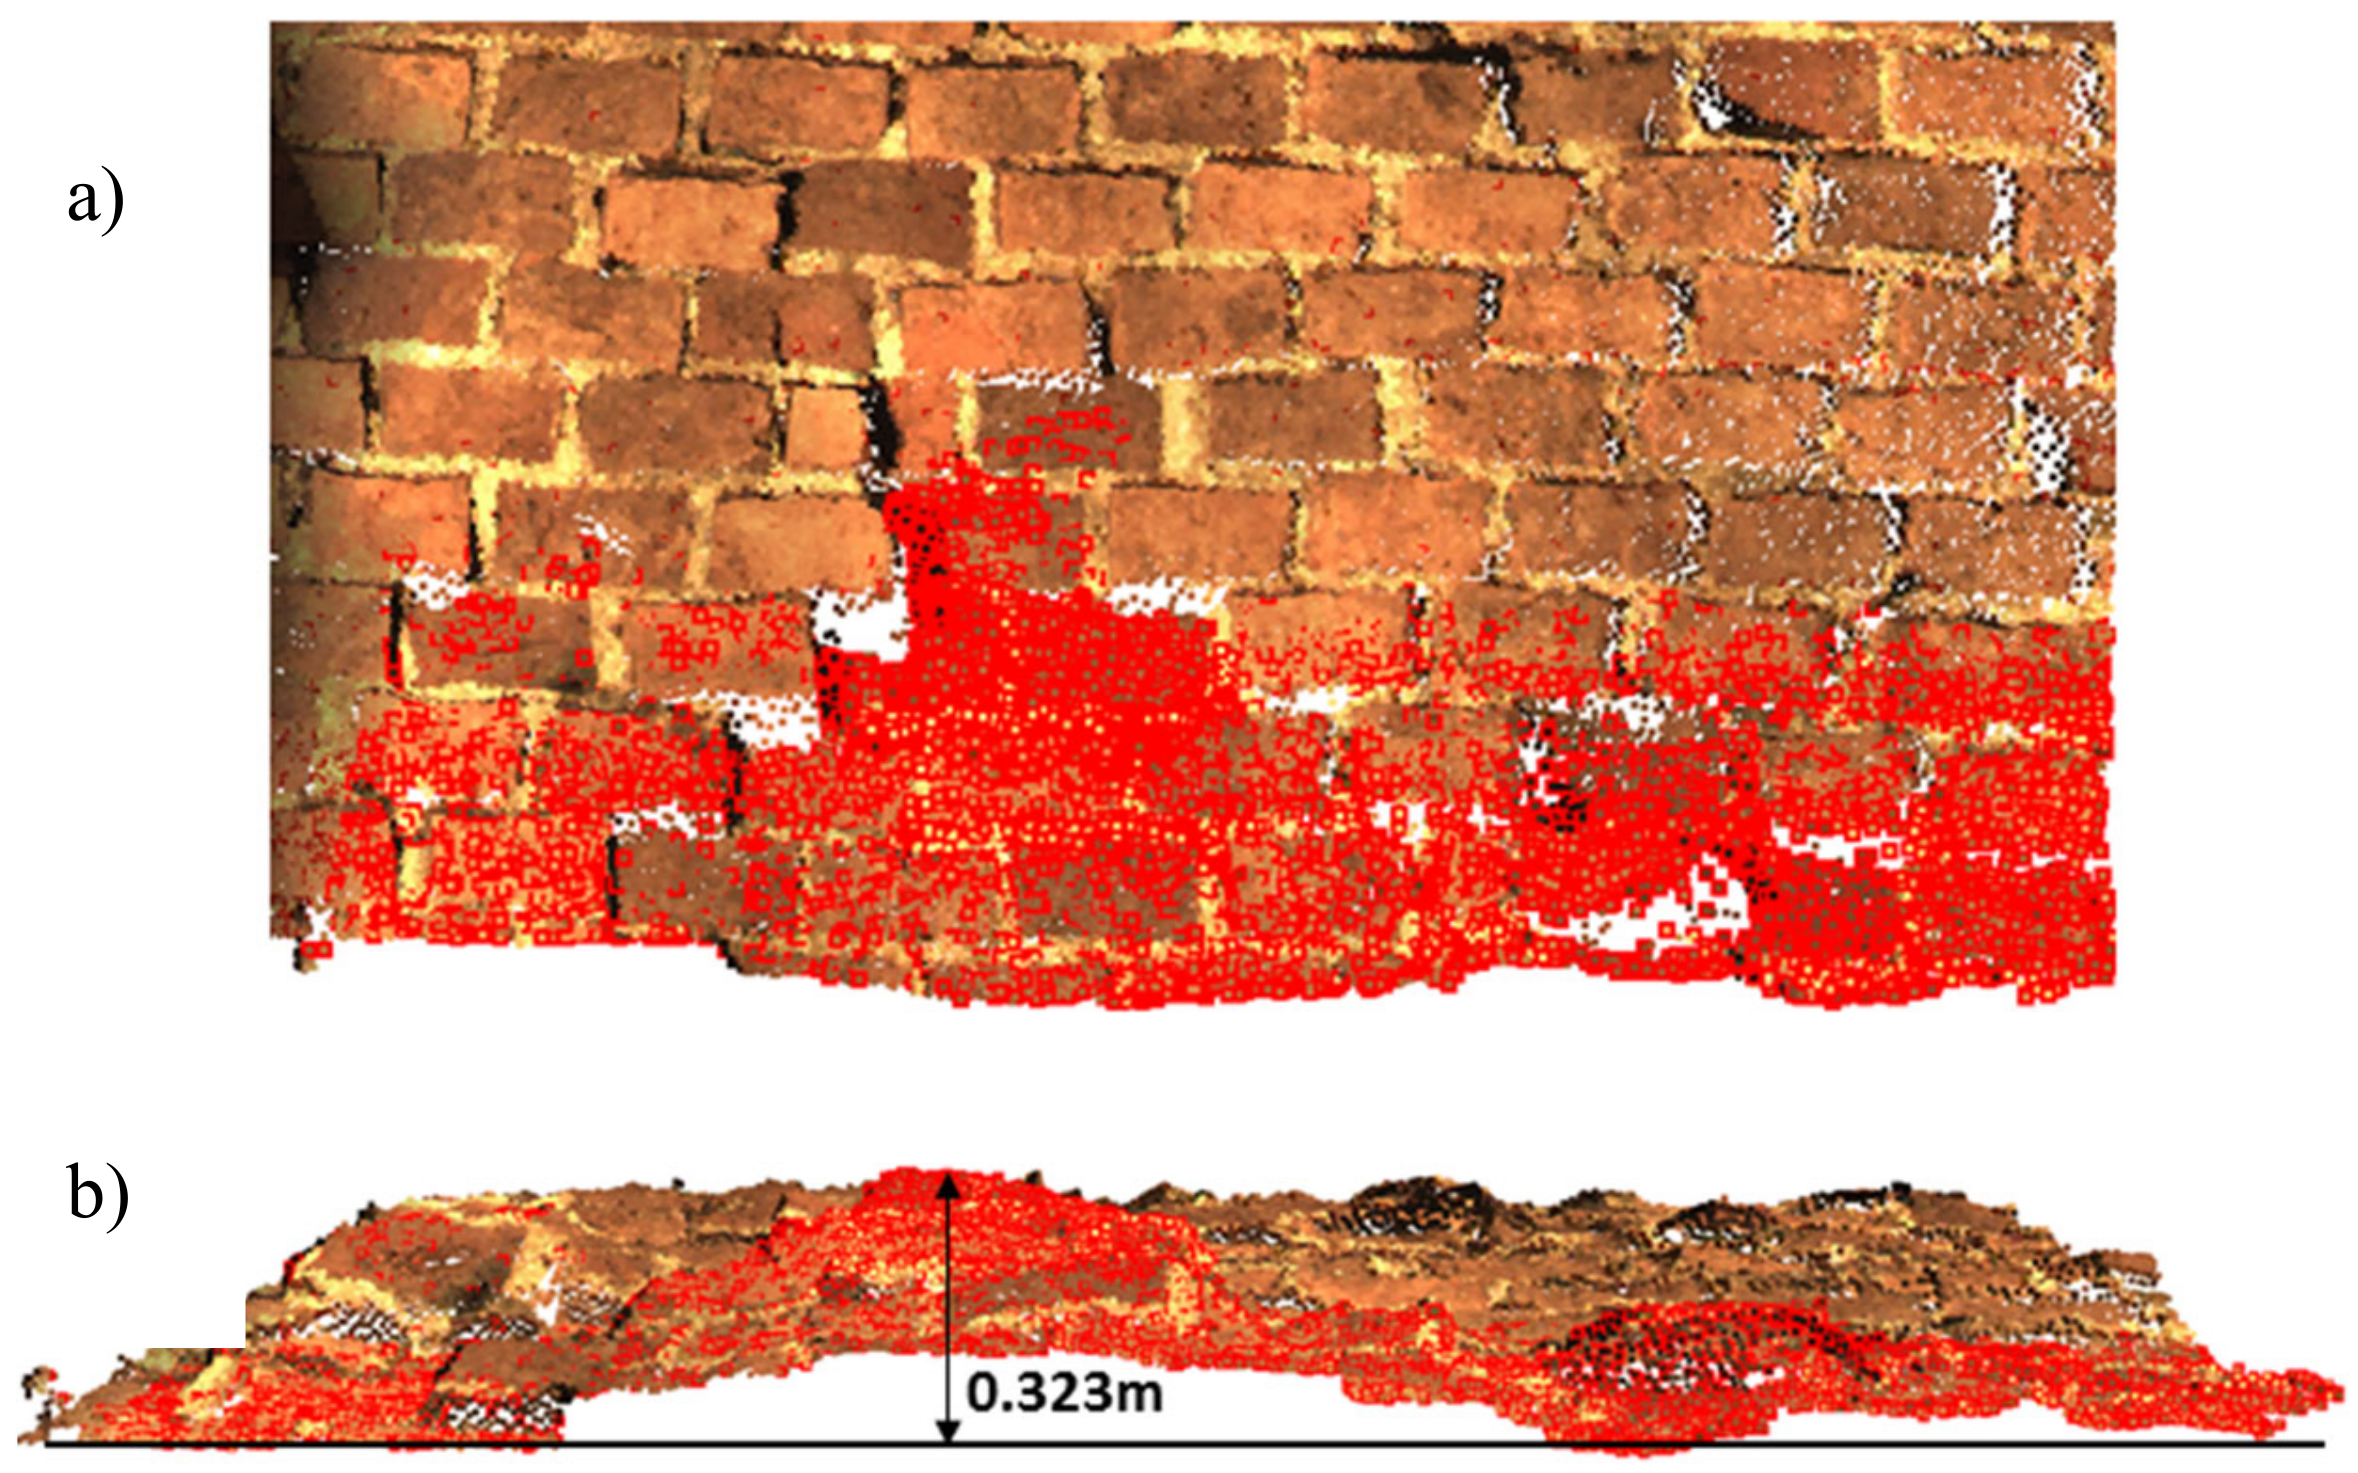
Application of the modified OptD method allows for significant reduction of point cloud data obtained and the detection of cracks in examined objects. Automatic segmentation almost immediately indicates various types of changes ranging from harmless to dangerous areas. Visualization of the segmented point cloud allows measurements to be made within the hazardous area. In our tests, the largest changes in the wall structure were detected for object1 fragment1. The
dmax parameter was entered as a value of up to 1.000 m. The largest change was 0.321 m for a large area of changes distinguished as dangerous. The change is shown in
Figure 9.
Next to the measurements in the 3D model, additional (initial) analyses can also be performed.
Table 3 shows how many points in each of the examined objects were classified according to fixed codes.
As seen in
Table 3, only within the Object1 fragment1 was there an extensive area that was potentially quite dangerous, which included almost 25% of all measured points. Dangerous parts were also indicated in fragment2 of Object1 (about 1.5% of all points). Points that were assigned as “to repair” for both fragments were about 2% of all points. In Object2, there were no dangerous parts; however, almost 2% of the analyzed points in fragment1 and 9% in fragment2 were assigned as “to repair”.
The number of points assigned to specific codes and information about laser scanning resolution can be used to calculate the area of defects.
Table 4 presents areas calculated for individual groups of points. On the basis of this information, an initial assessment of potential repair or reconstruction costs can be made. In our study, the dangerous area in Object1 fragment1 was about 7% of the whole measured surface, and the “repair area” was between about 1% and 2% for Object1 fragment1, Object2 fragment1, and Object2 fragment2, and 7% for Object1 fragment2.
It should be noted that scanning of the examined objects was performed in complete darkness. Not needing to have the object illuminated makes the TLS a very good technology that can be used for inventory purposes, especially in the case of endangered objects where access to daylight or electricity is very limited.
On the basis of the conducted tests, it can be stated that:
The modified OptD method is dedicated to the pre-processing of TLS data acquired in order to examine the changes in object structures.
Analyses are performed on the dataset that is reduced. Points that are left in the dataset are automatically segmented into types of changes.
Results of segmentation are visible in the output file by the addition of observation codes from 0 to 3. The number of codes can be chosen arbitrarily by the user.
Each code is assigned a specific color that is used during visualization of the point cloud, which enables the quick identification of significant changes in the structure of the object.
Due to the relative simplicity of the workflow of the proposed method and the opportunity for quick diagnosis of the object under analysis, the modified OptD method may be considered as an appropriate tool during the inventory of structures.
5. Conclusions
In this paper, the potential of the modified OptD method as a tool for automatic detection of threats in building construction is presented. Scanning of the building, even if there is no daylight, provides reliable data in the form of a point cloud. The dataset obtained is subjected to reduction and fully automatic segmentation in order to detect and assess changes in the surface of the object. The authors accepted the lowest possible percentage of points in the dataset after reduction (f = 1%). The goal is to keep the number of data points as low as possible while still making changes to the structure visible. The OptD reduces the number of observations in the dataset, which is why it has a built-in generalization algorithm. Therefore, performing a small reduction (e.g., f = 99%) will result in no changes being captured, and the modified Douglas–Peucker OptD method will not assign codes to the data points but will give the exact same result as the point cloud measurement. Of course, the dataset of observations cannot be reduced "endlessly". Each dataset should be treated individually, according to the purpose of the study.
To sum up, modification of the Douglas–Peucker algorithm in the OptD method allows for not only the reduction of the number of observations, preserving only those that have significance in this type of study, but also the performance of segmentation in such a way that an architect, a monument conservator, or a construction worker can immediately notice an area of the structure that needs to be controlled.
In the case of historical buildings, the level of emergency depends on standards based on the type of material the building is made of, or the technology by which it was built. Proposed thresholds include the following: harmless (h), to the inventory (i), requires repair (r), and dangerous (d), each with their respective min and max values, namely hmin and hmax, imin and imax, rmin and rmax, and dmin and dmax, determined individually for each building. Information gathered during point cloud analysis (e.g., the number of points assigned to specific codes, the area where changes occurred) can be used as a basis for planning works related to the conservation and/or reconstruction of old buildings. The range of change and information about humidity are extremely important or even essential for estimating the expected repair or recovery costs.
Proposed solutions combined with experienced persons within the field of building inventory should significantly reduce the time and labor necessary in such types of works. Therefore, the authors assume that the OptD method in the proposed version can be used by conservators of monuments, security specialists, building managers, people dealing with property valuation, and repair service valuation experts.

 ,
, 


