Spatiotemporal Characteristics and Driving Force Analysis of Flash Floods in Fujian Province

 ,
,
Abstract
:1. Introduction
2. Materials and Methods
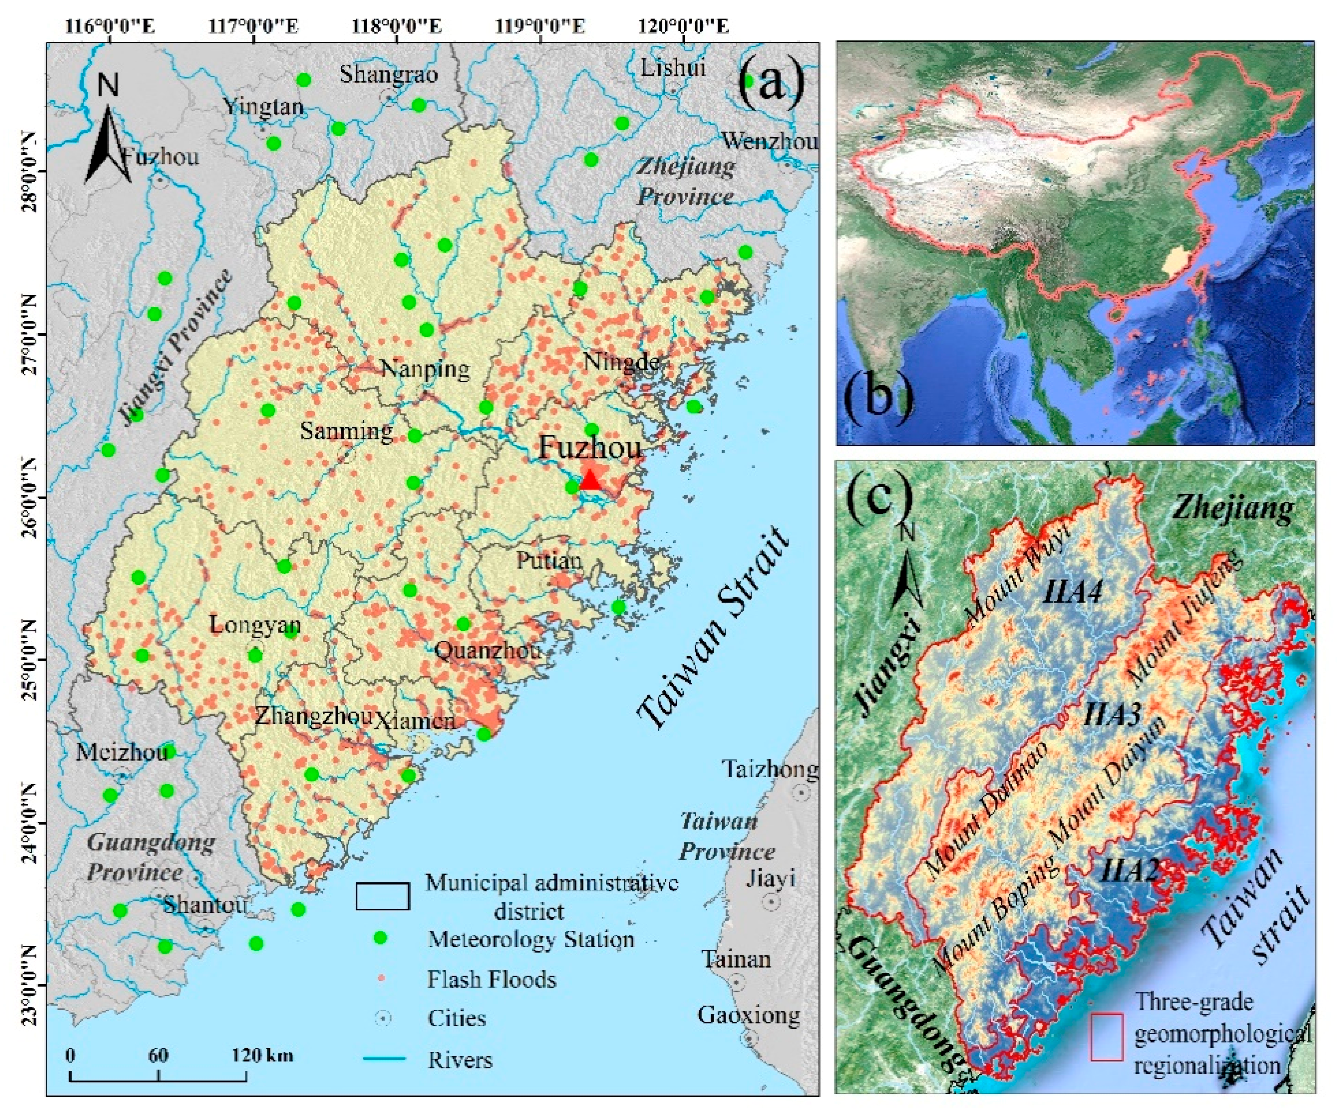
2.1. Study Area
2.2. Data
2.3. Methodology
2.3.1. Spatiotemporal Analysis
2.3.2. Driving Factor Analysis
2.3.3. Sensitivity Analysis
3. Results
3.1. Spatiotemporal Pattern of Flash Floods
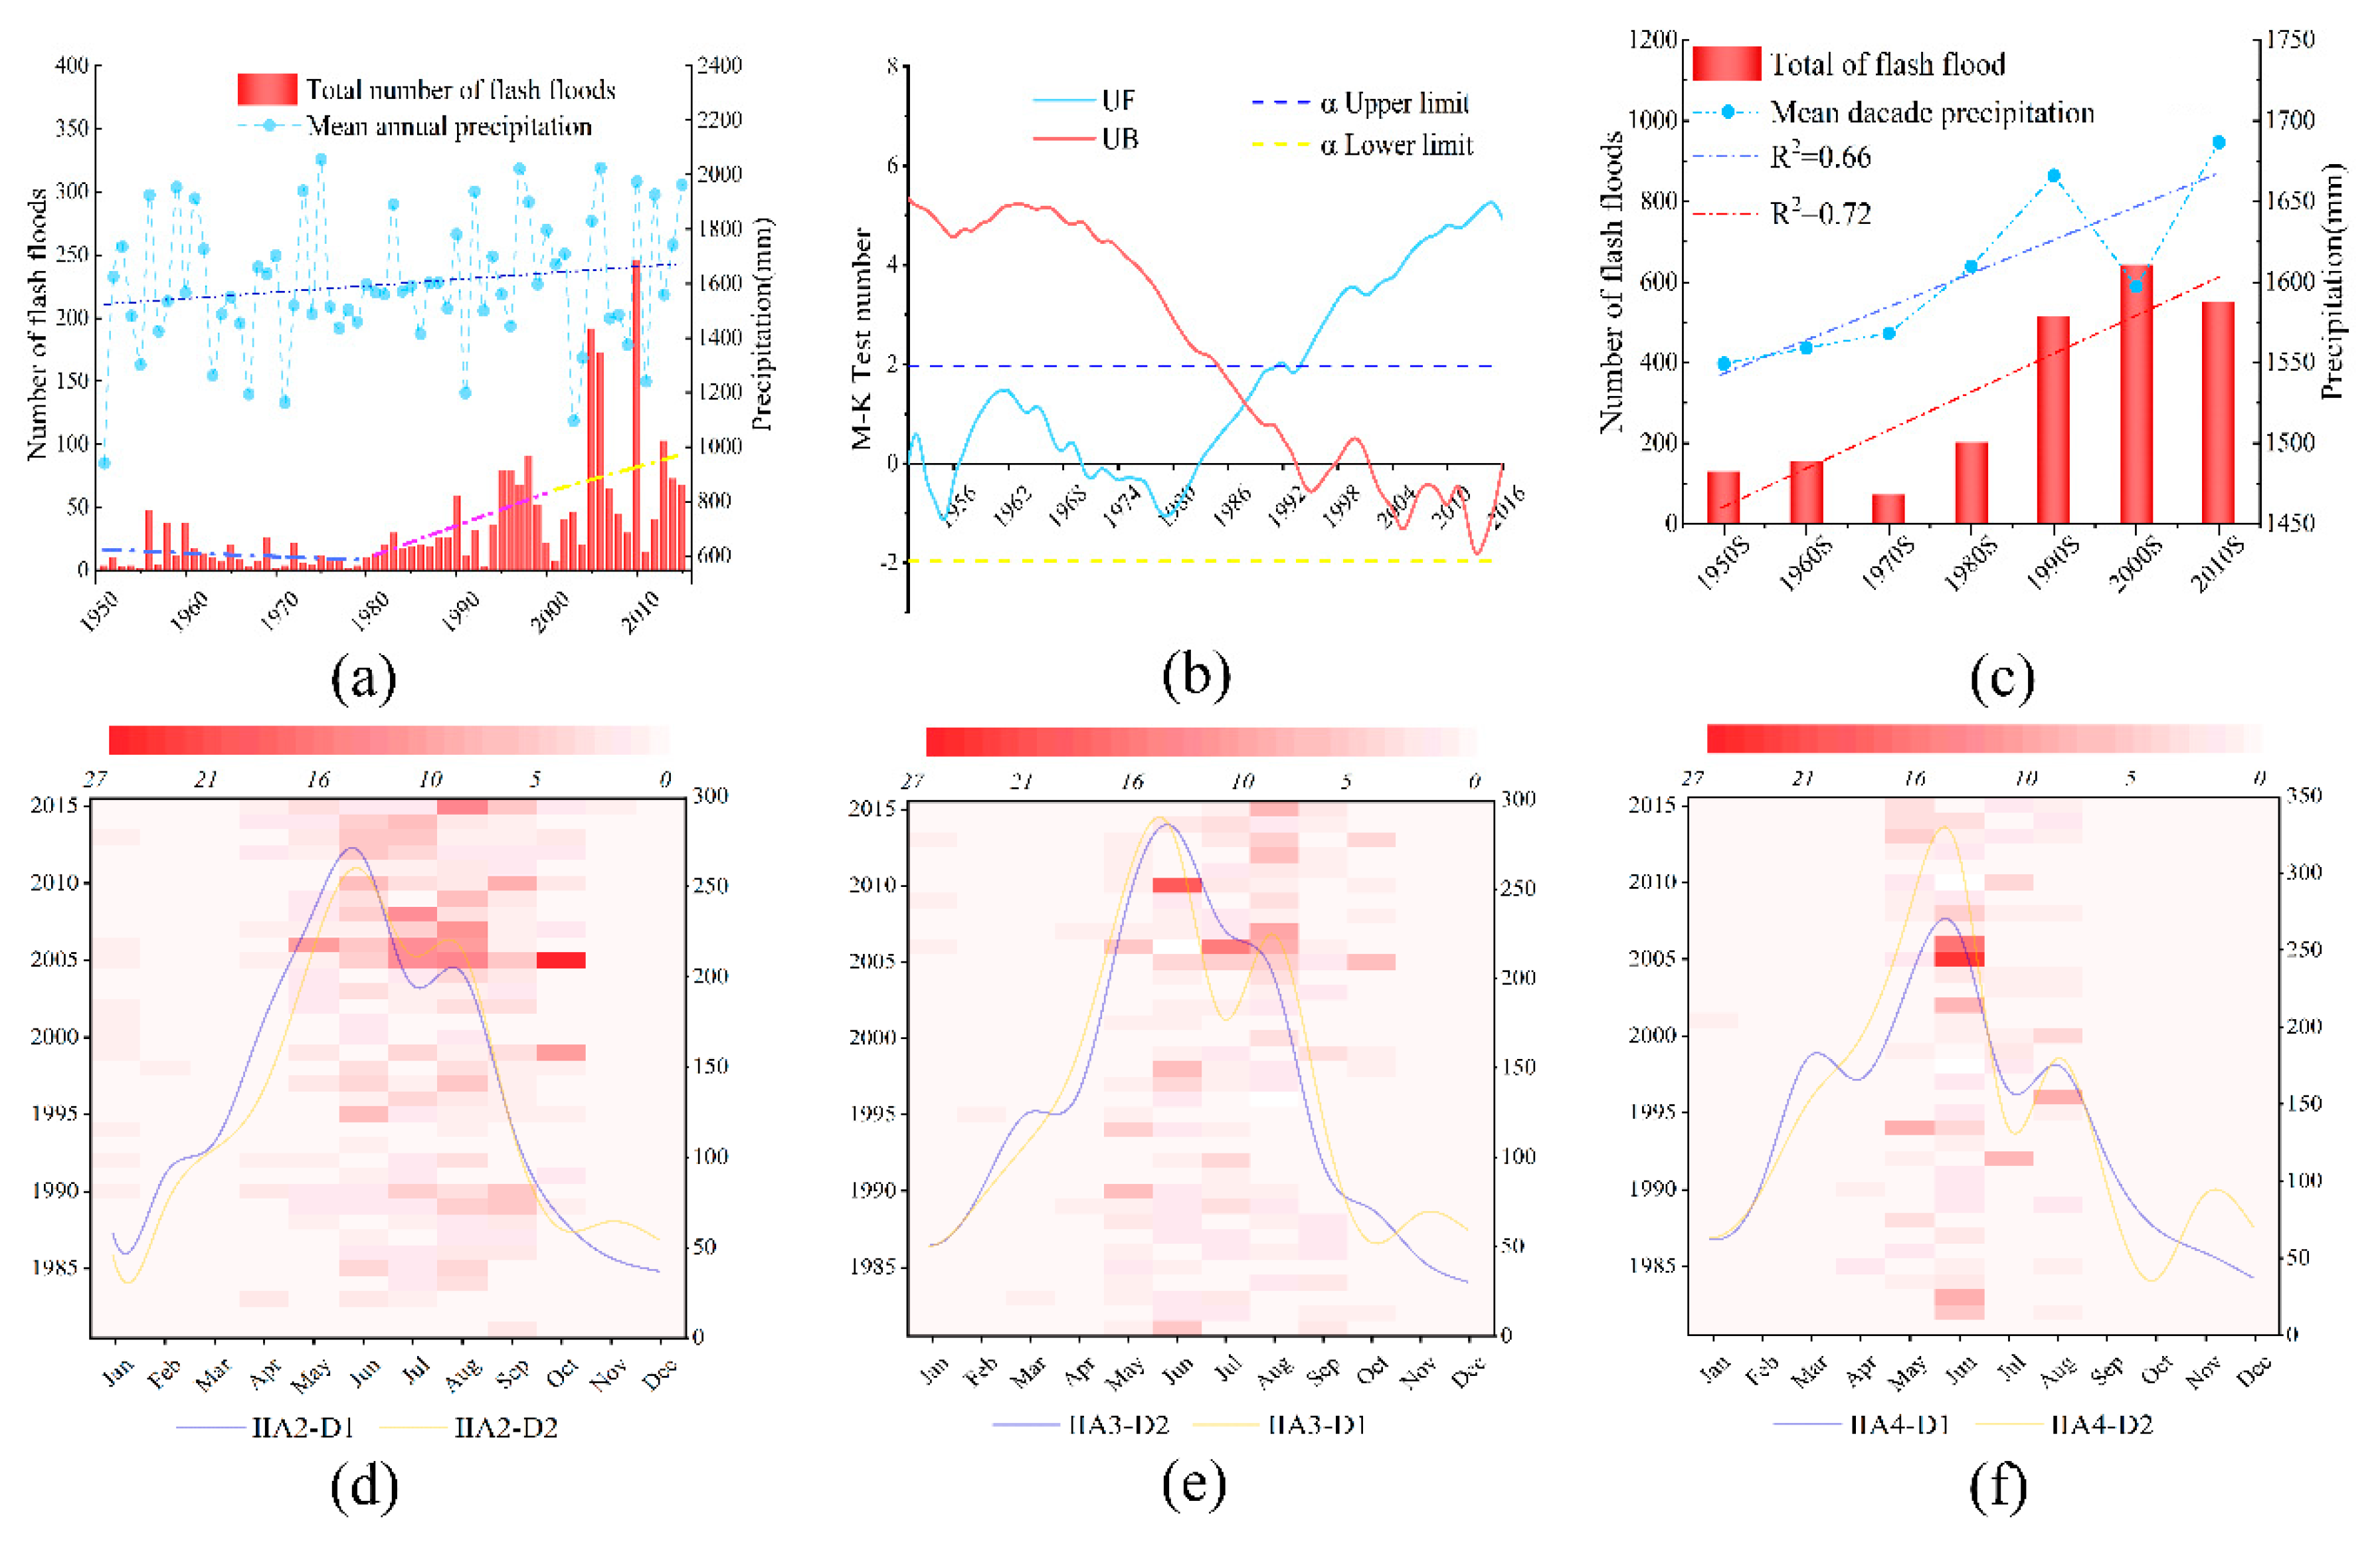
3.1.1. Temporal Change
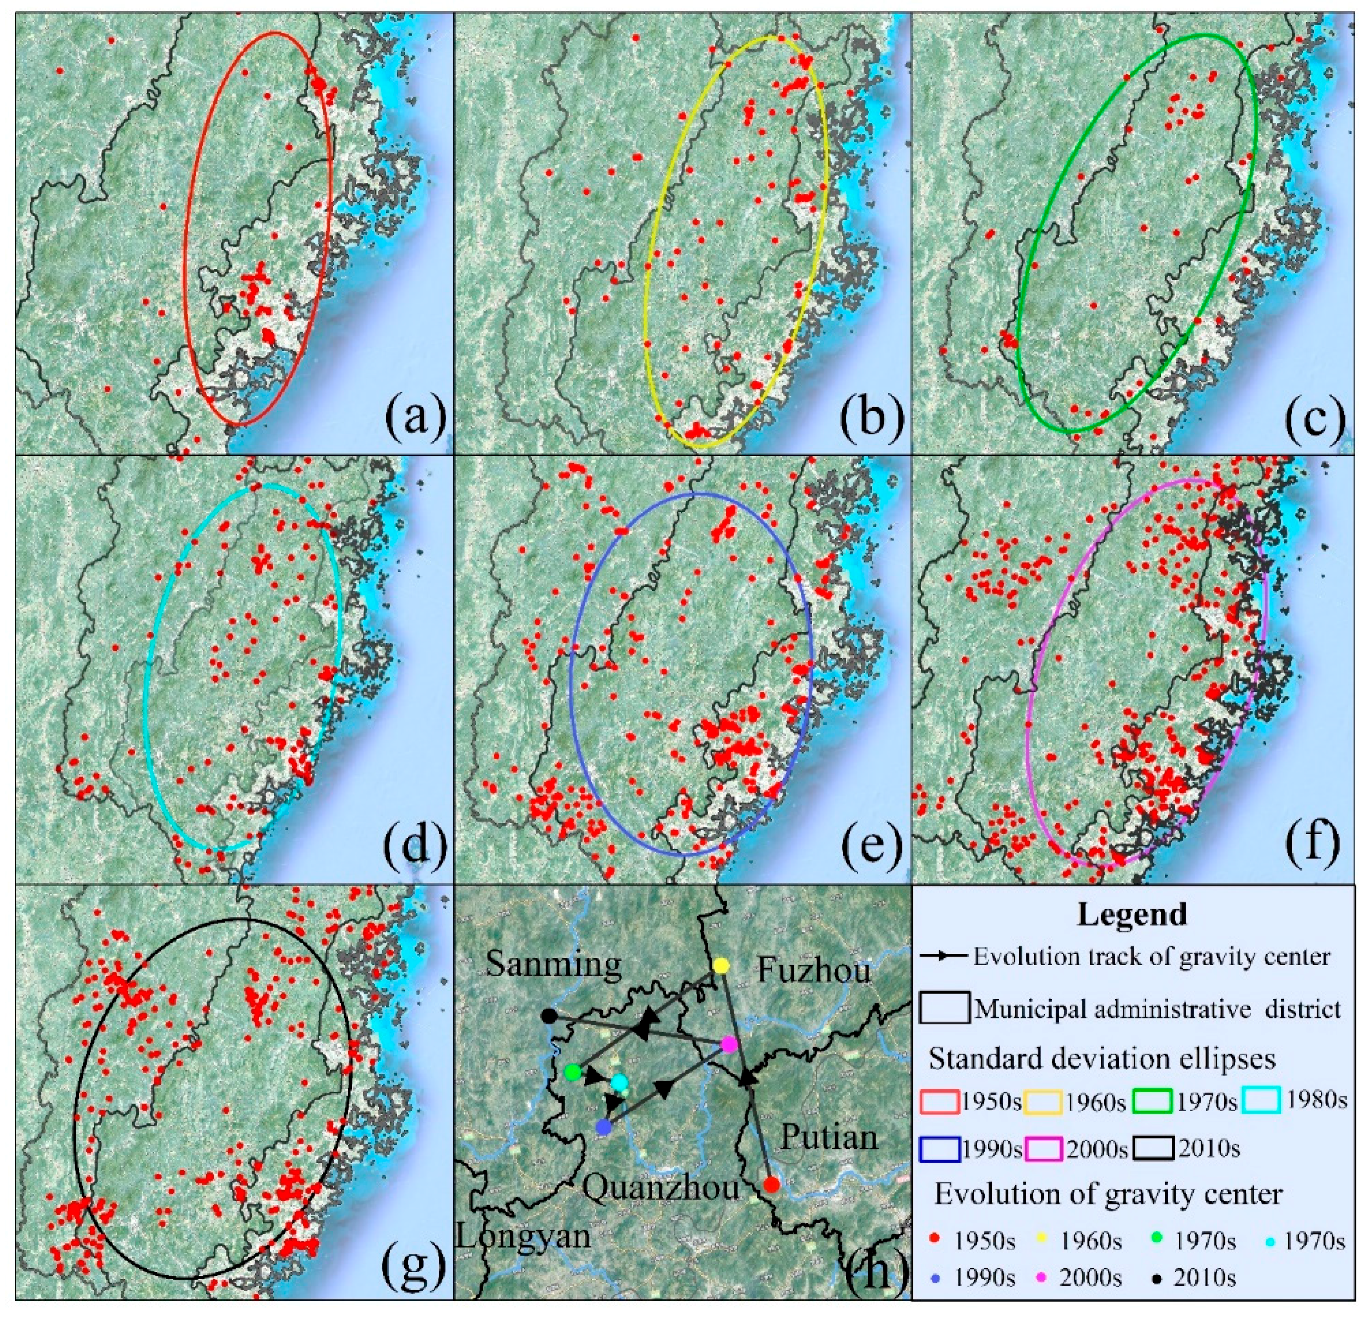
3.1.2. Spatial Change
3.2. Driving Factors of Flash Floods in Fujian Province
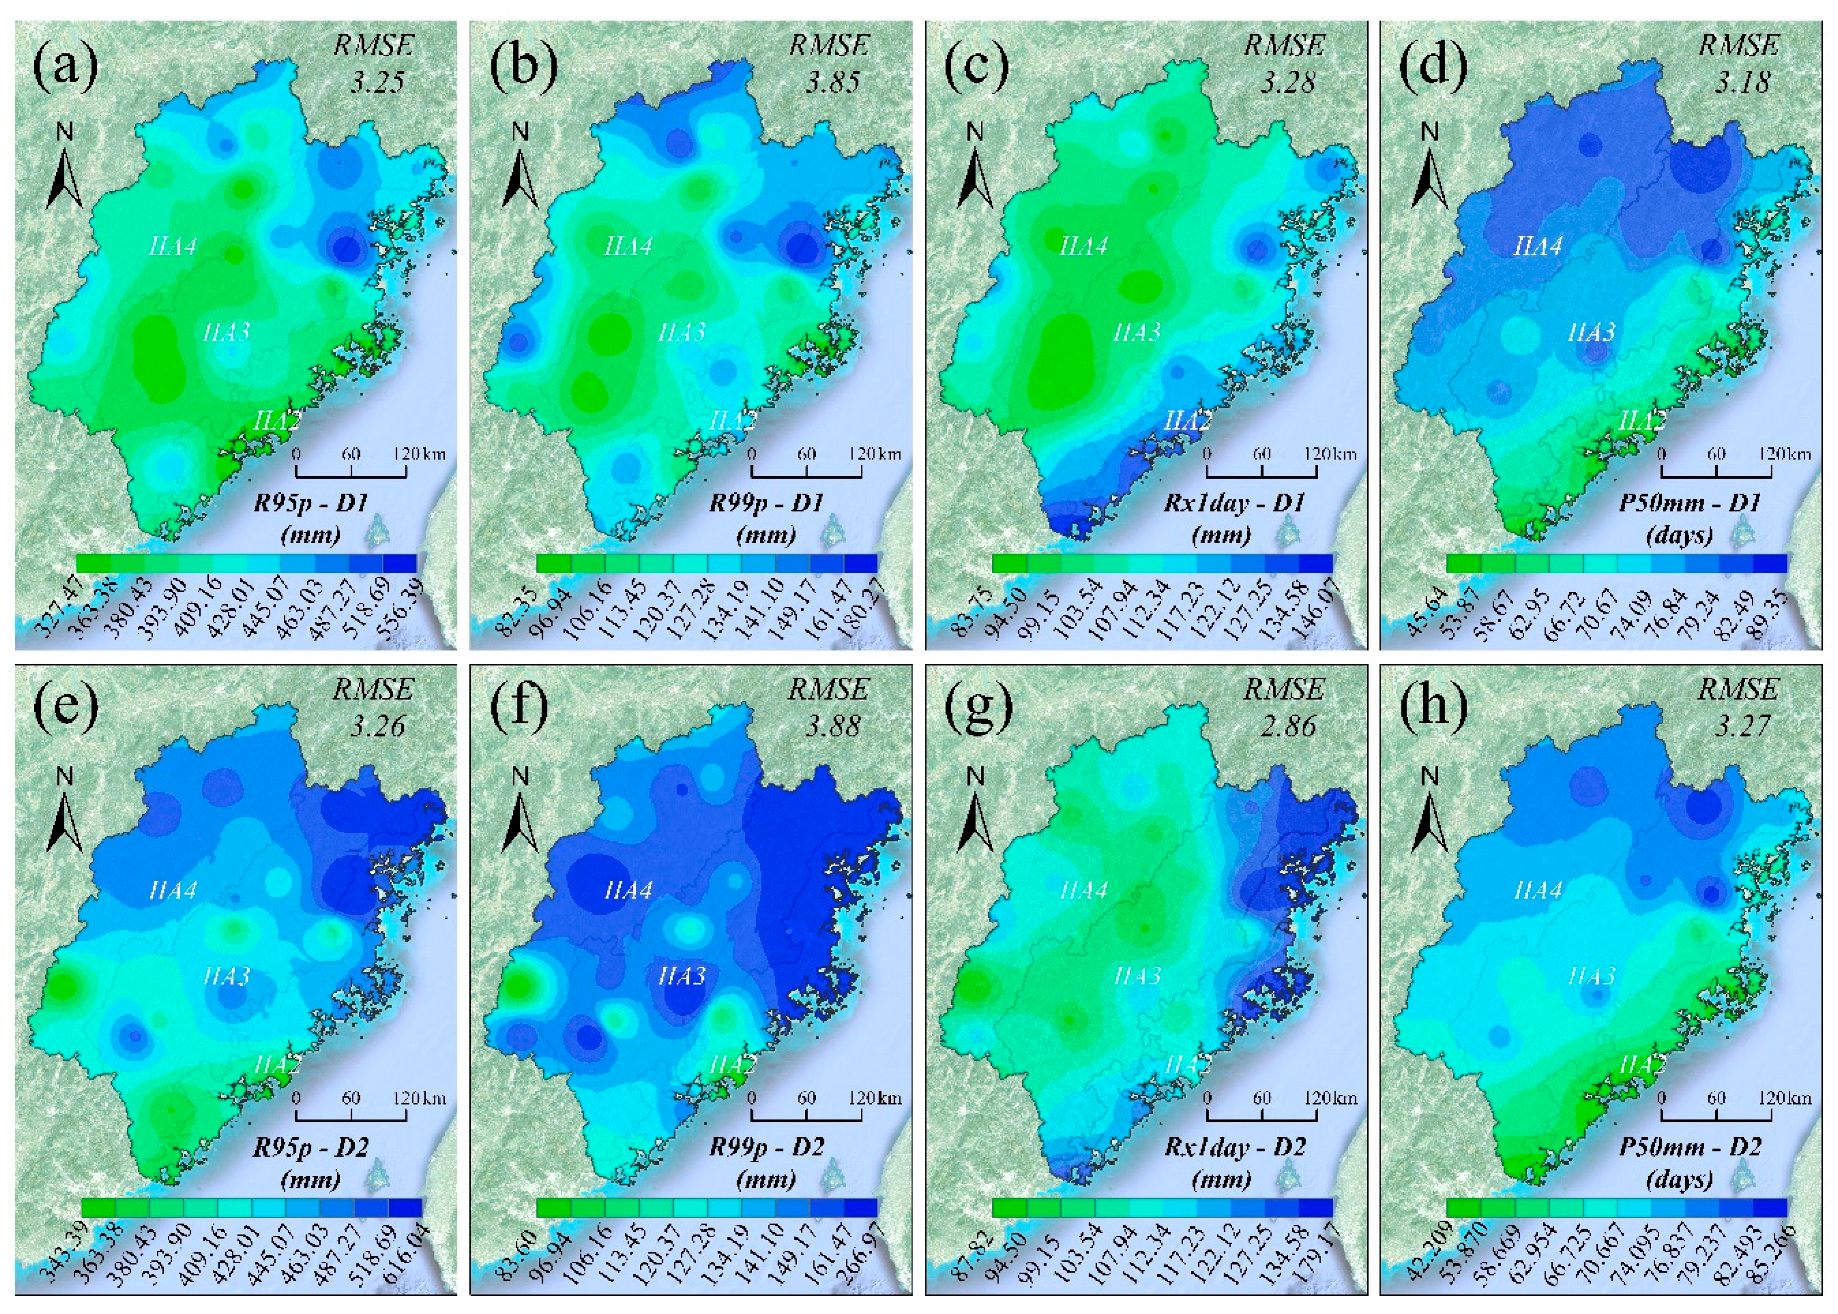
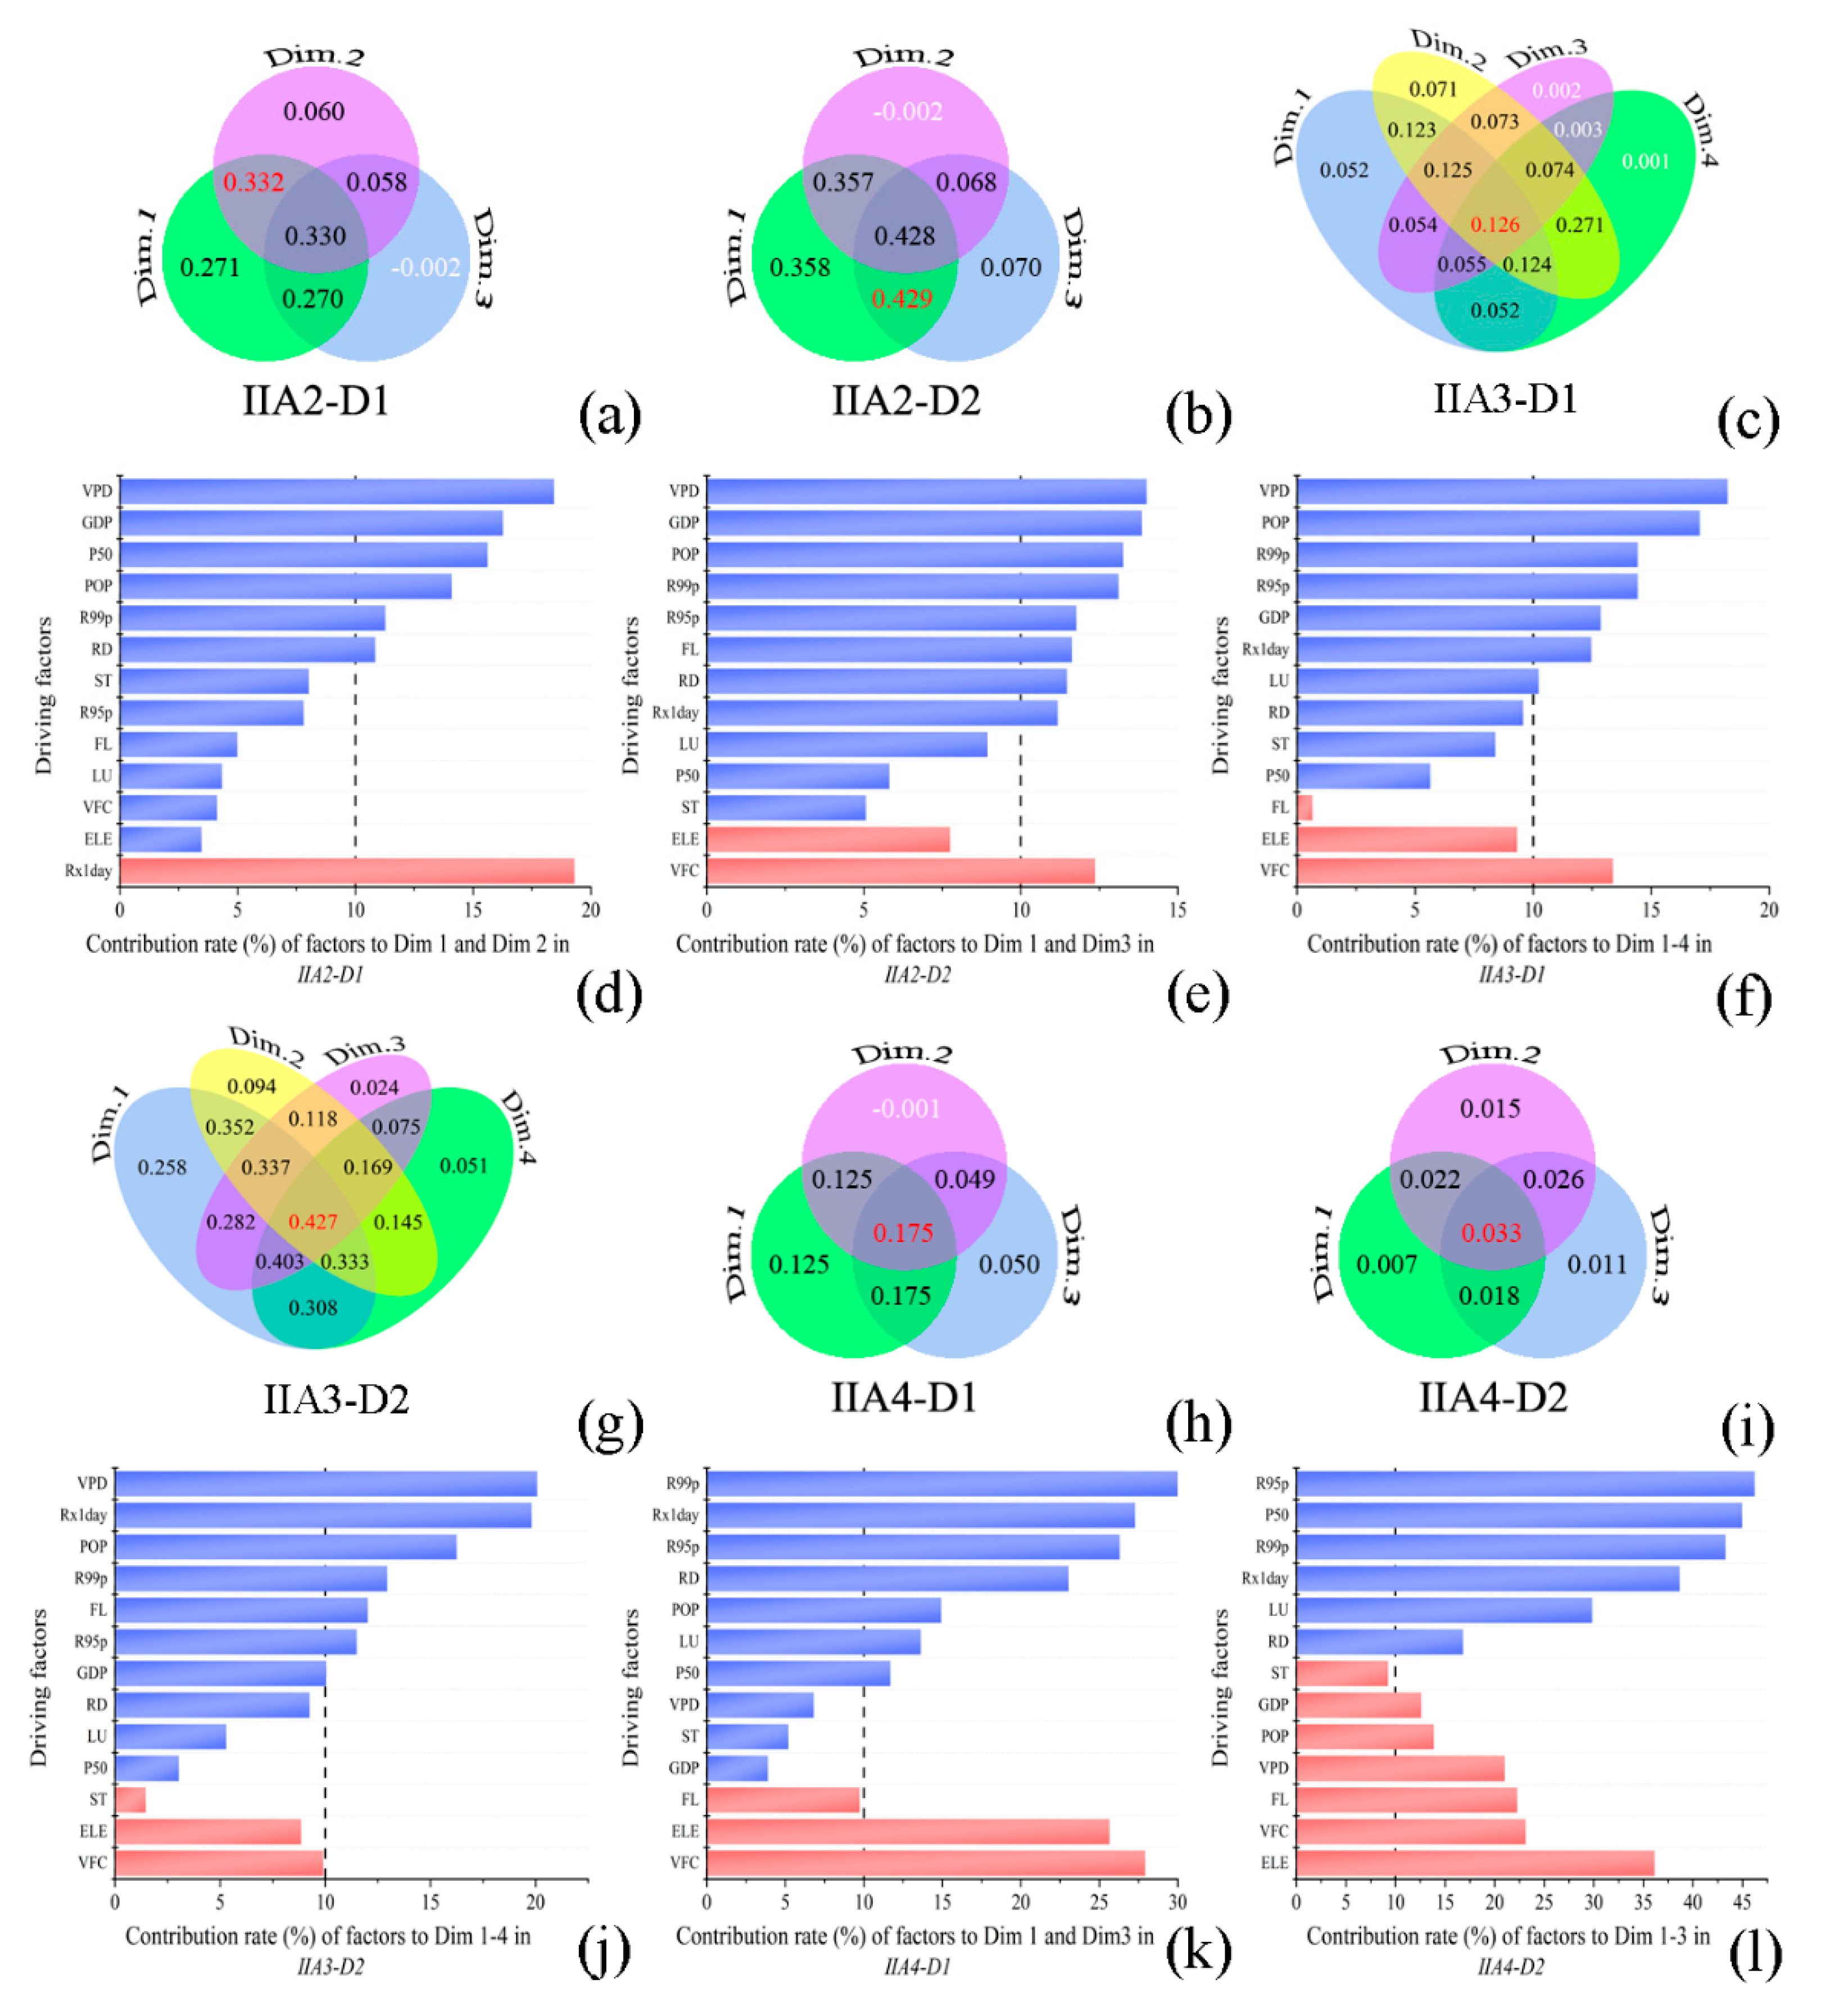
3.2.1. Distribution of the Major Driving Factors
3.2.2. Driving Factor Detection
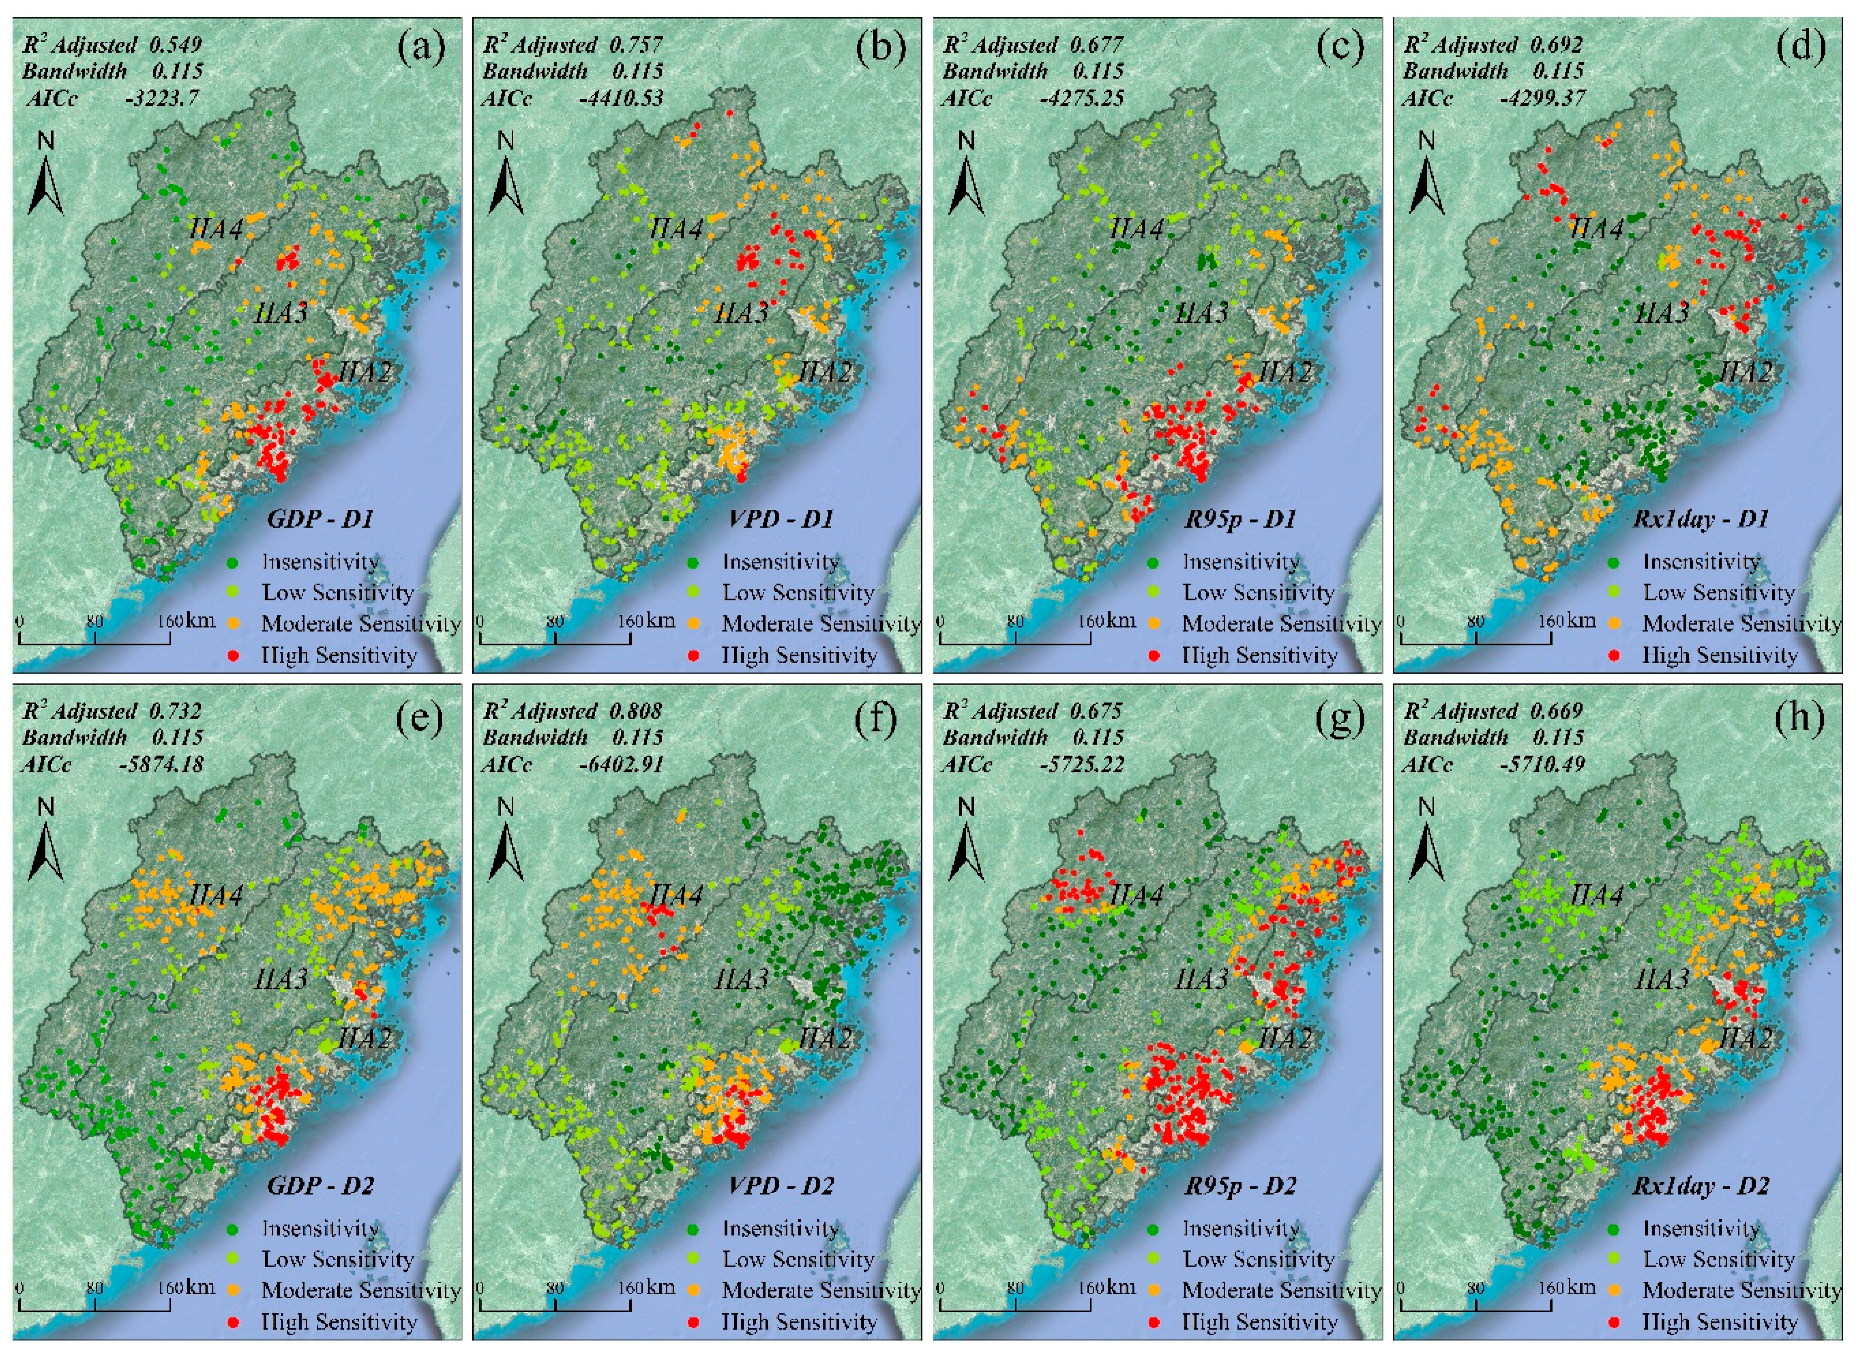
3.3. Sensitivity Analysis
4. Discussion
4.1. Spatiotemporal Patterns of Flash Floods
4.2. Driving Factors Influencing Flash Floods
4.2.1. Coastal Low Mountains, Hills, and Plain Regions of Fujian (IIA2)
4.2.2. Low-Middle Mountains, Hills, and Valley Region in Central Fujian (IIA3)
4.2.3. Low-Middle Mountains, Hills and Valley Region in Wuyi Mountains (IIA4)
4.3. Sensitivity Analysis of the Flash Floods
4.4. Limitations of the Current Study
5. Conclusions
Author Contributions
Funding
Conflicts of Interest
References
- Tang, C.; Zhu, J. A GIS Based Regional Torrent Risk Zonation. Acta Geogr. Sin. 2005, 60, 87–94. [Google Scholar]
- Guo, L.; Zhang, X.L. Achievements and Preliminary Analysis on China National Flash Flood Disasters Investigation and Evaluatio. J. Geo-Inf. Sci. 2017, 19, 1548–1556. [Google Scholar]
- Ashley, S.T.; Ashley, W.S. Flood Fatalities in the United States. J. Appl Meteorol. Climatol. 2008, 47, 805–818. [Google Scholar] [CrossRef]
- Špitalar, M.; Gourley, J.J.; Lutoff, C.; Kirstetter, P.-E.; Brilly, M.; Carr, N. Analysis of flash flood parameters and human impacts in the US from 2006 to 2012. J. Hydrol. 2014, 519, 863–870. [Google Scholar] [CrossRef]
- Li, C.-J.; Chai, Y.-Q.; Yang, Y.-S.; Li, H.-R. Spatio-temporal distribution of flood disasters and analysis of influencing factors in Africa. Nat. Hazards 2016, 82, 721–731. [Google Scholar] [CrossRef]
- Martín-Vide, J.P.; Llasat, M.C. The 1962 flash flood in the Rubí stream (Barcelona, Spain). J. Hydrol. 2018, 566, 441–454. [Google Scholar] [CrossRef]
- Liu, Y.; Yang, Y. Spatial Distribution of Major Natural Disasters of China in Historical Period. Acta Geogr. Sin. 2012, 67, 291–300. [Google Scholar]
- Xu, S.; Wang, J.; Shi, C.; Yan, J. Research of the Natural Disaster Risk on Coastal Cities. Acta Geogr. Sin. 2006, 61, 127–138. [Google Scholar]
- Guo, L.; Ding, L.; Sun, D. Key technologies and applications of flash flood disaster investigation and assessment in China. China Flood Drought Manag. 2018, 28, 7–11, 32. [Google Scholar]
- Nikolopoulos, E.I.; Destro, E.; Bhuiyan, M.A.E.; Borga, M.; Anagnostou, E.N. Evaluation of predictive models for post-fire debris flow occurrence in the western United States. Nat. Hazards Earth Syst. Sci. 2018, 18, 2331–2343. [Google Scholar] [CrossRef] [Green Version]
- Guo, L.; Liu, J.C.; Ding, L.Q. Working plan for mountain flood investigation and evaluation in China. China Water Resour. 2012, 23, 10–12. [Google Scholar]
- Zhang, Y.; Cheng, W.; Wang, N. Risk assessment of mountain flood based on GIS and Logistic regression model. China Flood Drought Manag. 2018, 28, 21–26, 30. [Google Scholar]
- Costache, R.; Pham, Q.B.; Sharifi, E.; Linh, N.T.T.; Abba, S.I.; Vojtek, M. Flash-Flood Susceptibility Assessment Using Multi-Criteria Decision Making and Machine Learning Supported by Remote Sensing and GIS Techniques. Remote Sens. 2019, 12, 106. [Google Scholar] [CrossRef] [Green Version]
- Shehata, M.; Mizunaga, H. Flash Flood Risk Assessment for Kyushu Island, Japan. Environ. Earth Sci. 2018, 77, 76. [Google Scholar] [CrossRef]
- Shehata, M.; Mizunaga, H. Geospatial analysis of surface hydrological parameters for Kyushu Island, Japan. Nat. Hazards 2019, 9, 33–52. [Google Scholar] [CrossRef]
- Xiong, J.; Li, J.; Cheng, W.; Wang, N.; Guo, L. A GIS-Based Support Vector Machine Model for Flash Flood Vulnerability Assessment and Mapping in China. ISPRS Int. J. Geo-Inf. 2019, 8, 297. [Google Scholar] [CrossRef] [Green Version]
- Varlas, G.; Anagnostou, M.N.; Spyrou, C.; Papadopoulos, A.; Kalogiros, J.; Mentzafou, A.; Michaelides, S.; Baltas, E.; Karymbalis, E.; Katsafados, P. A Multi-Platform Hydrometeorological Analysis of the Flash Flood Event of 15 November 2017 in Attica, Greece. Remote Sens. 2018, 11, 45. [Google Scholar] [CrossRef] [Green Version]
- Hoedjes, J.; Kooiman, A.; Maathuis, B.; Said, M.; Becht, R.; Limo, A.; Mumo, M.; Nduhiu-Mathenge, J.; Shaka, A.; Su, B. A Conceptual Flash Flood Early Warning System for Africa, Based on Terrestrial Microwave Links and Flash Flood Guidance. ISPRS Int. J. Geo-Inf. 2014, 3, 584–598. [Google Scholar] [CrossRef] [Green Version]
- Hoang, T.V.; Chou, T.Y.; Nguyen, N.T.; Fang, Y.M.; Yeh, M.L.; Nguyen, Q.H.; Nguyen, X.L. A Robust Early Warning System for Preventing Flash Floods in Mountainous Area in Vietnam. ISPRS Int. J. Geo-Inf. 2019, 8, 228. [Google Scholar] [CrossRef] [Green Version]
- Tyrna, B.; Assmann, A.; Fritsch, K.; Johann, G. Large-scale high-resolution pluvial flood hazard mapping using the raster-based hydrodynamic two-dimensional model FloodAreaHPC. J. Flood Risk Manag. 2018, 11, S1024–S1037. [Google Scholar] [CrossRef] [Green Version]
- Henriksen, H.J.; Roberts, M.J.; van der Keur, P.; Harjanne, A.; Egilson, D.; Alfonso, L. Participatory early warning and monitoring systems: A Nordic framework for web-based flood risk management. Int. J. Disaster Risk Reduct. 2018, 31, 1295–1306. [Google Scholar] [CrossRef]
- Gan, B.R.; Liu, X.N.; Yang, X.G. The impact of human activities on the occurrence of mountain flood hazards: Lessons from the 17 August 2015 flash flood/debris flow event in Xuyong County, south-western China. Geomat. Nat. Hazards Risk 2018, 9, 816–840. [Google Scholar] [CrossRef] [Green Version]
- Wang, Y.; Cui, P.; Wang, Z.; Liang, S. Study on the formation and characteristics of height of debris flow head. J. Hydraul. Eng. 2017, 48, 437–479. [Google Scholar]
- Papagiannaki, K.; Lagouvardos, K.; Kotroni, V.; Bezes, A. Flash flood occurrence and relation to the rainfall hazard in a highly urbanized area. Nat. Hazards Earth Syst. Sci. 2015, 15, 1859–1871. [Google Scholar] [CrossRef] [Green Version]
- Xiong, J.; Ye, C.; Cheng, W.; Guo, L.; Zhou, C.; Zhang, X. The Spatiotemporal Distribution of Flash Floods and Analysis of Partition Driving Forces in Yunnan Province. Sustainability 2019, 11, 2926. [Google Scholar] [CrossRef] [Green Version]
- Xiong, J.; Gong, Y.; Cheng, W. Temporal and Spatial Distribution Characteristics of Mountain Floods in Tibet, China in Recent 30 Years. Mt. Res. 2018, 36, 557–570. [Google Scholar]
- Djimesah, I.E.; Okine, A.N.D.; Kissi Mireku, K. Influential factors in creating warning systems towards flood disaster management in Ghana: An analysis of 2007 Northern flood. Int. J. Disaster Risk Reduct. 2018, 28, 318–326. [Google Scholar] [CrossRef]
- Xiong, J.; Zhao, Y.; Cheng, W. Temporal-spatial Distribution and the Influencing Factors of Mountain-Flood Disasters in Sichuan Province. Geo-Inf. Sci. 2018, 20, 1443–1456. [Google Scholar]
- Liu, Y.; Yuan, X.; Guo, L.; Huang, Y.; Zhang, X. Driving Force Analysis of the Temporal and Spatial Distribution of Flash Floods in Sichuan Province. Sustainability 2017, 9, 1527. [Google Scholar] [CrossRef] [Green Version]
- Wang, B.; Wang, Y. The development of economic gravity center and spatial difference of economy in Fujian from 1989 to 2008. Geogr. Res. 2011, 30, 1882–1890. [Google Scholar]
- Zhong, S.; Wang, C.; Yu, Z.; Yang, Y.; Huang, Q. Spatiotemporal Exploration and Hazard Mapping of Tropical Cyclones along the Coastline of China. Adv. Meteorol. 2018, 2018, 1–15. [Google Scholar] [CrossRef]
- Zhang, S.; Chang, T.; Wang, Y. Spatial and Seasonal Precipitation Variability in Eastern Fujian Based on Automatic Station Observation Data. Sens. Mater. 2018, 30, 525–538. [Google Scholar] [CrossRef]
- China Statistical Yearbook 2018. Available online: http://www.stats.gov.cn/tjsj/ndsj/2018/indexch.htm (accessed on 30 December 2019).
- Zhao, Z. The Relation between Basic Geomorphic Characters and Agricultural Production in Fujian. Acate Geogr. Sin. 1993, 48, 143–151. [Google Scholar]
- Zhao, Z.B. Features of Fujian’s Mountain Environment and Problems of Its Development. Acta Geogr. Sin. 1984, 39, 409–417. [Google Scholar]
- Zhou, Y.; Xiao, F.; Luo, Y.; Zhao, S. Study on Tropical Cyclone Potential Impact Index in China. Acta Geogr. Sin. 2011, 66, 367–375. [Google Scholar]
- Dong, G.; Wei, J.; Hu, G. Practice of mountain flood prevention in Fujian Province. China Water Resour. 2012, 13, 47–48. [Google Scholar]
- The National Meteorological Information of China (CMA). Available online: http://data.cma.cn/data/detail/dataCode/A.0029.0001.html (accessed on 30 December 2019).
- The Expert Team on Climate Change Detection and Indices (ETCCDI). Available online: http://cccma.seos.uvic.ca/ETCCDI/list27indices.html (accessed on 30 December 2019).
- The Geospatial Data Cloud Site, Computer Network Information Center, Chinese Academy of Sciences (GDC). Available online: http://www.gscloud.cn (accessed on 30 December 2019).
- The Data Center for Resources and Environmental Sciences, Chinese Academy of Sciences (RESDC). Available online: http://www.resdc.cn (accessed on 30 December 2019).
- Kendall, M.G.; Stuart, A. The Advanced Theory of Statistics: Design and Analysis, and time-series. J. R. Stat. Soc. Ser. A 1984, 147, 523. [Google Scholar]
- Gocic, M.; Trajkovic, S. Analysis of changes in meteorological variables using Mann-Kendall and Sen’s slope estimator statistical tests in Serbia. Glob. Planet. Chang. 2013, 100, 172–182. [Google Scholar] [CrossRef]
- Peng, Y.; Song, J.; Cui, T.; Cheng, X. Temporal–spatial variability of atmospheric and hydrological natural disasters during recent 500 years in Inner Mongolia, China. Nat. Hazards 2017, 89, 441–456. [Google Scholar] [CrossRef]
- Lefever, D.W. Measuring Geographic Concentration by Means of the Standard Deviational Ellipse. Am. J. Sociol. 1926, 32, 88–94. [Google Scholar] [CrossRef]
- Shi, Y.; Matsunaga, T.; Yamaguchi, Y.; Li, Z.; Gu, X.; Chen, X. Long-term trends and spatial patterns of satellite-retrieved PM2.5 concentrations in South and Southeast Asia from 1999 to 2014. Sci Total Environ. 2018, 615, 177–186. [Google Scholar] [CrossRef] [PubMed]
- Shrestha, A.B.; Bajracharya, S.R.; Sharma, A.R.; Duo, C.; Kulkarni, A. Observed trends and changes in daily temperature and precipitation extremes over the Koshi river basin 1975–2010. Int. J. Climatol. 2017, 37, 1066–1083. [Google Scholar] [CrossRef] [Green Version]
- Jiang, J.; Mo, D.; Lu, J.; Liao, Y.; Lu, P.; Ren, X. Holocene geomorphic evolution of Taiyuan Basin in Shanxi Province and its influence on ancient human settlement distribution. J. Palaeogr. 2016, 18, 895. [Google Scholar]
- Lu, H. Progress in geomorphology and future study: A brief review. Prog. Geogr. 2018, 37, 8–15. [Google Scholar]
- Shafapour Tehrany, M.; Pradhan, B.; Jebur, M.N. Spatial prediction of flood susceptible areas using rule based decision tree (DT) and a novel ensemble bivariate and multivariate statistical models in GIS. J. Hydrol. 2013, 504, 69–79. [Google Scholar] [CrossRef]
- Wang, Z.; Lai, C.; Chen, X.; Yang, B.; Zhao, S.W.; Bai, X.Y. Flood Hazard Risk Assessment Model Based on Random Forest. J. Hydrol. 2015, 527, 1130–1140. [Google Scholar] [CrossRef]
- Cosby, B.J.; Hornberger, G.M.; Clapp, R.B.; Ginn, T.R. A statistical exploration of the relationships of soil moisture characteristics to the physical properties of soils. Water Resour. Res. 1984, 20, 682–690. [Google Scholar] [CrossRef] [Green Version]
- Cheng, W.; Zhou, C.; Li, B.; Shen, Y. Geomorphological Regionalization Theory System and Division Methodology of China. Acta Geogr. Sin. 2019, 74, 839. [Google Scholar]
- Wang, J.F.; Xu, C.D. Geodetector: Principle and prospective. Acate Geogr. Sin. 2017, 72, 116–134. [Google Scholar]
- Wang, J.F.; Li, X.H.; Christakos, G.; Liao, Y.L.; Zhang, T.; Gu, X.; Zheng, X.Y. Geographical Detectors-Based Health Risk Assessment and its Application in the Neural Tube Defects Study of the Heshun Region, China. Int. J. Geogr. Inf. Sci. 2010, 24, 107–127. [Google Scholar] [CrossRef]
- Qiao, P.; Yang, S.; Lei, M.; Chen, T.; Dong, N. Quantitative analysis of the factors influencing spatial distribution of soil heavy metals based on geographical detector. Sci. Total Environ. 2019, 664, 392–413. [Google Scholar] [CrossRef] [PubMed]
- Abdi, H.; Williams, L.J. Principal component analysis. Wiley Interdiscip. Rev. Comput. Stat. 2010, 2, 433–459. [Google Scholar] [CrossRef]
- Uyanık, G.K.; Güler, N. A Study on Multiple Linear Regression Analysis. Procedia Soc. Behav. Sci. 2013, 106, 234–240. [Google Scholar] [CrossRef] [Green Version]
- Huang, B.; Wu, B.; Barry, M. Geographically and temporally weighted regression for modeling spatio-temporal variation in house prices. Int. J. Geogr. Inf. Sci. 2010, 24, 383–401. [Google Scholar] [CrossRef]
- Xu, C.D.; Xiao, G.X.; Li, J.M.; Cao, H.X. Spatiotemporal patterns and risk factors concerning hepatitis B virus infections in the Beijing-Tianjin-Hebei area of China. Epidemiol. Infect. 2019, 147, 1–8. [Google Scholar] [CrossRef] [Green Version]
- Du, Z.; Wu, S.; Zhang, F.; Liu, R.; Zhou, Y. Extending geographically and temporally weighted regression to account for both spatiotemporal heterogeneity and seasonal variations in coastal seas. Ecol. Inform. 2018, 43, 185–199. [Google Scholar] [CrossRef]
- Zhang, X.; Huang, B.; Zhu, S. Spatiotemporal Influence of Urban Environment on Taxi Ridership Using Geographically and Temporally Weighted Regression. ISPRS Int. J. Geo-Inf. 2019, 8, 23. [Google Scholar] [CrossRef] [Green Version]
- Stott, P.A.; Gillett, N.P.; Hegerl, G.C.; Karoly, D.J.; Stone, D.A.; Zhang, X.; Zwiers, F. Detection and attribution of climate change: A regional perspective. Wiley Interdiscip. Rev. Clim. Chang. 2010, 1, 192–211. [Google Scholar] [CrossRef]
- Cortès, M.; Turco, M.; Llasat-Botija, M.; Llasat, M.C. The relationship between precipitation and insurance data for floods in a Mediterranean region (northeast Spain). Nat. Hazards Earth Syst. Sci. 2018, 18, 857–868. [Google Scholar] [CrossRef] [Green Version]
- Hou, J.; Guo, K.; Liu, F.; Han, H.; Liang, Q.; Tong, Y.; Li, P. Assessing Slope Forest Effect on Flood Process Caused by a Short-Duration Storm in a Small Catchment. Water 2018, 10, 1256. [Google Scholar] [CrossRef] [Green Version]
- Zhang, H.; Sun, J.; Xiong, J. Spatial-Temporal Patterns and Controls of Evapotranspiration across the Tibetan Plateau (2000–2012). Adv. Meteorol. 2017, 2017, 1–12. [Google Scholar] [CrossRef] [Green Version]
- Xiong, J.; Yong, Z.; Wang, Z.; Cheng, W.; Li, Y.; Zhang, H.; Ye, C.; Yang, Y. Spatial and Temporal Patterns of the Extreme Precipitation across the Tibetan Plateau (1986–2015). Water 2019, 11, 1453. [Google Scholar] [CrossRef] [Green Version]
- Gao, L.; Huang, J.; Chen, X.; Chen, Y.; Liu, M. Risk of Extreme Precipitation under Nonstationarity Conditions during the Second Flood Season in the Southeastern Coastal Region of China. J. Hydrometeorol. 2017, 18, 669–681. [Google Scholar] [CrossRef]
- Yin, J.; Gentine, P.; Zhou, S.; Sullivan, S.C.; Wang, R.; Zhang, Y.; Guo, S. Large increase in global storm runoff extremes driven by climate and anthropogenic changes. Nat. Commun. 2018, 9, 4389–4398. [Google Scholar] [CrossRef] [PubMed] [Green Version]
- Roa-García, M.C.; Brown, S.; Schreier, H.; Lavkulich, L.M. The role of land use and soils in regulating water flow in small headwater catchments of the Andes. Water Resour. Res. 2011, 47, 5–16. [Google Scholar] [CrossRef]
- Chen, S.; Zha, X. Effects of the ENSO on rainfall erosivity in the Fujian Province of southeast China. Sci. Total Environ. 2018, 621, 1378–1388. [Google Scholar] [CrossRef] [PubMed]
- Xiao, Z.H. Forty Years of Reform and Opening-up and the Great Flow of Population in China. Popul. Soc. 2019, 35, 30–38. [Google Scholar]
- Lean, J.; Warrilow, D.A. Simulation of The Regionl Climatic Impact of Amazon Deforestation. Nature 1989, 342, 411–413. [Google Scholar] [CrossRef]
- Huang, Y.; Duan, Y.; Yu, H. A Study of the Impact of Terrain on the Precipitation of “KROSA”. Meteorol. Mon. 2009, 35, 3–10. [Google Scholar]
- Pang, M.; Si, G. Influence of The Regional Scale Topography on The Climatalogical Distribution of Precipitation. J. Trop. Meteorol. 1993, 9, 370–374. [Google Scholar]
- Xue, D.; Lu, J.; Ruby, L.L.; Zhang, Y. Response of the Hydrological Cycle in Asian Monsoon Systems to Global Warming Through the Lens of Water Vapor Wave Activity Analysis. Geophys. Res. Lett. 2018, 45, 904–912. [Google Scholar] [CrossRef]
- King, A.D.; Donat, M.G.; Fischer, E.M.; Hawkins, E.; Alexander, L.V.; Karoly, D.J.; Dittus, A.J.; Lewis, S.C.; Perkins, S.E. The timing of anthropogenic emergence in simulated climate extremes. Environ. Res. Lett. 2015, 10, 1–9. [Google Scholar] [CrossRef]
- Fu, Y. Industrial transfer trend in the eastern coastal areas: Based on the investigation of Zhejiang. Economist 2011, 10, 84–90. [Google Scholar]
- Yun, Y.; Shi, P.; Liu, Y. Impact of Land Use Chang on Urban Flood. J. Nat. Disasters 2003, 12, 6–13. [Google Scholar]
- Mao, H.; Yan, X.; Xiong, Z. An Overview of Impacts of Land Use Change on Climate. Clim. Environ. Res. 2011, 16, 513–524. [Google Scholar]
- Shen, X.; Shou, S.; Xu, Z. Numerical Simulation and Analysis of Influence of Complex Topography on a Fujian Rainstorm. J. Nanjing Inst. Meteorol. 2008, 31, 546–5544. [Google Scholar]
- Tang, W.; Zhou, T.; Sun, J.; Li, Y.; Li, W. Accelerated Urban Expansion in Lhasa City and the Implications for Sustainable Development in a Plateau City. Sustainability 2017, 9, 1499. [Google Scholar] [CrossRef] [Green Version]
- Qiu, W.; Ren, F.; Wu, L.; Chen, L.; Ding, C. Characteristics of tropical cyclone extreme precipitation and its preliminary causes in Southeast China. Meteorol. Atmos. Phys. 2018, 131, 613–626. [Google Scholar] [CrossRef]
- Liu, Y.; Yang, Z.; Huang, Y.; Liu, C. Spatiotemporal evolution and driving factors of China’s flash flood disasters since 1949. Sci. China Earth Sci. 2018, 61, 1804–1817. [Google Scholar] [CrossRef]
- Du, S.; Cheng, X.; Huang, Q.; Chen, R.; Ward, P.J.; Aerts, J.C.J.H. Brief communication: Rethinking the 1998 China floods to prepare for a nonstationary future. Nat. Hazards Earth Syst. Sci. 2019, 19, 715–719. [Google Scholar] [CrossRef] [Green Version]
- Shi, T.; Xu, H.; Wang, S.; Fang, C.; Lin, Z.; Wang, M.; Tang, F. Remote Sensing Study of Coastline Dynamics of Quanzhou Port:Starting Point of the Ancient Maritime Silk Road. J. Geo-Inf. Sci. 2017, 19, 407–416. [Google Scholar]
- Huang, X.; Huang, M. Relationship between sustainable urban development and economic growth based on emergy analysis: A case study of Quanzhou City. Prog. Geogr. 2015, 34, 38–47. [Google Scholar]
- Bawa, K.S.; Dayanandan, S. Socioeconomic factors and tropical deforestation. Nature 1997, 386, 562–563. [Google Scholar] [CrossRef]
- Yi, Q. A Study on Path of Transformation and Upgrade of Fujian’s Outward Economy. Asia-Pac. Econ. Rev. 2012, 2, 120–128. [Google Scholar]


| Parameters | Scale or Resolution | Time | Date Sources |
|---|---|---|---|
| Flash floods | 1:50,000 | 1951–2015 | NFFIEP |
| Small watershed | 1:50,000 | 2014 | NFFIEP |
| Population density | 1 km × 1 km | 1990, 1995, 2000, 2005, 2010, 2015 | RESDC |
| GDP density | 1 km × 1 km | 1990, 1995, 2000, 2005, 2010, 2015 | RESDC |
| Village point | 1:50,000 | 2014 | NFFIEP |
| Road density | 1:50,000 | 2014 | NFFIEP |
| Daily precipitation | — | 1951–2015 | CMA |
| Vegetation fractional cover | 1 km × 1 km | 1995, 2000, 2005, 2010, 2015 | RESDC |
| DEM | 3 0m × 30 m | 2009 | GDC |
| Land use | 1 km × 1 km | 1995, 2010 | RESDC |
| Soil type | 1 km × 1 km | 2010 | RESDC |
| Formation lithology | 1:500,000 | 2013 | RESDC |
| Land Use Types | Forest | Shrub | Herbaceous | Sparse Vegetation | Cropland |
| Runoff Coefficients | 0.15 | 0.18 | 0.2 | 0.45 | 0.6 |
| Land Use Types | Mangrove | Wetland | Bare area | Urban | Water |
| Runoff Coefficients | 0.4 | 0.5 | 0.7 | 0.9 | 1 |
| Soil Texture Types | Silty-Clay-Loam | Heavy-Clay-Loam | Clay-Loam | Silt-Loam | Sandy-Clay |
| Codes | 1 | 2 | 3 | 4 | 5 |
| Soil Texture Types | Loamy-clay | Loam | Sandy-clay-loam | Sandy/loamy sand | Water |
| Codes | 6 | 7 | 8 | 9 | 10 |
| Coefficients | Sensitivity Level | Description |
|---|---|---|
| Coe ≤ 0 | Insensitive | This indicates that the changes in the flash floods and driving factors did not have any synchronized characteristics. |
| 0 < Coe ≤ 0.04 | Low Sensitivity | This indicates that the flash floods had low sensitivity to the variation of the driving factors. |
| 0.04 < Coe ≤ 0.05 | Moderate Sensitivity | This indicates that flash floods had moderate sensitivity to the variation of the driving factors. |
| Coe ≥ 0.05 | High Sensitivity | This indicates that flash floods had high sensitivity to the variation of the driving factors. |
| Factor Type | Factors | IIA2 | IIA3 | IIA4 | |||
|---|---|---|---|---|---|---|---|
| D1 | D2 | D1 | D2 | D1 | D2 | ||
| Human Activities | VPD | 0.318 | 0.424 | 0.106 | 0.337 | 0.073 | 0.138 |
| RD | 0.190 | 0.184 | 0.061 | 0.017 ** | 0.032 * | 0.046 | |
| POP | 0.293 | 0.182 | 0.100 | 0.211 | 0.171 | 0.118 | |
| GDP | 0.244 | 0.246 | 0.117 | 0.144 | 0.239 | 0.162 | |
| Rainfall | R95p | 0.342 | 0.222 | 0.197 | 0.304 | 0.232 | 0.285 |
| R99p | 0.483 | 0.396 | 0.181 | 0.304 | 0.190 | 0.193 | |
| Rx1day | 0.041 ** | 0.394 | 0.152 | 0.344 | 0.238 | 0.281 | |
| P50 | 0.213 | 0.190 | 0.208 | 0.261 | 0.179 | 0.285 | |
| Surface Environment | VFC | 0.113 | 0.096 | 0.070 | 0.038 | 0.020 ** | 0.006 ** |
| LU | 0.085 | 0.032 ** | 0.016 ** | 0.016 * | 0.020 ** | 0.013 ** | |
| ST | 0.084 | 0.049 ** | 0.026 ** | 0.009 ** | 0.036 * | 0.017 ** | |
| ELE | 0.078 | 0.036 ** | 0.049 | 0.024 | 0.079 | 0.023 ** | |
| FL | 0.050 ** | 0.061 ** | 0.041 ** | 0.067 | 0.091 | 0.080 | |
© 2020 by the authors. Licensee MDPI, Basel, Switzerland. This article is an open access article distributed under the terms and conditions of the Creative Commons Attribution (CC BY) license (http://creativecommons.org/licenses/by/4.0/).
Share and Cite
Xiong, J.; Pang, Q.; Fan, C.; Cheng, W.; Ye, C.; Zhao, Y.; He, Y.; Cao, Y. Spatiotemporal Characteristics and Driving Force Analysis of Flash Floods in Fujian Province. ISPRS Int. J. Geo-Inf. 2020, 9, 133. https://0-doi-org.brum.beds.ac.uk/10.3390/ijgi9020133
Xiong J, Pang Q, Fan C, Cheng W, Ye C, Zhao Y, He Y, Cao Y. Spatiotemporal Characteristics and Driving Force Analysis of Flash Floods in Fujian Province. ISPRS International Journal of Geo-Information. 2020; 9(2):133. https://0-doi-org.brum.beds.ac.uk/10.3390/ijgi9020133
Chicago/Turabian StyleXiong, Junnan, Quan Pang, Chunkun Fan, Weiming Cheng, Chongchong Ye, Yunliang Zhao, Yuanrong He, and Yifan Cao. 2020. "Spatiotemporal Characteristics and Driving Force Analysis of Flash Floods in Fujian Province" ISPRS International Journal of Geo-Information 9, no. 2: 133. https://0-doi-org.brum.beds.ac.uk/10.3390/ijgi9020133