Making Smart Cities Resilient to Climate Change by Mitigating Natural Hazard Impacts


1
ATHENA Research & Innovation Information Technologies, Artemidos 6 & Epidavrou, 15125 Marousi, Athens, Greece
2
Faculty of Geology and Geoenvironment, National and Kapodistrian University of Athens, Panepistimiopolis, 15784 Ilissia, Athens, Greece
*
Author to whom correspondence should be addressed.
ISPRS Int. J. Geo-Inf. 2020, 9(3), 153; https://0-doi-org.brum.beds.ac.uk/10.3390/ijgi9030153
Submission received: 29 February 2020
/
Accepted: 4 March 2020
/
Published: 8 March 2020
(This article belongs to the Special Issue Enhanced Modeling and Surveying Tools for Smart Cities)
Abstract
:Climate change is undoubtedly a big issue due to its devastating consequences. The enhanced resilience to natural hazards due to climate change belongs to the concept of smart cities. This Editorial proposes different uses of Geographic Information Systems to handle and disseminate data for natural disasters. Data are gathered from various data sources and are processed and visualized in maps using apps. These apps are available through the Internet or mobile devices and can be used to inform and train the stakeholders of disaster-prone areas in order to mitigate the impacts of disasters.
1. Introduction
The Earth is a dynamic planet in which long-term natural processes take place that affect its surface and the contact of the hydrosphere, biosphere and atmosphere. Natural disasters are usually instantaneous manifestations of these processes which affect human activities.
On a global scale, people are moving from rural to urban centers. About 54% of people worldwide live in cities, and it is estimated that, by 2030, 60% of people globally will live in cities with at least half a million inhabitants [1]. This overpopulation of cities has led to the environmental degradation both of the urban and the physical environment around them. Climate change will have a significant impact on cities and their sustainable development. For example, two events recently occurred in Attica, Greece: (a) the first one happened in 2017, in Mandra, and it was the third largest flood disaster event in the wider area around Athens basin after 1961 and 1977, leading to the death of people, flooding and damage to infrastructures, homes and shops; (b) the second one was the forest fire in Mati, in 2018, where 102 people lost their lives and hundreds of properties were burned. Recently, extensive fires in Australia raged uncontrollably for nearly three months and threatened the city of Sydney. The same occurred in California, with the occurrence of 14 of the 20 most destructive fires in the state’s history.
2. City Resilience against Natural Hazards
Technology has enabled innovative systems to be developed that can help or even ensure proper environmental management concerning both man-made activities and natural phenomena. A city must have full knowledge of its area characteristics, and GIS provides a platform that manages, processes and analyzes geographic and descriptive information of all available data. So, through data management, analysis and processing tools, the factors that favor the occurrence of a phenomenon can be selected and calibrated according to their risk for a particular area. Then, utilizing risk assessment models, the area of a city can be distinguished according to the risk posed by a particular hazard.
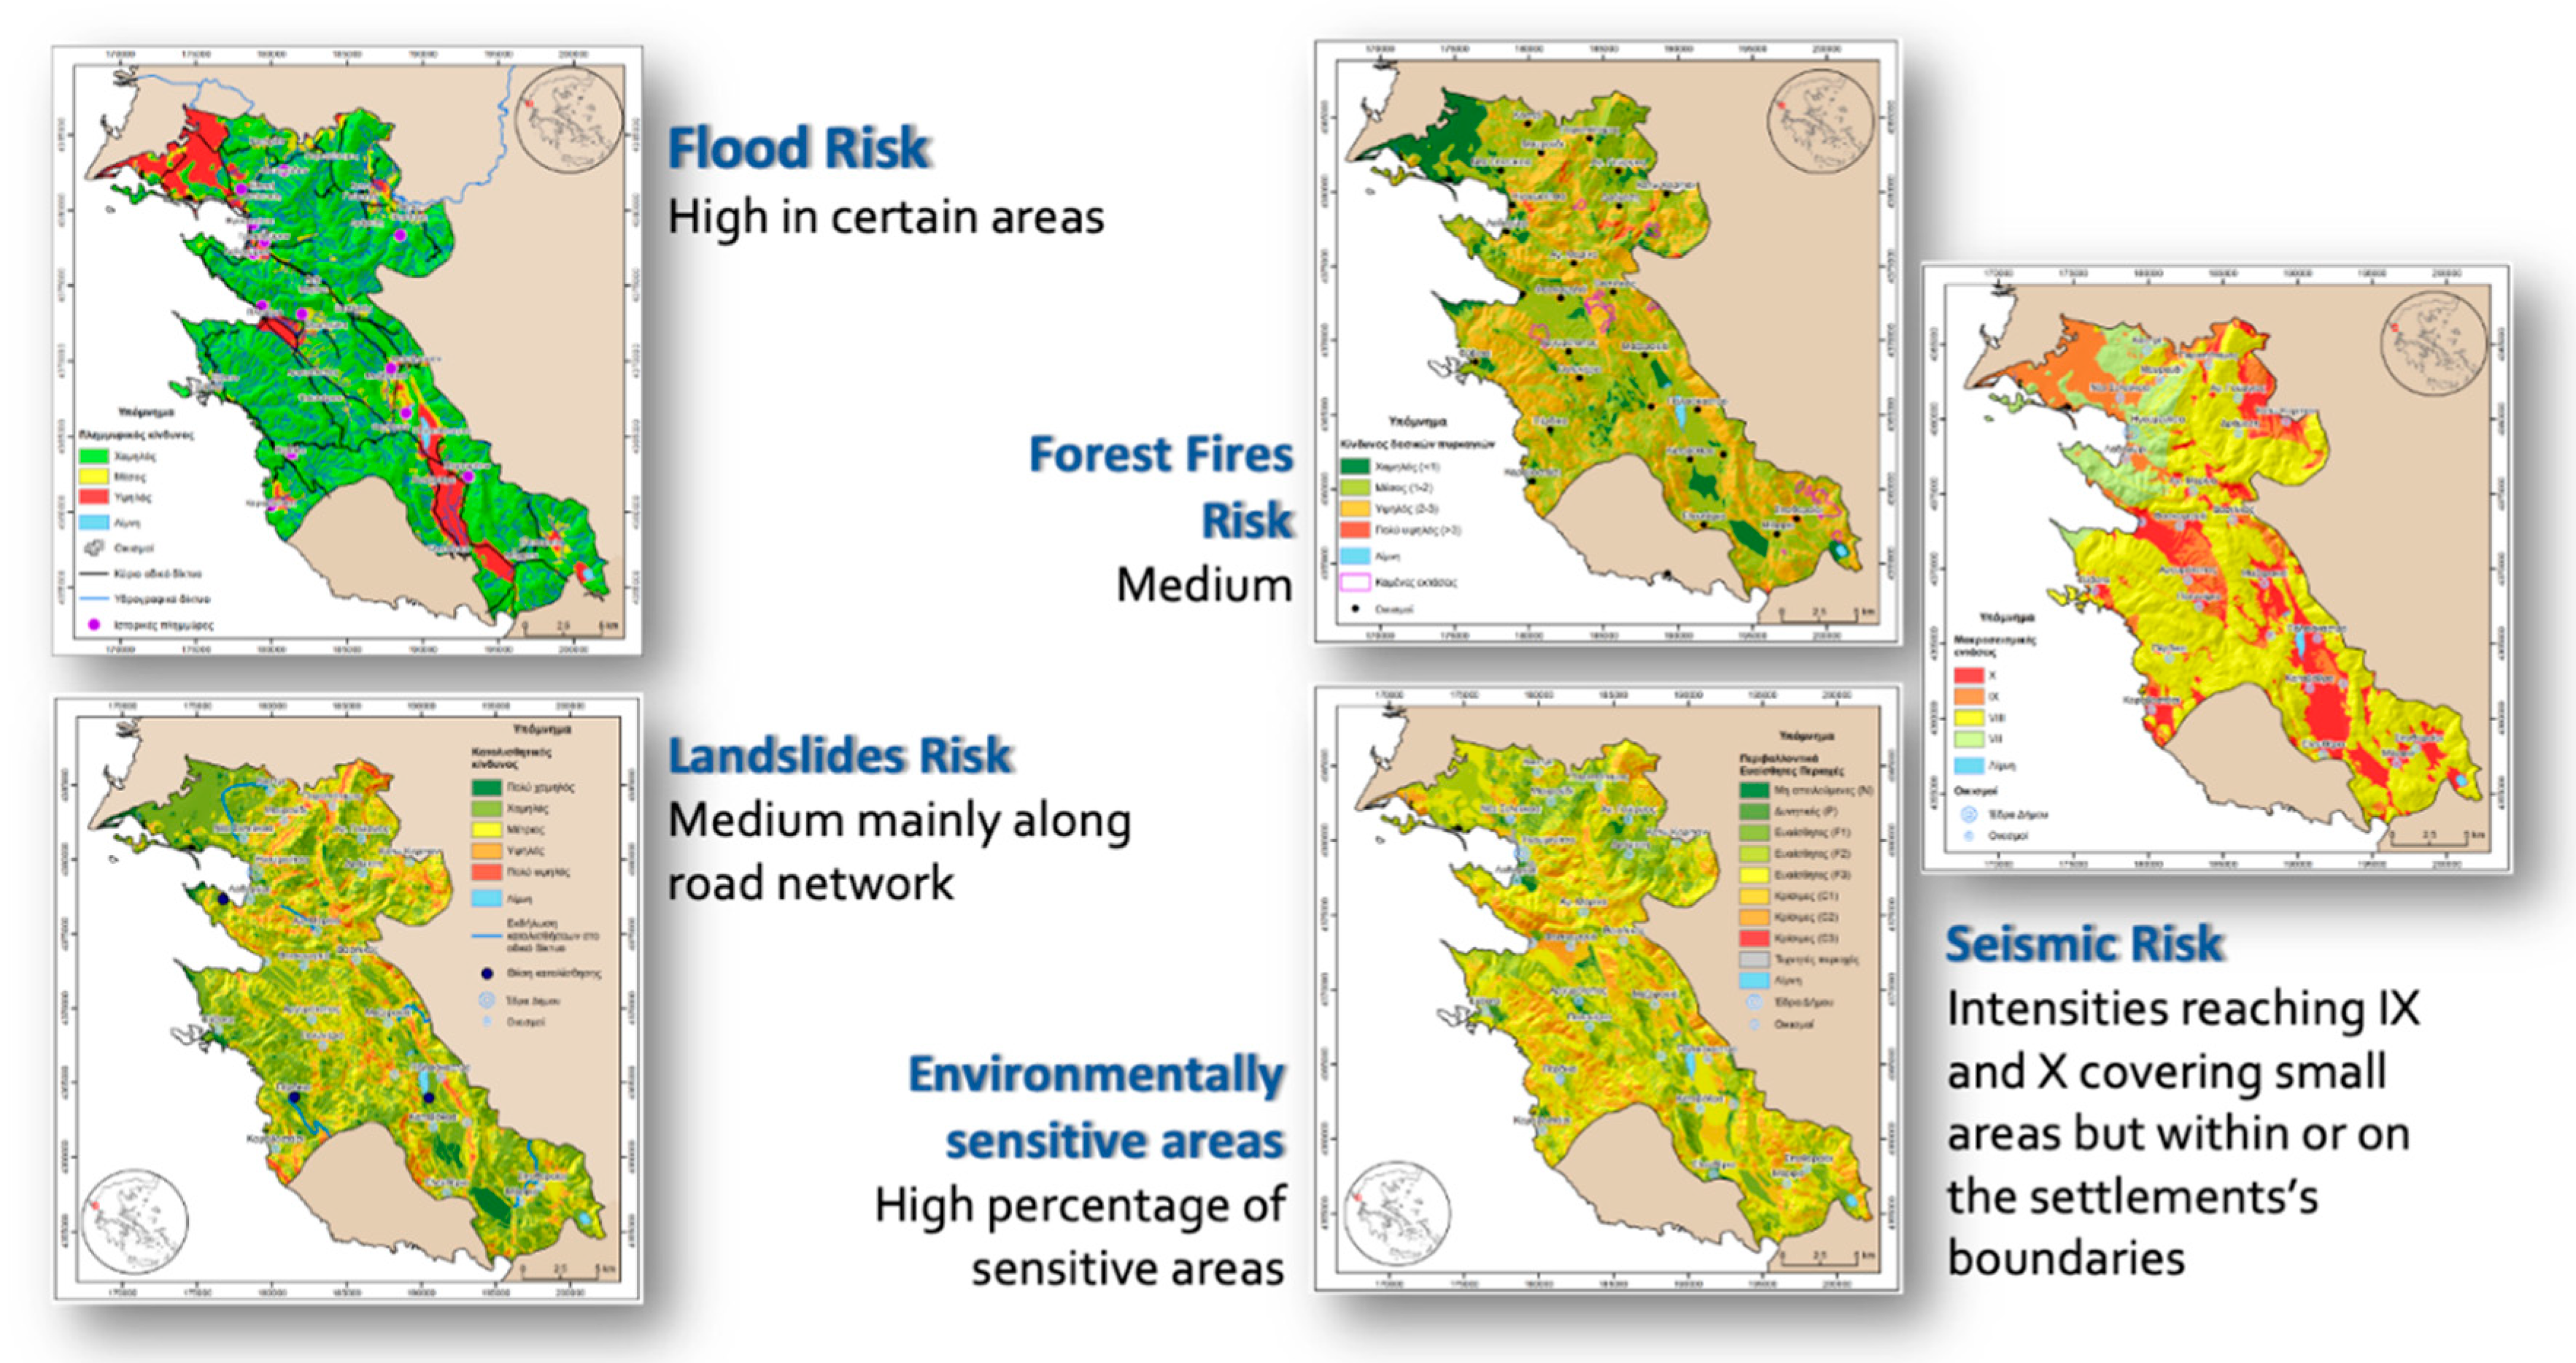
Regional authorities (municipalities) in Greece are legally responsible for managing natural disasters that occur in their area. A municipality can be a city (e.g., Athens) or a larger area which includes a larger settlement and several smaller ones, as the Municipality of Igoumenitsa (Greece) (Figure 1), where risk maps for flash floods, landslides, desertification, forest fires and earthquakes were created using the procedure mentioned previously. The creation of these maps enriched the municipality’s knowledge of the area as follows:
- Flash floods can potentially appear in eight areas, but only in four of them must measures be taken due to settlements being threatened. Additionally, the analysis of historic events showed that most of them occurred due to human interventions to the drainage network;
- Landslides can be a potential hazard only along the road network—a fact confirmed by the recorded landslide phenomena;
- Despite the reduction of fire events in the region, areas with high forest fire risk still exist, where fire hydrants are located far away and existing settlements and fire towers are unable to observe their extent;
- One third of the area (27%) is categorized as critical and already degraded in terms of desertification, while non-threatened areas occupy less than 1%;
- High seismic intensities areas occupy a small percentage of the municipality’s extent. However, these areas appear within the confines of settlements.
Apart from effectively demonstrating natural hazard-prone areas, these maps can also be used in land use planning or for the reorganization of the urban area in order to make it safer for the citizens and also to mitigate impacts on infrastructures.
By combining risk maps with the geographic location of the critical infrastructures (e.g., hospitals, schools, public buildings, etc.) vulnerability maps can be produced, thereby enabling the city to take care of their protection, keeping in mind that these infrastructures are crucial during a natural disaster. In addition, the combination of various information layers imported into databases helps to identify and map critical areas for natural hazard management, such as settlements and shelters, possible or faster evacuation routes, etc.
A city or municipality which can access the data available for its area and understand which natural hazards should be prepared for is able to use this information in two ways: (a) to perform the actions necessary for each phenomenon in a timely manner (e.g., prune lower branches of shrubs to separate them from surface fuels underneath prior to the forest fire vulnerability period) and create a dashboard summarizing the available data to be used during the response phase, and (b) to inform the population for these phenomena, both regarding their nature and to give instructions for their safety.
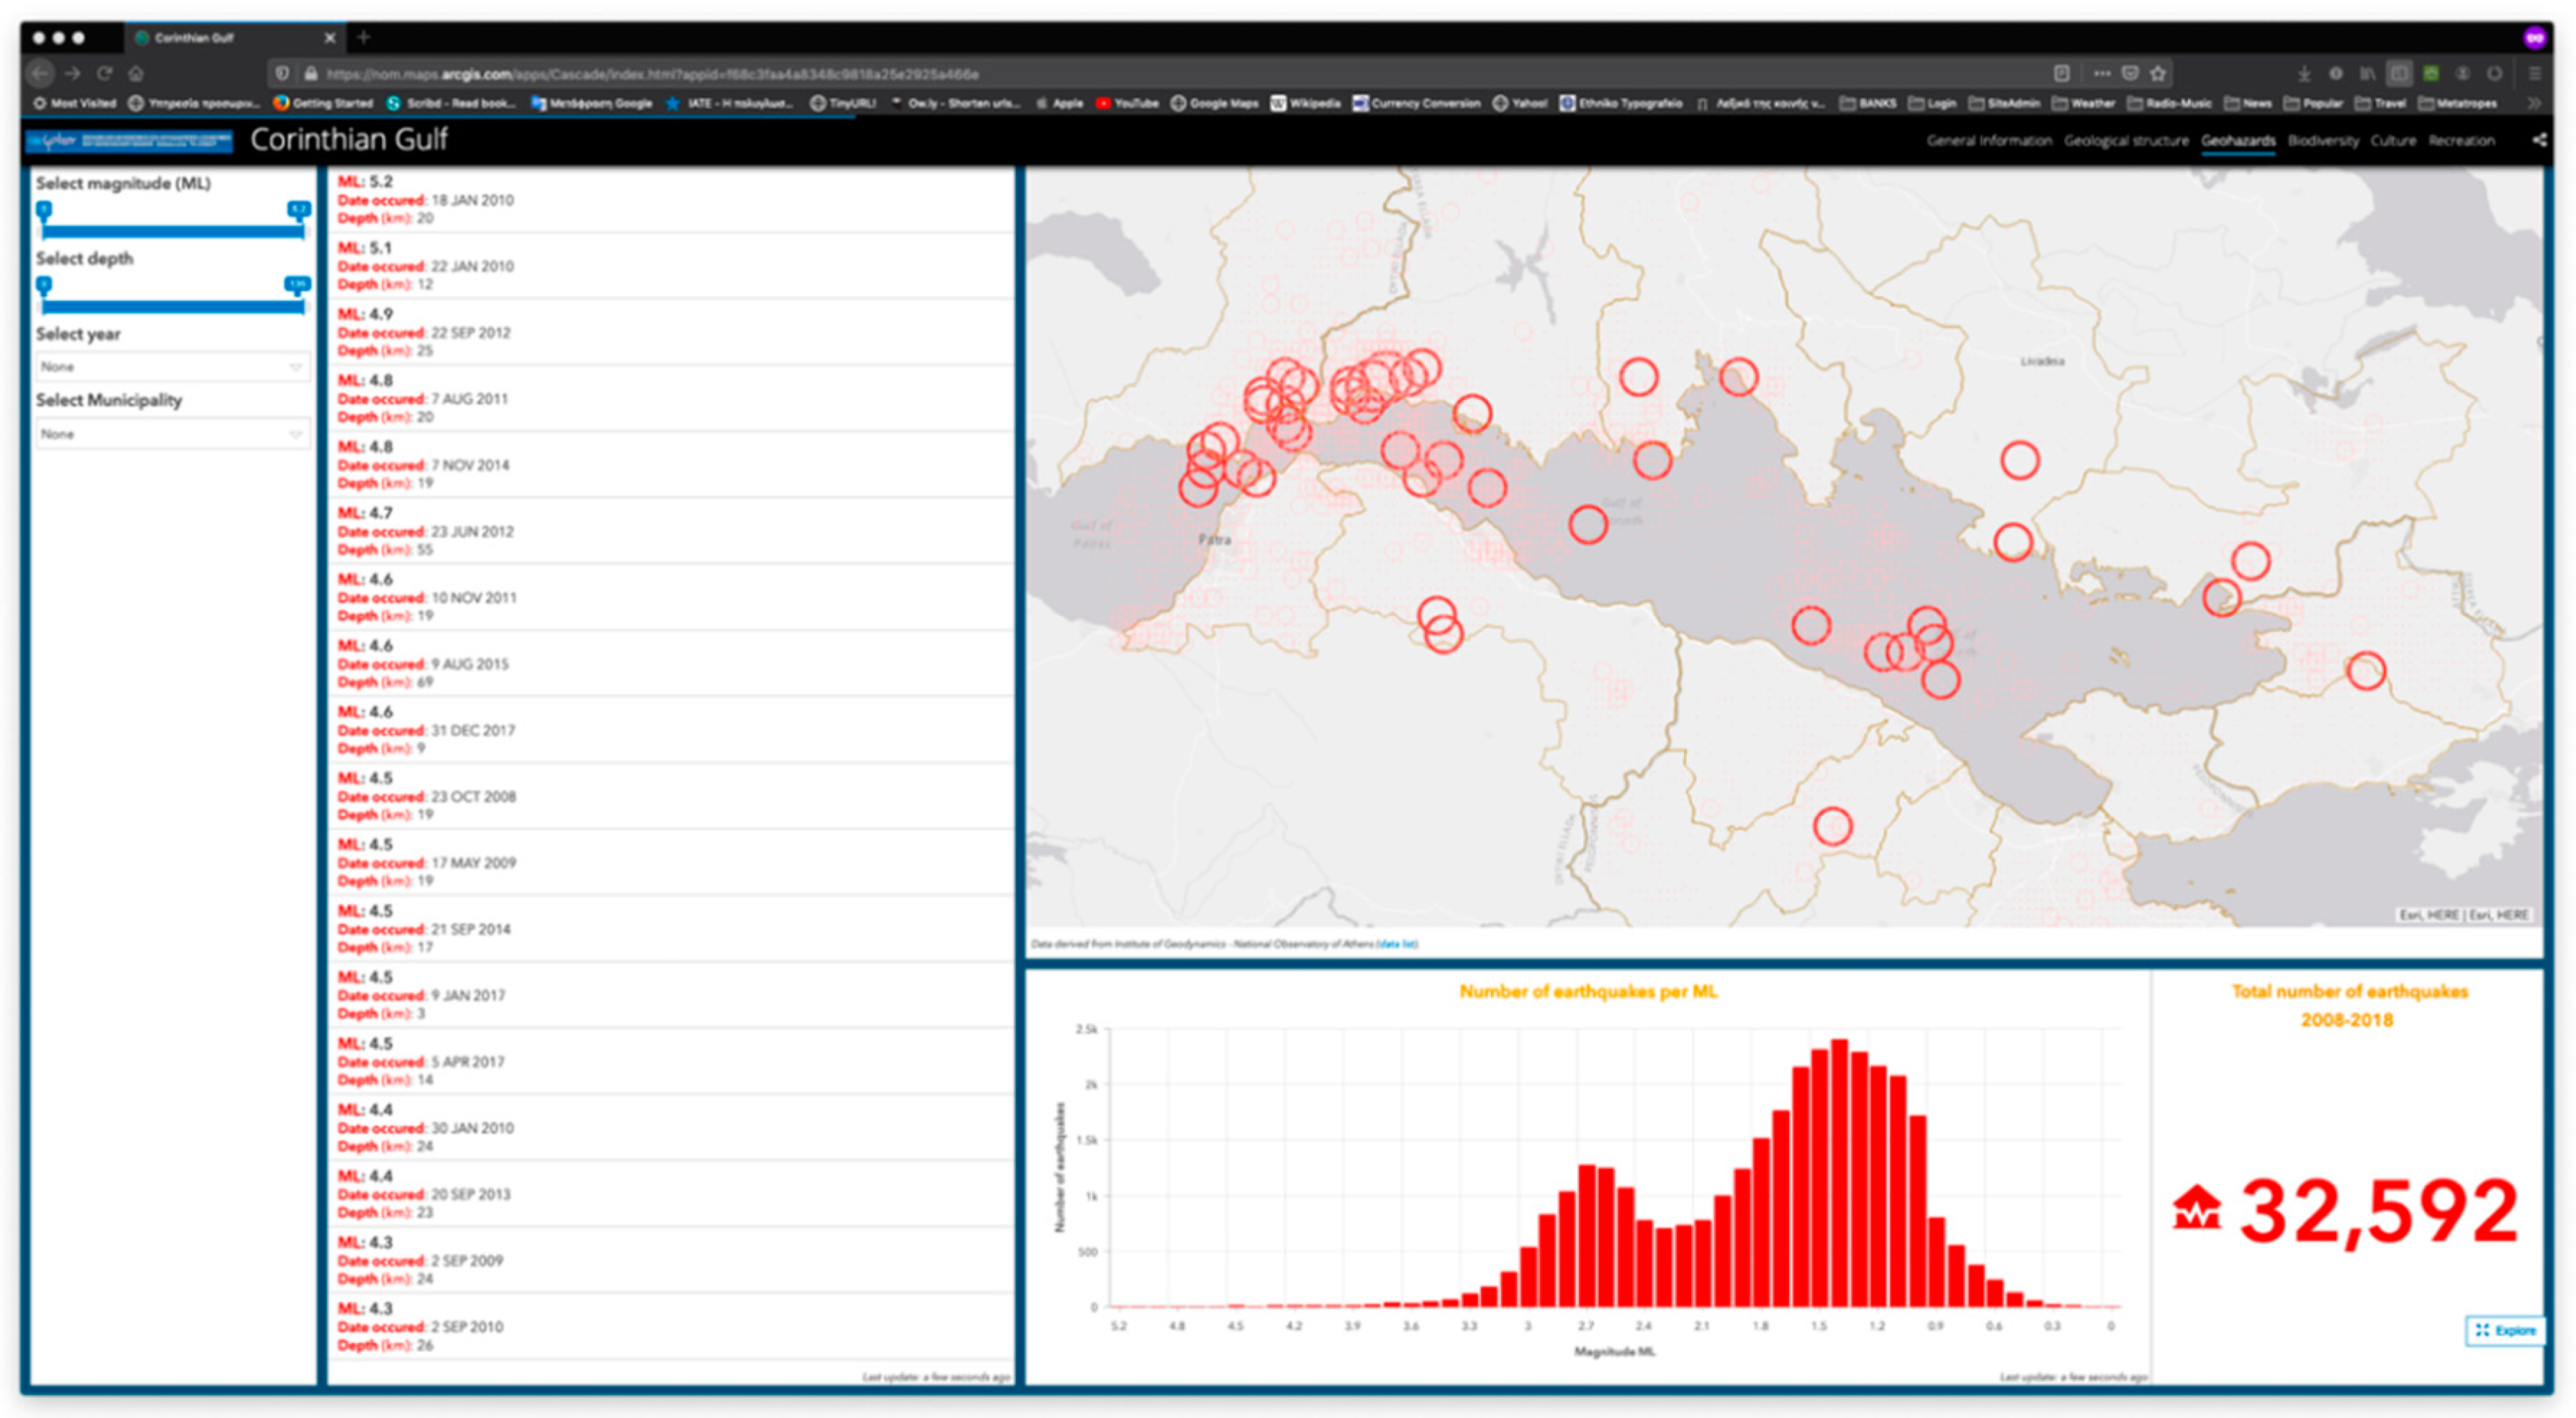
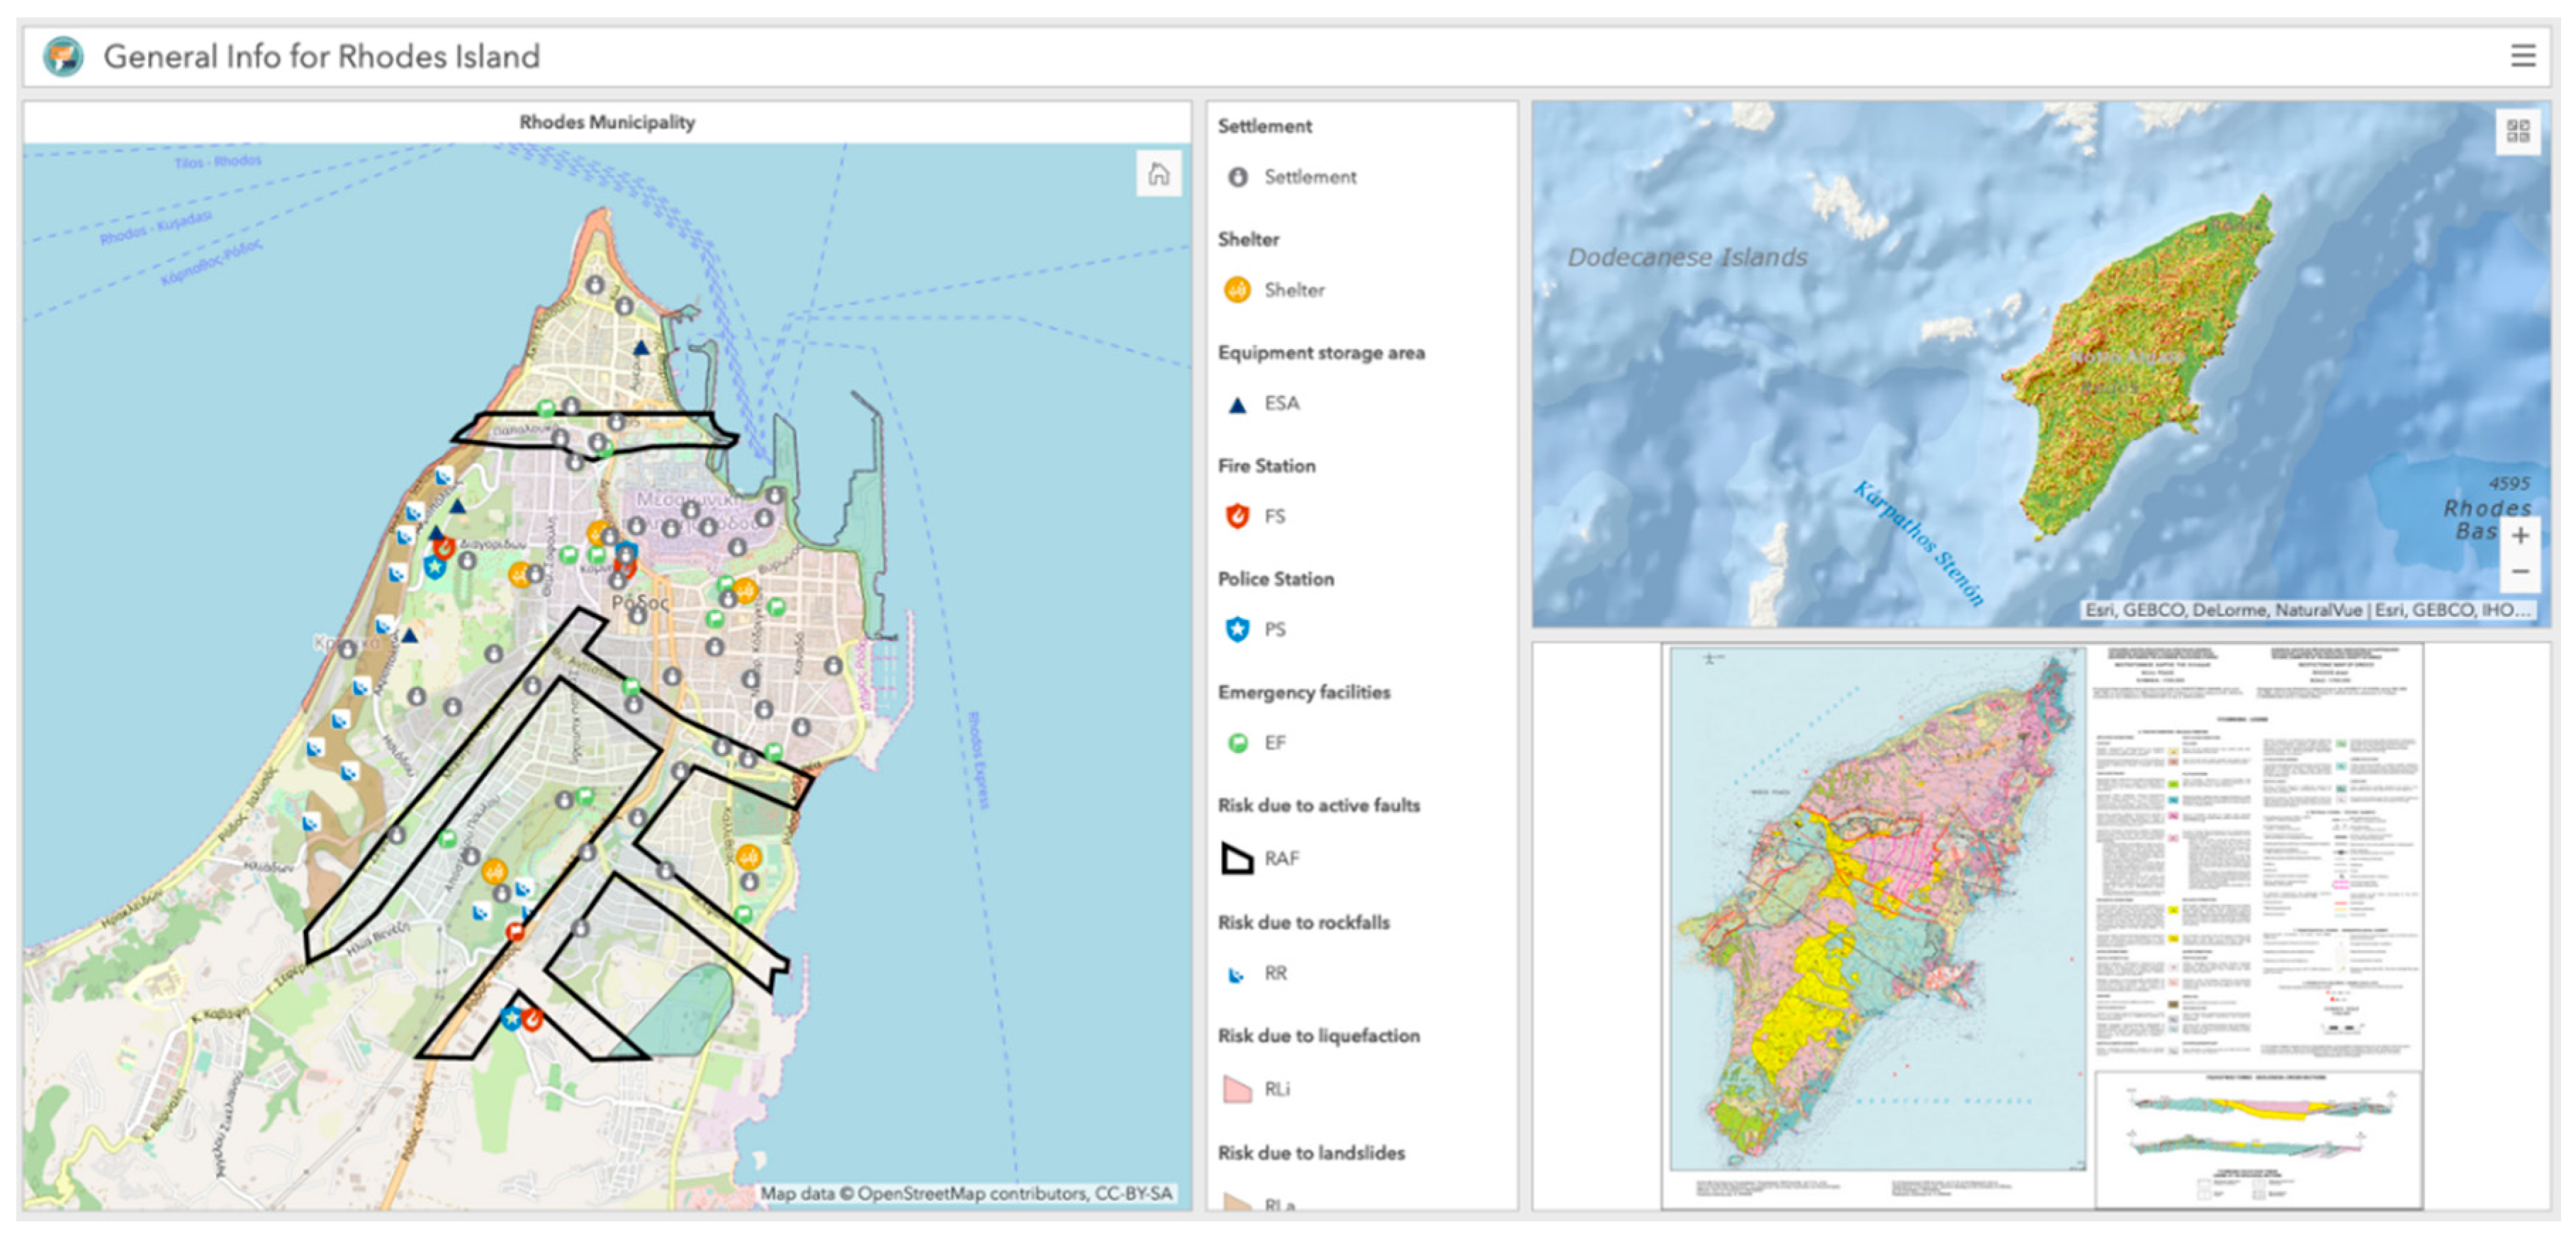
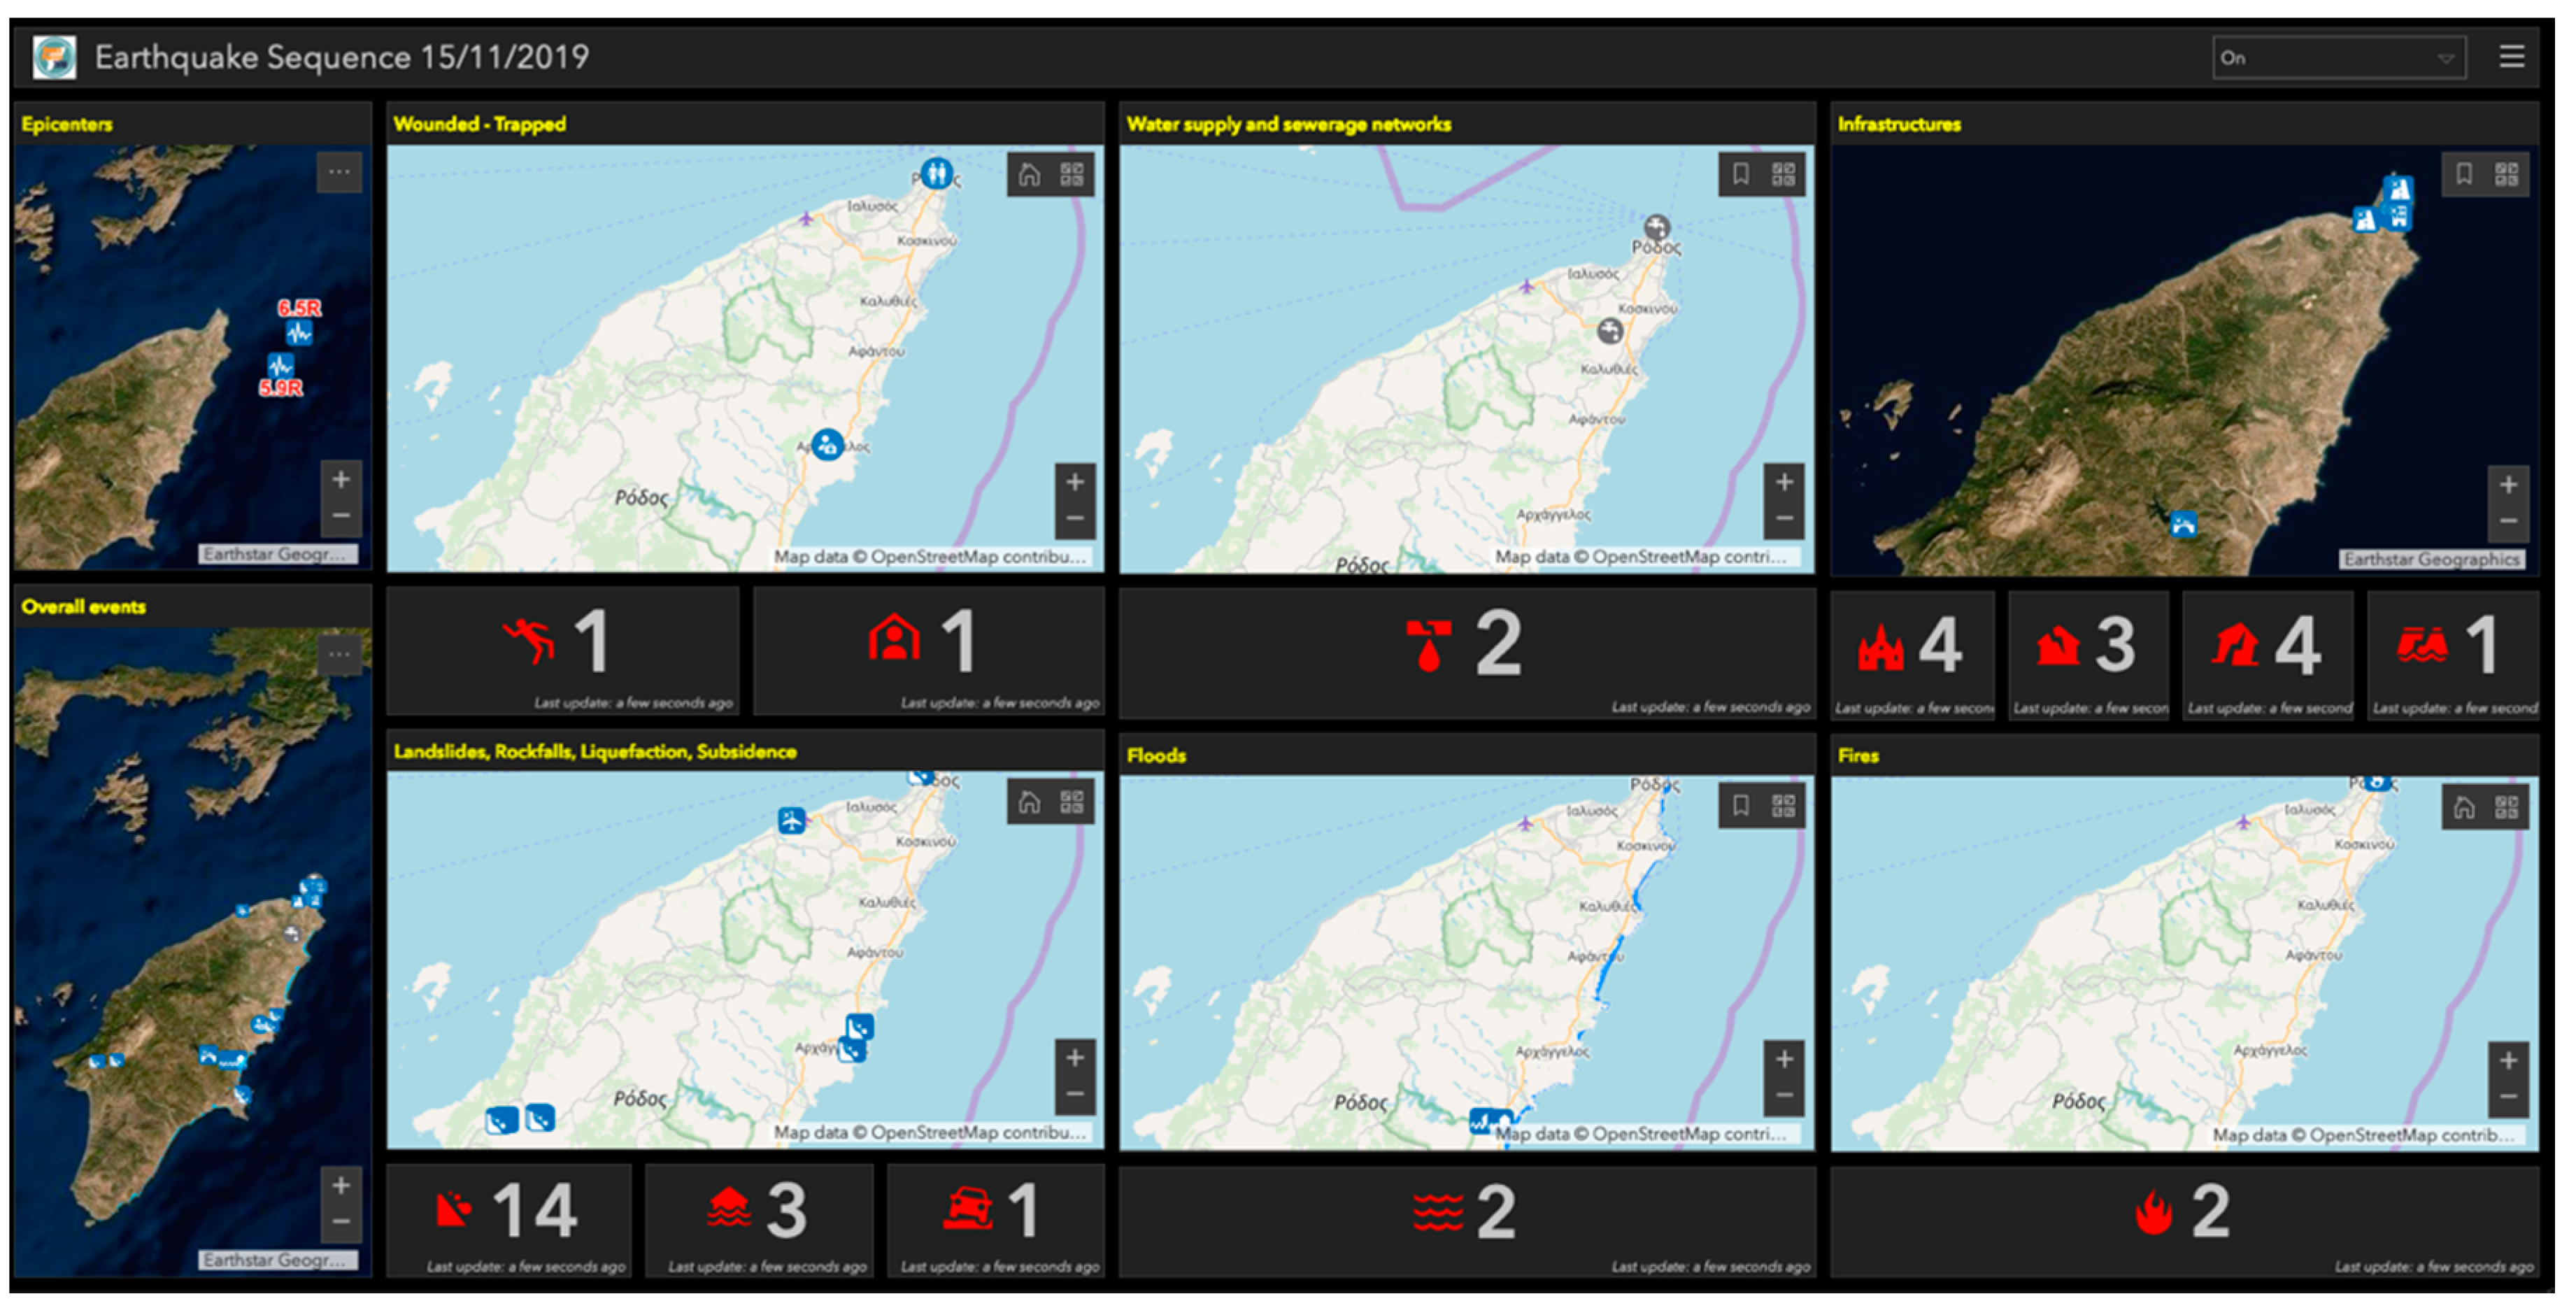
As far as the control panel (dashboard) is concerned, an application of GIS can be static, presenting all available data, or it may be also dynamic, showing real-time aspects of the hazard. In Figure 2, an interactive dashboard has been created for seismic risk in the Corinthian Gulf [6] showing the earthquakes that occurred in the period 2008–2018 and their distribution. Filters can be applied to minimize the results using the depth, magnitude, year and area in which the events occurred. Additionally, in Figure 3, the static dashboard presents (a) the crucial infrastructures for the Rhodes Municipality in Greece (police station, fire department, etc.) along with the dangerous zones for landslides, active faults, etc., on the left; (b) the slope map for the entire island on the upper right; and (c) the neotectonic and active tectonic zones map of the island on the bottom right. On the other hand, in Figure 4, a dynamic dashboard presents real time events during an earthquake which could occur near Rhodes Island. These two dashboards have been created and used for a tabletop exercise for earthquake risk management within the scope of exercises performed in the context of the Postgraduate Program “Environmental, Disaster and Crisis Management Strategies” in order for the local Civil Protection Department to be prepared for a possible real event [6]. This type of control panel is very useful during an event because it can present, in real-time, the spatial distribution of losses; thus, authorities can have an overview of the overall impact, making it an important decision-making tool (https://tinyurl.com/uj96j9z).
Apart from authorities being prepared during a natural hazard event, action must also be taken for the dissemination of scientific information to general public. As the sense of vision is the most dominant one, most people prefer to receive information through images and video. They also perceive their surroundings as they browse through maps by giving credence to features within them and putting complex environments in order through the recognition of patterns and relationships. Thus, organizing information about an area spatially offers a unique ability to visualize it while at the same time providing a useful and dynamic way of collecting information—a process the user can interact with. In addition, maps can be quite attractive, stimulating both sides of the brain: the right side, which is intuitive and aesthetic, and the left, which is logical and analytical, making a successful combination of utility with beauty, which proves to be appealing to the end-user.
Story maps are a new approach for data dissemination, as they use geography as a means of organizing and illustrating data, presenting narrative information about a place, an event, a subject and more by using a geographical frame and combining interactive maps with text, photos, videos and audiovisual media. Therefore, maps and narration complement each other in one application, rather than being side-by-side products, which also appear on a website, which is a form very familiar to the general public, although it has many more advantages.
Also, while many story maps are designed for the general, non-specialized audience, they can also be useful for specialized users who, using GIS tools, can take advantage of spatial analysis results without requiring any special knowledge or skills, which has led to the real spread of narrative maps worldwide, making them very popular and easy to use.
Using web GIS and story maps, cities or municipalities can promote not only their cultural heritage and biodiversity but also their geodiversity, part of which includes the natural phenomena that are developing in or around them. Taking scientific data and presenting them to the public in a simple and understandable way provides quick access to the available information for a wide audience, developing interest and possibly motivating the public to learn more about the display area.
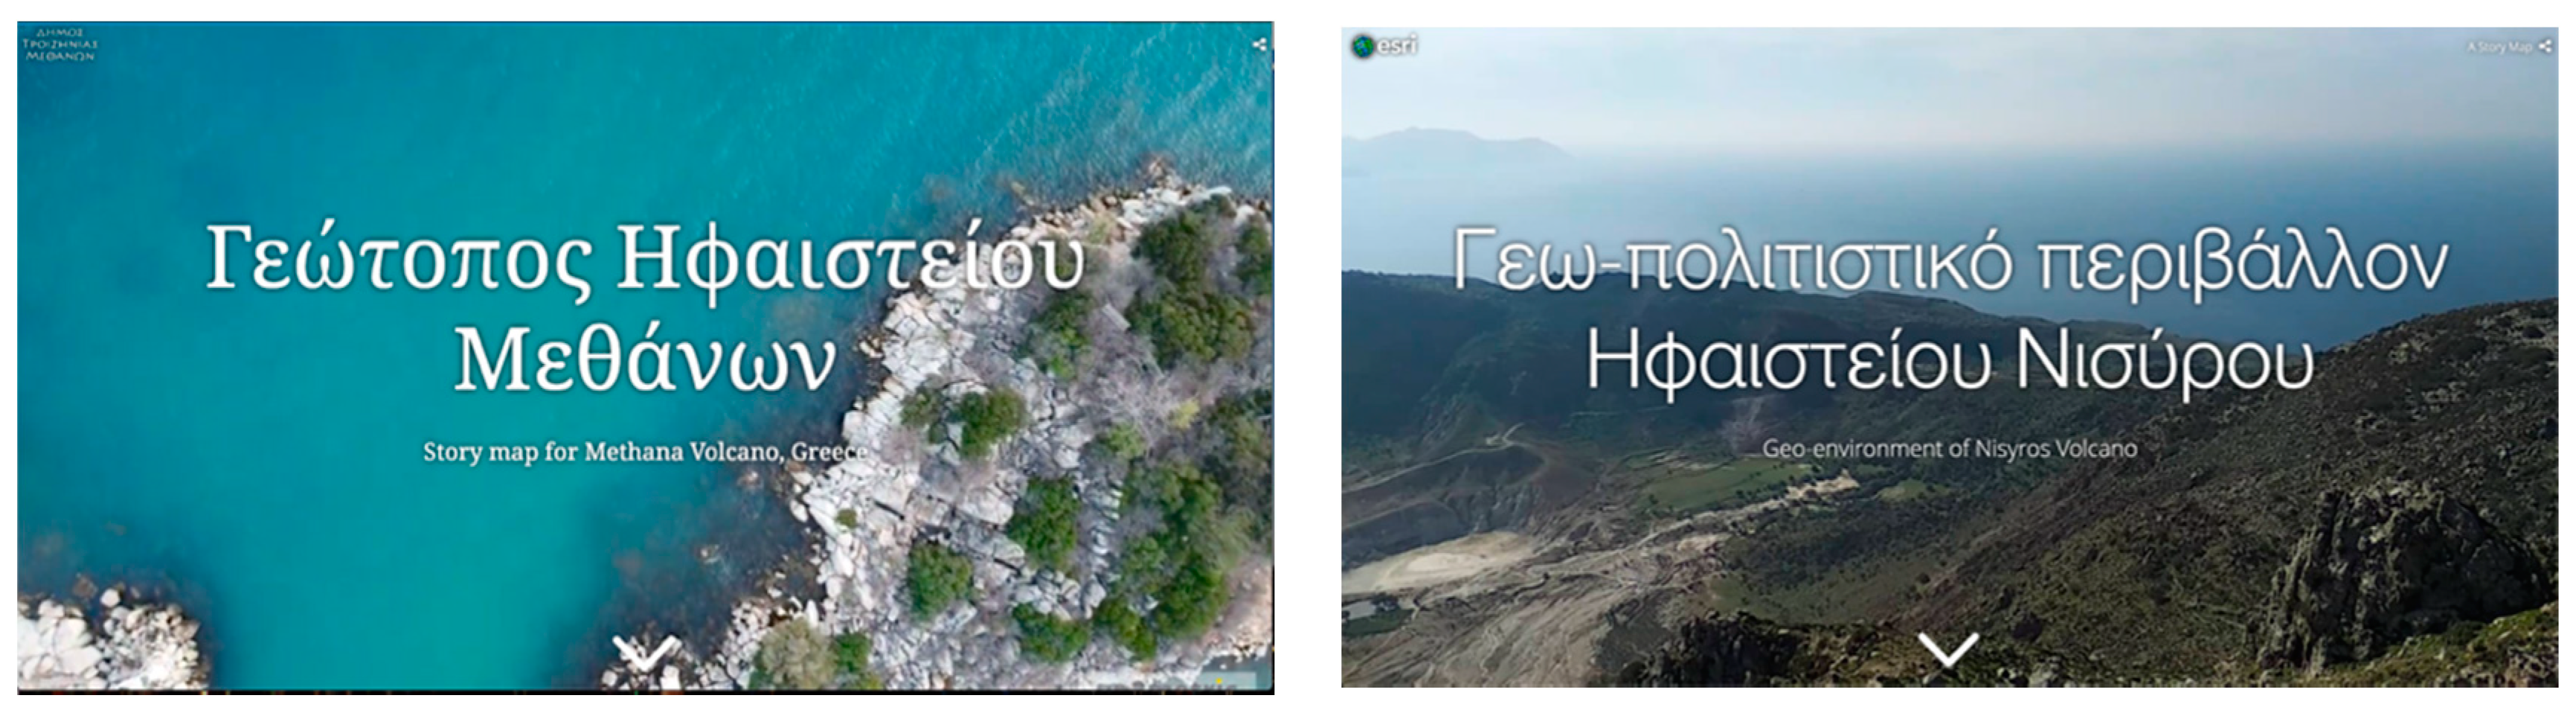
In Figure 5, two story maps are shown: one for Troizinia–Methana [7] and one for Nisyros Municipality [8]. Both areas form unique geotopes, since they were created over years due to volcanic activity. Apart from the general information regarding the geographic position, the settlements and the historical evolution of the areas, scientific information is given regarding the geological formations and geodynamic setting as well as the volcanic evolution of the areas. Also, in order for the two municipalities to promote hiking tourism, a trail network is described, and further information is given for each site mentioned.
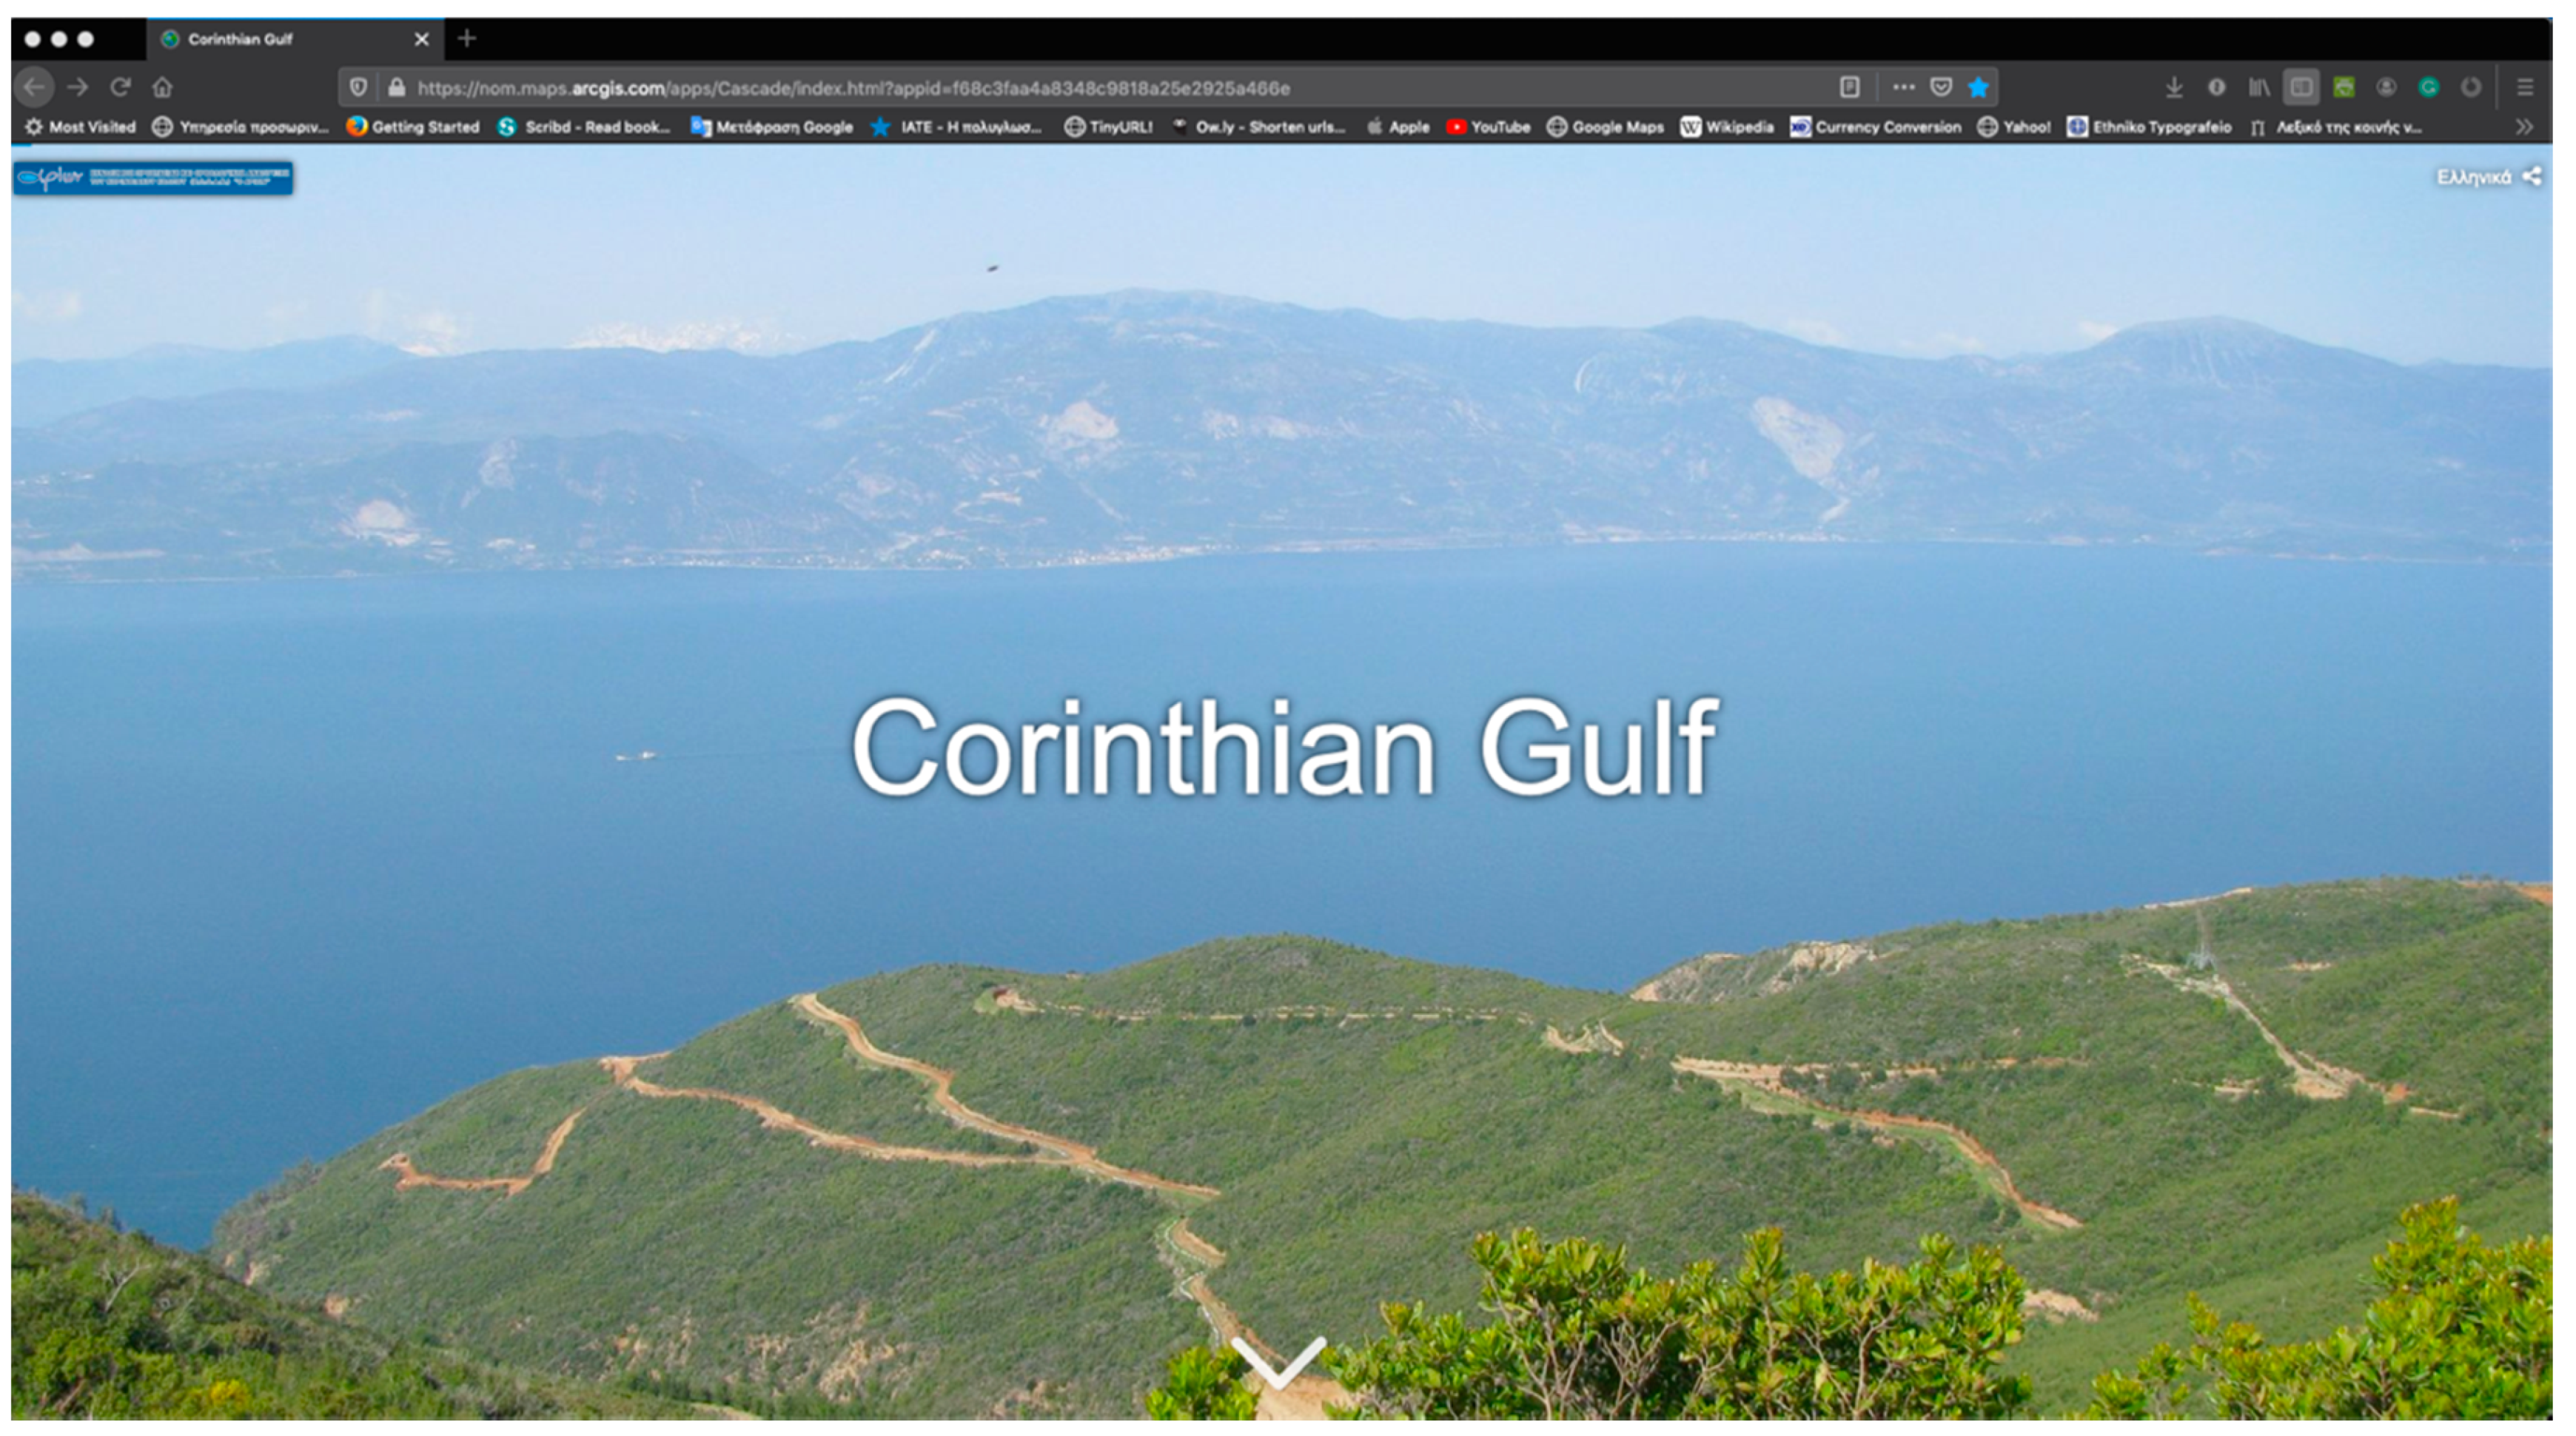
In addition to actions that every Smart City must take, sometimes it is unavoidable and mandatory to collaborate with other cities or municipalities to achieve efficient results. In Figure 6, another story map is used to reveal all the available information about the Corinthian Gulf—a new Natura 2000 site [9]. Municipalities that surround the Gulf decide to use the advantages of story maps to present—apart from the information concerning the human and natural environment—summarized scientific information enhanced with multimedia content for geohazards (earthquakes, tsunami, landslides, floods, etc.) that occur over the whole area.
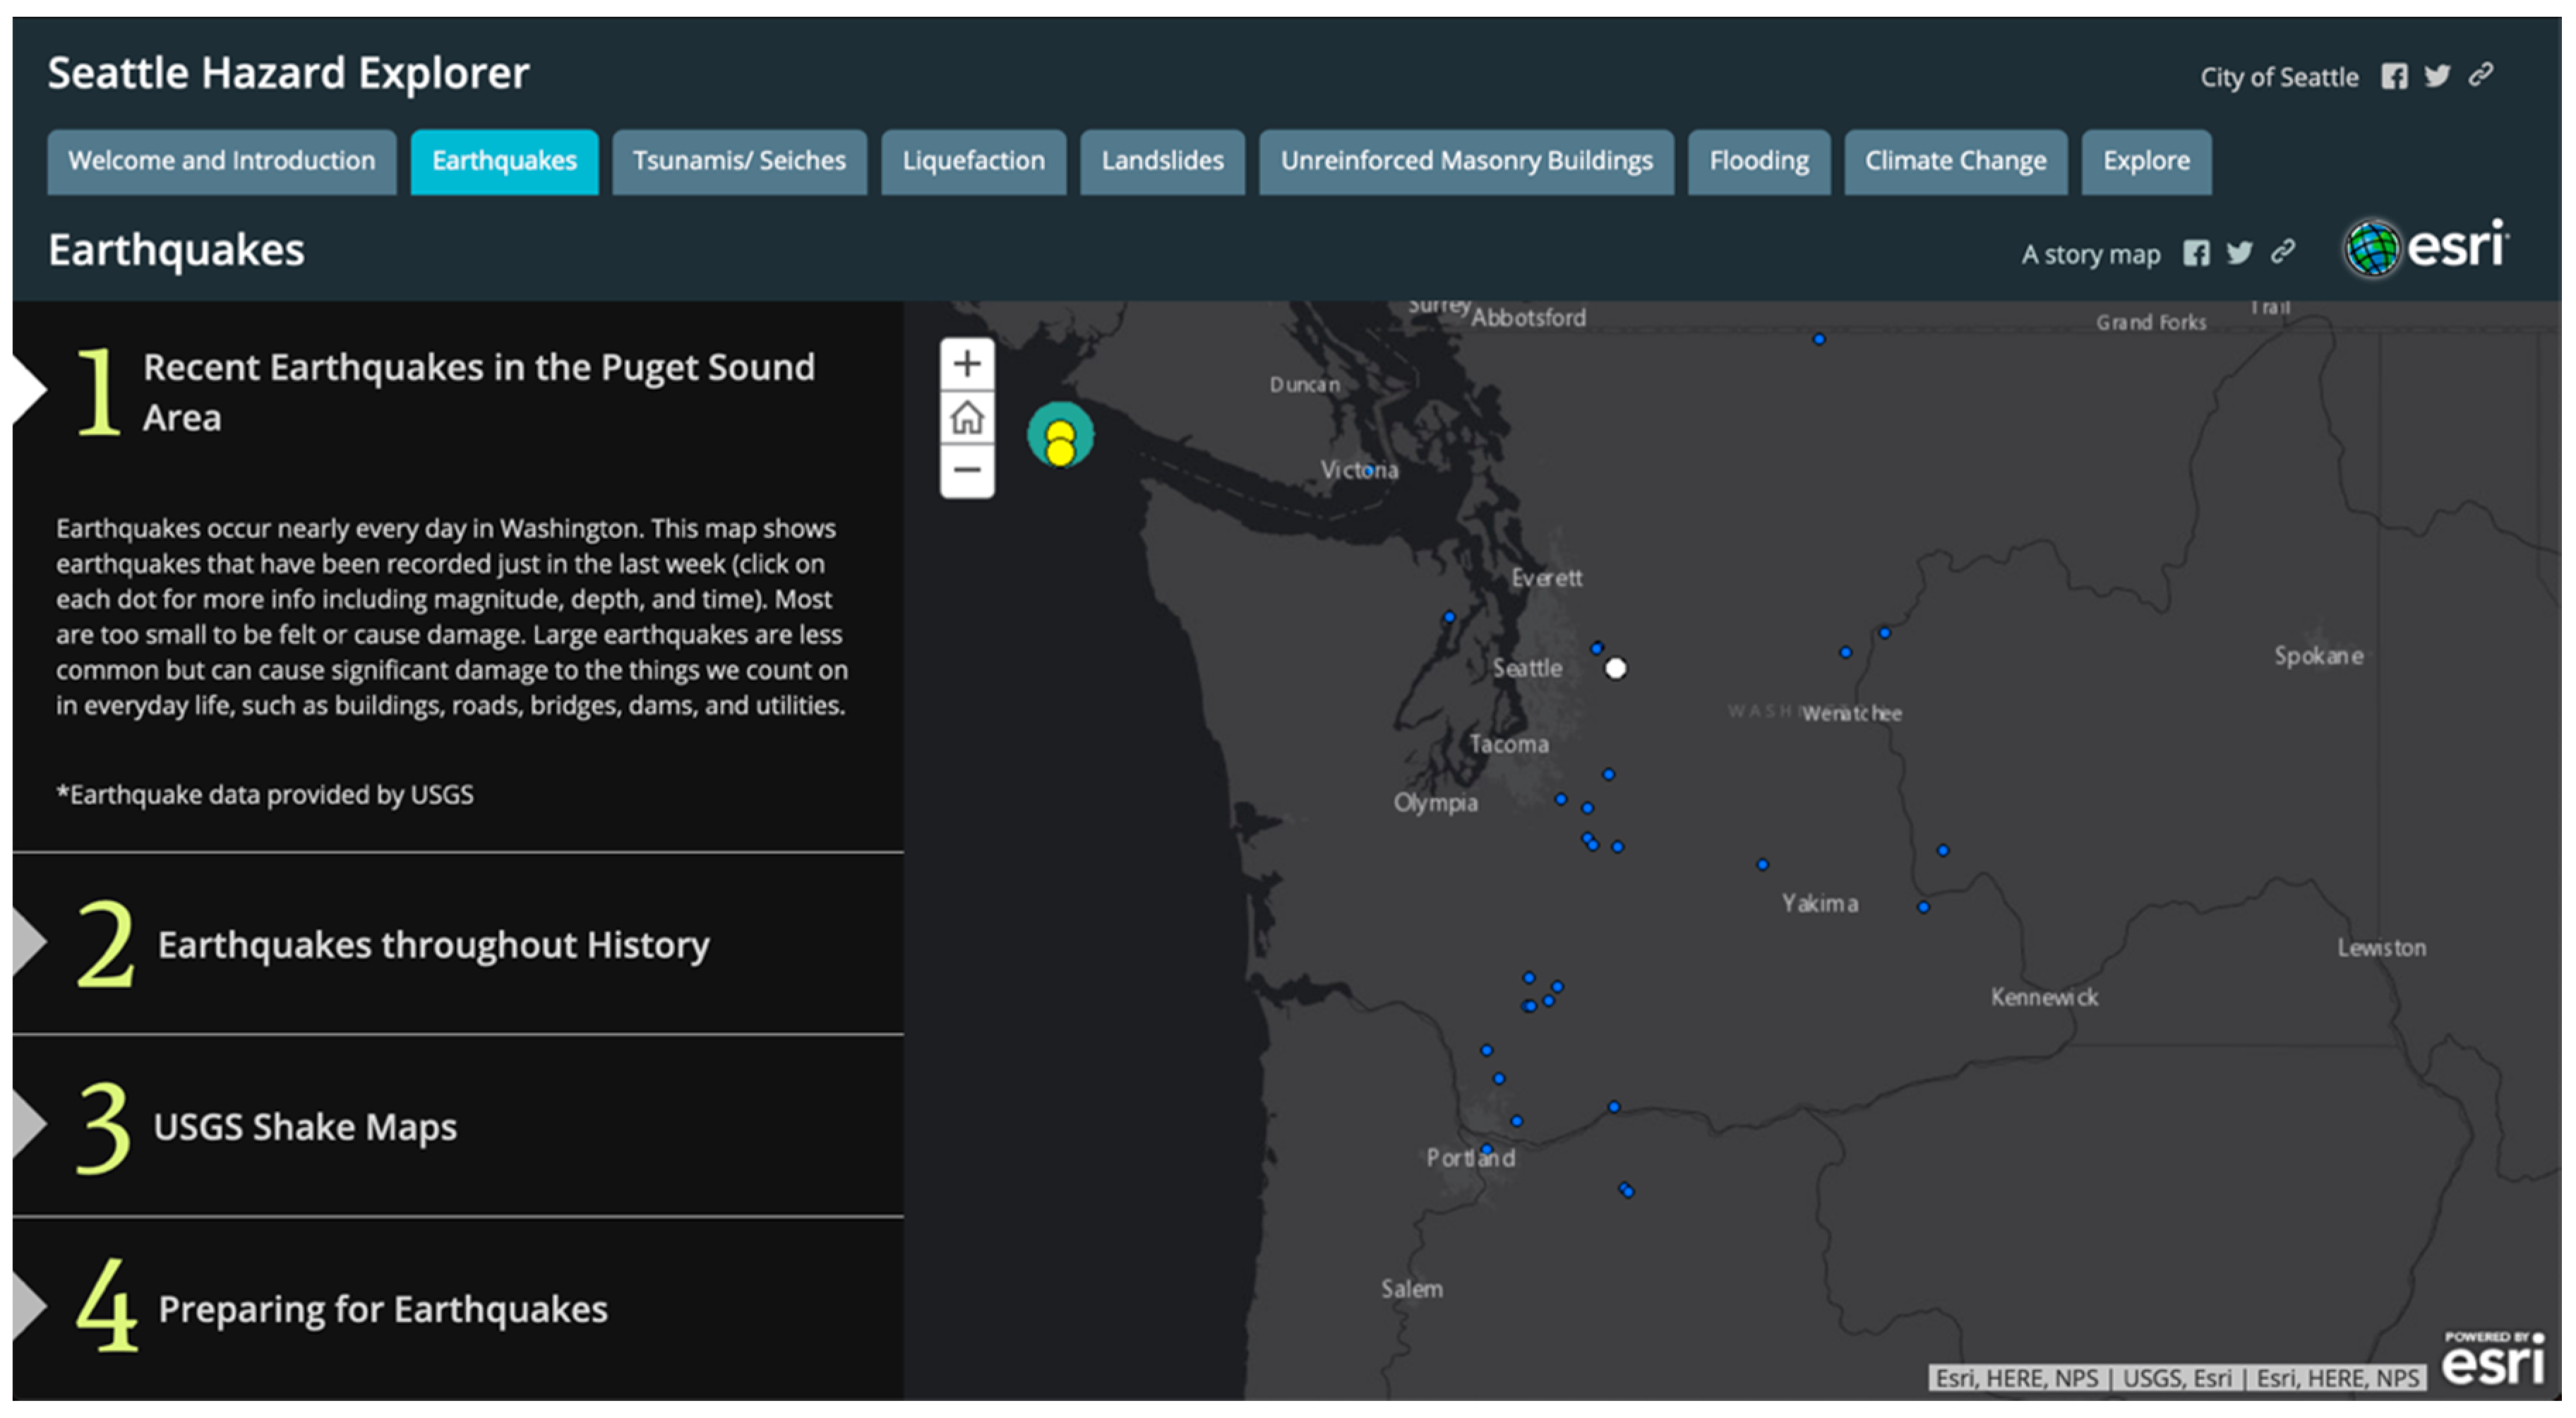
Informing citizens and enhancing the awareness of the population can also be done using story maps which either highlight the phenomena that may affect an area and their expected impact (e.g., areas that may be flooded) (Figure 7) or provide information on the evolution and/or effects of an event (Figure 8).
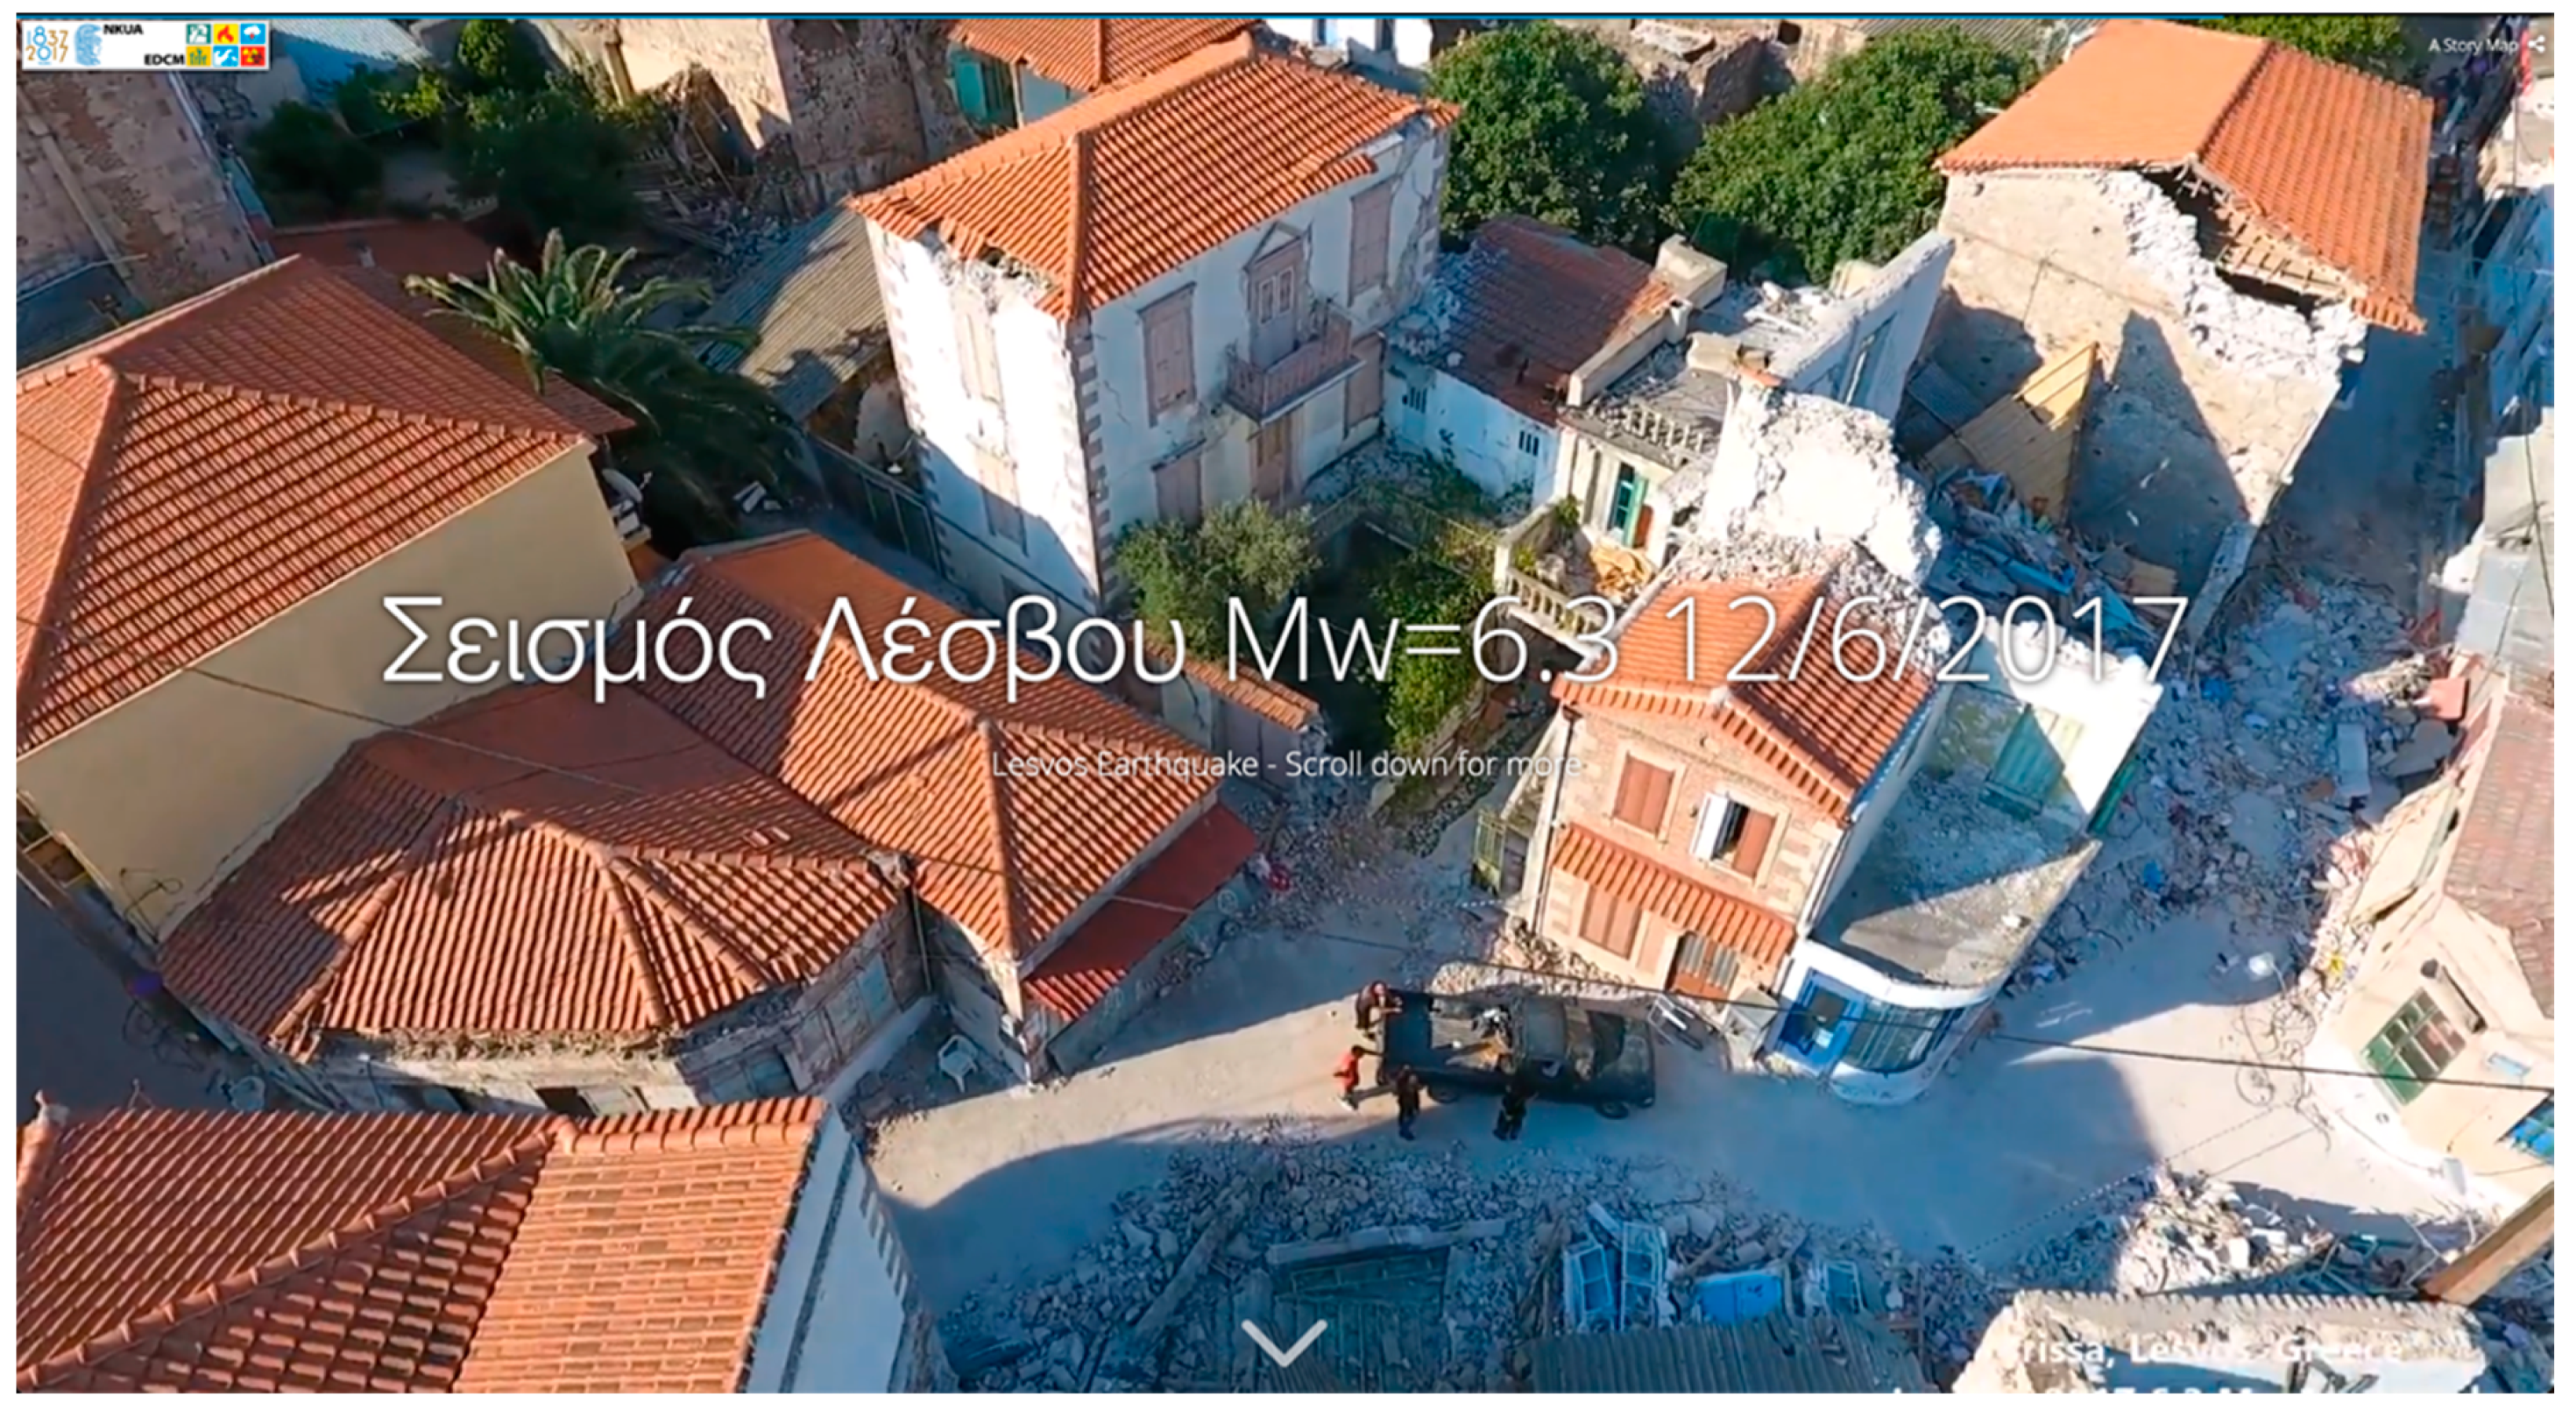
In Figure 7, a story map created for the City of Seattle presents the natural hazards that can occur in the area, explaining the theory of each one as well as their spatial distribution. On the other hand, in Figure 8, another story map has been created for the earthquake in Lesvos Island, a few hours after the main shock, where the seismotectonic and geological setting of the area, the evolution of the seismic sequence and the disasters caused by the earthquake are presented [10].
3. Discussion
It is extremely important that city residents are informed and alerted about and prepared for natural hazards. We demonstrate the use of Geographic Information Systems to create risk analysis maps using various heterogeneous data, as well as the use of apps to provide information about natural hazards through the internet or mobile devices. The above maps can be used in extreme situations to address a wider audience, encouraging a better understanding of the problems. They can be used for monitoring and evaluating the affected area, and the location of specific events can be displayed. Story maps demonstrate changes over time and can easily present the past and present situation of an area after a natural hazard. The GIS apps offer a great possibility to explore various aspects of problems which have occurred due to natural hazards. These apps can be made more effective using real-time data for better management during an extreme event. Real-time data would be an asset for decision making in order to protect people in a real disaster situation.
Author Contributions
Lemonia Ragia conceived of the presented idea, wrote and edited the manuscript. Varvara Antoniou developed the theory, designed and performed the experiments and wrote the manuscript. All authors have read and agreed to the published version of the manuscript.
Funding
This research received no external funding.
Conflicts of Interest
The authors declare no conflict of interest.
References
- United Nations. The World’s Cities in 2016. Available online: www.un.org (accessed on 30 January 2020).
- Papa, R.; Galderisi, A.; Vigo Majello, M.C.; Saretta, E. Smart and Resilient Cities. A Systemic Approach for Developing Cross-sectoral Strategies in the Face of Climate Change. TEMA J. Land Usemobil. Environ. 2015, 8, 19–49. [Google Scholar]
- Kunzmann, K.R. Smart Cities: A New Paradigm of Urban Development. Crios 2014, 4, 9–20. [Google Scholar]
- Tao, W. Interdisciplinary urban GIS for smart cities: Advancements and opportunities. Geo-Spat. Inf. Sci. 2013, 16, 25–34. [Google Scholar] [CrossRef]
- Naida, D.S. GIS Applications to Smart Cities. Int. J. Adv. Multidiscip. Sci. Res. (IJAMSR) 2018, 1, 2. [Google Scholar]
- Lekkas, E.; Andreadakis, E.; Antoniou, V.; Speis, P.D.; Kapourani, E.; Papaspyropoulos, K. Hands on Course: Management of Disaster Victims; Debriefing Report; Rhodes, Greece, 2016; Available online: https://www.researchgate.net/publication/310425316_Hands_on_Course_Management_of_Disaster_Victims_-_Rhodes_October_7-12_2016_Debriefing_Report (accessed on 8 March 2020). [CrossRef]
- Antoniou, V.; Ragia, L.; Nomikou, P.; Bardouli, P.; Lampridou, D.; Ioannou, T.; Kalisperakis, I.; Stentoumis, C. Creating a Story Map Using Geographic Information Systems to Explore Geomorphology and History of Methana Peninsula. ISPRS Int. J. Geo-Inf. 2018, 7, 484. [Google Scholar] [CrossRef] [Green Version]
- Antoniou, V.; Nomikou, P.; Zafeirakopoulou, E.; Bardouli, P.; Ioannou, T. Geo-biodiversity and cultural environment of Nisyros volcano. In Proceedings of the 15th International Congress of the Geological Society of Greece, Athens, Greece, 22–24 May 2019; pp. 716–717. [Google Scholar]
- Antoniou, V.; Nomikou, P.; Papaspyropoulos, K.; Vlasopoulos, O.; Zafeirakopoulou, E.; Bardouli, P.; Chrysopoulou, E. Geo-Biodiversity and Cultural Environment of the Regions Surrounding the Corinth Gulf (Greece). Regional Conference on Geomorphology, Focal Theme: Geomorphology of Climatically and Tectonically Sensitive Areas, Unesco Global Geoparks: Geoheritage Assessment and Management-Geo-Tourism Development; Abstract book; UNESCO: Athens, Greece, 2019; p. 256. [Google Scholar]
- Antoniou, V.; Mavroulis, S.; Spyrou, N.-I.; Bardouli, P.; Andreadakis, E.; Skourtsos, E.; Kaviris, G.; Sakkas, V.; Carydis, P.; Lekkas, E. Storytelling Technologies for Dissemination of Scientific Information of Natural Disasters: The June 12, 2017, Mw 6.3 Lesvos (Northeastern Aegean, Greece) earthquake story map. In Proceedings of the 9th International INQUA Meeting on Paleoseismology, Active Tectonics and Archeoseismology (PATA), Possidi, Greece, 25–27 June 2018. [Google Scholar]
Figure 1.
Risk maps for floods, landslides, forest fires, desertification and seismicity covering the Municipality of Igoumenitsa. A color palette ranging from green to red is used to present the risk level from low to high, respectively.
Figure 1.
Risk maps for floods, landslides, forest fires, desertification and seismicity covering the Municipality of Igoumenitsa. A color palette ranging from green to red is used to present the risk level from low to high, respectively.

Figure 2.
Earthquakes around the Corinthian Gulf which occurred in the period 2008–2018 (https://arcg.is/1n4yHv). This dashboard has been created to highlight the high seismicity of the Corinthian Gulf as part of its geodiversity (https://tinyurl.com/wrewbga).
Figure 2.
Earthquakes around the Corinthian Gulf which occurred in the period 2008–2018 (https://arcg.is/1n4yHv). This dashboard has been created to highlight the high seismicity of the Corinthian Gulf as part of its geodiversity (https://tinyurl.com/wrewbga).

Figure 3.
Interactive dashboard presenting information for seismic risk management for Rhodes Island (https://arcg.is/1Ka98C0).
Figure 3.
Interactive dashboard presenting information for seismic risk management for Rhodes Island (https://arcg.is/1Ka98C0).

Figure 4.
Interactive dynamic dashboard presenting real-time damage to infrastructure and casualties during an earthquake event (https://arcg.is/0LSmHj).
Figure 4.
Interactive dynamic dashboard presenting real-time damage to infrastructure and casualties during an earthquake event (https://arcg.is/0LSmHj).

Figure 5.
Story Maps for Troizinia–Methana (https://tinyurl.com/y3w6k7mb) and Nisyros (https://tinyurl.com/vstjq36) Volcano Municipality.
Figure 5.
Story Maps for Troizinia–Methana (https://tinyurl.com/y3w6k7mb) and Nisyros (https://tinyurl.com/vstjq36) Volcano Municipality.

Figure 6.
Story map for the Corinthian Gulf and municipalities around it (https://tinyurl.com/wrewbga).
Figure 6.
Story map for the Corinthian Gulf and municipalities around it (https://tinyurl.com/wrewbga).

Figure 7.
Seattle hazard explorer story map (https://tinyurl.com/j9ewsnm), where the City of Seattle informs citizens about the natural hazards than can affect the area.
Figure 7.
Seattle hazard explorer story map (https://tinyurl.com/j9ewsnm), where the City of Seattle informs citizens about the natural hazards than can affect the area.

Figure 8.
Story map providing information about the Lesvos earthquake on 12 June 2017, Mw = 6.3 (https://tinyurl.com/y5c93nkt).
Figure 8.
Story map providing information about the Lesvos earthquake on 12 June 2017, Mw = 6.3 (https://tinyurl.com/y5c93nkt).

© 2020 by the authors. Licensee MDPI, Basel, Switzerland. This article is an open access article distributed under the terms and conditions of the Creative Commons Attribution (CC BY) license (http://creativecommons.org/licenses/by/4.0/).
Share and Cite
MDPI and ACS Style
Ragia, L.; Antoniou, V. Making Smart Cities Resilient to Climate Change by Mitigating Natural Hazard Impacts. ISPRS Int. J. Geo-Inf. 2020, 9, 153. https://0-doi-org.brum.beds.ac.uk/10.3390/ijgi9030153
AMA Style
Ragia L, Antoniou V. Making Smart Cities Resilient to Climate Change by Mitigating Natural Hazard Impacts. ISPRS International Journal of Geo-Information. 2020; 9(3):153. https://0-doi-org.brum.beds.ac.uk/10.3390/ijgi9030153
Chicago/Turabian StyleRagia, Lemonia, and Varvara Antoniou. 2020. "Making Smart Cities Resilient to Climate Change by Mitigating Natural Hazard Impacts" ISPRS International Journal of Geo-Information 9, no. 3: 153. https://0-doi-org.brum.beds.ac.uk/10.3390/ijgi9030153
Note that from the first issue of 2016, this journal uses article numbers instead of page numbers. See further details here.