1. Introduction
The effective and efficient measurement of road inspection and maintenance services is a critical task for local governments aiming to enhance the safety and livability of a city. During the 1954–1973 economic boom in Japan, the country rapidly constructed many transportation infrastructures, many of which are now more than 50 years old. Therefore, road management in Japan is now essential for addressing public safety concerns [
1].
Identifying sections of road in need of repair has depended on the efforts of experienced engineers. However, budget reductions and a lack of these engineers have increased the likelihood that roads will not be adequately maintained. In fact, some municipalities are already unable to manage roads sufficiently [
2]. This is not a problem only in Japan—aging infrastructure is also causing transportation management problems in the United States [
3], and many other countries will face similar problems in the future.
Recently, citizen feedback architectures, such as FixMyStreet [
4] and SeeClickFix [
5], have been receiving attention. In Japan, Chiba city has introduced a service for citizen feedback and infrastructure monitoring. Although citizen feedback contributes to the discovery of infrastructure problems, an inspection must eventually be conducted by experienced engineers. Additionally, in terms of road inspection, it is not possible to inspect the entire road uniformly, because such inspections are biased toward feedback on relatively narrow thoroughfares, such as sidewalks and streets [
6].
Systems that monitor road conditions using onboard smartphones have been developed and are the focus of this research. Smartphone-based road inspection systems are relatively inexpensive and can be installed in multiple vehicles. The utilization of such road inspection systems is expected to reduce maintenance costs and inspection time. However, it is not appropriate to install the systems in all available public vehicles, as the allocation of smartphones to appropriate vehicles requires prior knowledge regarding the usage of public vehicles in the city. However, local governments often do not possess this knowledge, and as far as we know, there is no research to support them in acquiring this information.
In June 2014, we began work on the “working car project” as Commissioned Research of the National Institute of Information and Communications Technology (NICT), Japan. In this project, we collected global positioning system (GPS) data from public vehicles over a period of more than one year. There are numerous approaches for establishing policies and budget planning based on analysis of GPS data. Traffic congestion data [
7,
8,
9] are often used as the basis for urban planning studies. In particular, in Japan, a country that experiences many natural disasters, researchers are actively focusing on traffic monitoring after disasters in order to support disaster prevention planning [
10,
11]. With the increasing use of electric vehicles, a number of studies have examined the optimal placement of charging stations [
12,
13]. Other research efforts have employed GPS data to analyze automobile insurance pricing [
14] and the usage of electric vehicles [
15].
In a previous study focused on the work of local governments, the optimization of public vehicles using GPS data was considered [
16]. Specifically, the study analyzed the usage time of public vehicles and proposed a car-sharing system to reduce the management costs for public vehicles. As another typical approach, local governments can use GPS data to promote efficient use of public vehicles, particularly vehicles designed for specific tasks. For example, research efforts had examined optimal placement of ambulances [
17] and route optimization of garbage vehicles [
18].
Using the GPS data collected during the “working car project,” in this study, we considered strategies for optimizing the introduction of smartphone-based road inspection systems to local governments. First, we used GPS data to analyze the current road inspection patterns and usage of public vehicles. Second, we discussed the feasibility of introducing the road inspection systems in local governments. Studies on the analysis and comparison of the usage of public vehicles in multiple municipalities have not yet been conducted. The results presented in this paper are useful not only to several researchers, but also to local governments and the private sector. For researchers of road inspection systems, these results provide an indicator of the accuracy required for such systems. In other words, understanding the status of the installation point of the road inspection system is indispensable for determining the required accuracy of the system. In addition, it is expected that these results will assist local governments in their efforts to introduce the inspection system.
This paper is organized as follows. We discuss the research trend regarding road inspection systems in
Section 2. Details of the GPS data and the preprocessing are presented in
Section 3. The results of road coverage analysis are discussed in
Section 4. A consolidated discussion of all the results is presented in
Section 5. Finally,
Section 6 concludes the study.
2. Road Inspection System
Road inspection work performed by local governments mainly relies on visual observation by experienced engineers. However, visual inspection methods often do not sufficiently fulfill inspection demands, owing to the time required and the lack of human resources. As a solution, methods have been developed that automatically inspect roads using special equipment, such as lasers [
19,
20,
21,
22]. Such methods are now used in the inspection of national roads and expressways. However, it is difficult for budget-constrained local governments to adopt these expensive systems. Even if they can purchase and install such a system, they often cannot continue to utilize it. Therefore, in recent years, the development of inexpensive smartphone-based measurement systems has been actively conducted. Kaiyue et al. [
23] and Bump Recorder [
24] proposed systems that use smartphones to measure the International Roughness Index (IRI), which is an important road condition indicator. Yagi [
25] proposed a method of measuring road flatness using the accelerometer of a smartphone. Casas-Avellaneda and Lόpez-Parra [
26] proposed a method that detects potholes through smartphone sensors. Mertz et al. [
27] proposed a method that uses road images acquired by smartphones mounted on vehicles to detect road surface damage using external devices.
An automated, smartphone-based road crack detection and reporting system for use by local governments was developed. The road inspection system [
28] uses smartphones mounted on vehicles to capture still images of road conditions. Through a deep learning algorithm, this system can detect and analyze road crack conditions, and determine whether the detected cracks need (or do not need) to be repaired. The system has already been tested by several local governments and is being considered for implementation [
29].
3. Methodology
3.1. Overview
Although a smartphone-based road inspection system is less expensive than methods requiring specialized devices, it is not helpful to install the system on all public vehicles without a logical basis. First, in this study, we analyzed the entire usage of a public vehicle using GPS data acquired from the vehicle and evaluated its potential as an installation vehicle for the road inspection system. Next, we analyzed the use of road patrol cars and investigate the current road inspection area and frequency. Finally, we analyzed whether road patrol cars could be replaced by other public vehicles and estimated the minimum cost for the replacement.
We cannot obtain sufficient knowledge of public vehicle usage by analyzing data from only one local government. Therefore, in this study, we analyzed the trends of public vehicle usage in multiple cities of similar sizes. Therefore, we believe that this research contributes to the understanding of common trends in local governments. In addition, this research will also contribute to the development of road inspection systems. Because the accuracy of road inspection systems is inferior to that of visual inspection, installing the systems only in road patrol cars will reduce the accuracy. Therefore, it is necessary to install the systems in other vehicles and to interpolate the accuracy. In other words, it is important to understand the current visit frequency as well as the road coverage area of road patrol vehicles. This understanding provides an indicator for determining the required accuracy or current usefulness of road inspection systems to researchers of road inspection systems. In addition, this study assumed the use of the road inspection system for daily road inspections by local governments. Therefore, special inspection protocols during snowfall or disasters, such as typhoons and earthquakes, were not considered.
3.2. Study Area
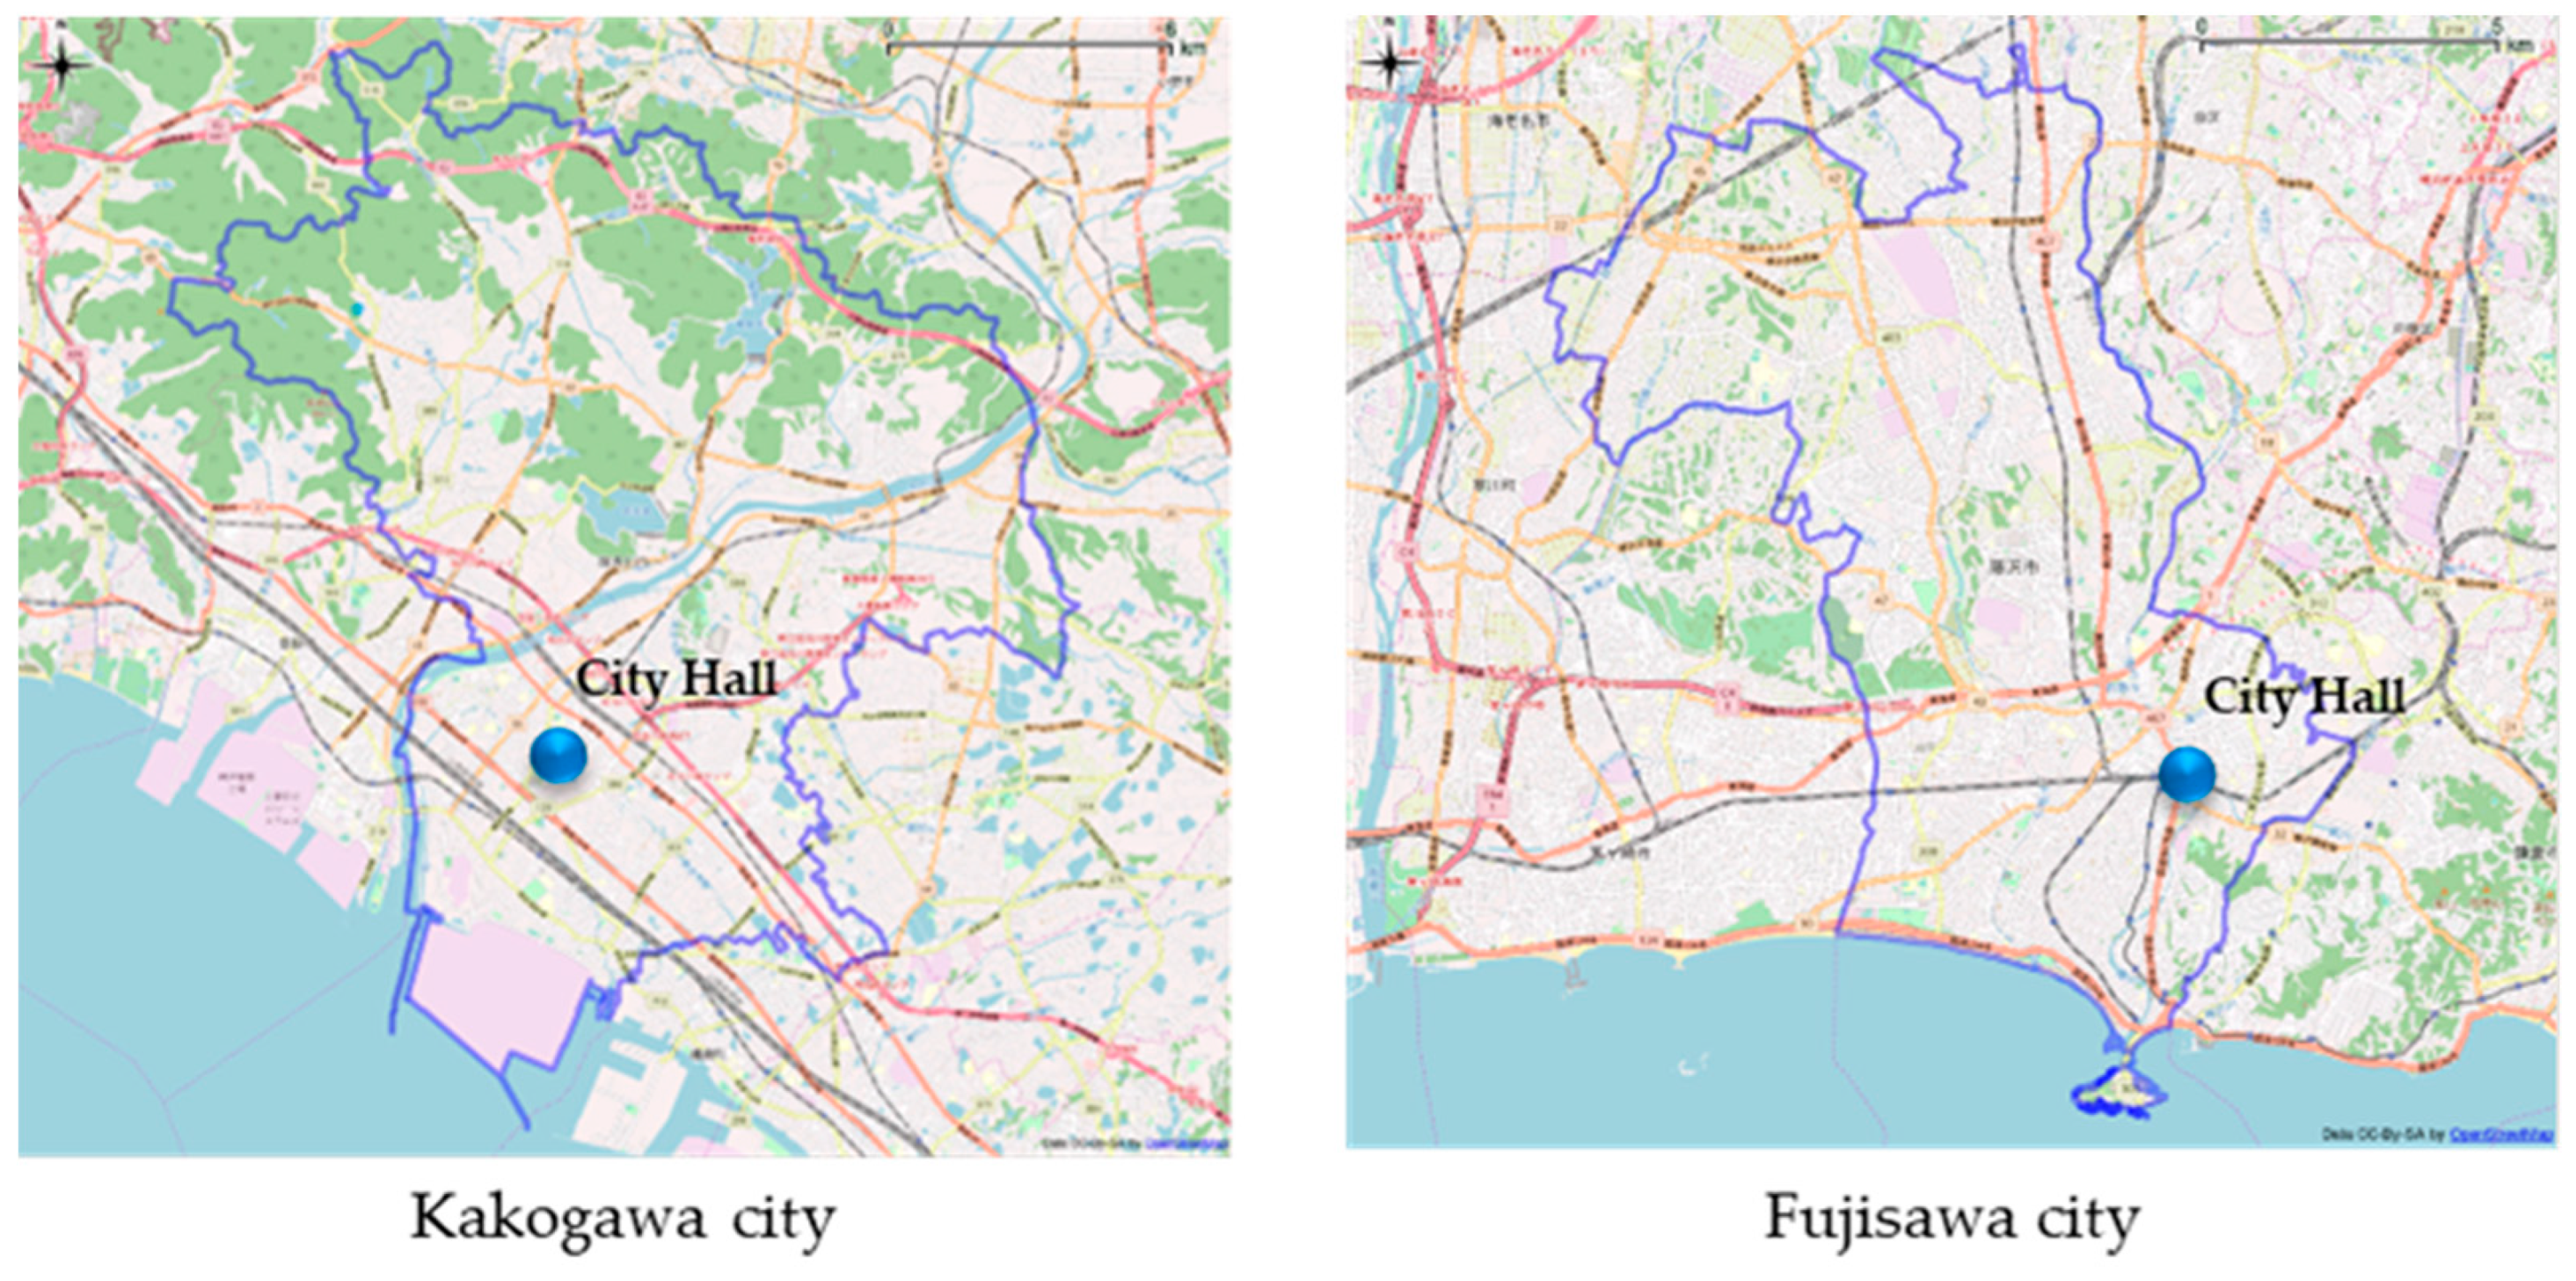
There are approximately 1,700 local governments in Japan. In this study, two medium-sized cities were used as the study areas: Kakogawa city, located in Hyogo Prefecture, and Fujisawa city, located in Kanagawa Prefecture. Roads in Japan are classified into national roads, prefectural roads, and municipality roads. Of these, only municipality roads, which each city is responsible for maintaining, were the subject of this study. The population of Kakogawa City was 266,433 as of September 2016, and the total length of municipality roads was approximately 1000 km. The population of Fujisawa city was 429,317 as of April 2018, and the total length of municipality roads was approximately 1300 km.
Figure 1 and
Table 1 show the study areas in the two cities. The city halls are located in the most densely populated areas of the cities.
3.3. GPS Data
The study utilized GPS data recorded between 2015 and 2017. This GPS data were collected as part of the “working car project,” a research project commissioned by the NICT. This NICT project installed GPS devices, such as smartphones and OBD II (On Board Diagnosis second generation) devices, in public vehicles of both cities and monitored their movements. The GPS log was recorded in one-second intervals every day. We installed the GPS devices in 171 public cars in Kakogawa city and 128 public cars in Fujisawa city.
Table 2 shows the number of vehicles and different types in both cities.
School buses are vehicles used to transport kindergarten children. City patrols are patrol vehicles for voluntary crime prevention, operated by the local government, and are not police vehicles. Cargo vans are small freight vehicles that are often used as passenger cars. Passenger cars are regular vehicles. Garbage collectors are specialized vehicles used for garbage collection. Shuttle buses are vehicles used for transportation to hospitals and welfare facilities. Special vehicles are vehicles with special functions, which are used for road repairs and various surveys. In Japan, school buses, garbage collectors, and shuttle buses are being outsourced to private companies, and the number of vehicles owned by local governments is currently decreasing.
Note that GPS devices were not installed on all public vehicles. Especially for ambulances and firefighting vehicles, GPS devices were not installed owing to privacy concerns. In addition, GPS devices were installed in garbage collectors in Fujisawa city, but not in the collectors in Kakogawa city due to the specific circumstances of the department that manages the garbage collectors. Therefore, there was a large difference in the number of garbage collectors between the two cities, as shown in
Table 2. For these reasons, it was not possible to completely analyze public vehicle usage, but it was possible to do so to the extent required for road inspection.
3.4. GPS Map Matching Process
In this study, we used link-based analysis, and needed to complete a GPS map-matching process by matching all GPS waypoints to the nearest actual road coordinates. Although many algorithms have been developed for GPS map matching [
30], we employed a simple approach that uses road nodes, because the accuracy of GPS map-matching does not significantly affect the analysis results, unlike in the case of self-driving cars and navigation. First, we obtained the waypoints from the nearest road nodes and computed a route between two nodes. Afterward, all GPS waypoint coordinates between these two nodes were moved to this route. In the map-matching process, we used Digital Road Map (DRM) [
31] data as road network data. These road network data cover a wide range of roads in Japan, from large highways to small local streets.
4. Analysis of Road Coverage of Public Vehicles
4.1. Road Coverage of Public Vehicles
We calculated the road coverage of public vehicles to understand the current usage of public vehicles.
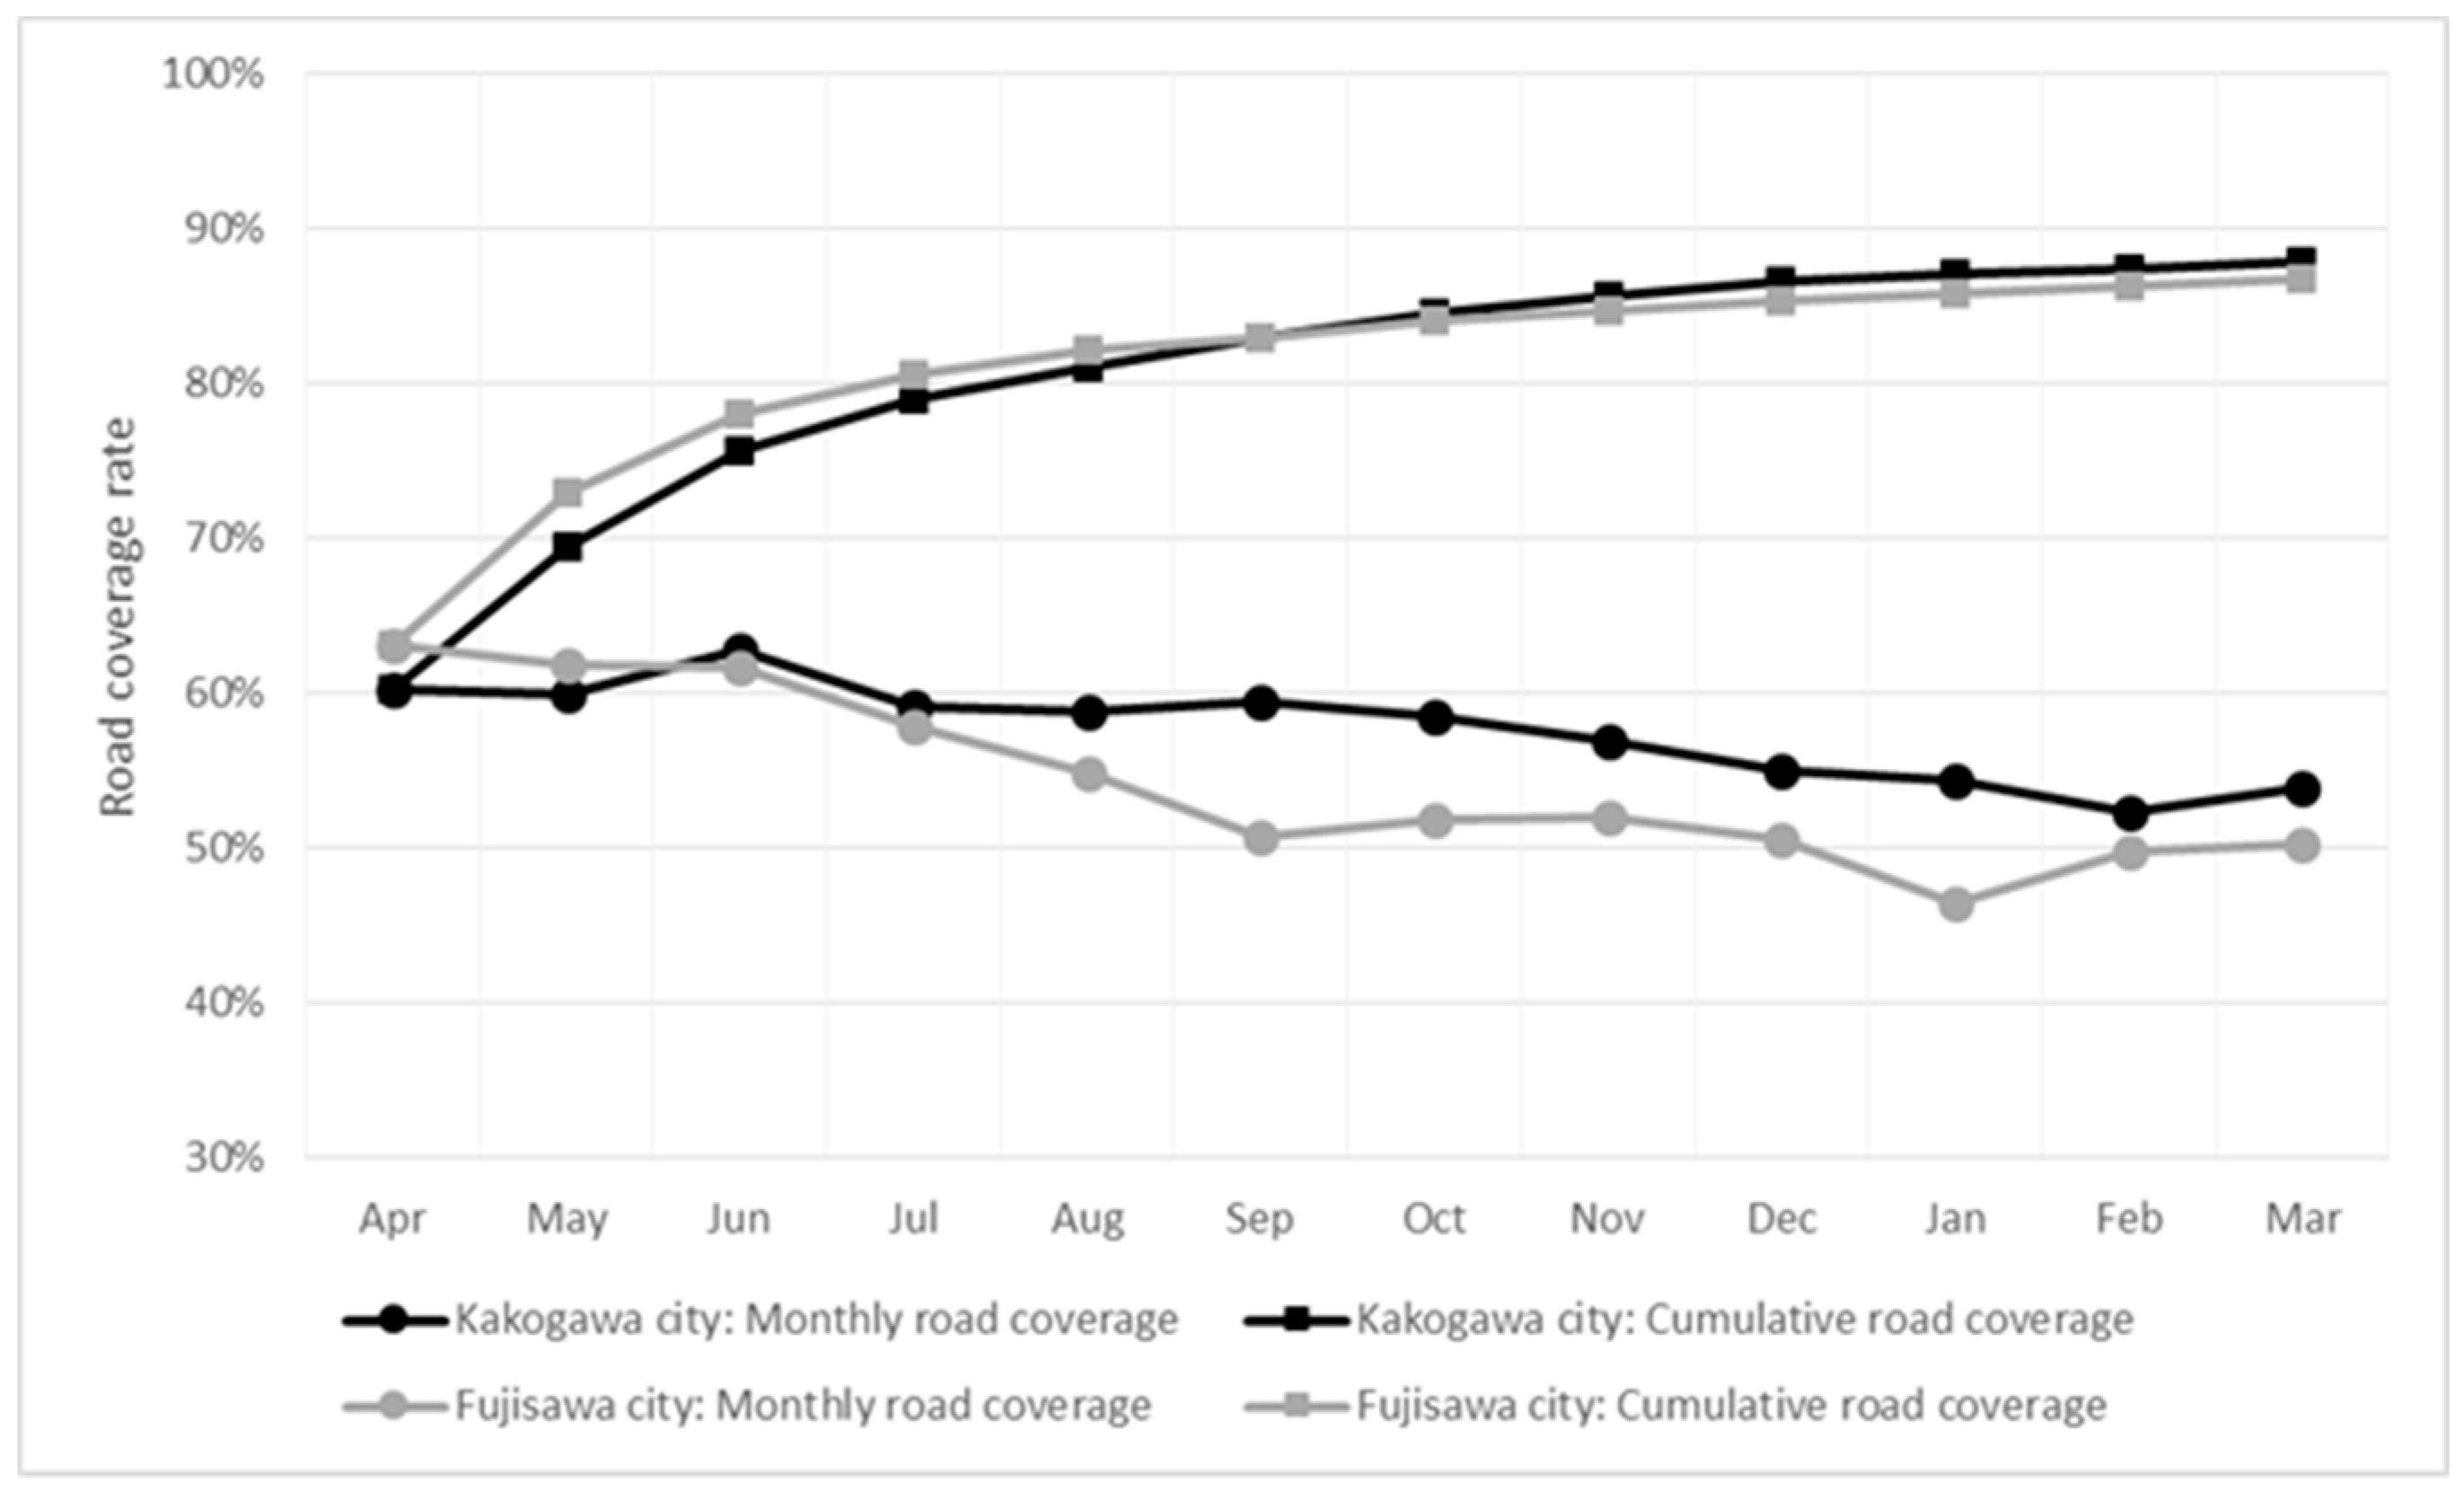
Figure 2 shows the monthly and cumulative road coverage rates of all public vehicles for both cities. The monthly value is the ratio of roads with at least one GPS log in each month to the total road distance. The cumulative value is the ratio of roads with at least one GPS log during the entire year to total road distance.
Figure 2 shows that the monthly road coverage rate of public vehicles in both cities was over 50%. Thus, as public vehicles cover a wide road area, the potential for utilizing these vehicles for road inspection is immense. In contrast, the cumulative road coverage rate reached approximately 90% in both cities. In particular, the road coverage curves for the cities exhibited similar shapes. The cumulative road coverage increased from 60% in the first month to about 80% in three months. After that, it can be confirmed that the cumulative road coverage was saturated and eventually reached about 90%.
Moreover, in Kakogawa City, the maximum monthly total distance in FY 2016 was approximately 38,000 km, and in Fujisawa City, it was found to be approximately 18,000 km. This means that public vehicles in Kakogawa City traveled approximately 35 times the total road length of municipality roads, and public vehicle in Fujisawa City traveled approximately 15 times the total road length of municipality roads. If the operation of these public vehicles can be used for road inspection, the quality of road inspection can be expected to improve.
4.2. Current Status of Road Inspection
We calculated the usage frequency and road coverage of public vehicles in order to understand the current road inspection status and the potential usage of public vehicles.
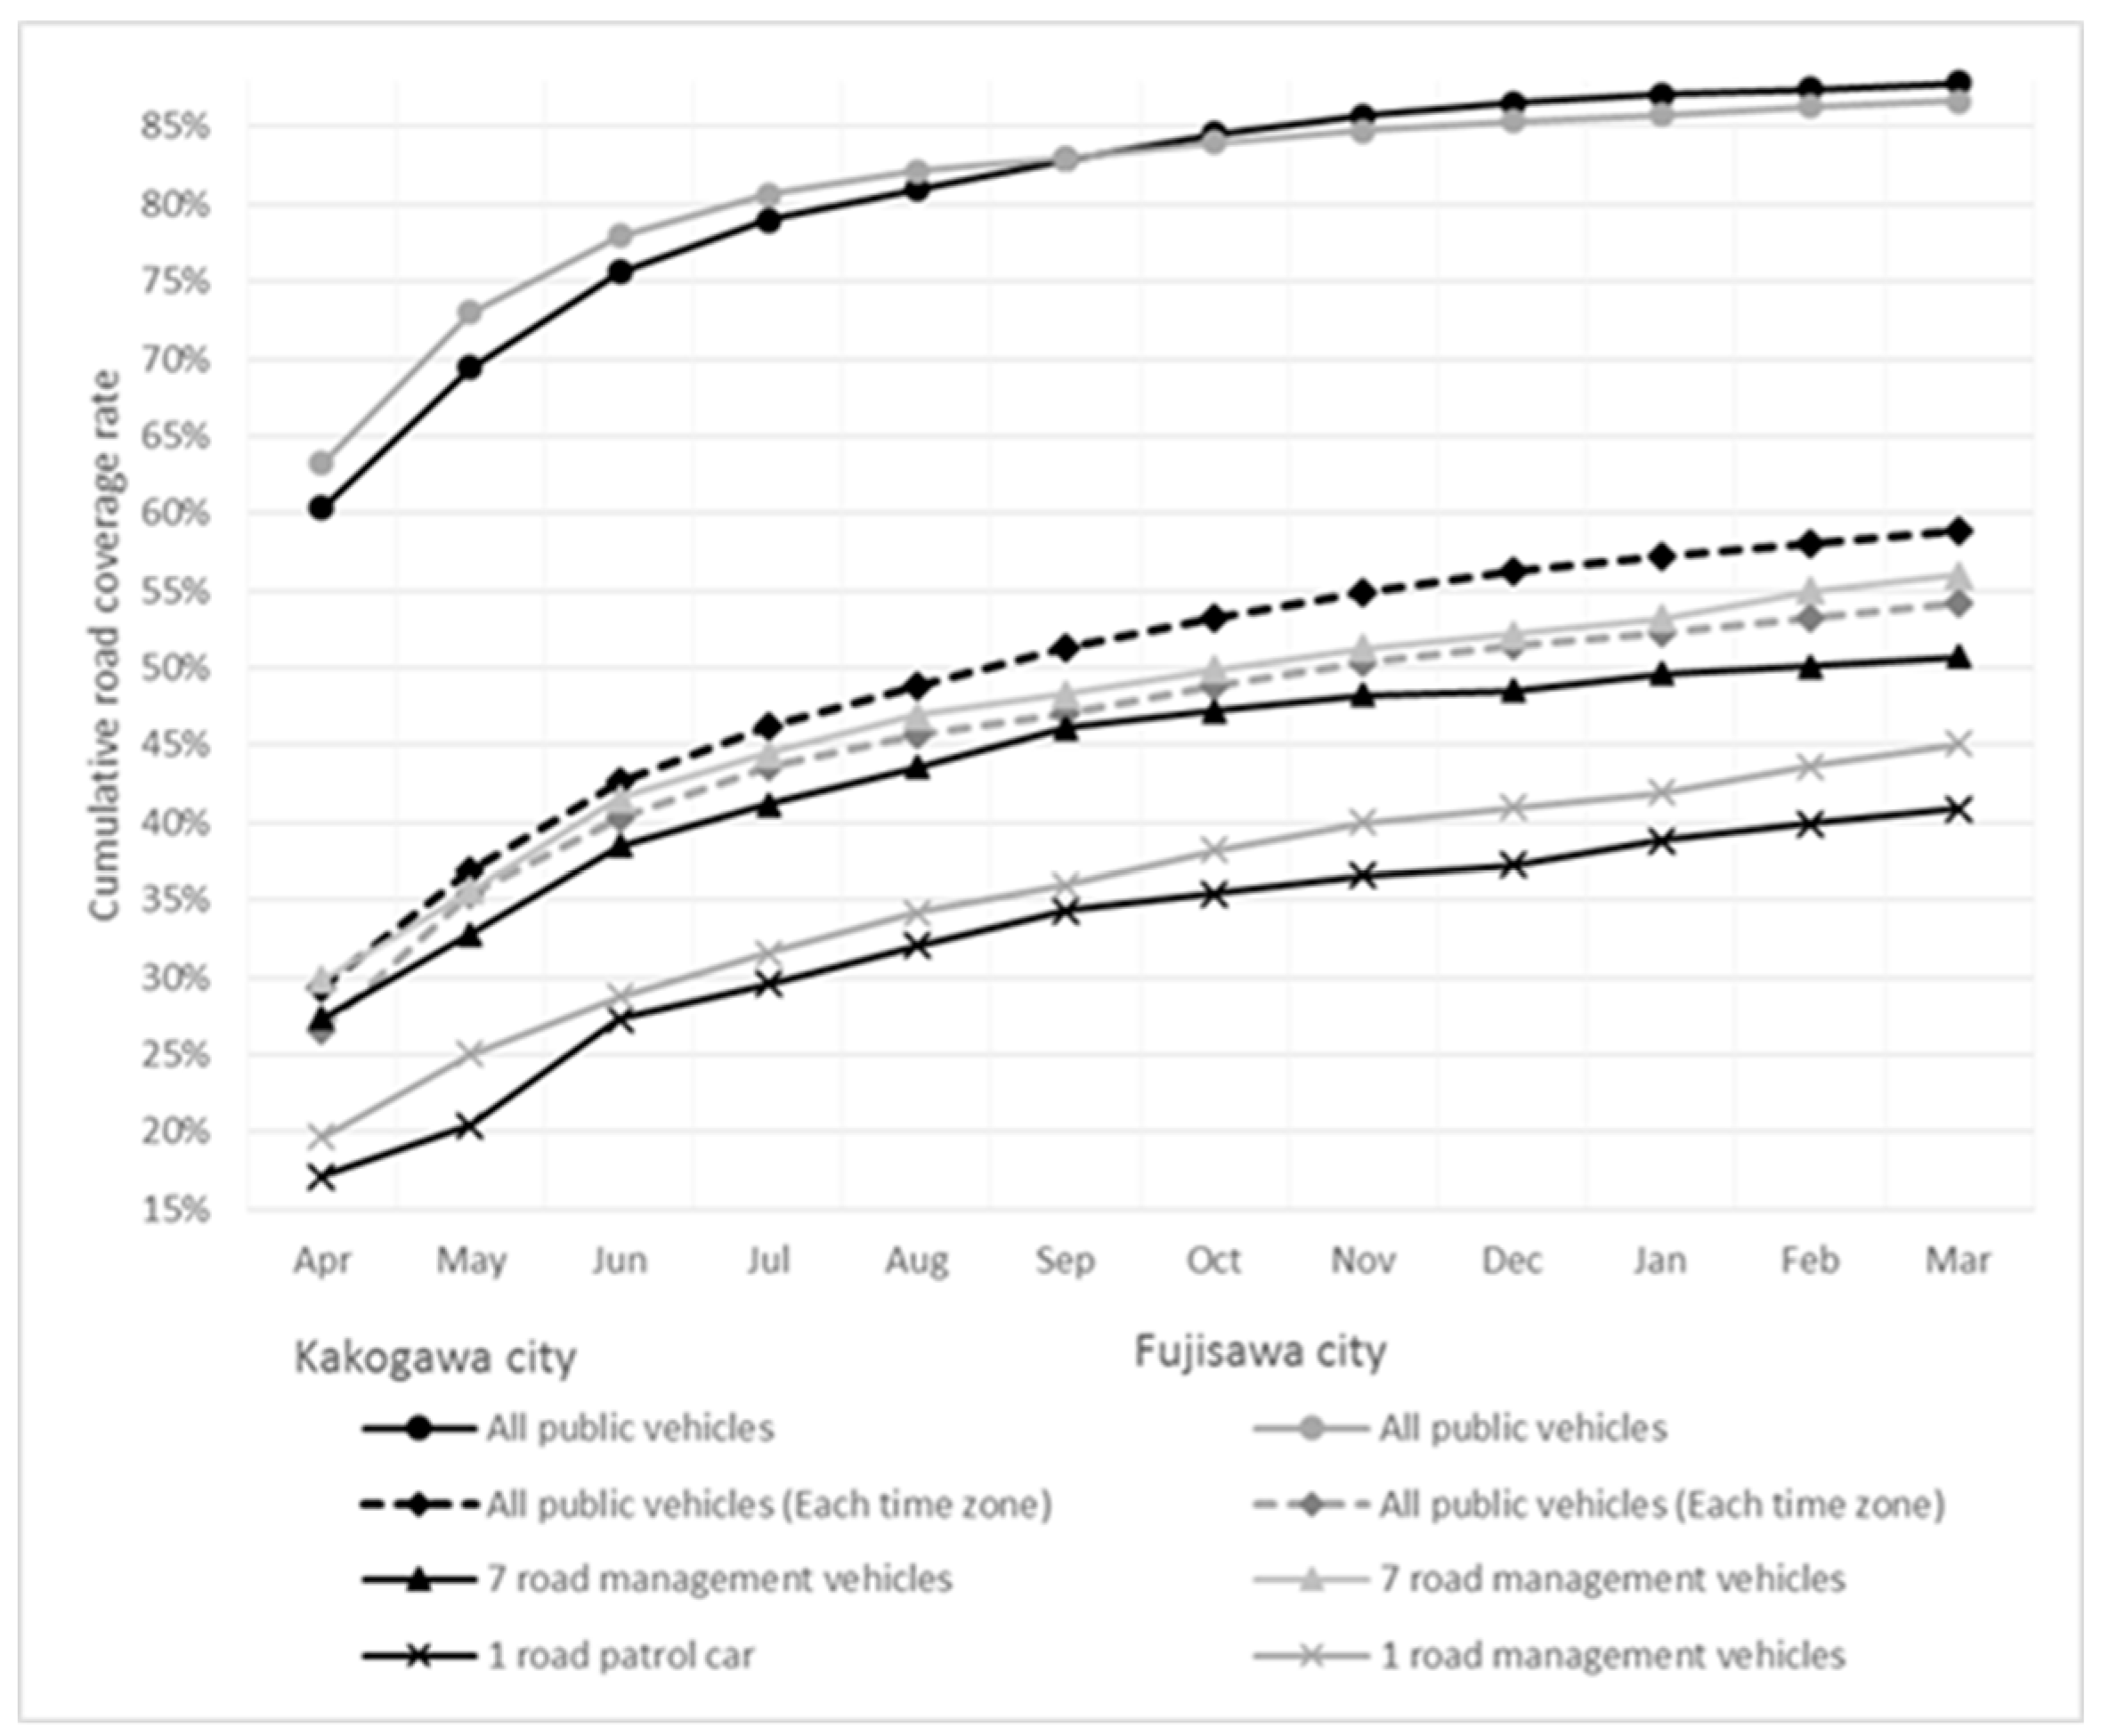
Figure 3 shows the differences between cumulative road coverage rates of public vehicles of the road management section (road management vehicles), road patrol cars, and public vehicles. The road coverage was calculated with the same definition as
Figure 2. In Kakogawa city, the GPS devices were installed in seven vehicles of the road management section, including one road patrol vehicle. In Fujisawa city, the GPS devices were also installed in seven vehicles of the road management section. However, the road coverage of the road patrol cars of Fujisawa city was not analyzed because the GPS devices failed during the survey period. Instead, the road coverage of the one public vehicle with the highest road coverage in the road management section was analyzed as reference information. Moreover, in this analysis, the road coverage value of all public vehicles (each time zone) was calculated by considering each time (eight time zones: 9 a.m.– 5 p.m.) and road combination as individual road segments. This means that one road was considered to have eight road segments. The result is shown with a dashed line in
Figure 3.
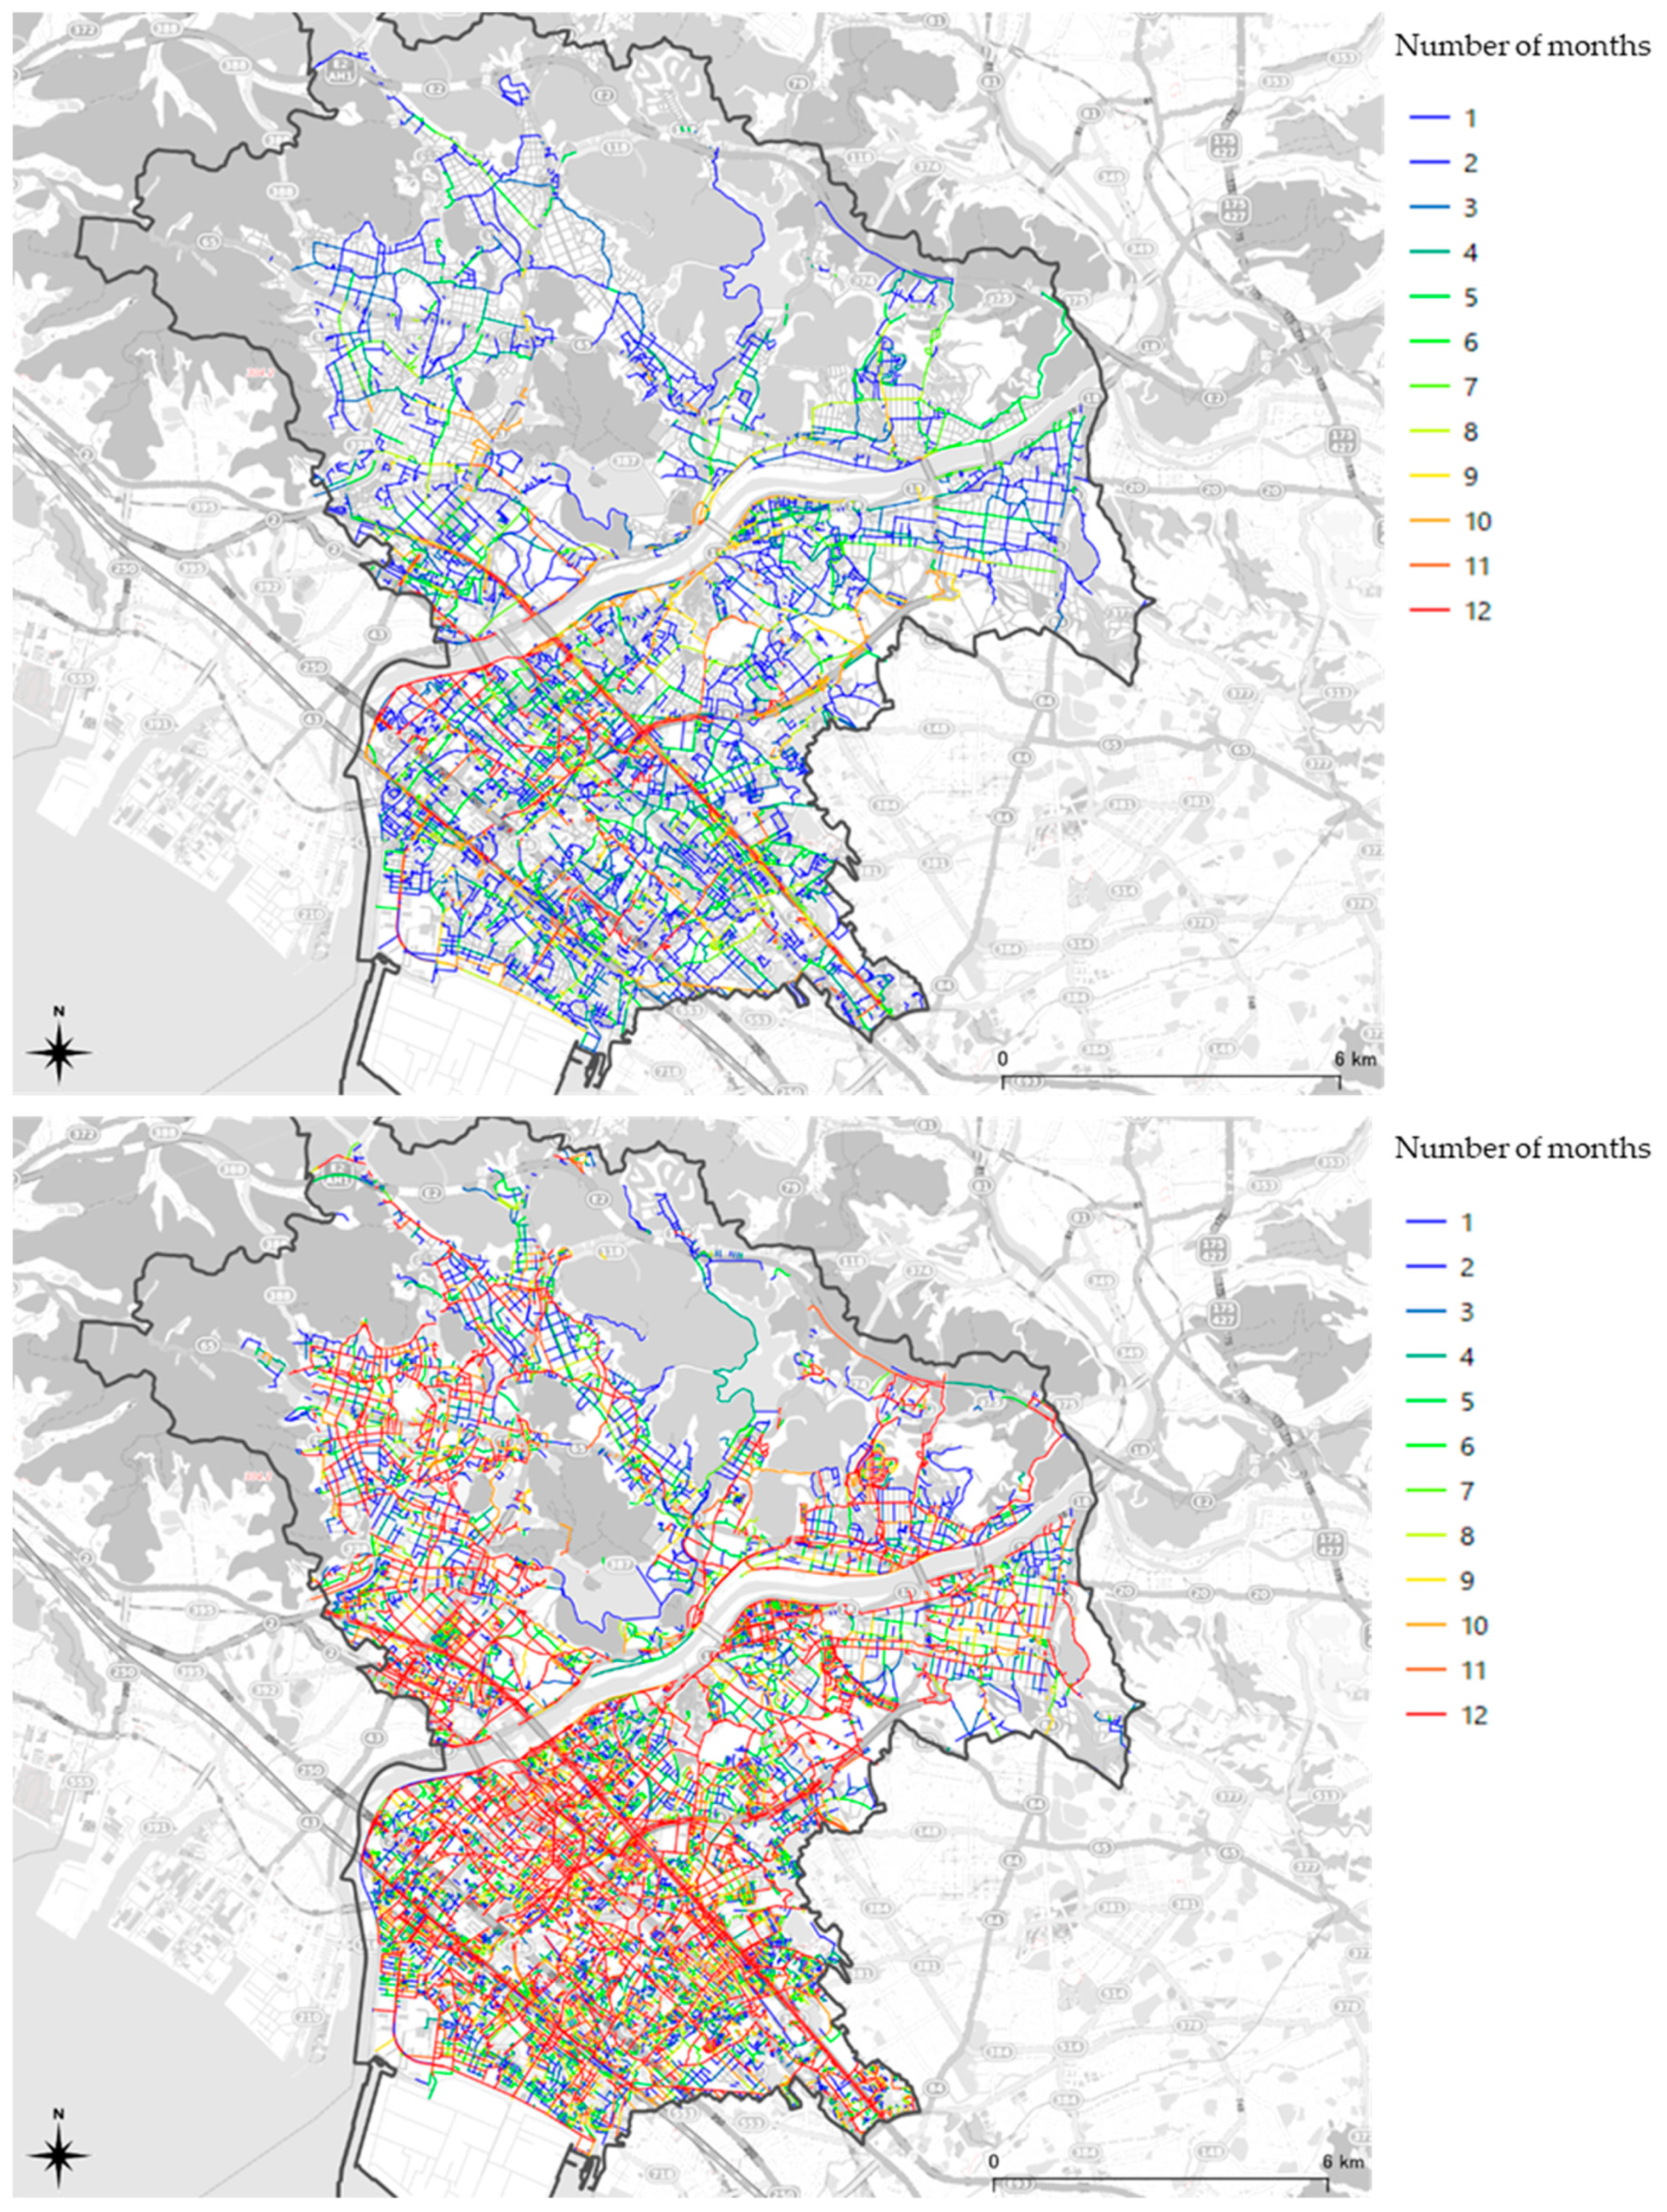
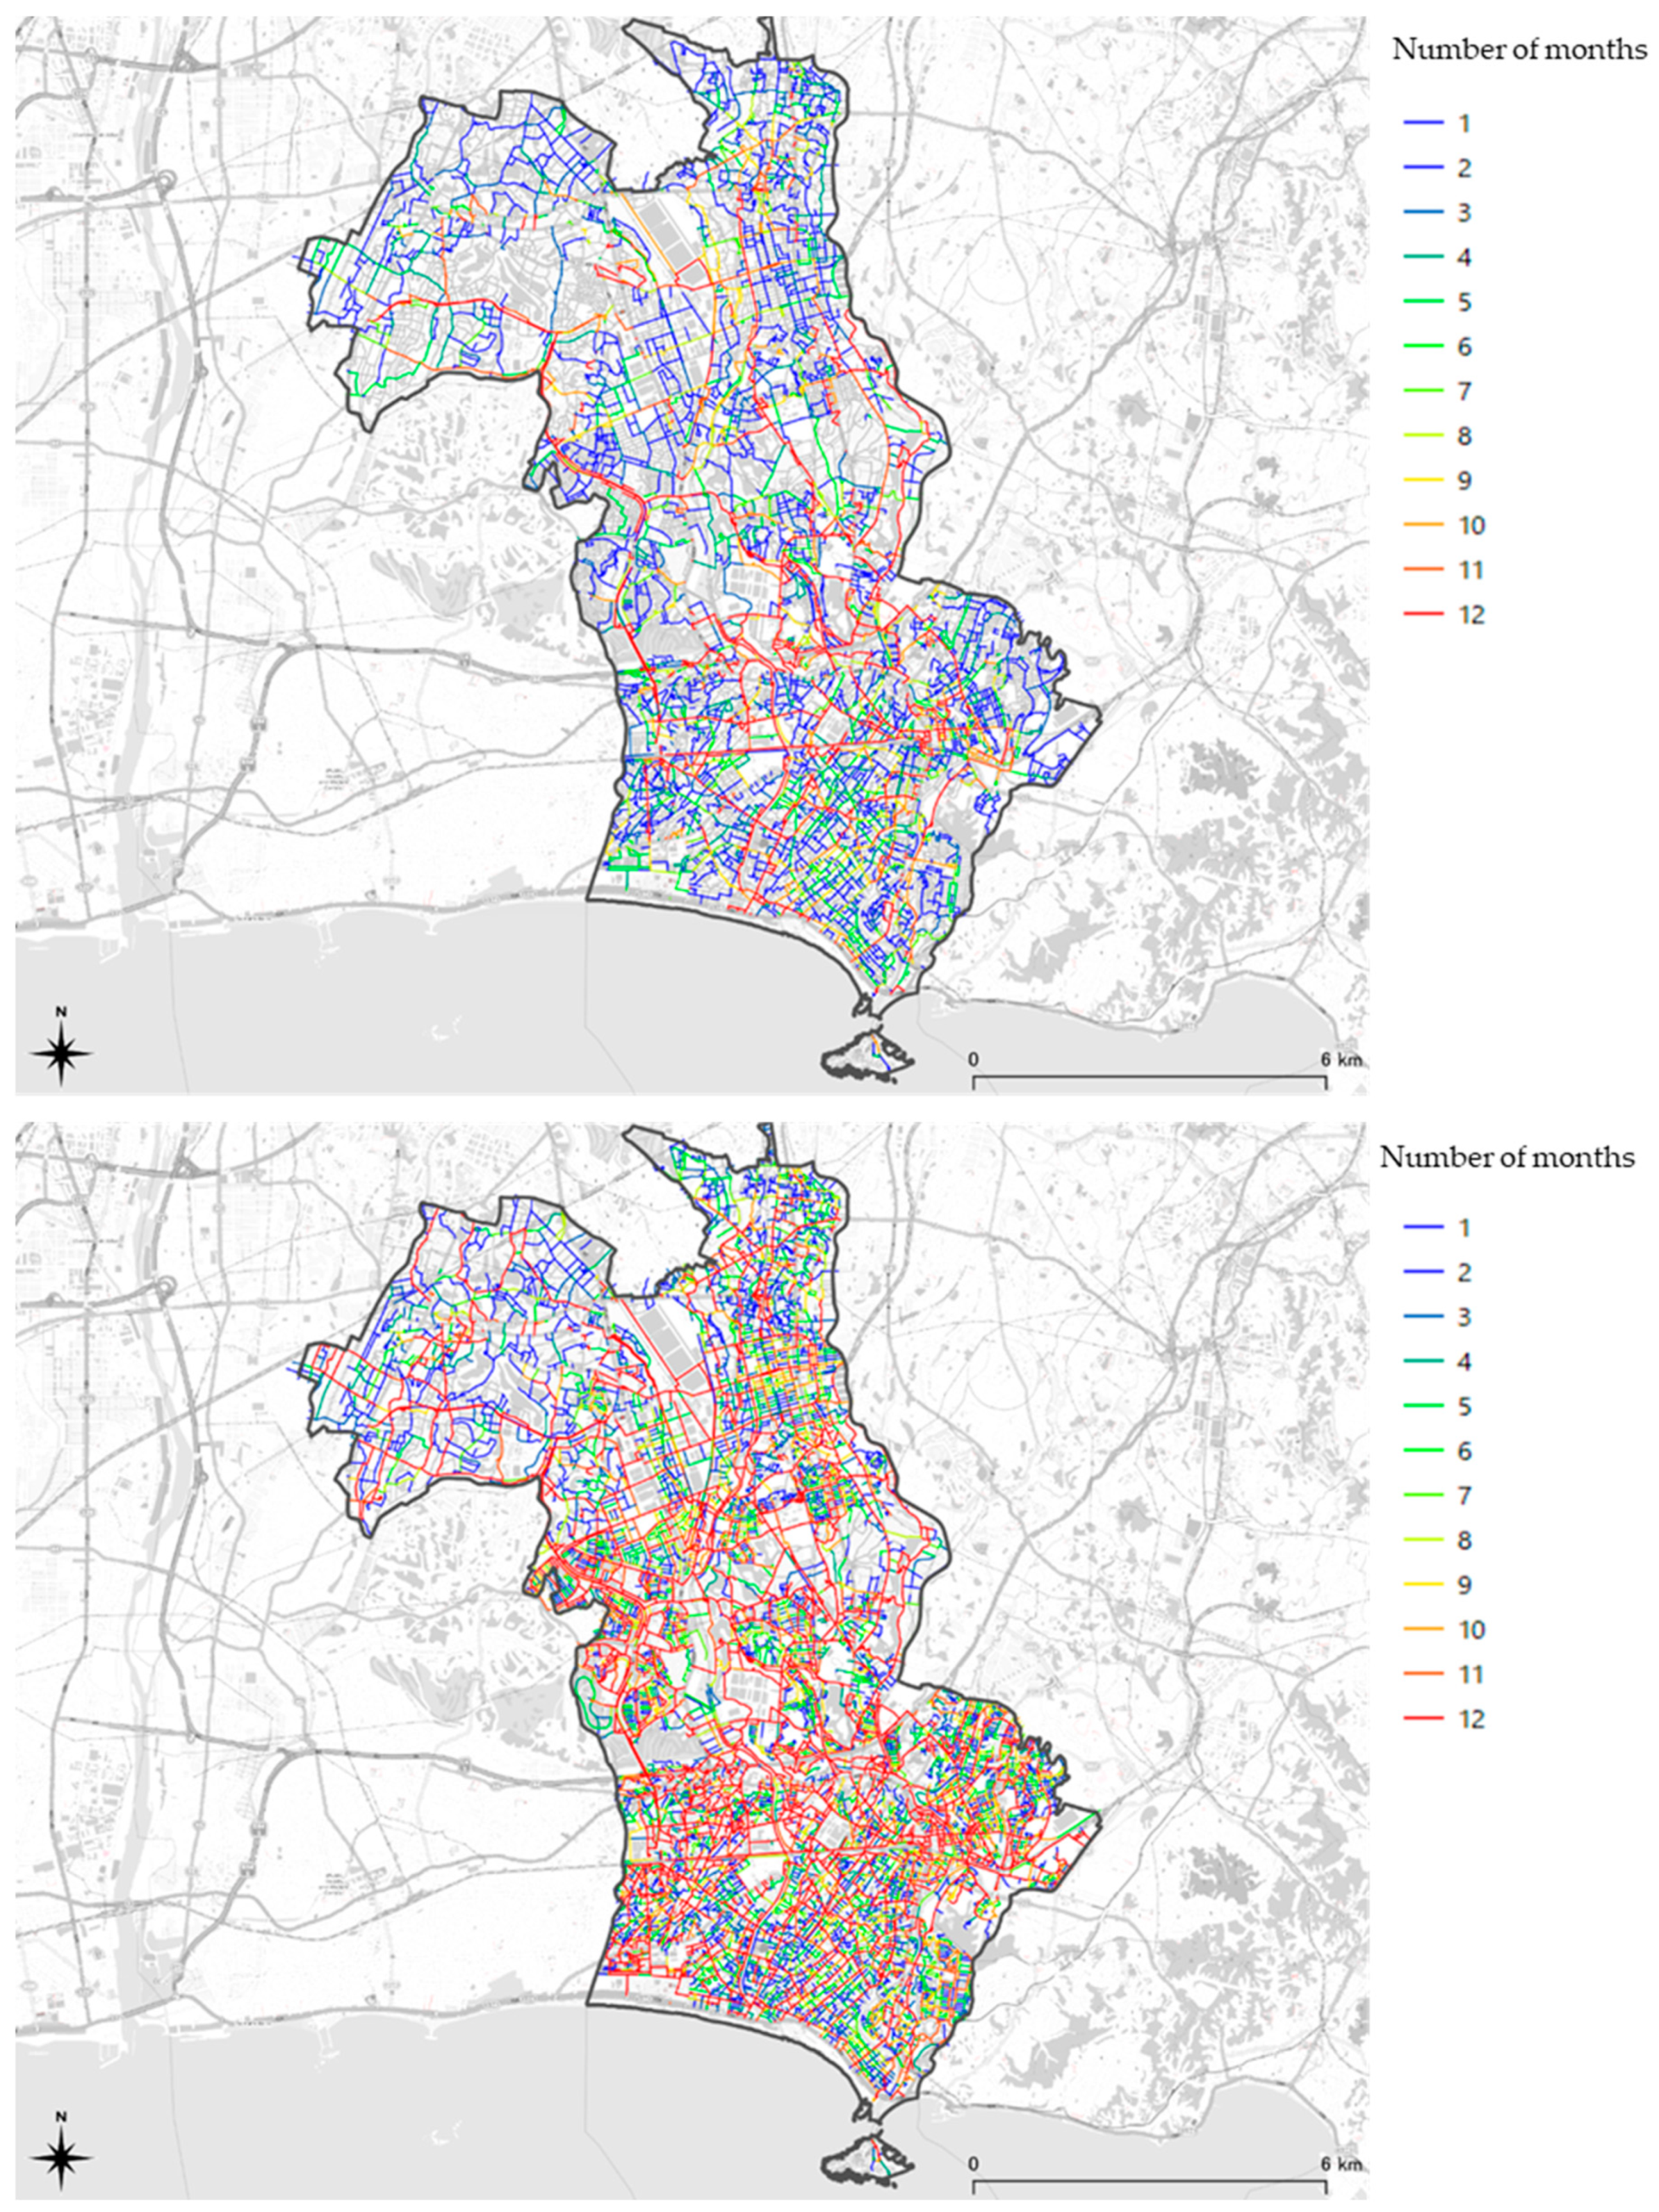
Figure 4 and
Figure 5 show the number of months the public vehicles were used over a one-year period. The graphic on the left of each figure shows the number of months road management vehicles were used. The graphic on the right shows the number of months on which all public vehicles were used, including road management vehicles. If even one public vehicle traveled on a road segment for each month, the number of months was incremented.
Figure 3 shows that the monthly road coverage by one road patrol car was less than 20%, and the cumulative road coverage rate was approximately 40%. In contrast, it can be seen that the road coverage was greatly improved if the seven vehicles of the road management sector were used. The monthly road coverage rate of the road management vehicles in both cities was over 25%, and the cumulative road coverage rate reached 50% in both cities. In reality, road patrol cars are not the only vehicles inspecting roads, so the results of road management vehicles represent the actual state of road inspections. In addition, compared with the results of all public vehicles achieved with more than 100 vehicles, from the results of road patrol cars and road management vehicles, it can be seen that a high road coverage was achieved with a small number of vehicles.
Moreover, similar to the results of all public vehicles, it can be seen that the cumulative road coverage curves of road management vehicles for both cities exhibited similar shapes. However, the road coverage of road management vehicles did not saturate for a certain period, and the coverage increased throughout the year, which is different from the results of all public vehicles. This is an interesting result and a common characteristic in both cities.
As another finding from
Figure 3, the results in terms of the time zone show that only 50% of roads in all time zones can be covered in one year. This means that more vehicles are needed to detect road events that change over time.
Figure 4 and
Figure 5 show that the road management vehicles cover the entire city for both cities. However, the number of visits on most roads was less than six (blue), which indicates that road inspections were conducted less than once every two months. In contrast, when all public vehicles in both cities were considered, the graphic on the right of each figure shows that the number of visits on most roads was more than six (green or red). Thus, utilizing public vehicles for road inspection service has immense potential. If public vehicles other than road management vehicles are used for road inspections, it is expected that overall road inspection quality will improve dramatically.
4.3. Alternative to Road Management Vehicles
By introducing the road inspection system to public vehicles, if other public vehicles can play the role of road management vehicles, the maintenance cost for the road patrol cars can be reduced. In this section, we analyzed the minimum number of public vehicles (nonroad management vehicles) covering the inspection range of road management vehicles. We selected the public vehicles in descending order of average monthly road coverage until the total road coverage covered the road inspection area of road management vehicles. Of course, more accurate selection of public vehicles can be performed by combinatorial optimization of the road coverage. However, because we did not want such accuracy, we used the vehicle selection method described the above. As a result, the minimum number of public vehicles that cover the road inspection area and the road coverage of the selected public vehicles were calculated. Here, as a precondition, we targeted the road segments that the road management vehicles inspect at least once every two months. In addition, in this evaluation, the accuracy of the road inspection system was not considered, and the analysis was performed on the assumption that the inspection system has the same accuracy as visual inspection.
Figure 6 shows road segments covered by road management vehicles or selected public vehicles.
In Kakogawa city, only five public vehicles can cover the road inspection area. Although the number of road management vehicles in Kakogawa city is seven, this new discovery shows that less public vehicles are required. In addition, the road coverage increased from 17% to 35%. In particular, it is clear that the coverage of areas distant from the center of Kakogawa city, such as the north and east, had greatly increased. Therefore, this result indicates that compared with current road inspection methods, more extensive road inspection can be realized. Thus, the number of road management vehicles can be reduced, and the inspection accuracy can also be improved by the introduction of a small number of road inspection systems.
In Fujisawa city, only 11 public vehicles can cover the road inspection area. Fujisawa City also has seven road management vehicles, but we found that more public vehicles than road management vehicles were needed to cover the road inspection area. However, the number of vehicles is not sufficiently large for local governments to cancel the introduction of road inspection systems. In addition, unlike Kakogawa City, the road coverage did not increase significantly (from 22% to 23%). However, considering that the number of road management vehicles can be reduced, we think that the introduction of road inspection systems is sufficiently effective in both cities.
In any case, in both cities, it was found that a small number of public vehicles can cover the road inspection area. Because the road inspection system uses only smartphones, the installation cost is relatively low. Assuming that a smartphone costs $1,000 (one inspection system), it costs $5,000 to install 5 systems in Kakogawa city and $11,000 to install 11 systems in Fujisawa city. This result indicates that it is not unrealistic for even relatively small local governments to introduce the system. In other words, it is possible to dramatically improve the quality of road inspection through an inexpensive capital investment.
5. Discussion
In
Section 4.1, we analyzed the monthly and cumulative road coverages of public vehicles in both cities. As a result, when all public vehicles in both cities were considered, the monthly coverage rate was over 50%, and the cumulative coverage rate was approximately 90%. Thus, we know that the potential for utilizing public vehicles for road inspection service is significant. Of course, it is difficult to introduce the road inspection system for all public vehicles in terms of cost. However, road inspection systems using dash cams have also been developed, and it is expected that restrictions on the number of vehicles in which the system can be installed will be eased in the near future. Moreover, it was found that the curves of the cumulative road coverage in both cities had similar shapes.
In
Section 4.2, we analyzed the usage of road management vehicles in order to learn the current road inspection status. Of course, it is possible to learn the current status by confirming with the person in charge of the road management vehicle. However, there is no record indicating which roads have been traveled or how many times a road has been traveled. First, we analyzed the monthly road coverage and the cumulative road coverage of road management vehicles in both cities. The monthly coverage rate was approximately 25%, and the cumulative coverage rate was approximately 50%. The road coverage of road management vehicles was similar for the two cities. Moreover, it was found that the curves of the cumulative road coverage of road management vehicles in both cities had similar shapes. In contrast, the road coverage curve of road management vehicles tended to increase throughout the year, and in that respect, showed a characteristic different from that of all public vehicles. Next, we analyzed the road visit frequency of road management vehicles and all public vehicles. From visual inspection, it was sufficient if the road was traveled at least once. However, road inspection systems may not achieve 100% inspection accuracy. In this case, an effective solution is to travel the road multiple times. Therefore, to determine the optimal installation requirements of the system, it is important to know the number of times a road has been traveled. As indicated in
Section 4.2, we found that in Kakogawa city and Fujisawa city, only about 50% of all roads were inspected in one year, and approximately 60% of inspected roads were inspected less than once every two months. However, we also found that more than 85% of the roads were covered by public vehicles in one year, and more than 50% of the roads were covered more than once every two months. In other words, these results indicate that the accuracy can be complemented by fully utilizing the public vehicles, even if the accuracy of the road inspection system is inferior to visual inspection. The frequency results are an important indicator for determining the demands of road inspection systems. Therefore, we think that this result will contribute to the development of a new road inspection system.
In
Section 4.3, we analyzed the minimum number of public vehicles required for road inspection. It was found that the inspection range of existing road management vehicles can be covered by only a few public vehicles: 5 in Kakogawa City and 11 in Fujisawa City. Indeed, citizen-based applications, such as FixMyStreet and SeeClickFix, can also support road inspection operations. However, it cannot be guaranteed that the current road inspection area is completely covered by such applications. On the other hand, our analysis indicate that the existing road inspection area could be covered by only a few vehicles with road inspection systems. This is important knowledge related to the cost of introducing a road inspection system. It also means that there is no need to create a special operation plan for public vehicles for road inspection in association with the introduction of the road inspection system. In other words, this result indicates that local governments already have an appropriate environment to operate road inspection systems.
We analyzed the road coverage and visit frequency of three vehicle types: Road patrol cars, road management vehicles, and all public cars. We also analyzed by each department or vehicle type, but we could not obtain knowledge shared by both cities. Of course, if GPS devices were installed in both cities’ garbage collectors, they would have obtained the common knowledge that garbage collectors cover a large area at a high frequency. However, this is easily predicted and is not a new discovery from this research. This study clarified the possibility of introducing road inspection systems into local governments in Japan by analyzing the road cover situation of public vehicles. In the process, we found that local governments of the same size shared common characteristics in terms of road coverage and cumulative road cover curves. Moreover, it was shown that using public vehicles well could lead to the introduction of a few road inspection systems that could replace existing road inspection and achieve improved accuracy. This is important knowledge for local governments considering the introduction of road inspection systems. In addition, for researchers of road inspection systems, understanding the situation of where road inspection systems will be installed is an important indicator for determining the required accuracy of the inspection system.
6. Conclusions
In recent years, smartphone-based road inspection systems have been developed, and some systems have been put to practical use. These road systems improve the quality of road inspections and reduce the effort involved, but without prior knowledge of their operation, local governments cannot consider the introduction of road inspection systems.
In this study, we used GPS data from public vehicles driven in Kakogawa city and Fujisawa city and analyzed the current usage of these vehicles. In the process, we focused on the road coverage rate and visitation frequency of public vehicles and analyzed the extent to which road inspection accuracy improves with the introduction of road inspection systems. In addition, we estimated the cost of introducing road inspection systems as prior knowledge. Although the results of this study are limited to two cities, they can serve as a reference for many municipalities aiming to introduce road inspection systems.
In future work, we will consider the optimal parameters for introducing road inspection systems in an environment with a car-sharing system developed in a previous study. We will consider the installation of an optimal measurement system on an individual-vehicle basis or departmental basis. In addition, we would like to support the comprehensive work of local governments by ways such as proposing an optimal travel route for the work. Moreover, we will solve the issues related to system operation that we revealed through this research. Generally, not all road damage is repaired immediately. Therefore, each time the vehicles with the road inspection system pass, the same road damage is detected repeatedly (i.e., many times). It is an inefficient task for road managers to check such damages individually. We thus consider it necessary to have a function that identifies a road damage detected multiple times as one road damage, and we will work on developing such a function.


