Evaluation of Replication Mechanisms on Selected Database Systems


Department of Geoinformatics, Faculty of Science, Palacky University, 17. listopadu 50, 77146 Olomouc, Czech Republic
*
Author to whom correspondence should be addressed.
ISPRS Int. J. Geo-Inf. 2020, 9(4), 249; https://0-doi-org.brum.beds.ac.uk/10.3390/ijgi9040249
Submission received: 16 March 2020
/
Revised: 12 April 2020
/
Accepted: 16 April 2020
/
Published: 17 April 2020
(This article belongs to the Special Issue Spatial Databases: Design, Management, and Knowledge Discovery)
Abstract
:This paper is focused on comparing database replication over spatial data in PostgreSQL and MySQL. Database replication means solving various problems with overloading a single database server with writing and reading queries. There are many replication mechanisms that are able to handle data differently. Criteria for objective comparisons were set for testing and determining the bottleneck of the replication process. The tests were done over the real national vector spatial datasets, namely, ArcCR500, Data200, Natural Earth and Estimated Pedologic-Ecological Unit. HWMonitor Pro was used to monitor the PostgreSQL database, network and system load. Monyog was used to monitor the MySQL activity (data and SQL queries) in real-time. Both database servers were run on computers with the Microsoft Windows operating system. The results from the provided tests of both replication mechanisms led to a better understanding of these mechanisms and allowed informed decisions for future deployment. Graphs and tables include the statistical data and describe the replication mechanisms in specific situations. PostgreSQL with the Slony extension with asynchronous replication synchronized a batch of changes with a high transfer speed and high server load. MySQL with synchronous replication synchronized every change record with low impact on server performance and network bandwidth.
1. Introduction
Replication is a process of copying and maintaining database objects [1]. The replicated databases are monitored for changes and are synchronized when a change is made [1]. Database replication makes a copy of data accessible from many various servers instead of accessing one central server, or enables many servers to behave like one (parallel query processing) [1]. Database replication is not about joining various data storages into one, which is known as a data warehouse [2,3]. Database replication creates copies of the whole database or just specific tables on a different database server, and it creates a connection between them for secure one-way or two-way synchronization [4,5]. There are typical scenarios where database replications are used, e.g., secure lower latency for long-distance communication, separate raw data storage and user data storage, secure high availability and performance. Replication mechanisms are commonly used for web applications (e.g., sensor web and WebGIS), or as georeplication for lower intercontinental latency [6,7]. Replication can be improperly considered as a mechanism for creating data backups. Nevertheless, this is not the primary function of database replications. The essence of database replication is to create a redundant, interconnected distributed environment.
Keeping all data in one database server is not recommended for many reasons: (a) keeping raw and publicly available data separate; (b) splitting processed data into specific parts for specific users and (c) keeping databases in a local place to gain low query latency [1,4].
Database replication is a means for increasing performance by the scale-out technique [8,9]. An increasing number of servers can help distribute peaks and heavy loads to many servers, which can respond to users. The replication technique can be used to decrease latency time for user requests [4,10,11].
The base unit of replication is a node, which represents one database server. A node can act as a master or as a slave server. There are no standardized names for “master” and “slave” nodes, and every company can have a different label for them, e.g., for a master these include primary, publisher and leader, while for a slave these include standby, subscriber and follower. These names can have a connection with a different type of replication logic, but most of the time the names express the same behavior of the replication process [12]. The master server should focus mainly on inserting and updating SQL statements. The slave server should work primarily on a selecting SQL statement. A minimum of two servers is required to create a replication cluster. There can be many master servers (multi-master replication) for two-way synchronization, or one master server with one or more slave servers for one-way synchronization from master to slaves [13], or there can be a master server in the standby mode. The standby server is in the offline mode and only receives changes from a master server. The standby server will be activated by the inaccessibility of the first master server (e.g., watchdog logic).
There is a typical division among replication types between synchronous vs. asynchronous and logical vs. physical replication [1,14]. Synchronous replication synchronizes every change instantly, and after confirmation by the slave server, a master server synchronizes another data change. The asynchronous replication will synchronize a batch of changes at a defined time step, e.g., one second, one minute or one day. Almost every company that creates database solutions has different replication strategies, but they can be placed into these basic categories. For example, the Oracle Database has multi-master and materialized view replication [1]; Microsoft SQL Server has the snapshot, merge and transaction replication [15]; MySQL contains statement-based, row-based and mixed-base replication [16] and PostgreSQL natively (from version 9.0) supports streaming replication. Many plug-ins and third-party software for PostgreSQL are available that can provide on-demand functionality (e.g., Slony, PgCluster and Bucardo).
Spatial data are stored in a database as a special type of attribute, e.g., geometry, shape and geography. The size of a spatial attribute varies. The shortest length is a point, while line and polygon attributes (closed line) have a length based on a count of edge points.
The selection of spatial database management (SDBMS) was established based on criteria shown in Table 1. All SDBMS support some form of database replication and the most popular and most used databases are based on these [17]. This is also the case with the Department of Geoinformatics in Olomouc, Czech Republic, which uses PostgreSQL or MySQL in most of its research projects and student classes. In addition, at the Department of Geoinformatics PostgreSQL is being used as the primary database for ArcGIS Enterprise, especially for the ArcGIS Server as data storage. PostgreSQL also uses the ArcGIS Portal by Esri (also being used at the Department). MySQL is very popular in web design (e.g., WordPress, Drupal and Wikipedia). MongoDB is the most popular NoSQL database system, which also supports storing and base-processing of spatial data (three base functions—geoIntersects, geoWithin and near). MongoDB does not have strong support in GIS desktop applications such as PostgreSQL, MySQL, Oracle and the MS SQL server.
The replication mechanism used for this experiment was Slony-I v2.2.5 as an extension for PostgreSQL and the native streaming replication for MySQL. The replication cluster included one master server and one slave server, created by PostgreSQL using the Slony extension, which enabled master–slave, asynchronous, logical, trigger-based replication. The replication cluster (one master and one slave server) for MySQL was created using native streaming master–slave, synchronous, logical, statement-based replication (SBR).
Slony uses database triggers to collect the events happening in a selected table. The selected table is configured to the publisher/subscriber technique by Slonik Execute Script [18]. In the configuration file connection info is set up to all databases in the replication cluster, and table sets that are involved in the replication process. Slony creates unique tables in PostgreSQL to maintain the whole replication process. Events (described by origin, type and parameters) are stored and queued in the “sl_event” table. Data for replication are caught by the triggers and stored in “sl_log_1” and “sl_log_2” tables. Then, there is a “localListener” thread, which periodically generates a “SYNC” event. This “SYNC” event triggers the “remoteListener” thread to start synchronization in the replication cluster.
The idea of MySQL Statement-based replication is that there are at least two identical databases where modifying statements can be executed (i.e., Insert, Update and Delete) instead of transmitting “raw” data (as Slony or MySQL row-based replication (RBR) do), with SBR transmitting just the SQL statement for modification of the database. MySQL creates a stream of SQL statements, which are completed in the master server and then are completed in the slave server [19]. MySQL uses three threads (Slony uses two) to process a replication. A “Binlog dump” thread sends binary log content from the master to the slave server. The second thread, “Slave I/O”, runs on the slave server and asks the master server to send the updates. The last thread, “Slave SQL”, also runs on the slave server and reads the logs, which were previously written by the “Slave I/O” thread, and executes the event contained in the log [20].
There are other techniques for increasing performance and robustness, such as load balancing or high availability. These three techniques are recommended for highly robust, worldwide (geo)data services [4].
There are many solutions for the evaluation of database performance such as the TPC-x (Transaction Processing Performance Council), SSB (Star Schema Benchmark) or YCSB (Yahoo! Cloud Services Benchmark). These tests evaluate the performance of databases in various ways: Number of inserts per second; response time for a number of users; or 50/50, 100/0, 0/100 reads and update tests [11,21,22,23,24]. Evaluation of the performance of the replication cluster is not just about the response time of one database, but also about the time it takes to synchronize data, the Central Processing Unit (CPU) workload, the network workload and the impact on computer resources utilization for the replication itself [13]. Criteria were set for an objective comparison of database replication of spatial data. These criteria led to results of the suitability of each replication mechanism. The main criterion was the total processing time of a replication process. The replication processes are highly reliable, with a success rate of 100%. Hence, the success rate was not considered as one of the evaluation criteria.
Using replication mechanisms is also suitable for real-time scenarios, e.g., storing and publishing data from wireless sensor networks (WSN) for the measurement of environmental conditions. These types of WSN produce a small amount of data (usually in the order of 1 bit to tens of kilobits). Using just a replication mechanism to secure data high availability to clients is highly dependent on many input requests into a database and a demanding deadline time for replication. These limits of a master database can be tested by “inserts per second” tests. Replication mechanisms are suitable for providing client accessible database (for reading) with processed data by, for example, big data techniques, stream analytics or data mining.
2. Materials and Methods
Spatial data were stored in PostgreSQL 9.5 with extension PostGIS 2.3.3 and in MySQL 5.7.19. PostgreSQL and MySQL database servers do not require any specialized hardware. They are multiplatform software servers, which use computer resources (PC, notebook, mobile phone, Apple MacOS, GNU Linux and Microsoft Windows).
The main advantages of these database servers are as follows:
- They enable storage and process of spatial data;
- They have native connectors to QGIS software;
- They are standalone solutions with a broad platform of users.
These two database servers contained an identical set of vector layers. The selected datasets are commonly used in Czech state administration. The data set contained data from ArcCR500 v3.3 (scale 1:500,000, geographic and topographic information about Czechia), Data200 (scale 1:200,000, based on EuroRegionalMap, a geographic model of Czechia), NaturalEarth v3.0.1 (scale 1:10 m, containing cultural, physical and raster categories for the whole Earth) and estimated pedologic-ecological unit (EPEU) for Olomouc region v5.1.2018 (scale 1:5000, absolute and relative production capacity of agricultural land and the conditions for its most efficient use). The spatial data were stored in databases as attribute data in standard OGC Simple Features for SQL 1.2.1. as the well-known-binary format (WKB). The statistical information about spatial layers is shown in Table 2. The layers have a different number of records ranging from 1 to 31,280 and a different number of edge points (15,092–3,725,023). These values are essential for a replication mechanism.
A master and a slave server were not installed on the machine (PC or notebook). Hence, the connection between servers was not only on the network layer (by TCP/IP network model), but the servers were interconnected through the link layer by a UTP cable. Three possible connections were set between servers: connection through a router, direct connection and software limited connection. The direct and through-a-router connections had a maximal transfer speed 100 Mbps. The limited connection had a transfer speed of 10 Mbps. NetLimiter 4 was used to monitor and limit the network speed. Currently, modern technologies are capable of operating on at least 10 Gbps transfer speed, which is the maximum capability of UTP Cat6A and Cat7. The UTP Cat8 is still under development, and it will offer 40 Gbps up to 30 meters [25]. Even mobile phones currently allow data transmission through a wireless connection from HSPA+, sometimes marked as 3.5G with a maximum speed of 10 Mbps, to 5G with a maximum speed of up to 10 Gbps [26]. A Wi-Fi connection allows standard IEEE 802.11b (publish in the 1999) communication with 11 Mbps [27]. Therefore, 10 Mbps is the lowest data transmission speed and it was used just for this experiment. This restriction of transfer speed shows the differences between replication types. The limitation of transfer speed was set for a more realistic condition where database servers do not have to be a single software or hardware solution in a network, and one hardware server can serve many software servers, which share internet bandwidth.
2.1. Server Performance
Replication performance is not just about software robustness, but also about hardware. A personal computer and a notebook were used in this study with different performances, as shown in Table 3. The replication process was tested in both of the following configurations: PC as a master server with the notebook as a slave server, and vice versa. The amount of connection influence through a 100 Mbps router, a direct 100 Mbps connection between servers, and a 10 Mbps limited connection was tested. The pre-test of replication mechanisms showed that CPU has a significant influence on some replication processes. For monitoring, a HWMonitor Pro was used, which can create a log file with results graphs of average CPU load and the load of a single core (for multi-core processors).
2.2. Testing Procedure
Two primary operations were processed with spatial data. The first operation involved updating/editing spatial geometry. The second operation was updating/editing attribute values. The main monitored criteria were CPU loads, speed of data transfer (in Mbps) and time required for the whole replication transaction. For every spatial layer, ten measurements were done for each task for each cluster configuration (PC as master and notebook as a slave and vice versa) and every network setup (with 10 Mbps limitation, connection through a router, direct connection). There was no significant change in measured values over ten measurements. Database servers run on standard Microsoft Windows 10 and Microsoft Windows 8.1, as shown in Table 3. Maximum free performance was secured during experiments for database servers (paused, e.g., Microsoft Windows Update, antivirus scan, any other software) and for monitoring software (HWMonitor Pro and Monyog).
The first task (update/edit spatial geometry) was completed in QGIS software, where a connection to the master database server was established. The whole layer was edited by moving every point or edge point in a spatial layer to a different position at the same time. The movement was random, but any movement of all edge points of the polygon layer has a significant impact on edge point coordinates in a polygon geometry. The second task (update/edit attribute values) was carried out by a pure SQL query (UPDATE epeu SET b5 = 00100 WHERE gid < 30001) in the master database. One attribute for 30,000 records was updated; this amount was chosen because lower amounts of records was updated and replicated too quickly.
3. Results
The experiment was completed for different types of replication mechanisms in different SDBMS to provide a broader perspective on replication mechanisms. The experiment confirmed that database replications were suitable for spatial data. The different approaches using PostgreSQL and MySQL show replication mechanism variability and that it can be difficult to choose the right approach for a specific case. Experimenting with different approaches highlights the advantages and disadvantages of the Slony and SBR replication mechanisms; we do not try to compare two similar approaches, e.g., Slony and RBR. The analysis resulted in several useful conclusions that can be used to gain a better understanding of spatial data replication for PostgreSQL and MySQL. These findings are described in the following section.
Firstly, the average CPU load and CPU cores’ load during replication of the EPEU spatial layer was tested. Afterwards, the transfer speed during replication of EPEU spatial layer was calculated. Finally, the replication time for other spatial layers and the average time of replication of attribute changes were calculated.
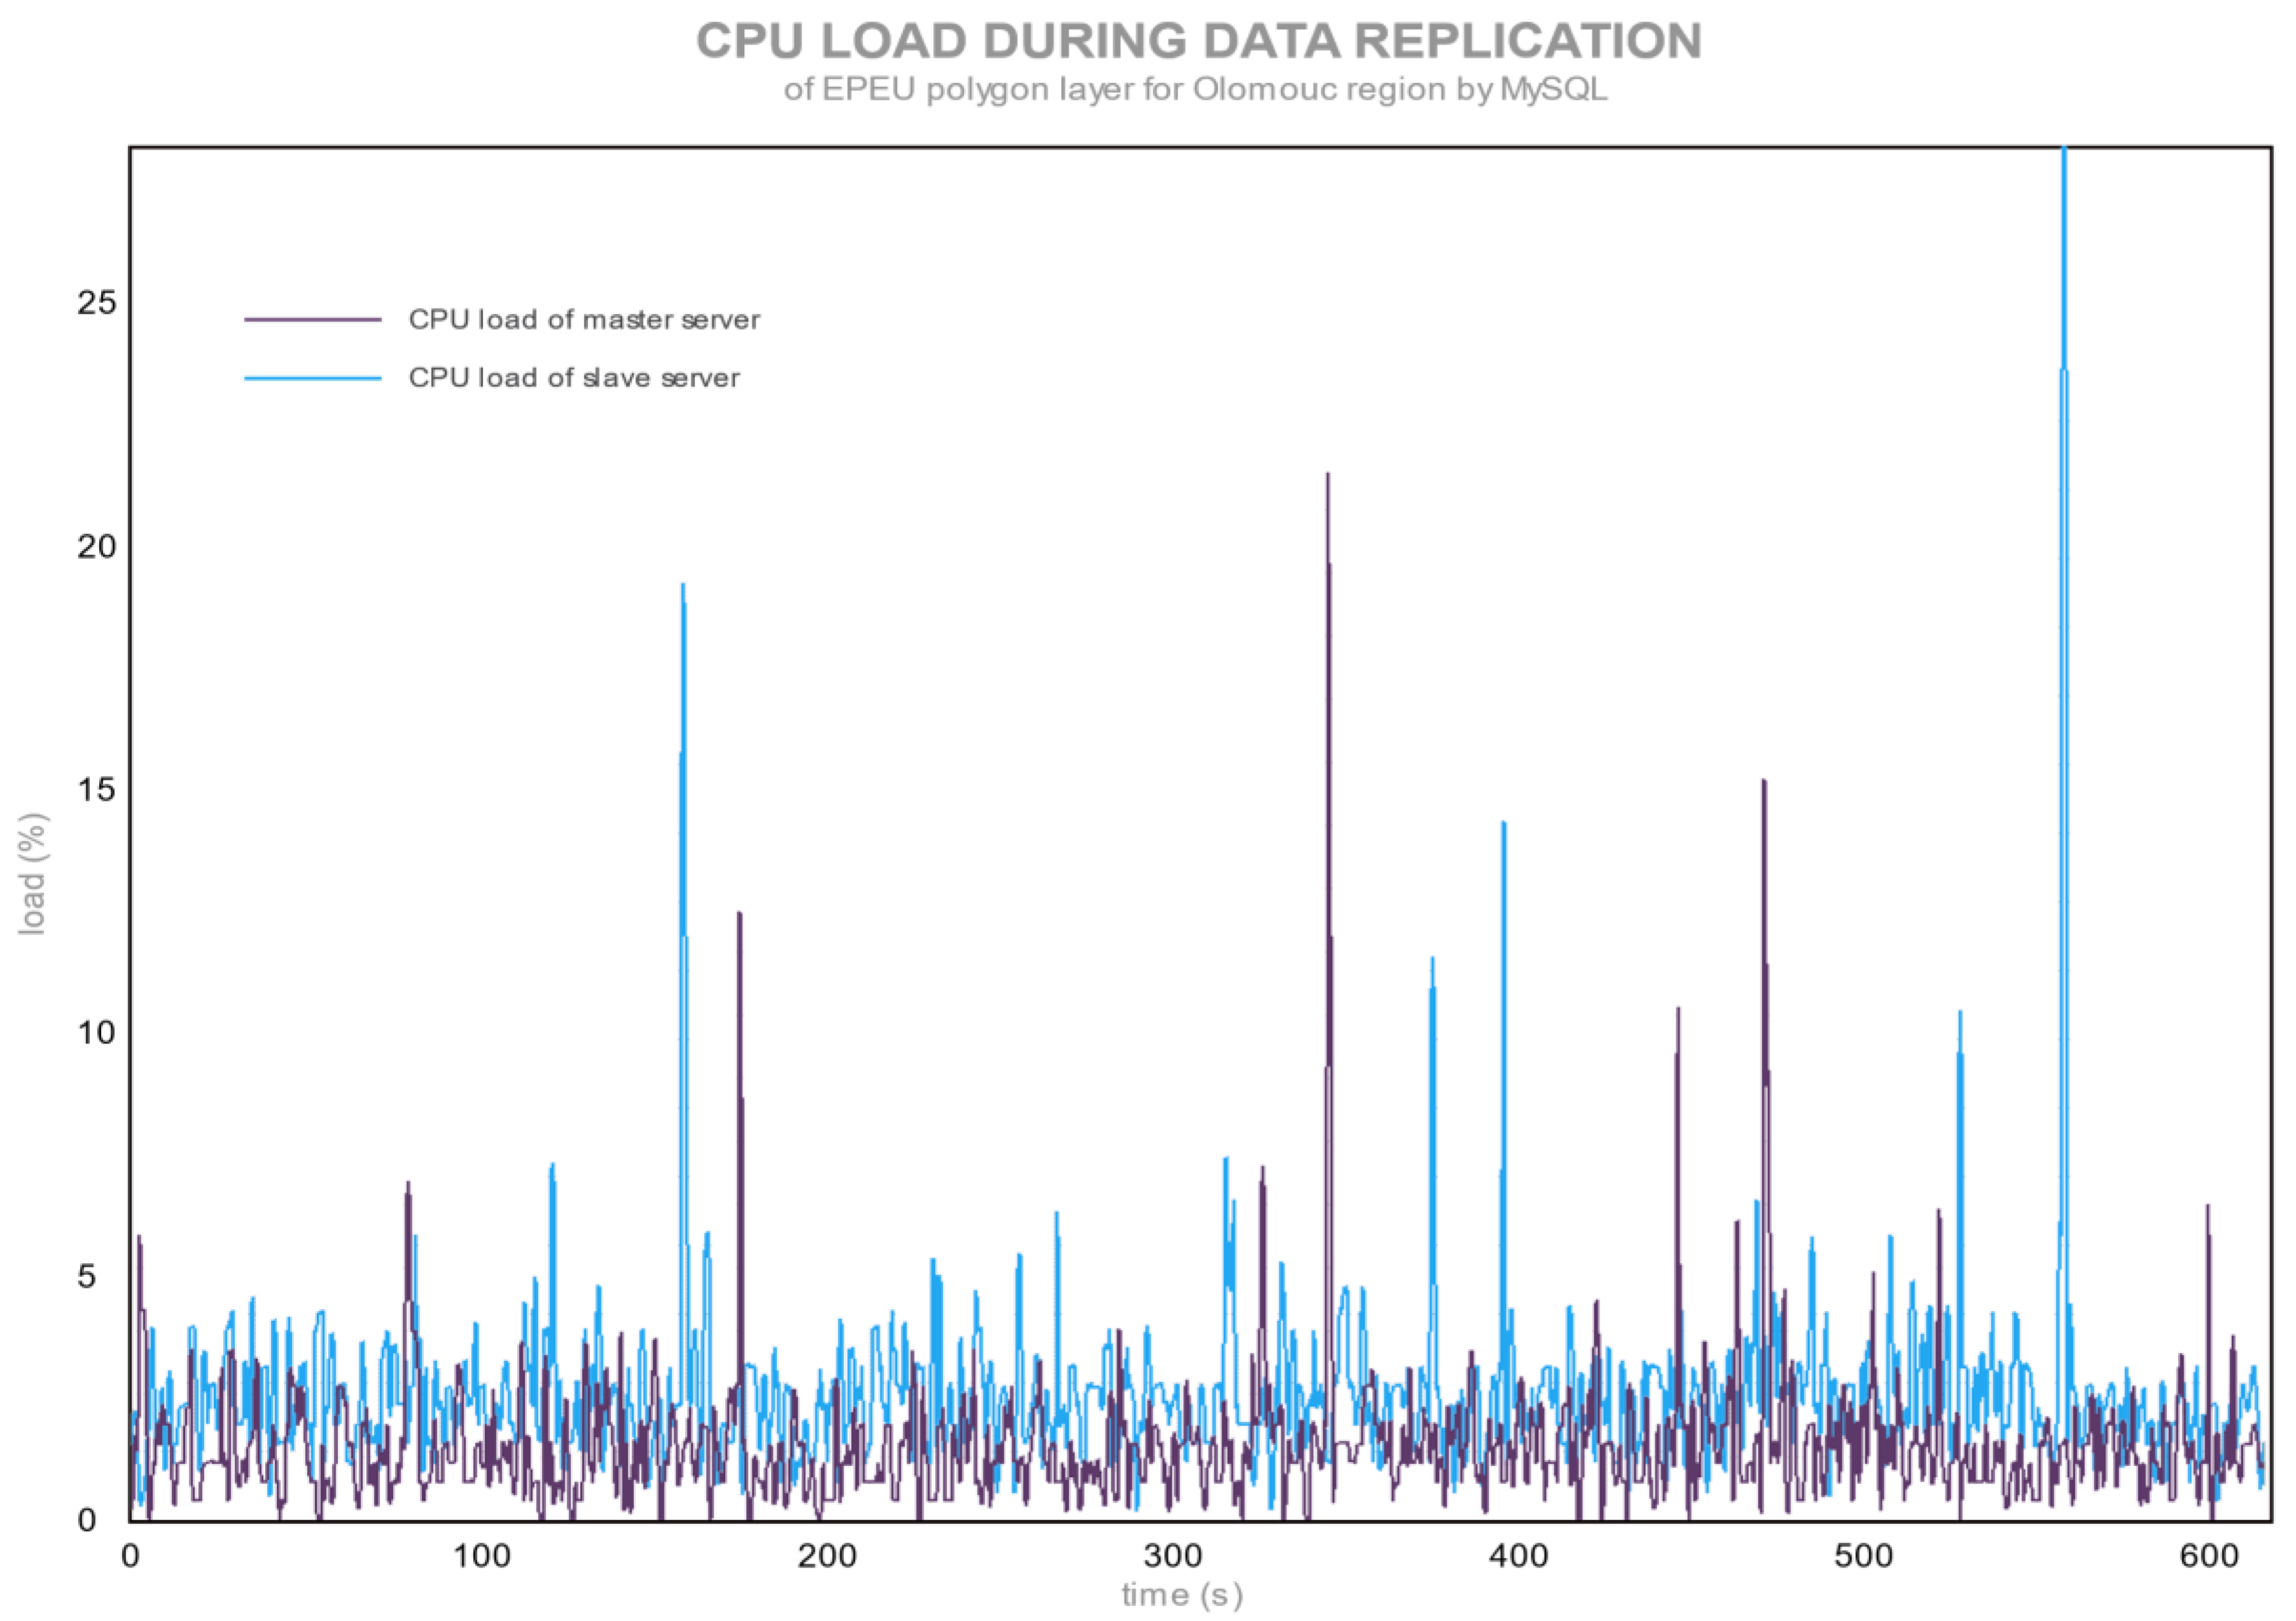
Figure 1 and Figure 2 show the CPU loads during the synchronization of changes in layer EPEU for PostgreSQL and MySQL.
The PostgreSQL database with a Slony extension (Figure 1) clearly showed Slony using asynchronous replication. Slony waits for changes to be completed in the master database and after that changes are synchronized to the slave database. MySQL uses streaming, synchronous replication; thus, every changed record (in this case, every polygon) was promptly sent to a slave server as the same modification statement, which was done in the master server (SBR replication). For PostgreSQL, a master database has an average CPU load of up to 33% at the time of storing changes into the database. PostgreSQL completes the changes in the master server first and stores all data in a table. When the master server is not resolving any changes, then Slony sends data to a slave server (middle part of Figure 1). During the synchronization of changes, the CPU is almost at an idle state. PostgreSQL is not slowed down by replication threads, which would be sending data to the slave server. This step (sending data) is done after changes in the master database are finished.
MySQL has slightly higher CPU load values than for the idle state (Figure 2). The peaks at around 30% processor loads can be a sign of the demanding SQL query or a higher number of edge points in a record. Figure 2 shows that the slave database consumes more processor power than the master database, and it was caused by the less powerful CPU. For the same task, the CPU needs more resources.
MySQL creates a statement with modification of record, and this statement is sent to the slave server in a binary log (in cooperation with three threads) almost immediately. Therefore, both servers are busy at the same time, executing the same statement. The process of changes in the EPEU polygon layer takes a longer time, but is not so demanding of CPU power.
3.1. CPU Core Load
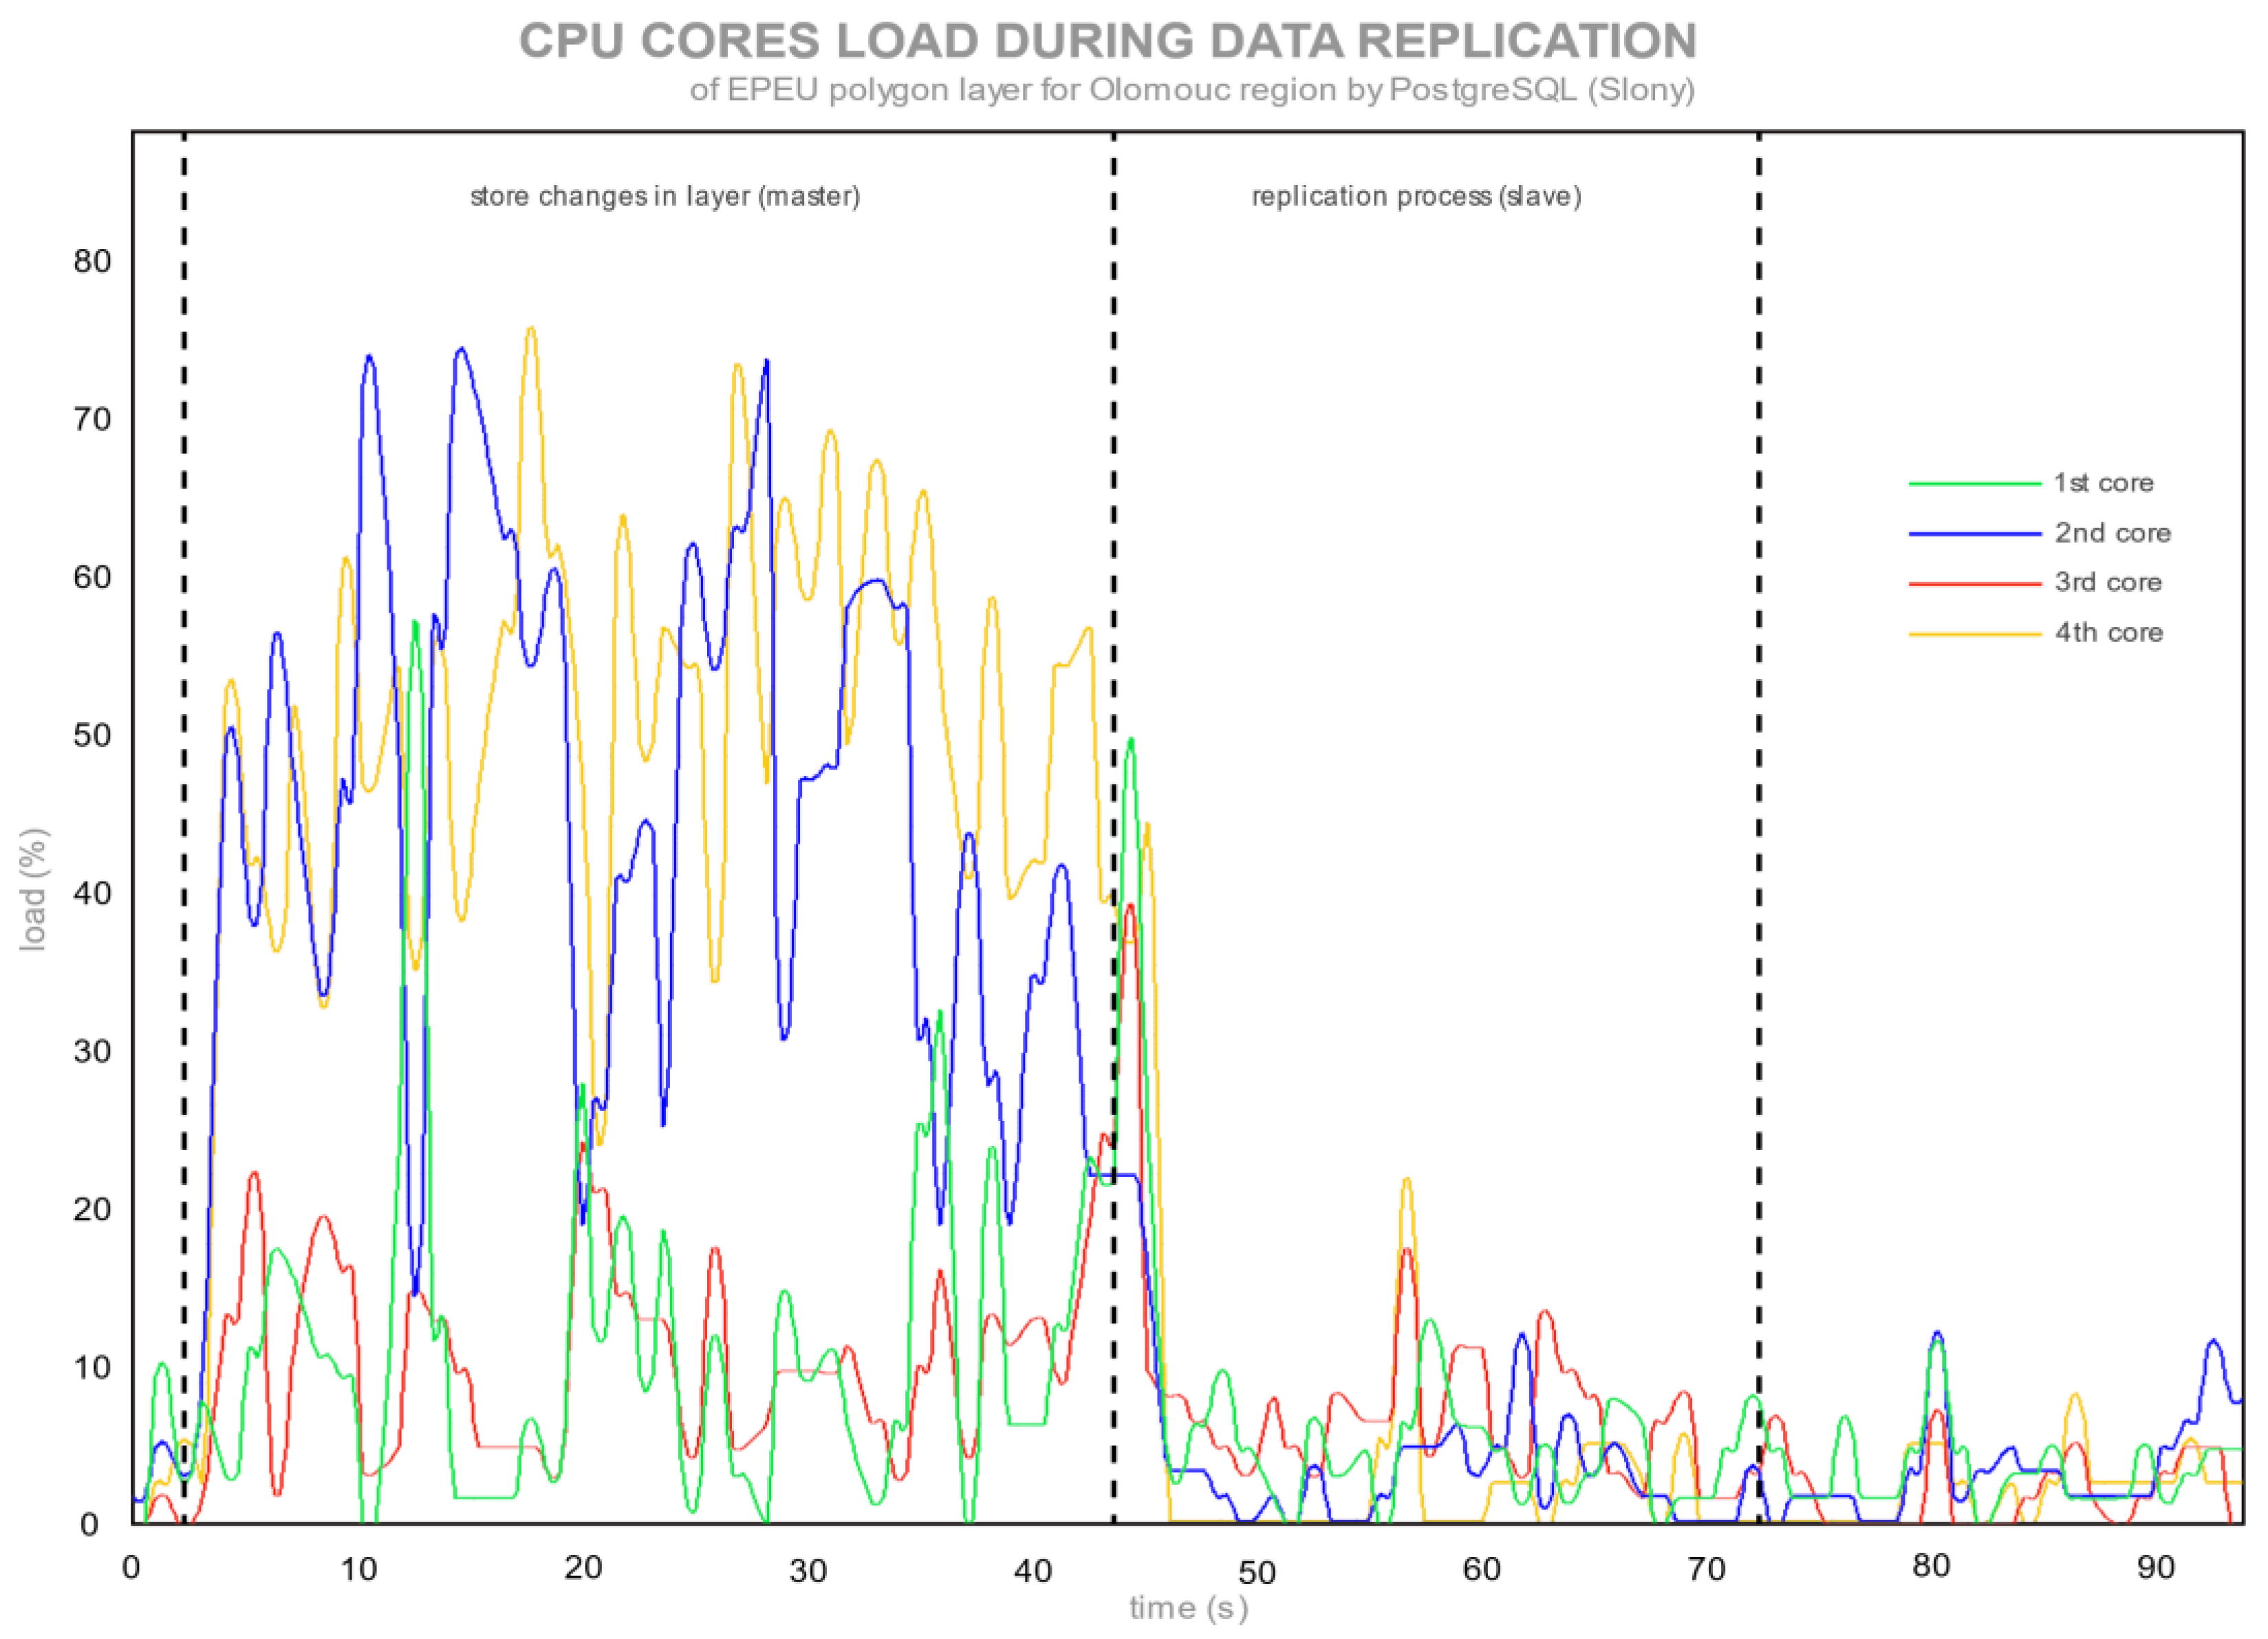
Each CPU core was monitored by the same method, as an average CPU load. A PC with four CPU cores was used as a master server for monitoring. This experiment shows how the individual cores were involved in the replication process. Figure 1 and Figure 2 show the average CPU load of the master and the slave server. Figure 3 and Figure 4 show the CPU cores of the master server during the replication process.
Figure 3 shows the loads of each CPU core during the editing and storage of data, and the subsequent replication process. The graph was divided into three parts (the same as an average CPU load in Figure 1). The first part of Figure 3 shows the loads of the second and fourth CPU core that were working on storing the edited data in QGIS. There is an assumption that the second core is using QGIS for data changes and the first core is being used to store data in the database. The middle part represents the replication process of sending binary log files by Slony thread. The third part shows the idle state of CPU after the whole replication process.
Figure 4 shows the use of CPU cores for the MySQL master server. There was no significant difference between average core loads. Every core took part in the replication process. Single-core peaks in Figure 4 are the same as in the average CPU load in Figure 2 (demanding of SQL query or a higher number of edge points in a record). The full power of CPU was not used because each modification SQL statement was sent to the slave server immediately after the trigger modification event and executed the modification statement instead of replacing data in a table (as Slony and RBR do).
3.2. Transfer Speed
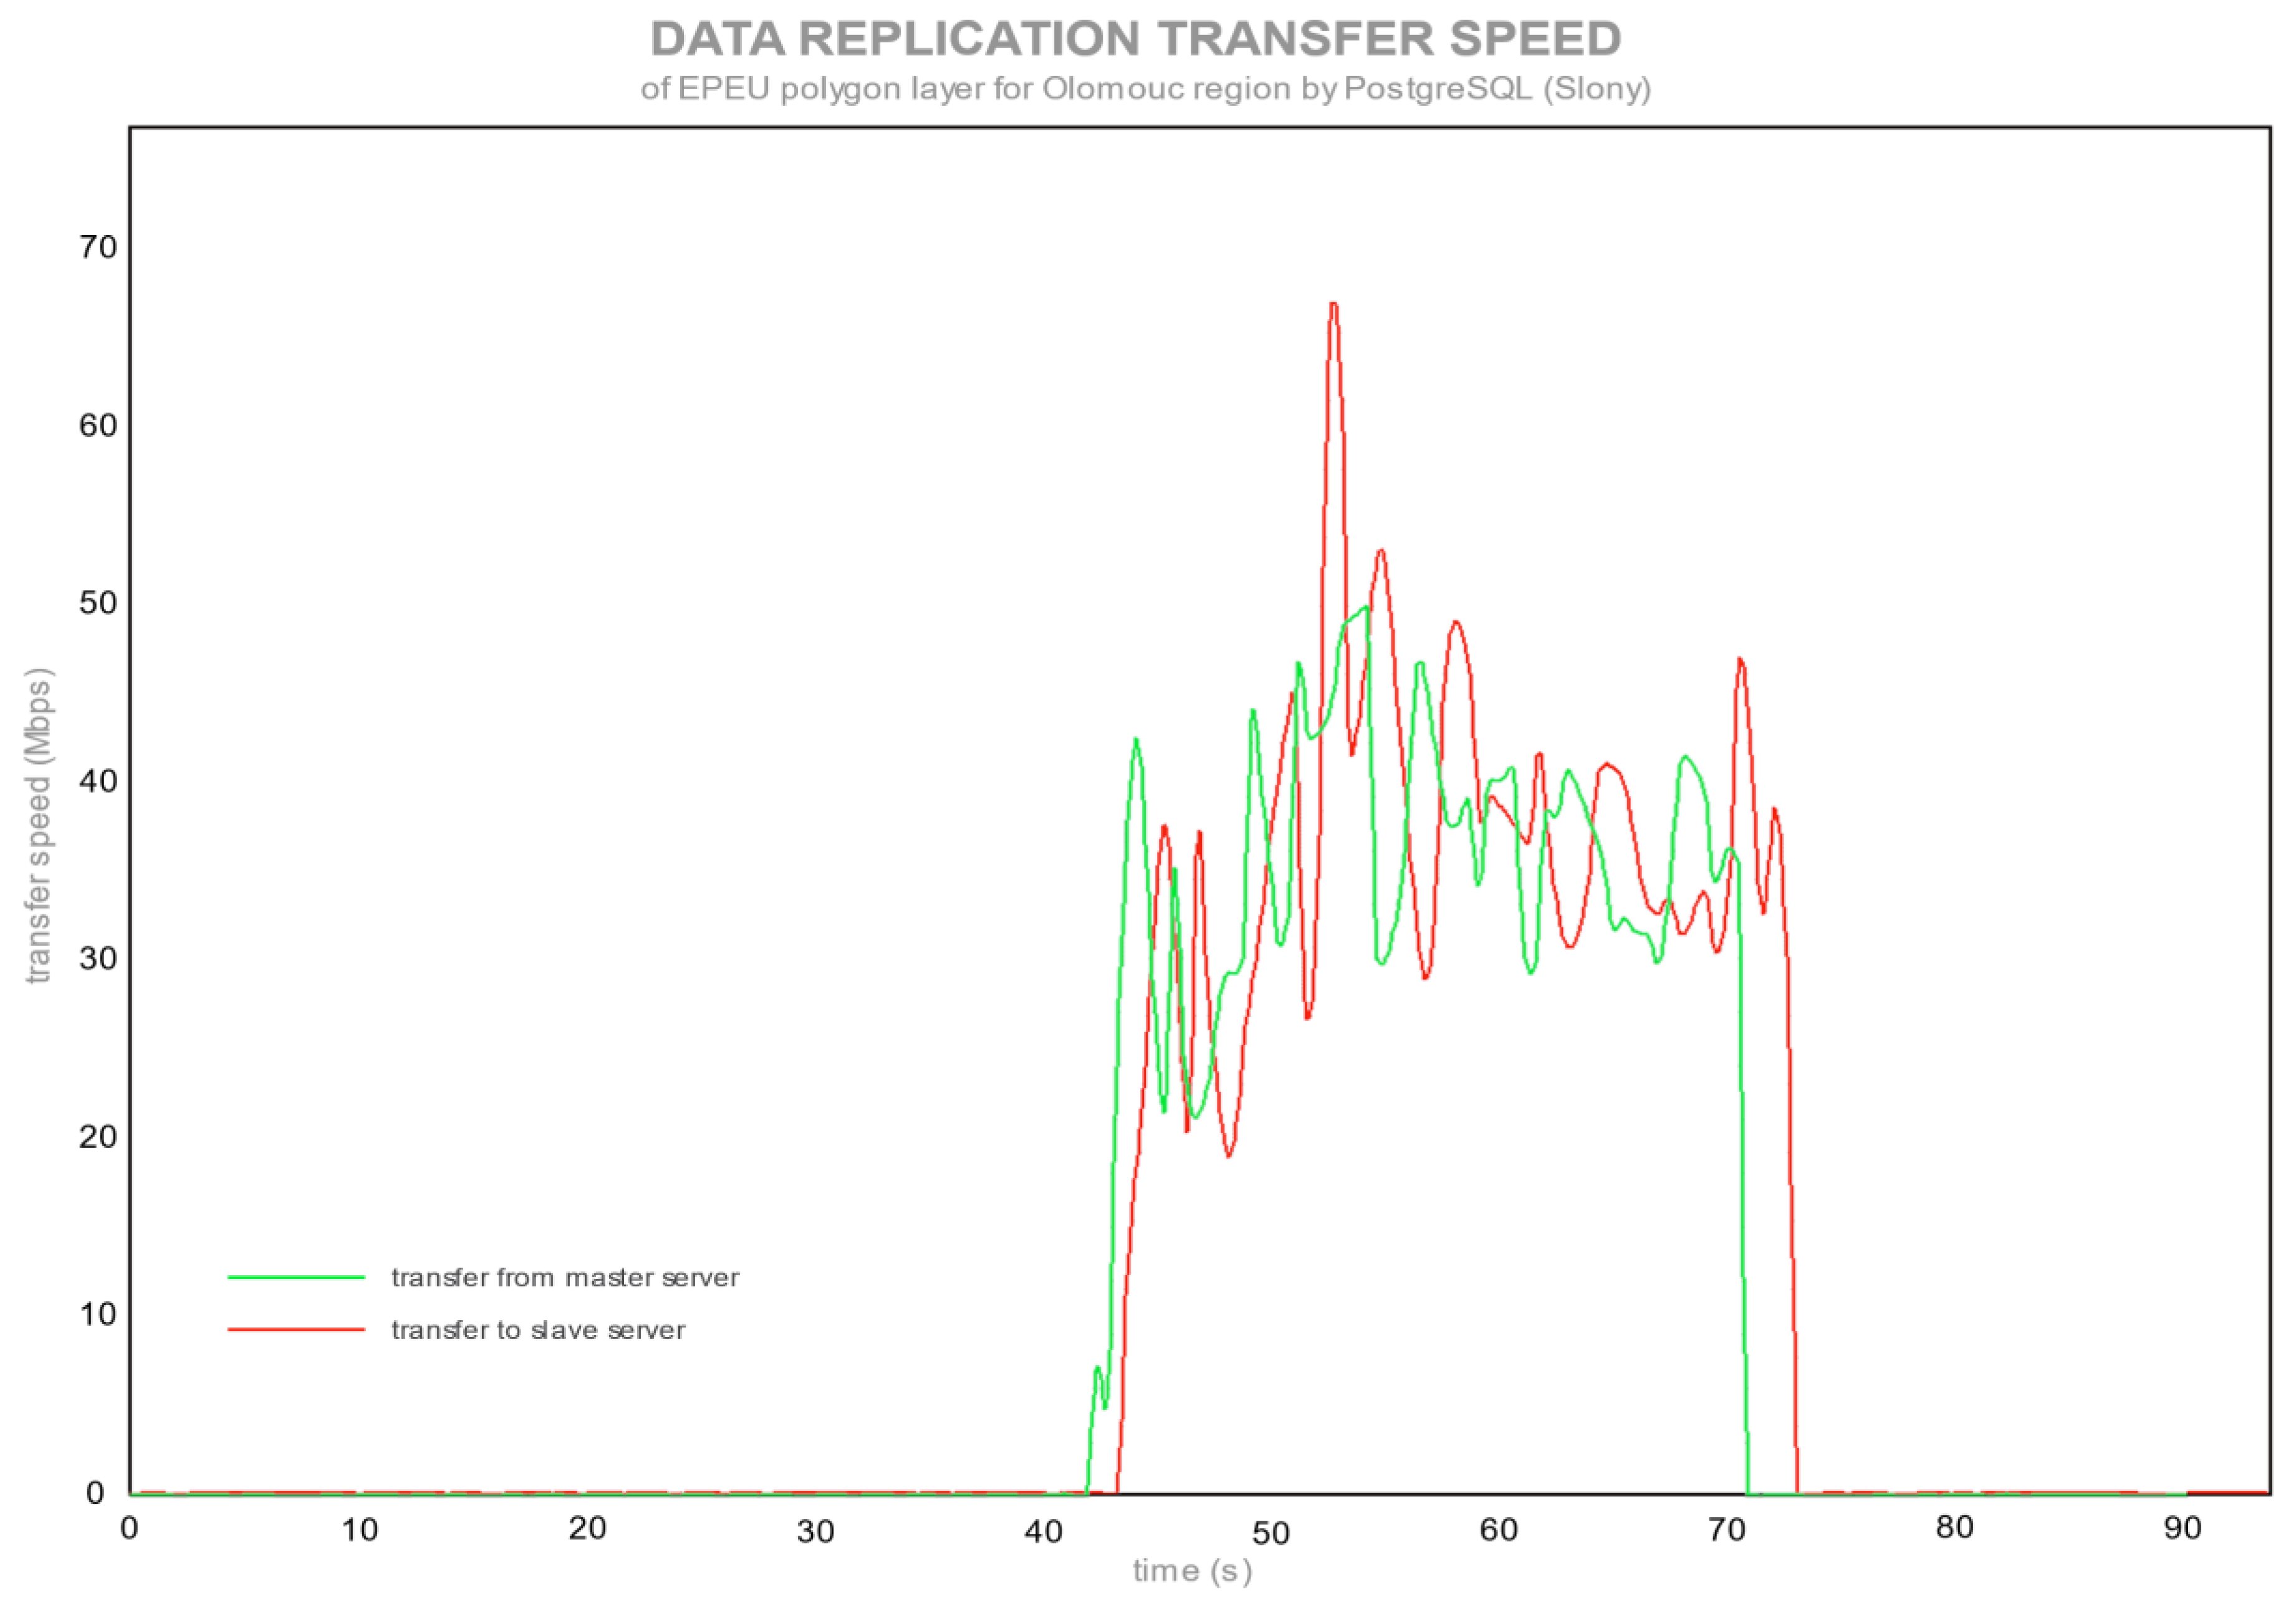
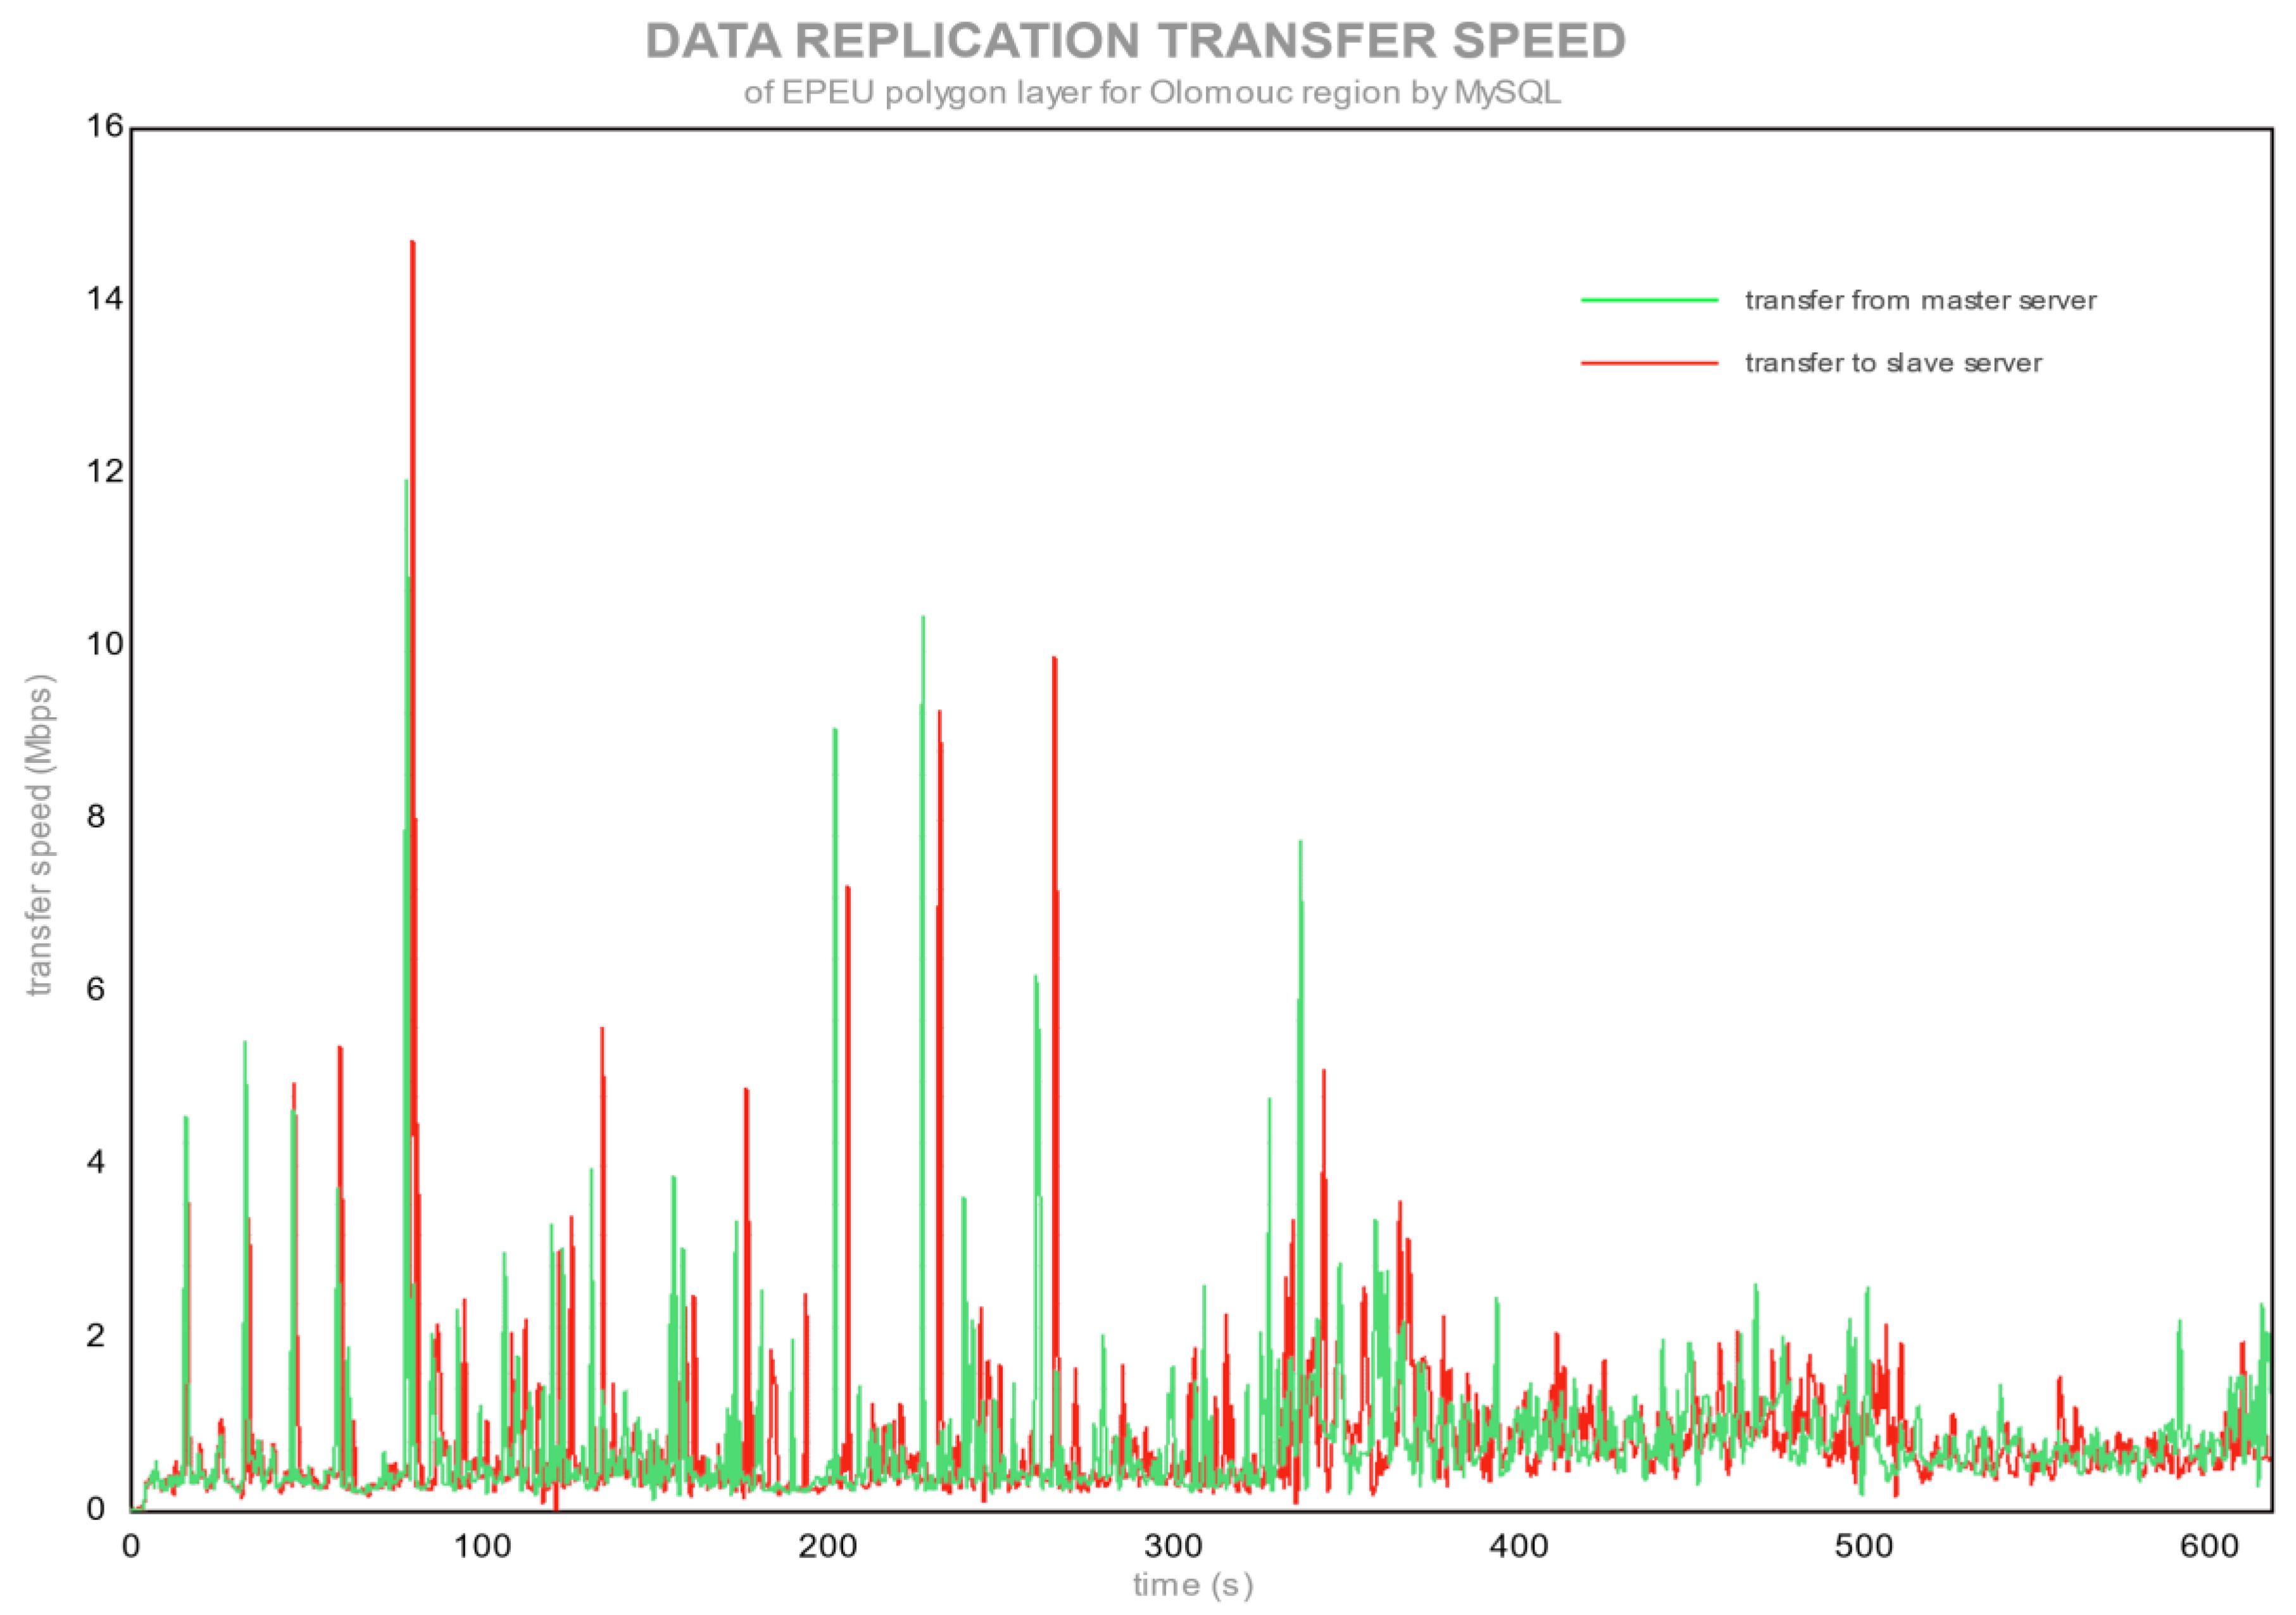
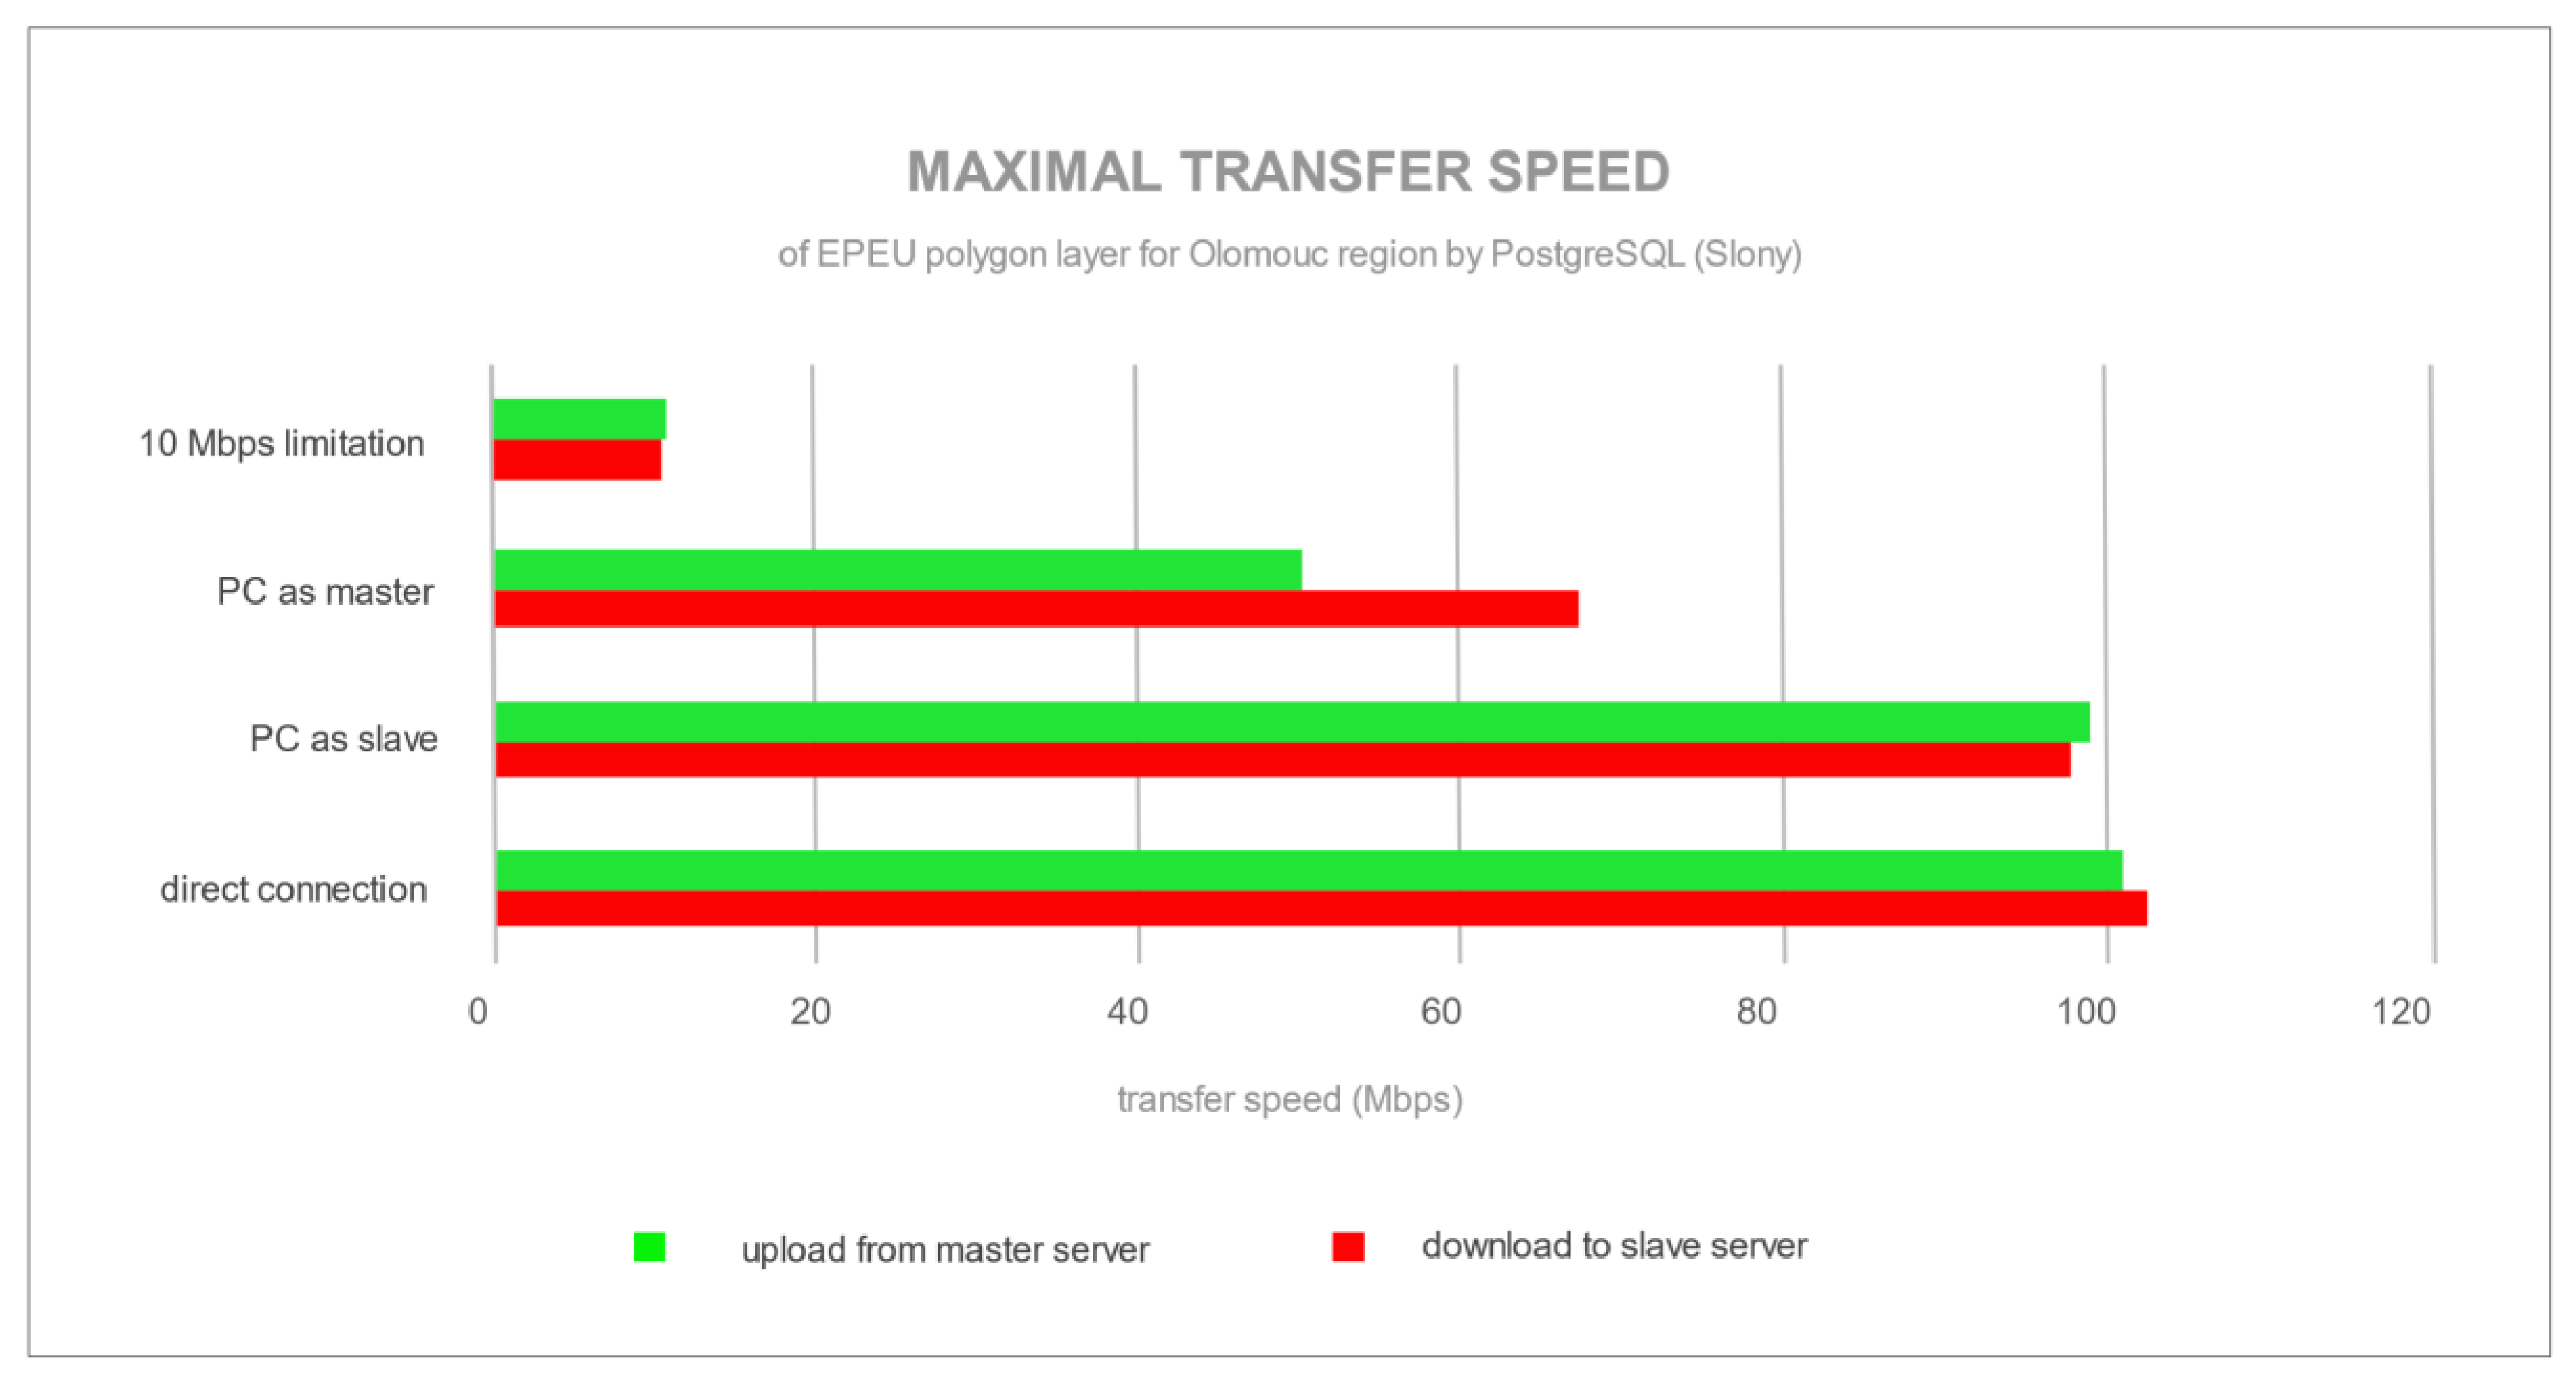
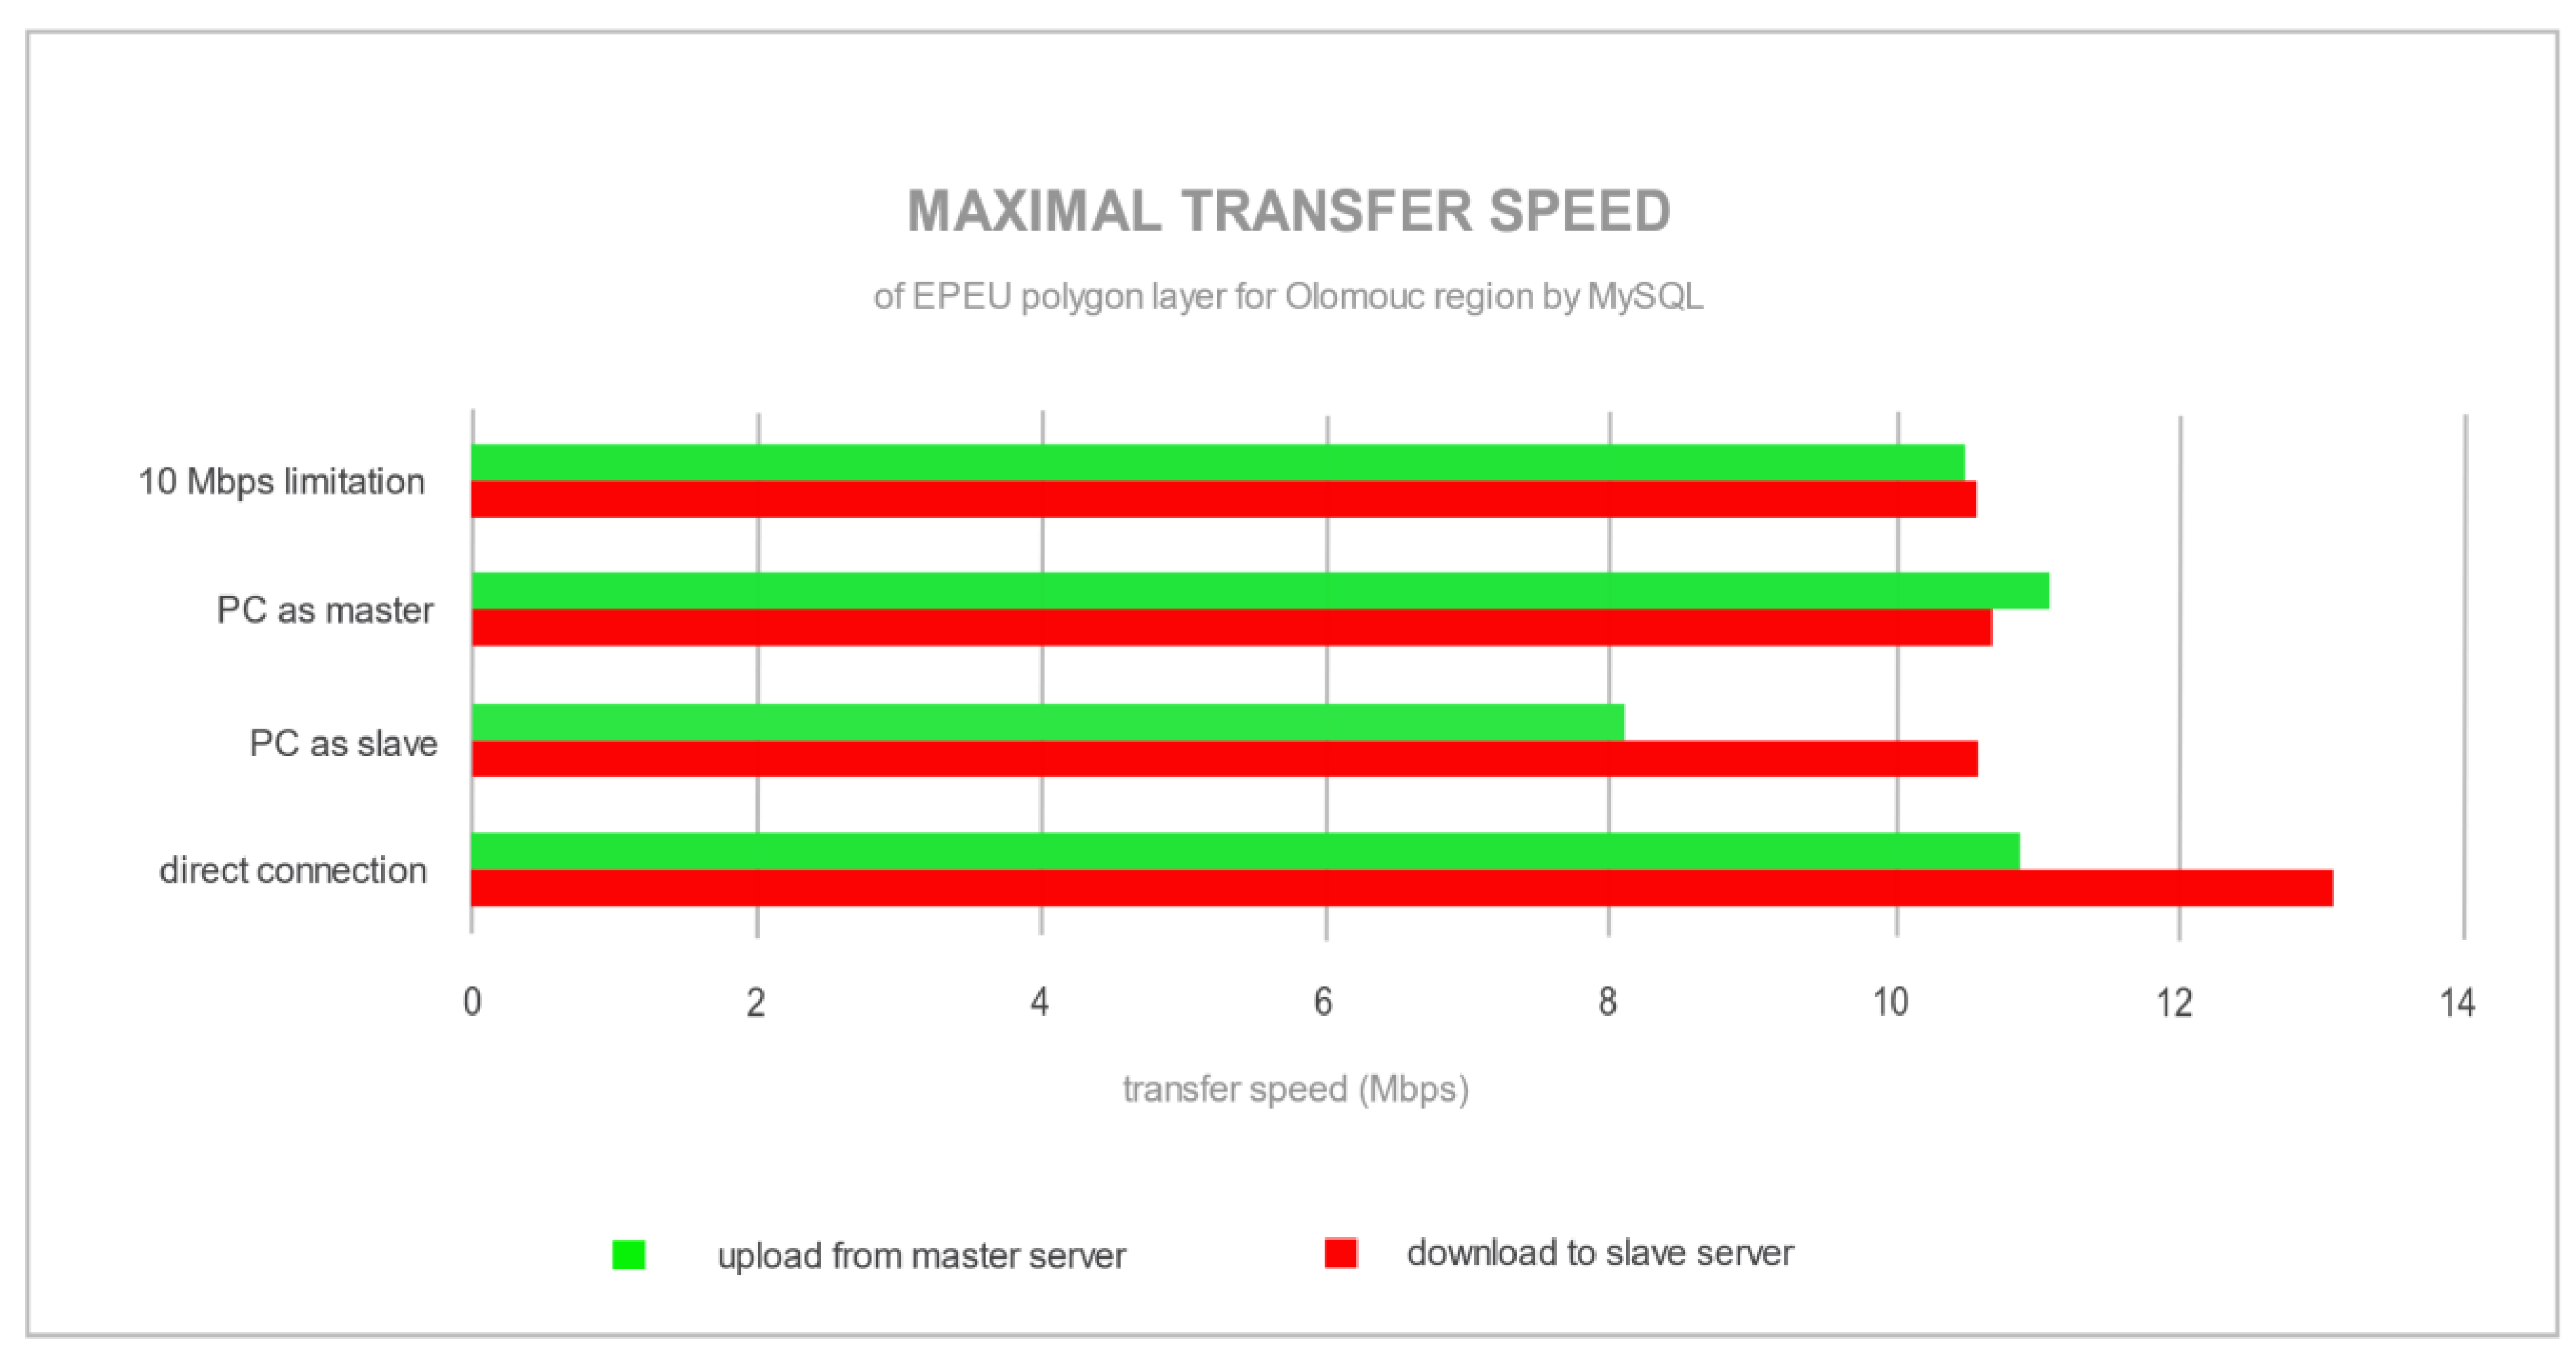
The maximum or average transfer speed reached was the next monitored criterion. Figure 5 and Figure 6 show the transfer speed for replication from the PC as a master server to the notebook as a slave server for PostgreSQL and MySQL. Figure 7 and Figure 8 shows the average transfer speed for all other server configurations. This experiment shows the differences among configurations in demand for network bandwidth and robustness.
There is a definite point in Figure 5 where the data started to upload and download from the master to slave server. The maximum transfer speed was 70 Mbps (Figure 7) for the configuration with the PC as a master server and via a connection through a router. A router mainly causes a lower speed than the accessible maximum (100 Mbps), since with the direct connection between servers the full 100 Mbps transfer speed was reached. PostgreSQL, after storing changes in a master database, attempted to send data with maximum speed through the network, as can be seen in Figure 5 and Figure 7. On the opposite side is MySQL, with streaming replication, where the synchronization speed was around 10 Mbps (Figure 6 and Figure 8). The difference between speed transfers was caused by replication technologies, where PostgreSQL with Slony used asynchronous replication (sending raw data after master server finishes all changes) and MySQL used streaming, SBR, synchronous (sending stream of the modification SQL statement and executing them in the slave server) replication. Transfer peaks for MySQL (Figure 6) were caused by a more complex polygon with a bigger record in the EPEU spatial layer. These results show how demanding network stability, robustness and bandwidth were. PostgreSQL synchronizes batches of all changes into the slave server. Unlike that, MySQL sends a stream of SQL modification statements to be executed in the slave server continuously, while making changes in the master server.
3.3. Replication Time
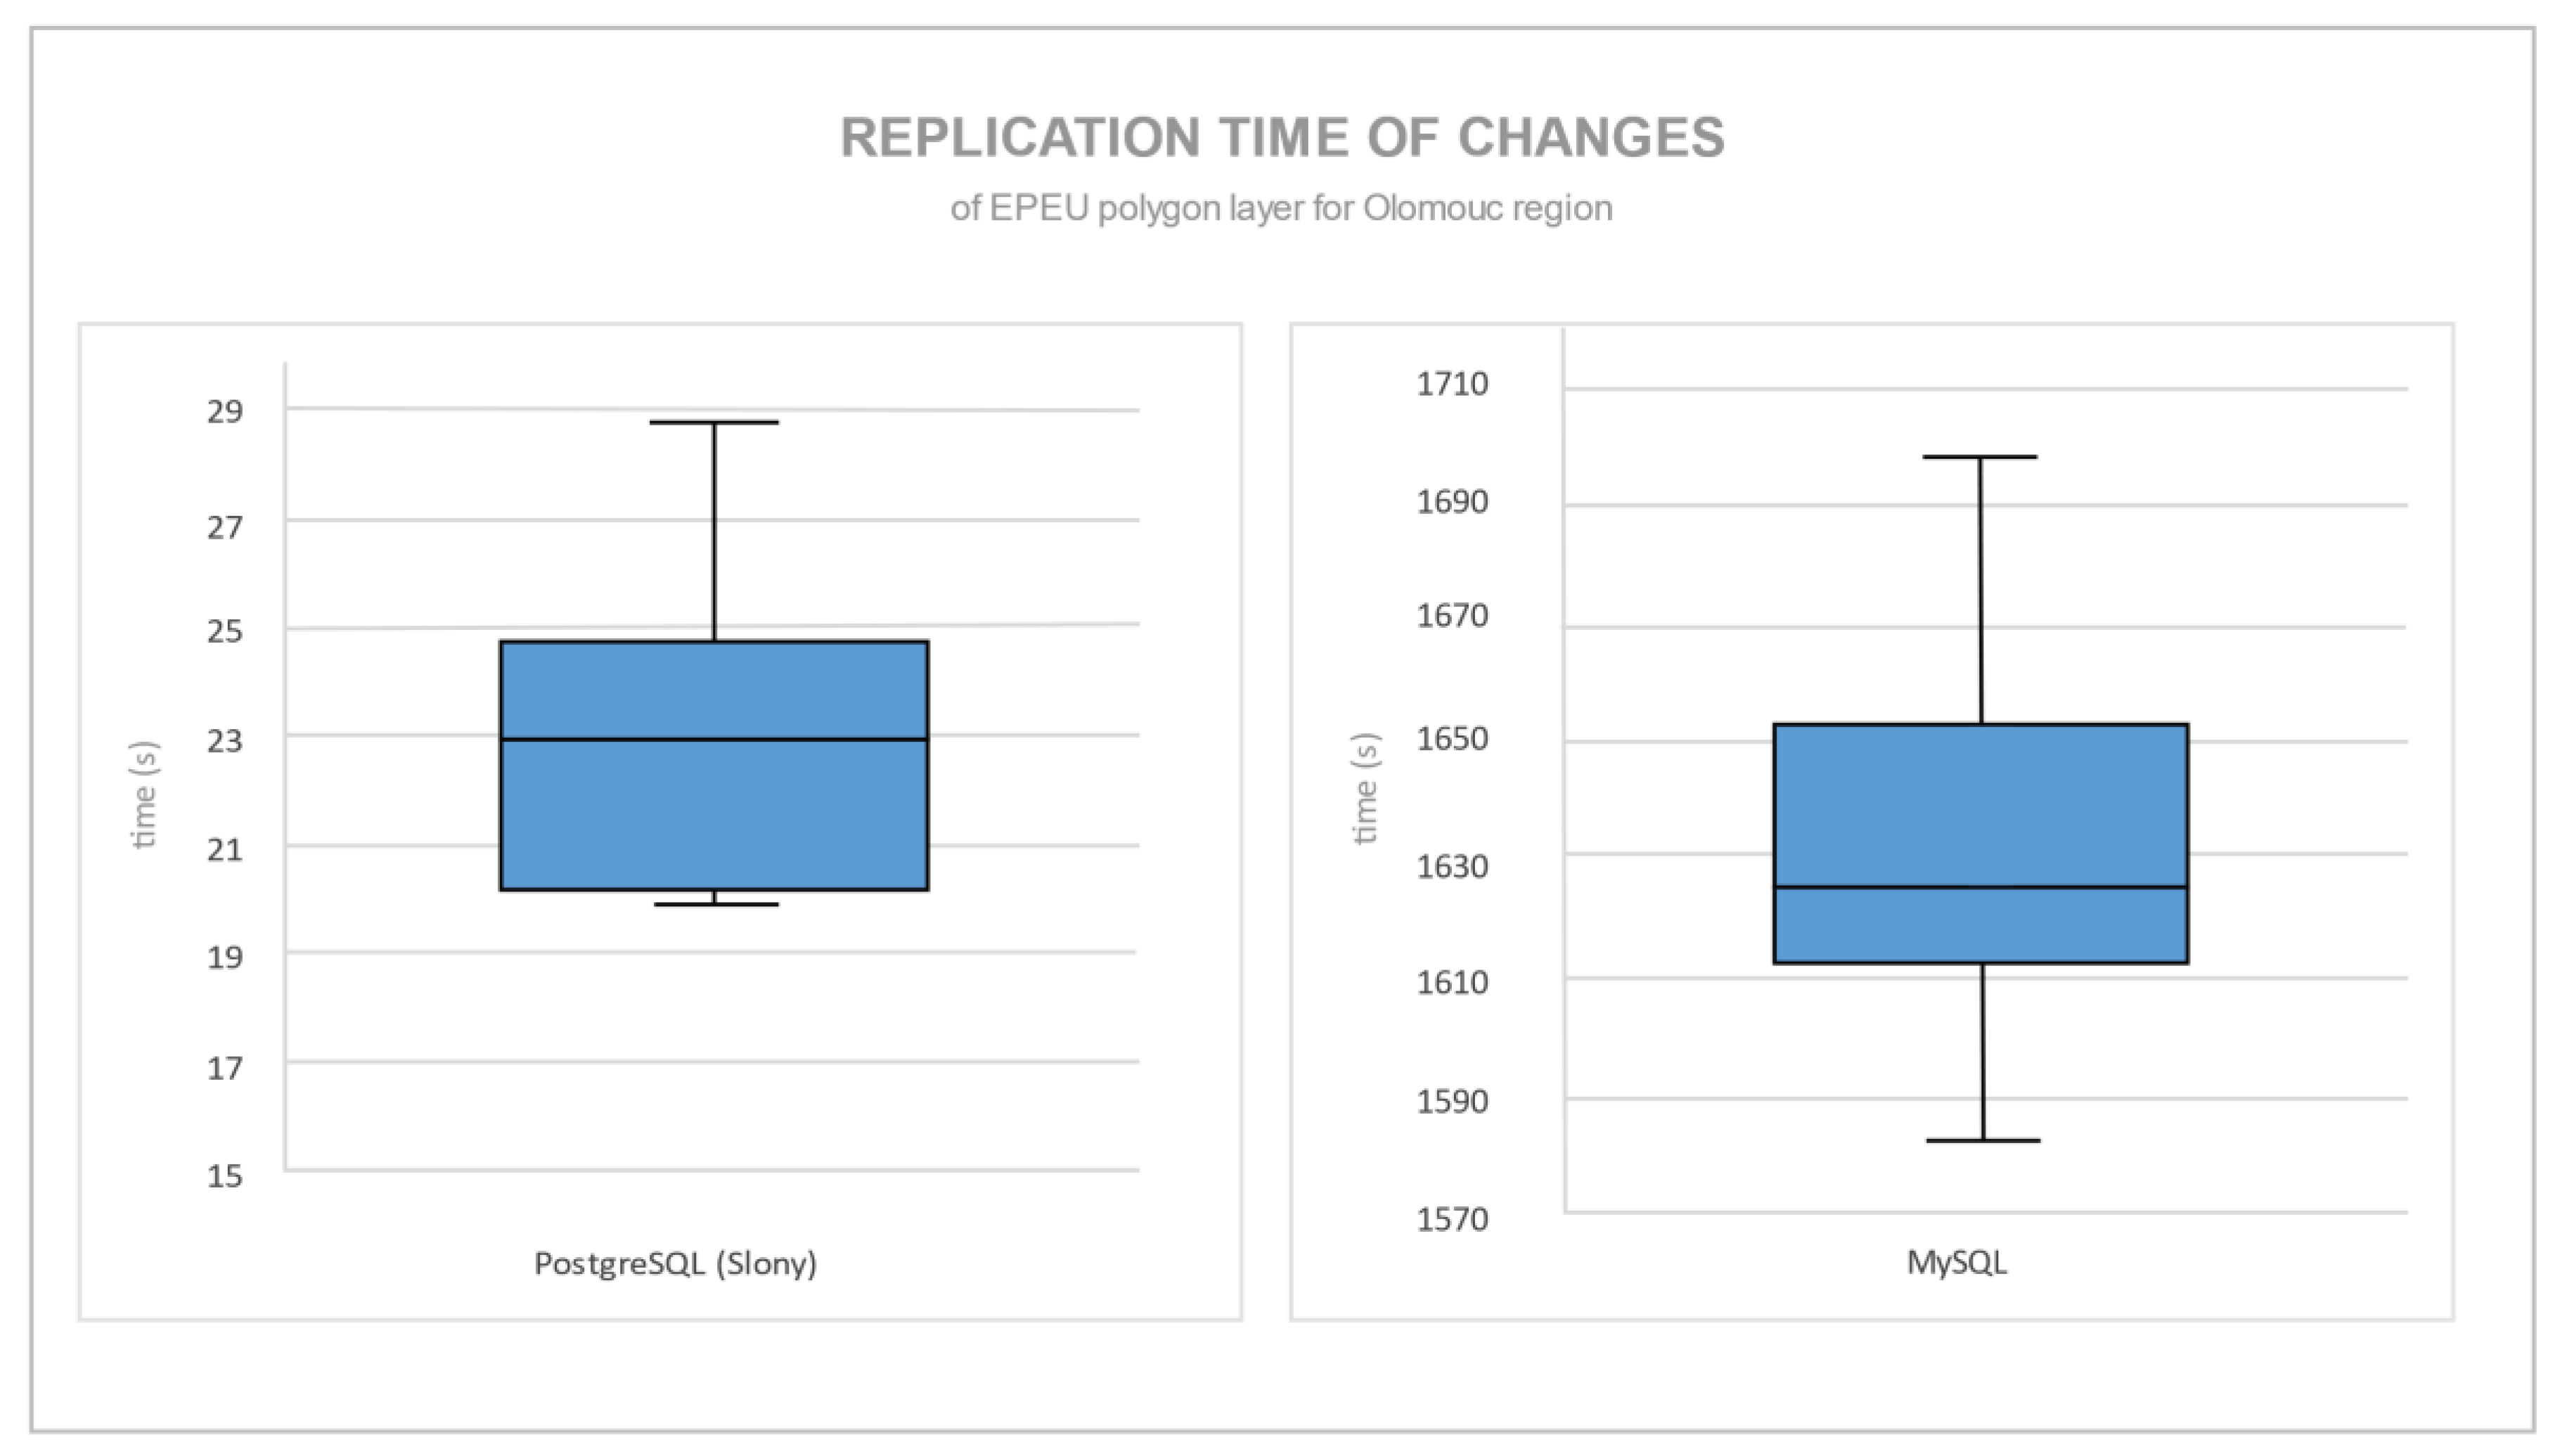
One of the main criteria is the time of replication from a master to a slave server. PostgreSQL replicates changes in one large log file (“sl_log_1” or “sl_log_2”) and tries to use as much network bandwidth as possible. MySQL replicates changes continuously from the start, where changes are made in QGIS. The time of each replication was very different because of the replication technology used. Figure 9 shows the amount of time taken for the replication of the most extensive spatial layer EPEU. Each situation was measured ten times. The boxplots depict the first and third quartiles, the median and the absolute minimum and maximum of the time taken.
There was a significant difference in time taken between these two replication mechanisms. The time differential was mainly caused by the synchronous and asynchronous approaches used by each database server. Synchronous replication sent every record change instantly after it was saved in a master database, while asynchronous replication sent a bulk of changes. Slony synchronized between replication nodes in less than 30 s, while MySQL synchronized in almost 1700 s (56 times more time) for the same amount of data and changes.
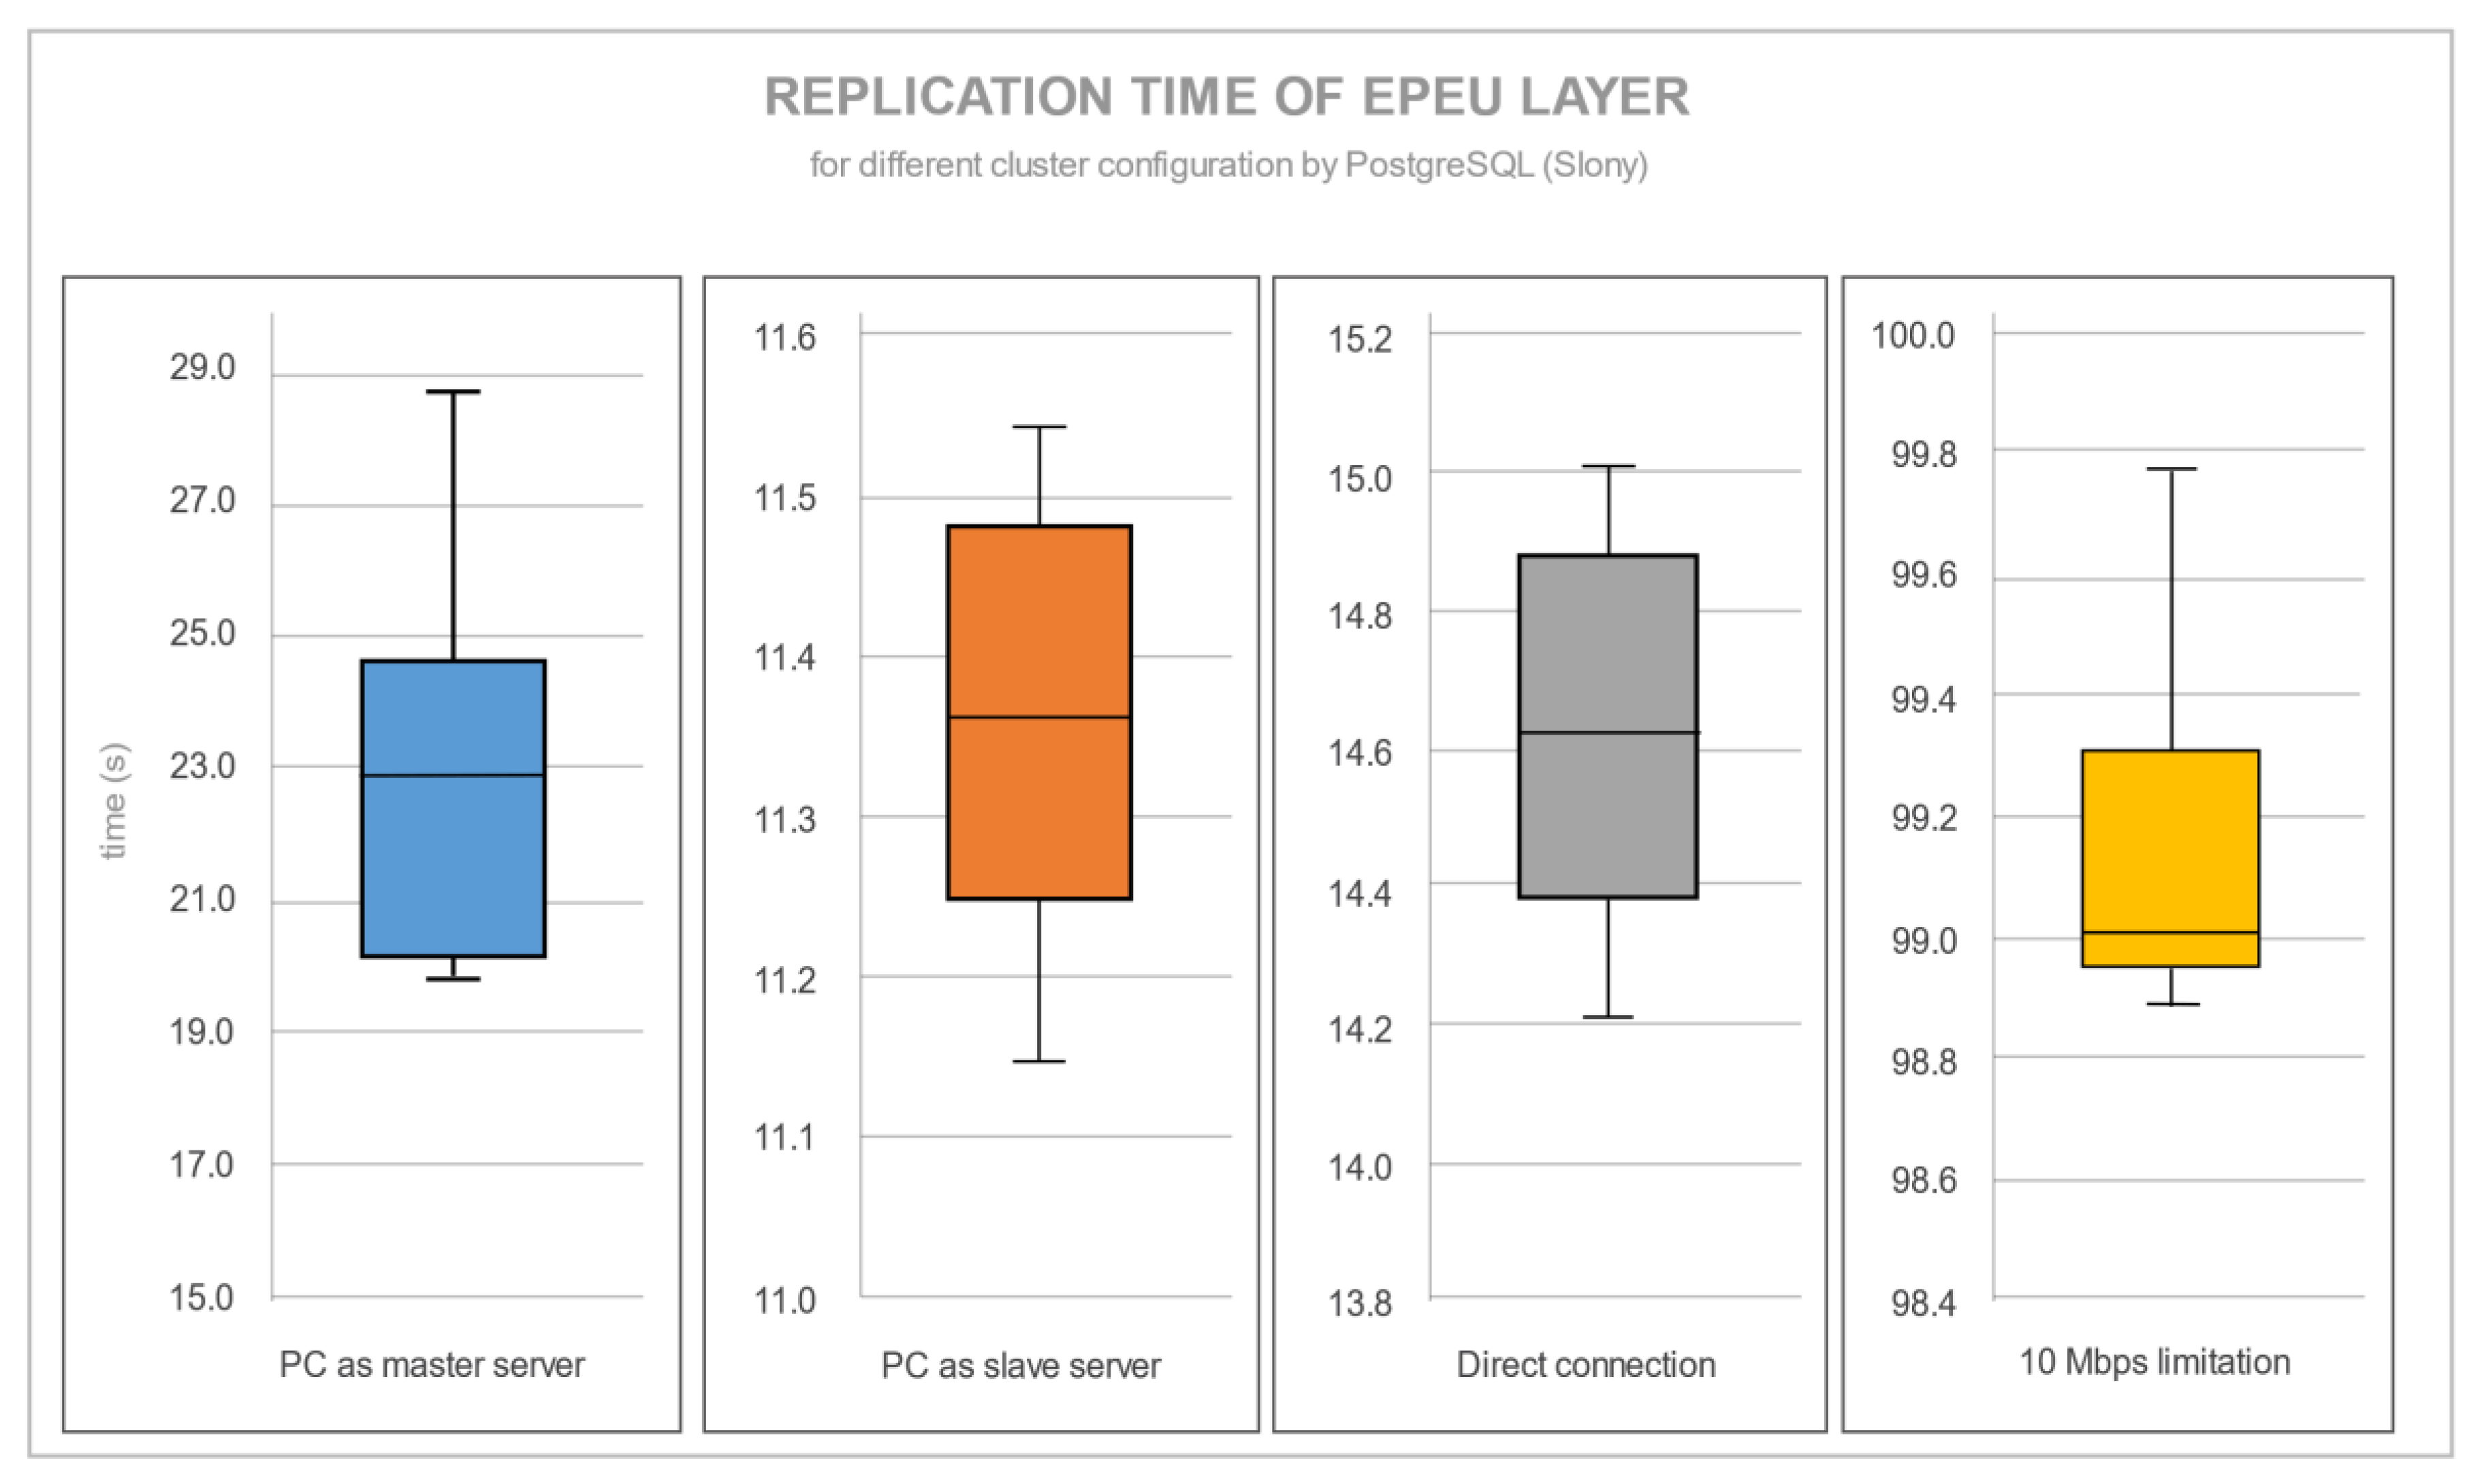
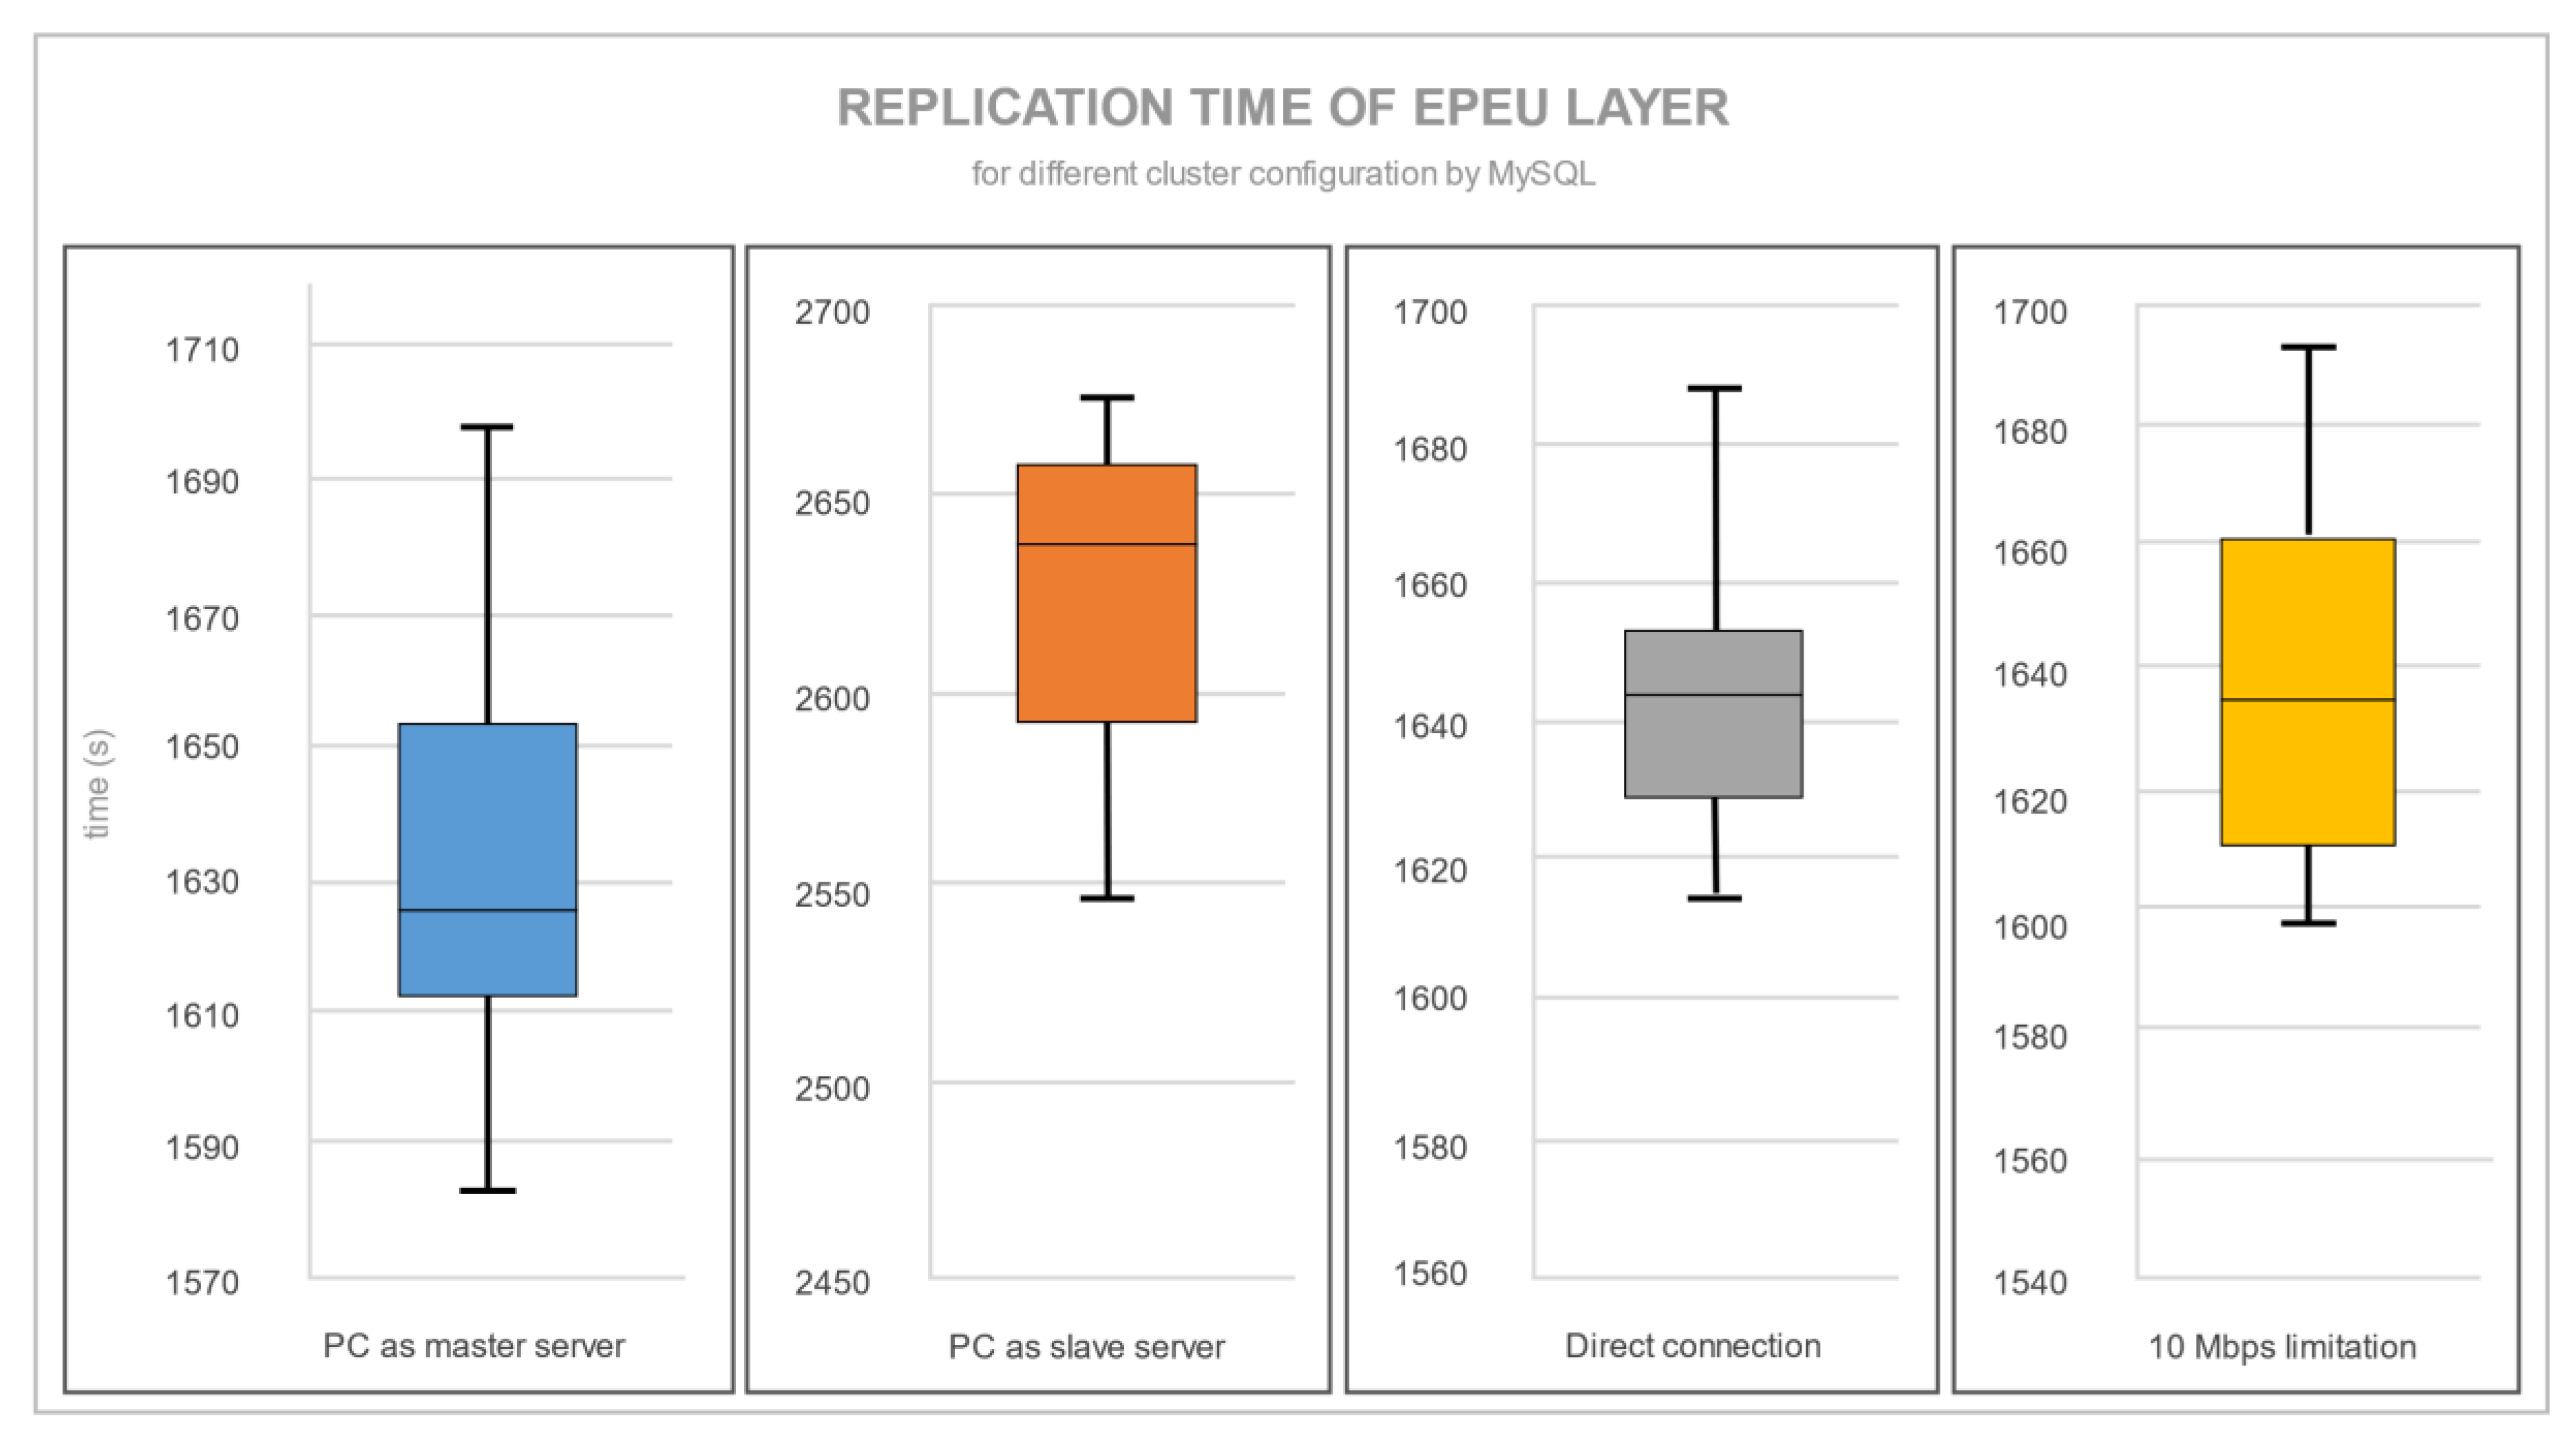
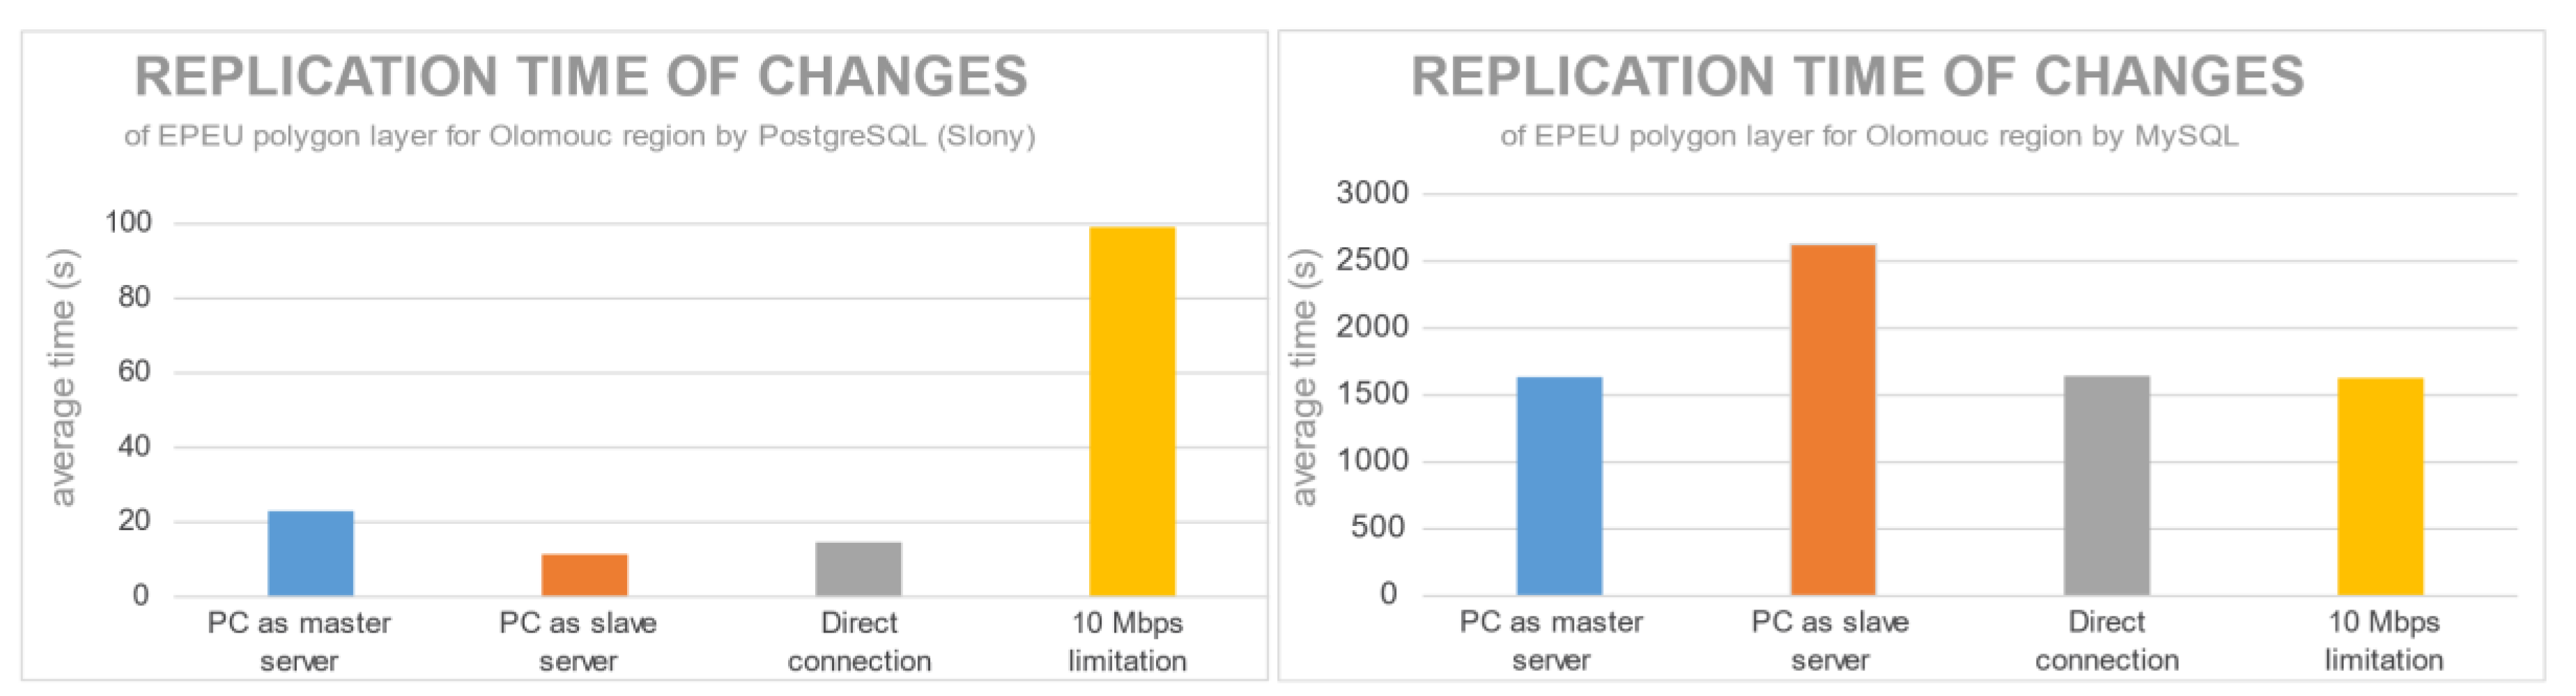
Figure 10 and Figure 11 show the statistical data of all four server configurations for a replication EPEU layer.
Differences between PostgreSQL and MySQL were not just in terms of replication time, but also in the variance of measurements. The specific numbers regarding Figure 10 and Figure 11 are shown in Table 4. PostgreSQL, unlike MySQL replication, had a significant time increase with a 10 Mbps limitation transfer speed. Figure 12 provides a visual comparison showing the average replication time for each condition. As the Slony replication extension tries to use as much connection bandwidth as possible, the 10 Mbps limitation excessively prolongs the replication time. A router causes a time difference between a PC (as a master server) connected through a router and direct connection. This is the consequence of the lower transfer speed through a router. For the replication time with MySQL, there is a limitation of the CPU power of the master server. When a notebook is the master server and must process and send an edited layer simultaneously, the replication is slower. The transfer speed limitation for MySQL is not relevant. The most fundamental statistical analyses of replication time are shown in Table 4. The average replication times may look more stable for PostgreSQL than for MySQL, but with a much faster replication process; both database servers had a standard deviation in time of under 5%. Only PostgreSQL with the PC as a master server configuration had a standard deviation in time of 12%.
3.4. Replication Time of Other Spatial Layers
The replication time of other spatial layers followed the same methodology used to test the replication time of the EPEU layer. However, they had fewer edge points, records, and, of course, size. Hence, it was irrelevant to do the same CPU load and transfer speed test as for the EPEU layer.
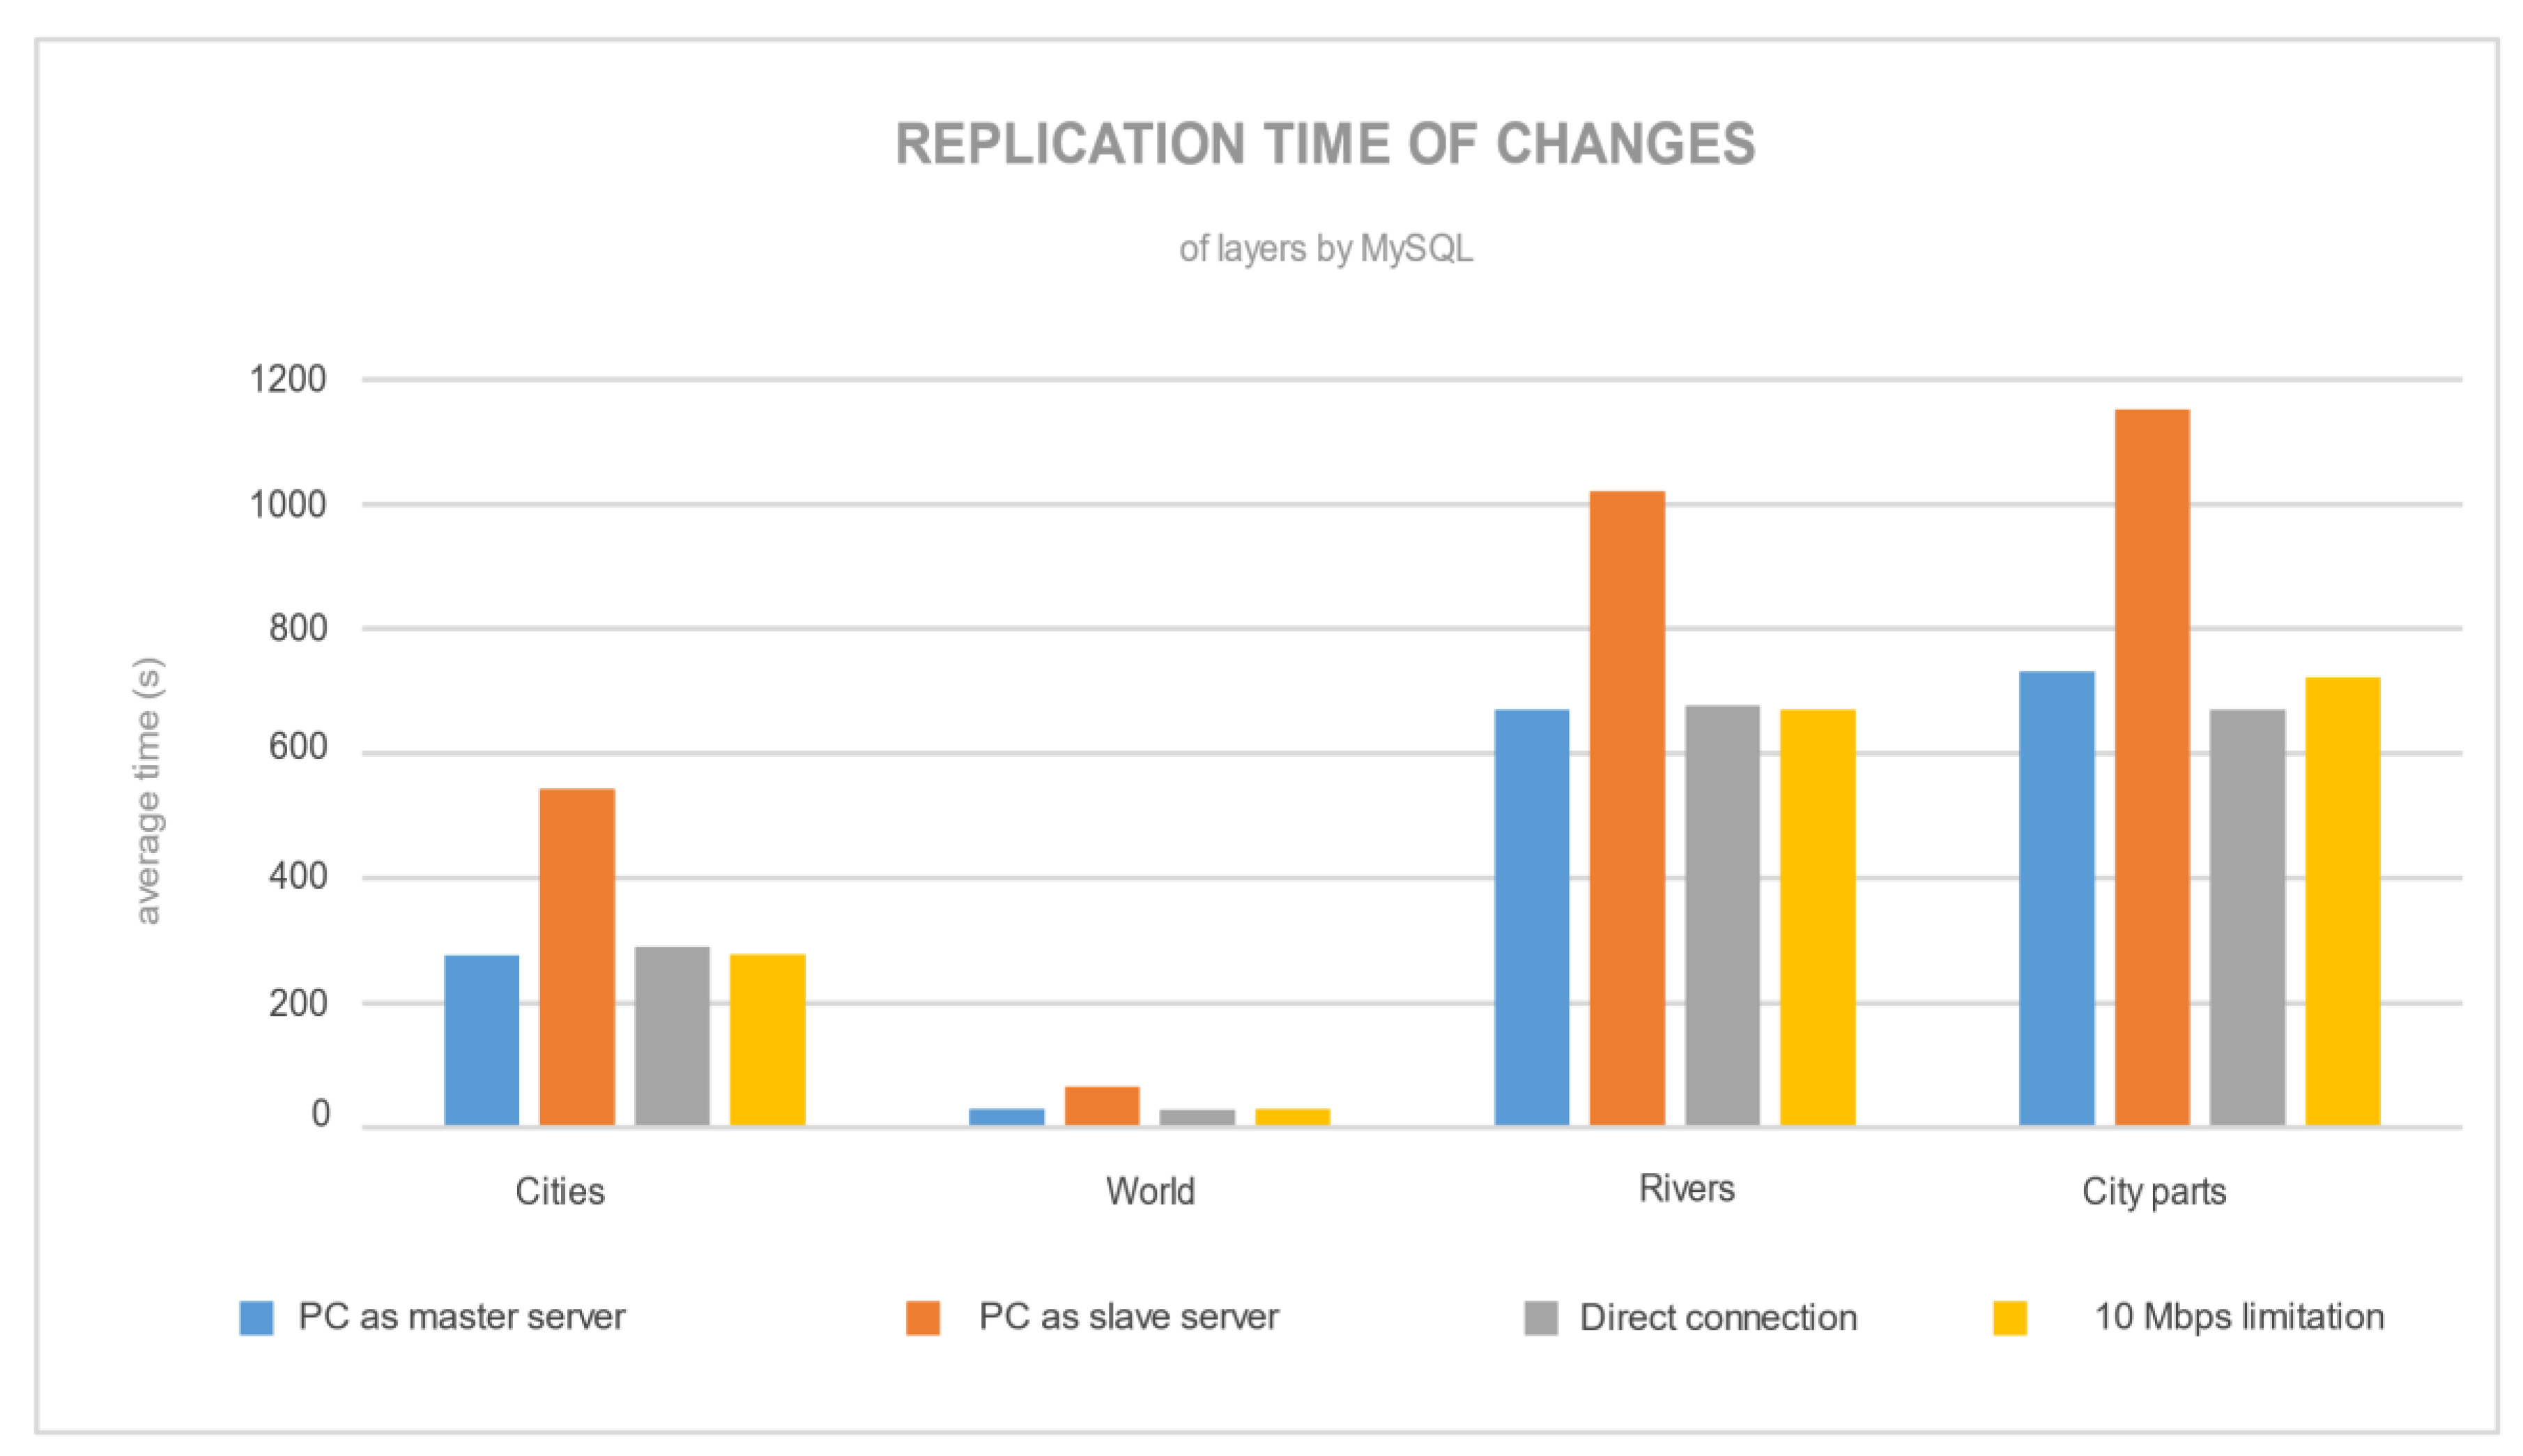
Figure 13 shows the average replication time (based on ten measurements) for every layer and every replication configuration. If we focus on the replication time for PostgreSQL, we can see there was a definite time development that depended on a number of edge points (in Table 2) with the 10 Mbps speed limitation. Other layers were influenced by the number of edge points, which were also edited (by a movement to another place in QGIS). On the other hand, the MySQL replication time (Figure 14) relied on a number of records. With an increased number of records, the time of replication increased. This is the result of sending each change of record almost immediately as the record was changed in the master server to the slave server, where the record modification was created again (by executing the SQL statement).
There was no difference between point, line or polygon spatial layers for PostgreSQL and MySQL replication mechanisms. Figure 13 and Figure 14 show the opposite behaviors of the PC as a slave server, where for PostgreSQL the replication was the quickest, while for MySQL the replication was the slowest. For MySQL, SBR replication demands more from the master server. This is because the master server has to store data and simultaneously transfer it to the slave server.
For PostgreSQL, there were considerable differences between the servers’ configurations. If the slave server is more powerful than the master server, then the replication is made faster (faster data processing in a faster machine). Configurations of the MySQL replication cluster showed almost the same results (same time of replication for PC as master server, direct connection and 10 Mbps limitation).
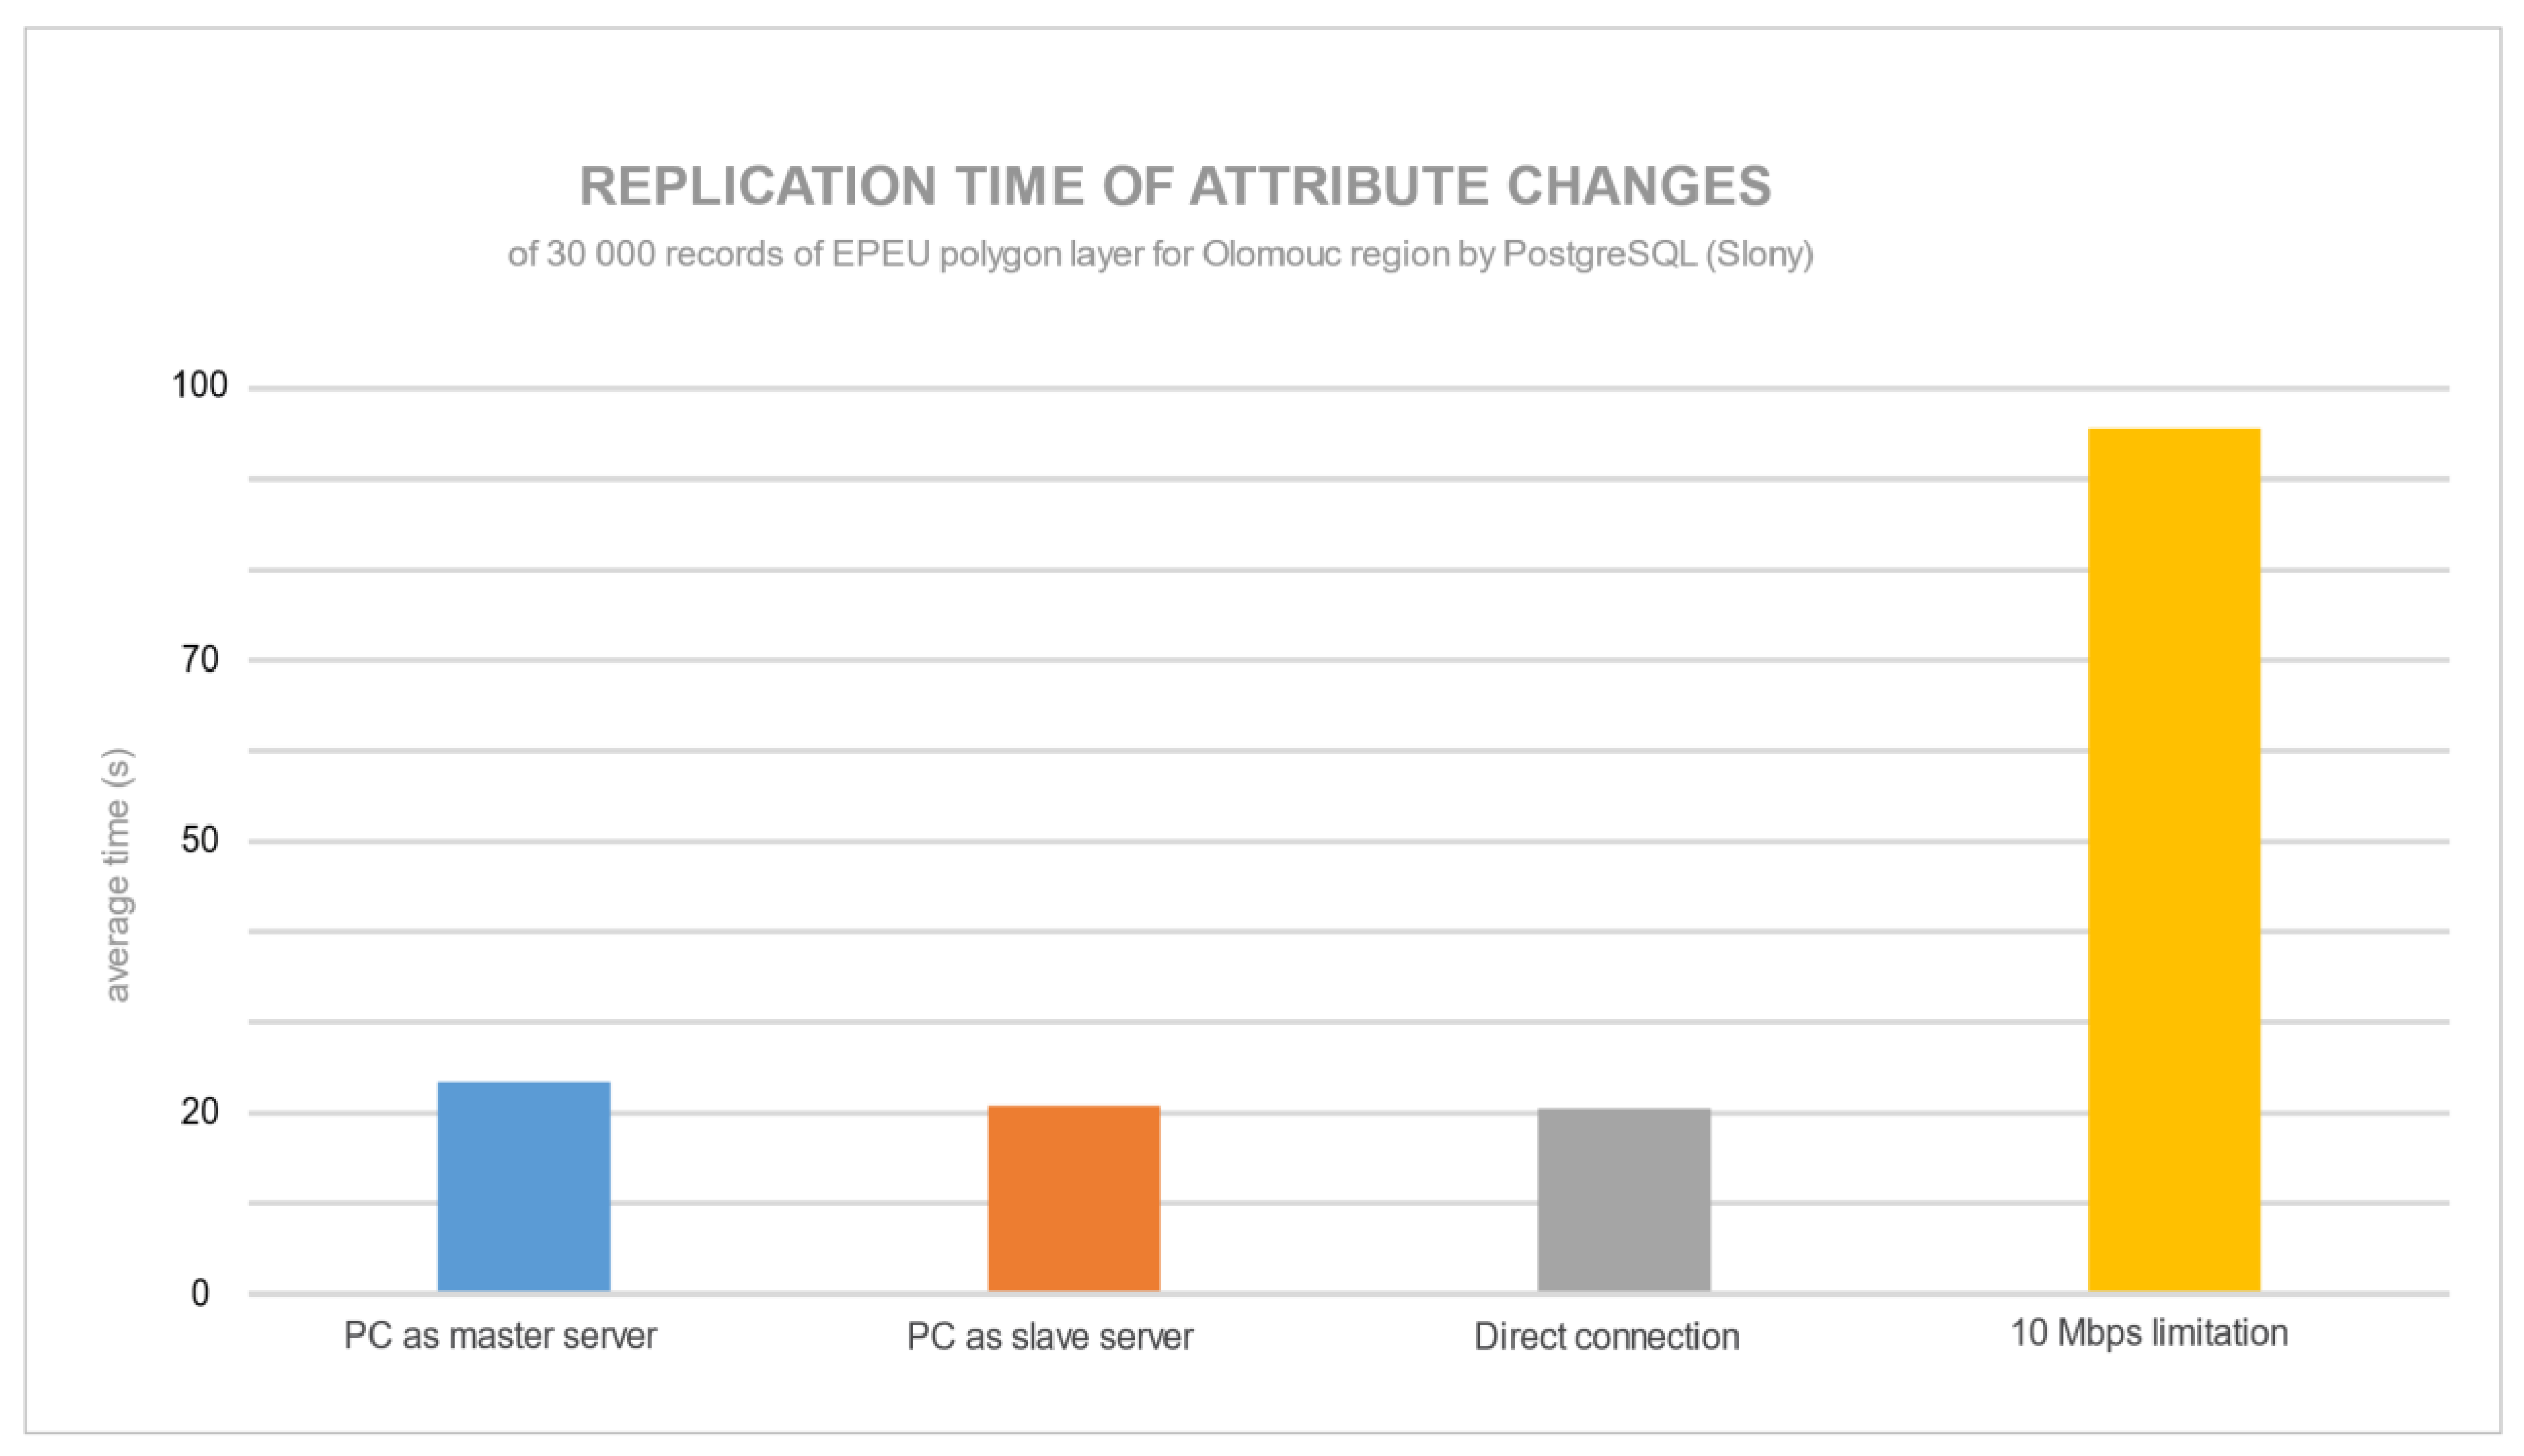
3.5. Replication Time of Decimal Attribute Data
The last test was done to prove the difference between attributes with a spatial data format and attributes with a decimal format. There is, of course, a difference in the length of attribute records. The decimal or text attribute data should respect at least the first three relational database normalization rules proposed by Codd [28]. Results were a much smaller size of single decimal or text attribute record compared to attributes containing spatial information.
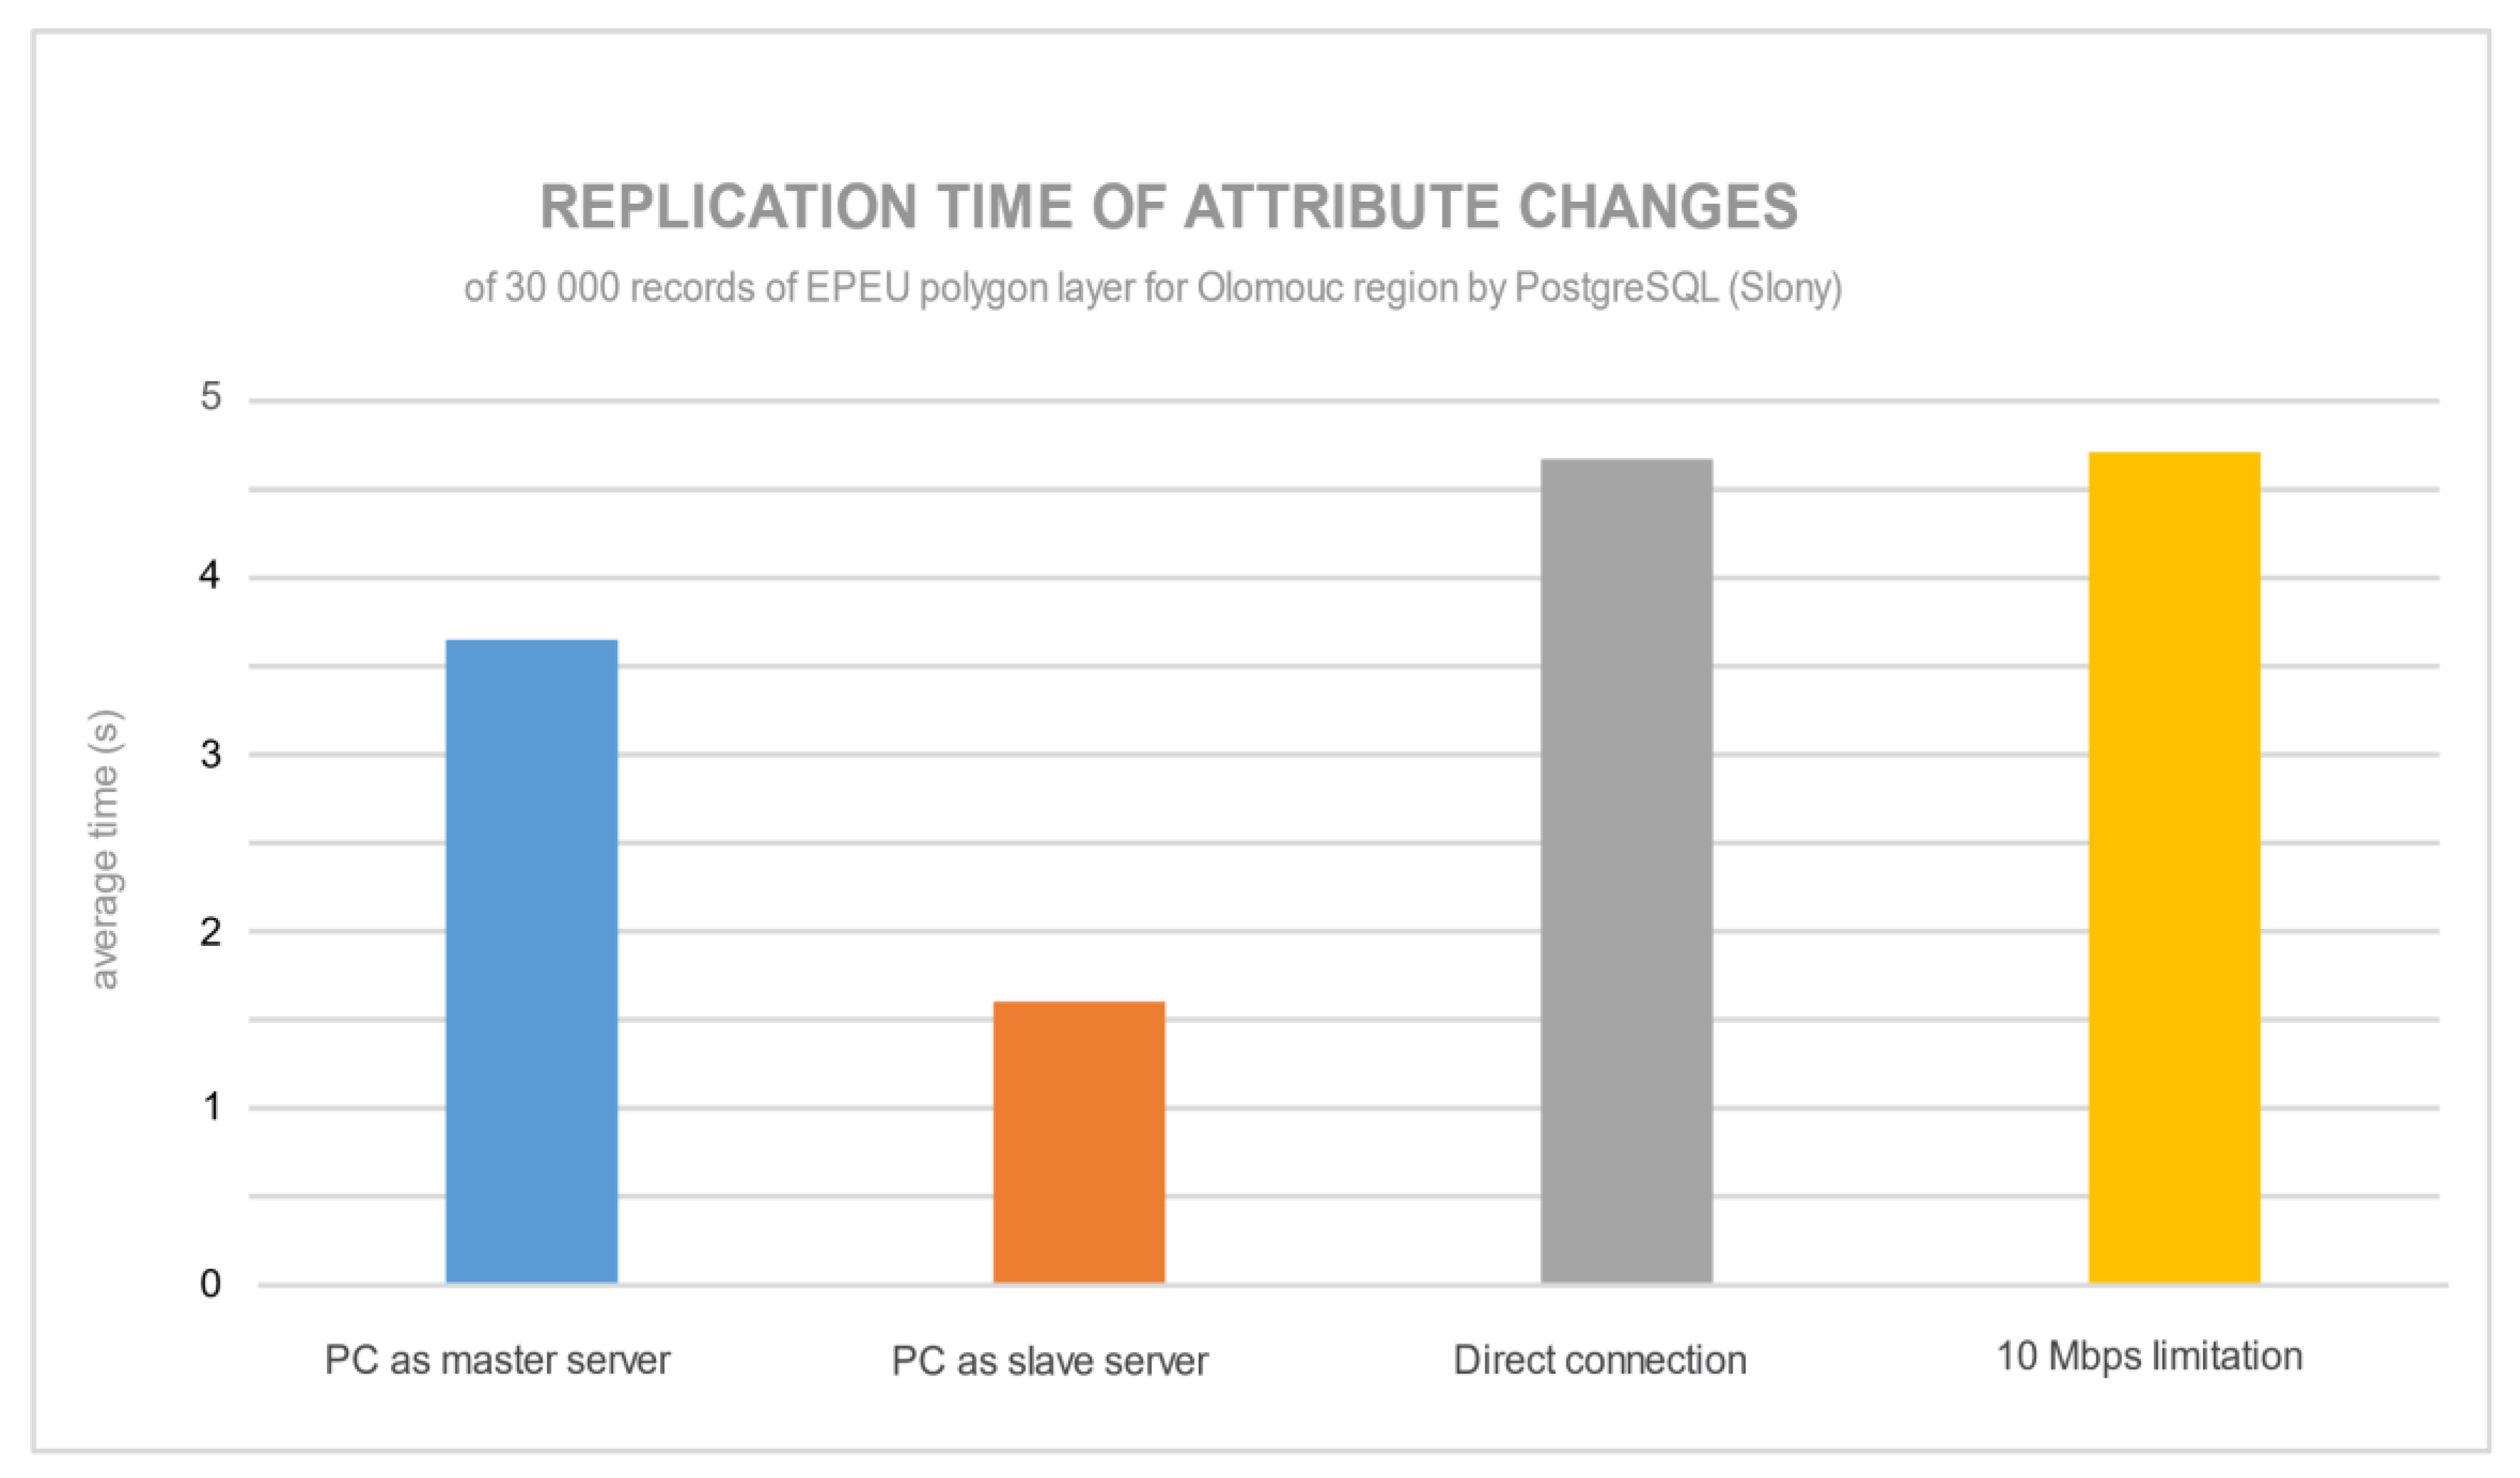
Figure 15 and Figure 16 show the average times for replication of 30,000 updated records in both database servers. For PostgreSQL, the database replication of decimal attribute records was quickest with the configuration with the PC as a slave server. The speed limitation for PostgreSQL did not have an impact on replication time. By contrast, MySQL was affected by the speed limitation, and it was almost five times slower compared with PostgreSQL. The direct connection or speed limitation had a negligible influence on replication.
For PostgreSQL, it is again proved that a more powerful slave server could decrease the time for the replication process. For MySQL, it seems that it was optimized for replication of classical data structures rather than spatial data. The 10 Mbps limitation was almost five times slower than a direct connection of servers. There could be an optimization of the transfer process of decimal attributes: it was faster to execute and then update spatial data to the slave server. Hence, 10 Mbps limitation would always slow down the whole replication process.
4. Conclusions and Discussion
This study aimed to describe and test available database replication solutions that provide replication functionality over spatial data. The results from tests performed of the replication mechanisms confirmed that there were available replication mechanisms of spatial databases for the distribution of spatial and sensor data. Spatial data replications were more specific and required a specific approach compared to the replication of common data types.
This paper presents a comparison of two database replication mechanisms for PostgreSQL and MySQL. This selection was based on criteria shown in Table 1. One of the main reasons to test PostgreSQL and MySQL over Oracle and Microsoft was the price of these solutions. Oracle does not require any exclusive license for Oracle Spatial and Graph from 5 December 2019, and it is included in the Oracle Database. Oracle offers the Standard Edition 2 for a minimum of $21,000. The Microsoft SQL Server is cheaper than Oracle, but it is still $3717 per core. Both systems are out of range of the Department of Geoinformatics. Nevertheless, the suggested experiment is reproducible for any SDBMS.
Both database servers (PostgreSQL and MySQL) are conventional in a GIS application. Creating a robust, secure and fast distributed environment should be part of every more extensive project. Except for replication, setting up a load balancer and high availability solutions (e.g., using PgPool for PostgreSQL and MySQL Router for MySQL) should be considered. The comparison was made under real conditions and on real spatial data. Spatial data from publicly available datasets were used, and servers with different performance. From the graphs produced, it can be seen that to swap between a master and a slave server from PC to notebook generated a different result based on master or slave server performance. We also tested the behavior with a speed limitation, a different number of edge points or records, and servers connected through a router, directly or with a 10 Mbps limitation.
The times of replication (Section 3.3) were related to transfer speed (Section 3.2) and with CPU load (Section 3.1), and of course, with replication technique. PostgreSQL and MySQL use different replication approaches, and this experiment shows that each replication technique had advantages and disadvantages.
PostgreSQL with a Slony extension uses asynchronous logical replication and the replication time depends on the server performance and connection bandwidth. Slony-I allows replication of one or more tables among PostgreSQL servers. PostgreSQL can handle larger dataset processing than MySQL and replicate it in a shorter time, although Slony can create an inconsistency between a master server and a slave server for a certain amount of time (time-step synchronization). PostgreSQL servers must have an excellent connection to each other and appropriately powerful hardware. The advantages of PostgreSQL with Slony replication are that Slony enables replication between different PostgreSQL major versions and different operating systems, and replicates only some of the tables to some of the slaves (cascade replication) [18]. Its disadvantages include that it can be harder to set up and can be hard to synchronize the change in a schema.
MySQL uses native streaming, synchronous logical replication, where the performance and connection bandwidth is not as crucial. The replication depends on a number of edited records because synchronous replication synchronizes every record separately. The master server sends a binary log with a statement (SBR mechanism) to the slave server when it is executed. These binary logs can be used for auditing. The Monyog reveals that the record was firstly deleted from a slave server and then was inserted into a new record. Although synchronous replication should secure master–slave consistency, the time taken to finish the replication was much greater than for PostgreSQL. Whether one should use this method is very use-case dependent; Slony replication would be an advantage if there is no need for record consistency for some amount of time (in order to record Slony finish changes in the master and then send them into slave server), e.g., long-term analyses in the master server. Alternatively (MySQL), if it is better to synchronize every record in the slave server immediately as a record changes in the master server, e.g., real-time mapping (city passporting of trees).
Overall, the right configuration of a whole distributed environment, including database replication in collaboration with load balancing and high availability techniques, will lead to an improvement in reliability and availability of data in the database cluster for a client (web page, desktop GIS). This creates a distributed environment, where an application can access the datastore independently of the location of the sources. With an increasing number of replication nodes, the complexity of the system increases, as do the management demands and potential data fragility. The comparison of PostgreSQL with Slony replication and MySQL native streaming replication shows the difference between asynchronous and synchronous logical replication. Slony is more suitable for a large dataset and can handle extensive data edits. MySQL replicates a data change slower but maintains data consistency in the whole replication cluster at all times. The MySQL replication time is mainly influenced by the number of records and CPU power of the master server. MySQL replication does not require as much CPU power as PostgreSQL and is less demanding on network bandwidth.
PostgreSQL with Slony database replication can be used in a cluster, where a lot of changes in data (edge points) are made, but where it is not crucial to have every change in a whole cluster at the same time (delay from seconds to minutes). The Slony replication time depends on the power of the slave server and the quantity of edge points in the replicated data.
For concurrent work over an extensive spatial database storage, where every GIS expert completes long-term analysis, the right solution would be to work on a local copy of the database and synchronize results and changes between themselves by database replications. PostgreSQL with Slony is usable everywhere and is modified by the included layers. Every layer in the spatial database is one table, and Slony does not modify a schema for replication automatically. For adding new layers in the database, it is better to use native PostgreSQL streaming replication or streaming MySQL SBR or RBR replication. Slony is useful for the database in production, where there are changes in data (Update, Insert and Delete) and some delay between the master and slave server is irrelevant. Slony replication can be used in a sensor network, which uses Low Power Wide Area Network (LPWAN) technologies for communication, where data transfer is not counted with precise time deadlines and it is not necessary to replicate every record immediately or how it was received into the master server. On the other hand, MySQL SBR-type replication is useful to show instant changes in spatial data. Any solution for movement tracking or online collaboration over one dataset (e.g., passporting trees using mobile phones) is necessary to synchronize every change in the dataset between databases for consistency.
Both replication mechanisms in this experiment proved that they were able to handle a small amount of data without overloading the network or CPU and were able to finish data replication in the order of seconds. During real-time cooperation, where users modified record by record (creating new points, updating record attributes), both replication mechanisms were able to provide a powerful distributed environment for this type of work.
Practically, these replication mechanisms have been primarily used for these research tasks [29,30,31]. The purpose of deployment of replication mechanisms for these research tasks was using an extensive spatial dataset; hence, the benefits of a distributed database network for load balancing between the master database (to write changes) and slave database (for solving analytical problems) were utilized [5].
Author Contributions
Conceptualization, Tomáš Pohanka, Vilém Pechanec; Methodology, Tomáš Pohanka; Software, Tomáš Pohanka; Validation, Tomáš Pohanka, Vilém Pechanec; Formal Analysis, Tomáš Pohanka; Investigation, Tomáš Pohanka; Resources Vilém Pechanec; Data Curation, Tomáš Pohanka; Writing—Original Draft Preparation, Tomáš Pohanka; Writing—Review and Editing, Vilém Pechanec; Visualization, Tomáš Pohanka; Supervision, Vilém Pechanec; Project Administration, Vilém Pechanec; Funding Acquisition, Vilém Pechanec All authors have read and agreed to the published version of the manuscript.
Funding
This paper was created within the project "Advanced application of geospatial technologies for spatial analysis, modelling, and visualization of the phenomena of the real world" (IGA_PrF_2020_027) with the support of Internal Grant Agency of Palacky University Olomouc.
Conflicts of Interest
The authors declare no conflict of interest.
References
- Urbano, R.; Arora, N.; Chan, Y.; Downing, A.; Elsbernd, C.; Feng, Y.; Galagali, J.; Klein, J.; Liu, J.; Lu, E.; et al. Oracle Database Advanced Replication 11g; Oracle: Redwood City, CA, USA, 2013; Volume 2. [Google Scholar]
- Samtani, G. B2B Integration: A Practical Guide to Collaborative E-Commerce; World Scientific: Singapore, 2002; ISBN 1-86094-326-8. [Google Scholar]
- Inmon, W.; Hackathorn, H.; Richard, D. Using the Data Warehouse, 2nd ed.; John Wiley & Sons: New York, NY, USA, 1996; ISBN 0471059668. [Google Scholar]
- Özsu, M.T.; Valduriez, P. Principles of Distributed Database Systems; Springer: New York, NY, USA, 2011; ISBN 9781441988331. [Google Scholar]
- Pohanka, T.; Pechanec, V.; Solanská, M. Synchronization and Replication of Geodata in the Esri Platform. In Proceedings of the 15th International Multidisciplinary Scientific GeoConference SGEM 2015, Albena, Bulgaria, 18–24 June 2015; Volume 1, pp. 837–844. [Google Scholar]
- Pohanka, T.; Pechanec, V.; Hejlová, V. Python Web Server for Sensor Data Visualization. In Proceedings of the 16th International Multidisciplinary Scientific GeoConference (SGEM 2016), Albena, Bulgaria, 30 June–6 July 2016; Volume 1, pp. 803–810. [Google Scholar]
- Mistry, R.; Misner, S. Introducing Microsoft SQL Server 2014 Technical Overview; Microsoft Press: Redmond, WA, USA, 2014; ISBN 9780735684751. [Google Scholar]
- Takada, M. Distributed Systems: For Fun and Profit. Available online: http://book.mixu.net/distsys/ (accessed on 29 January 2019).
- Mazilu, M.C. Database Replication. Database Syst. J. 2010, I, 33–38. [Google Scholar]
- Makris, A.; Tserpes, K.; Spiliopoulos, G.; Anagnostopoulos, D. Performance evaluation of MongoDB and PostgreSQL for spatio-temporal data. In Proceedings of the CEUR Workshop, Lisbon, Portugal, 26 March 2019; Volume 2322. [Google Scholar]
- Kabakus, A.T.; Kara, R. A performance evaluation of in-memory databases. J. King Saud Univ. Comput. Inf. Sci. 2017, 29, 520–525. [Google Scholar] [CrossRef]
- Aitchison, R. An Introduction to DNS. In Pro DNS and BIND; Apress: Berkeley, CA, USA, 2005; pp. 3–19. ISBN 1590594940. [Google Scholar]
- Bell, C.; Kindahl, M.; Thalmann, L. MySQL High Availability; O’Reilly Media, Inc.: Sebastopol, CA, USA, 2014; ISBN 9780596807306. [Google Scholar]
- Schönig, H.-J. PostgreSQL Replication, 2nd ed.; Packt Publishing: Birmingham, UK, 2015; ISBN 978-1-78355-060-9. [Google Scholar]
- Guyer, C.; Hubbard, J.; Byham, R. SQL Server Replication. Available online: https://docs.microsoft.com/en-us/sql/relational-databases/replication/sql-server-replication (accessed on 29 January 2019).
- MySQL Replication. Available online: https://dev.mysql.com/doc/refman/5.7/en/replication.html (accessed on 29 January 2019).
- Anon. Solid IT: DB-Engines. Available online: http://db-engines.com/en/ranking (accessed on 29 March 2020).
- Singer, S. Slony-I. Available online: http://www.slony.info/ (accessed on 26 February 2020).
- Schneller, D.; Schwedl, U. MySQL Admin Cookbook: Replication and Indexing; Packt Publishing: Birmingham, UK, 2011; ISBN 1849516146. [Google Scholar]
- Anon. MySQL :: MySQL 5.7 Reference Manual :: 16.2.2 Replication Implementation Details. Available online: https://dev.mysql.com/doc/refman/5.7/en/replication-implementation-details.html (accessed on 2 April 2020).
- Tiwari, S. Professional NoSQL, 1st ed.; John Wiley & Sons, Inc.: New York, NY, USA, 2011; ISBN 978-0-470-94224-6. [Google Scholar]
- Boicea, A.; Radulescu, F.; Agapin, L.I. MongoDB vs Oracle—Database comparison. In Proceedings of the 2012 3rd International Conference on Emerging Intelligent Data and Web Technologies, Bucharest, Romania, 19–21 September 2012; pp. 330–335. [Google Scholar]
- Abramova, V.; Bernardino, J.; Furtado, P. Which NoSQL Database? Open J. Databases 2014, 1, 8. [Google Scholar]
- Dolgikh, M. Vysoká Dostupnost v Relačních Databázových Systémech; Masaryk University: Brno, Czech Republic, 2014. [Google Scholar]
- Panduit. The Future of Copper: Category 8 Cabling; Panduit: Tinley Park, IL, USA, 2016. [Google Scholar]
- Hill, S. How Fast Is 5G. Available online: https://www.digitaltrends.com/mobile/how-fast-is-5g/ (accessed on 29 January 2019).
- IEEE. 802.11b-1999IEEE Standard for Information Technology—Telecommunications and Information Exchange between Systems—Local and Metropolitan Networks—Specific Requirements—Part 11: Wireless LAN Medium Access Control (MAC) and Physical Layer (PHY) Sp; IEEE: Piscataway, NJ, USA, 2000. [Google Scholar]
- Codd, F.E. Further Normalization of the Data Base Relational Model. Data Base Syst. 1972, 6, 33–64. [Google Scholar]
- Filippovová, J.; Pohanka, T. Environmental Assessment of Central European Floodplain Forests: A Case Study from the Morava River Alluvium. Polish J. Environ. Stud. 2019, 28, 4511–4517. [Google Scholar] [CrossRef]
- Pechanec, V.; Machar, I.; Pohanka, T.; Opršal, Z.; Petrovič, F.; Švajda, J.; Šálek, L.; Chobot, K.; Filippovová, J.; Cudlín, P.; et al. Effectiveness of Natura 2000 system for habitat types protection: A case study from the Czech Republic. Nat. Conserv. 2018, 24, 21–41. [Google Scholar] [CrossRef]
- Vrublova, K.; Pohanka, T. Is Environmental Conservation of European Beech-Dominated Forests Efficient? Fresenius Environ. Bull. 2019, 28, 1218–1223. [Google Scholar]
Figure 1.
Average Central Processing Unit (CPU) load during replication of the estimated pedologic-ecological unit (EPEU) layer by PostgreSQL (Slony).
Figure 1.
Average Central Processing Unit (CPU) load during replication of the estimated pedologic-ecological unit (EPEU) layer by PostgreSQL (Slony).

Figure 2.
Average CPU load during replication of the EPEU layer by MySQL.

Figure 3.
CPU core load during replication of EPEU layer by PostgreSQL (Slony).

Figure 4.
CPU core load during replication of EPEU layer by MySQL.

Figure 5.
Replication transfer speed of the EPEU layer by PostgreSQL (Slony).

Figure 6.
Replication transfer speed of the EPEU layer by MySQL.

Figure 7.
Average replication speed of the EPEU layer for different cluster configurations by PostgreSQL (Slony).
Figure 7.
Average replication speed of the EPEU layer for different cluster configurations by PostgreSQL (Slony).

Figure 8.
Average replication speed of the EPEU layer for different cluster configurations by MySQL.
Figure 8.
Average replication speed of the EPEU layer for different cluster configurations by MySQL.

Figure 9.
Replication time of changes of the EPEU layer.

Figure 10.
Replication time of the EPEU layer for different cluster configurations by PostgreSQL (Slony).
Figure 10.
Replication time of the EPEU layer for different cluster configurations by PostgreSQL (Slony).

Figure 11.
Replication time of the EPEU layer for different cluster configurations by MySQL.

Figure 12.
Average replication time of the EPEU layer for both replication solutions.

Figure 13.
Average replication time of layers with different cluster configurations by PostgreSQL (Slony).
Figure 13.
Average replication time of layers with different cluster configurations by PostgreSQL (Slony).

Figure 14.
Average replication time of layers with different cluster configuration by MySQL.

Figure 15.
Average replication time of layers with different cluster configurations by PostgreSQL (Slony).
Figure 15.
Average replication time of layers with different cluster configurations by PostgreSQL (Slony).

Figure 16.
Average replication time of layers with different cluster configurations by MySQL.


Table 1.
Criteria for a select database system for the experiment.
| Criterion | PostgreSQL | MySQL | Oracle | MS SQL | MongoDB |
| Coherence with projects and students’ lessons | Yes | Yes | No | No | No |
| Multiplatform | Yes | Yes | Yes | Yes | Yes |
| Hardware demands | Minimal | Minimal | Higher | Higher | Minimal |
| Software demands | Minimal | Minimal | Higher | Higher | Minimal |
| Store and process spatial data | Yes | Yes | Yes | Yes | Limited |
| Interconnection with GIS | Yes | Yes | Yes | Yes | Limited |
| User base | World-wide | World-wide | World-wide | World-wide | World-wide |
Table 2.
Information about data layers.
| Layer name | Dataset | Type | Number of edge points | Number of records | Table size (MB) |
| EPEU | Czech land authority | Polygon | 3,725,023 | 31,280 | 228 |
| City parts | ArcCR 500 | Point | 15,092 | 15,092 | 12 |
| Rivers | Data200 | Line | 338,959 | 14,606 | 21 |
| Cities | Data200 | Polygon | 672,299 | 6353 | 27 |
| World | NaturalEarth | Polygon | 411,132 | 1 | 4 |
Table 3.
Servers configuration.
| Parameter | PC | Notebook |
| Operation system | MS Windows 8.1 | MS Windows 10 |
| RAM | 8 GB | 4 GB |
| CPU | Intel Core i5-4590 | Intel Core i3-2330M |
| Graphic card | Nvidia GeForce GTX-960 | Nvidia GeForce GT-540M |
| Network card | Realtek RTL8110G | Broadcom NetLink |
| Network cable | OEM CAT5E UTP | OEM CAT5E UTP |
Table 4.
Statistics analyses of the replication time of the EPEU layer for both replication solutions.
Table 4.
Statistics analyses of the replication time of the EPEU layer for both replication solutions.
| Solution | PostgreSQL (Slony) | MySQL | ||||||
| Cluster conf. | PC as master server | PC as slave server | Direct conn. | 10 Mbps lim. | PC as master server | PC as slave server | Direct conn. | 10 Mbps lim. |
| Average | 23.00 | 11.40 | 14.63 | 99.14 | 1633.30 | 2656.50 | 1643.70 | 1628.10 |
| Variance | 7.39 | 0.05 | 0.07 | 0.07 | 926.01 | 6668.25 | 370.41 | 2451.89 |
| Range | 8.91 | 0.82 | 0.80 | 0.89 | 115.00 | 303.00 | 73.00 | 191.00 |
| Standard deviation | 2.72 | 0.22 | 0.26 | 0.26 | 30.43 | 81.66 | 19.25 | 49.52 |
© 2020 by the authors. Licensee MDPI, Basel, Switzerland. This article is an open access article distributed under the terms and conditions of the Creative Commons Attribution (CC BY) license (http://creativecommons.org/licenses/by/4.0/).
Share and Cite
MDPI and ACS Style
Pohanka, T.; Pechanec, V. Evaluation of Replication Mechanisms on Selected Database Systems. ISPRS Int. J. Geo-Inf. 2020, 9, 249. https://0-doi-org.brum.beds.ac.uk/10.3390/ijgi9040249
AMA Style
Pohanka T, Pechanec V. Evaluation of Replication Mechanisms on Selected Database Systems. ISPRS International Journal of Geo-Information. 2020; 9(4):249. https://0-doi-org.brum.beds.ac.uk/10.3390/ijgi9040249
Chicago/Turabian StylePohanka, Tomáš, and Vilém Pechanec. 2020. "Evaluation of Replication Mechanisms on Selected Database Systems" ISPRS International Journal of Geo-Information 9, no. 4: 249. https://0-doi-org.brum.beds.ac.uk/10.3390/ijgi9040249
Note that from the first issue of 2016, this journal uses article numbers instead of page numbers. See further details here.