Article

Site Selection Improvement of Retailers Based on Spatial Competition Strategy and a Double-Channel Convolutional Neural Network

1
State Key Laboratory of Information Engineering in Surveying, Mapping and Remote Sensing, Wuhan University, Wuhan 430079, China
2
Collaborative Innovation Center of Geospatial Technology, Wuhan University, Wuhan 430079, China
*
Author to whom correspondence should be addressed.
ISPRS Int. J. Geo-Inf. 2020, 9(6), 357; https://0-doi-org.brum.beds.ac.uk/10.3390/ijgi9060357
Submission received: 14 April 2020 / Revised: 9 May 2020 / Accepted: 24 May 2020 / Published: 27 May 2020

Abstract

:
The issue of site selection has become a critical challenge in the development of the retail industry with the growth of the Chinese economy and the improvement in the level of household consumption. Previous studies have considered the area of stores as the main factor of retail competition; however, the actual business performance of different stores in these studies was ignored. In addition, few studies have considered the differences in the spatial distribution of the factors of site selection. In this study, we discuss the improvement of site selection of small retail shops. A spatial competition index model was proposed as one of the features in estimating region market potential, and a market demand regression model of a double-channel convolutional neural network (CNN) was constructed based on the spatial correlation range of features. The study area was Guiyang, China. The experiments were based on the monthly sales data of fast-moving consumer goods retail stores in Guiyang. On the basis of the estimated results of the model, 18 sites with high potential for market demand were recommended. The performance of the proposed model was the best among well-known regression methods. Moreover, in comparison with a single-channel CNN, the proposed model decreased the root mean square error by 22.61%. Evaluation results showed that the proposed method could provide effective decision support for the issue of retail site selection.

1. Introduction

With the continuous growth of the Chinese economy and the increase in residents’ disposable income [1], new opportunities have arisen in the expansion of commercial facilities represented by retail stores, and challenges have also emerged for retail managers. In contrast to the dynamic nature of product management and marketing strategies, store locations have long-term stability and high migration cost. Good site selection can lead to potential market sales, reduce fierce commercial competition, and provide convenience for nearby residents. Moreover, it results in high profits [2] and promotes a virtuous circle of the economy. Therefore, the study of retail site selection is of great significance.
Spatial interaction theory is one of the most effective theories in retail location problems [3] and emphasizes the attraction and relative distance of the commercial district to consumers [4]. The theory was first mentioned by Reilly [5], who proposed the “Law of Retail Gravitation” based on Newton’s gravitation model, and concluded that the attraction of a city to consumers in its surrounding areas is positively correlated with the population size of the city and negatively correlated with the spatial distance between customers and the city. On this basis, Convers [6] modified and proposed the breaking-point model to determine the cut-off point for the retail attraction between two city commercial centers. Cohen and Applebaum [7] replaced the urban population with the store area and car driving time with the spatial distance, which improved the usability and flexibility of the model. Huff [8] extended the previous research on urban business districts to various types of commercial facilities and assessed the probability of customers visiting the commercial location based on the store area and the resistance of consumers to the store. Black [9] proposed a multifactor model to combine the factors that attract customers and hinder customers’ consumption. Based on the location data of social media, Wang et al. [10] proposed an improved spatial accessibility model to indicate market potential. Tierno et al. [11] proposed a competition index model using the analytic hierarchy process to consider the key factors for evaluating competitors.
With the application of spatial technology in socioeconomic problems, geographic information technology has been used to analyze the complex environmental factors in the issues of retail site selection. Piovani et al. [12] studied the hierarchical structure of the road network through penetration analysis and defined the urban retail location in combination with the retail model. Widaningrum [13] used the geographic information system to conduct a random sampling and superposition analysis of spatial data and made category prediction using support vector machines.
The rapid development of positioning technology and mobile internet has promoted the application of location-based service (LBS) data, which provide a large number of accurate data sources for further analysis of human activity trajectories and business behavior. Fang et al. [14] collected social media data during the rainstorm and flood disasters in Wuhan, analyzed the word frequency of related topics and extracted location information, and obtained the map of human activities and disaster hotspots most affected by the disasters. On the basis of continuous POI (point of interest) density analogy to urban terrain, Deng et al. [15] distinguished mountains and valleys by human activity frequency and detected urban spatial structure and distribution using a density contour tree method. Jiang et al. [16] used social media check-in data for spatial clustering, extracted evenly distributed samples of human activities, and evaluated consumers’ local sensitivity by combining their method with geographically weighted regression and Huff model to determine the best retail sites.
The factors influencing retail site selection are complex [17,18,19,20,21,22]. The application of machine learning provides a new scheme for accurately measuring the weight of various influencing factors in site selection. A constructed deep learning model can reflect the correlation between input and output data by extracting the features of input data, iteratively training the model, and dynamically adjusting the model parameters. As a class of neural networks in deep learning, the convolutional neural network (CNN) is widely used in medical image analysis [23], gesture recognition [24], emotional frame recognition [25], air quality prediction [26], and other fields, because it can extract features within a specific space [27]. Zheng et al. [28] used a residual neural network framework to simulate the time, period, and trend features of crowd flow and predict regional traffic flow. Wang et al. [29] constructed a CNN model that indicates the correlation between consumers and market demand for studying the sustainability of regional economies. CNN has a good prediction capability in processing spatial data because it can conveniently capture the data characteristics of the spatial target units and its surroundings. As a result, the CNN can provide a basic model for solving the issues of retail site selection.
In previous studies, the estimation of retail competition is usually based on the store areas and the relative distance between shops and consumers. However, in real situations, considering only the store area can easily ignore the diversity among the stores and the actual sales performance. In addition, when considering multifactor retail location problems, previous studies have neglected the differences of features in spatial distribution, and few studies have analyzed the spatial correlation of influencing factors.
The present work aims to improve the site selection of retailers with high potential for market demand, considering spatial competition and feature spatial correlation. For this purpose, we proposed a spatial competition model and constructed the data augmentation (DA)-double-channel CNN (DCCNN) model on the basis of the spatial correlation range of site selection features. First, we construct a spatial competition model on the basis of historical sales data of actual retail stores. Subsequently, classification is performed by comparing the ranges of spatial correlation coefficients of different features, and the training data set is augmented. The DCCNN model is then constructed on the basis of the classification results, and the market demand regression is predicted. Finally, retail sites are recommended on the basis of the regression results.
The remainder of this paper is organized as follows. Section 2 introduces the research area and data. Section 3 presents our proposed method. In Section 4, we present the experimental results and evaluation. Section 5 concludes this study and presents some suggestions for future work.

2. Study Area and Data
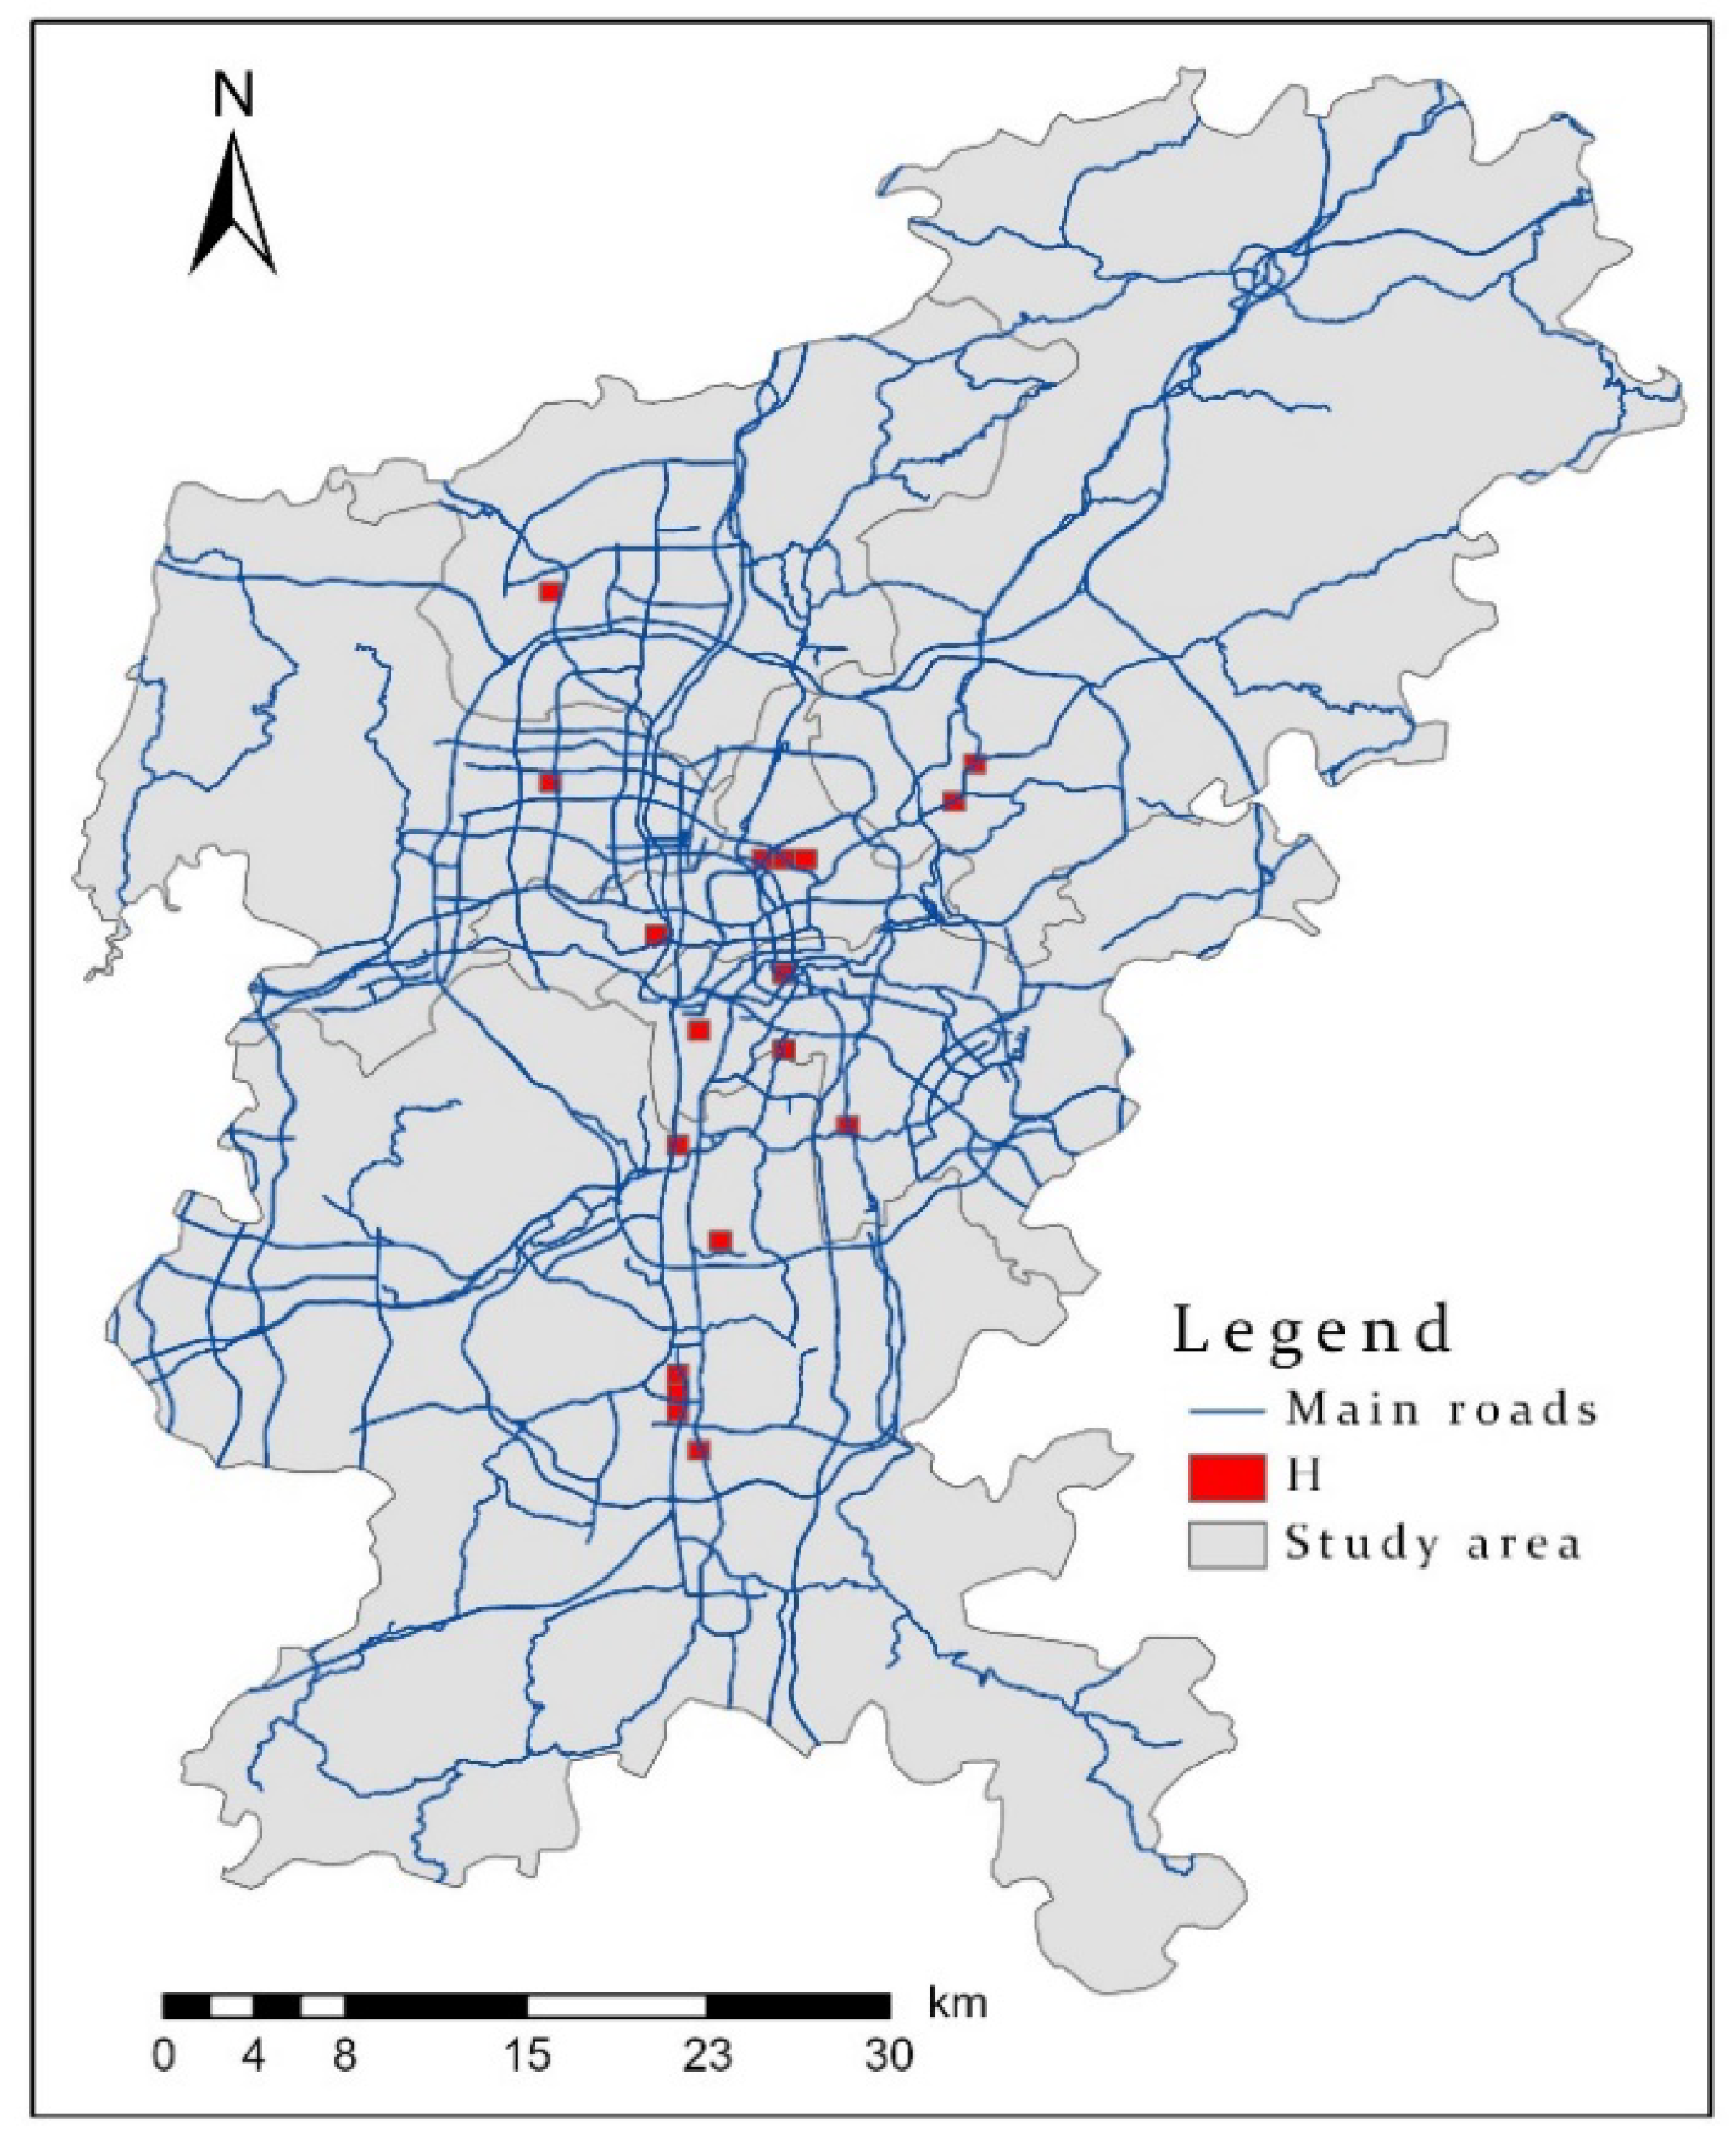
2.1. Study Area

Guiyang, the capital of Guizhou Province, is an important transportation hub, industrial base, and tourist resort, as well as an important gateway connecting the economic belt and the 21st century maritime silk road. With the arrival of the database of domestic operators in Guizhou, the big data industry in Guiyang has achieved historical development. On the basis of the data from the government official website of Guiyang [30] in 2019, Guiyang has a total area of 8034 square kilometers and permanent population of 4.802 million people. Its GDP reached 403.96 billion yuan, which is an increase of 7.4% from the previous year. Guiyang consists of six districts, one city, and three counties. Figure 1 shows the study area, including six administrative regions, namely, Huaxi, Nanming, Yunyan, Guanshanhu, Baiyun, and Wudang Districts. The study area contains several national forest parks, colleges and universities, railway stations, high-speed railway stations, airports, major business areas, and many retail stores. The sustainable development of Guiyang has led to the formation of new city business centers and brought new opportunities for the retail industry. Therefore, estimation of potential market demand and site selection of retail stores are important issues for enterprise managers.

2.2. Data

The data used in this study mainly included population density, social media check-in, POIs, historical sales data and store location of fast-moving consumer goods (FMCG) stores in Guiyang, administrative division data, and road network data. The geographical coordinate system used was GCS_WGS_1984, and the projection coordinate system was WGS_1984_UTM_Zone_48N.
The population density data were obtained from the WorldPop [31] data set, which is an open spatial demographic data platform [32]. This data set provides the annual population density raster data of all countries in 2000–2020, with an accuracy of 3 arc (approximately 100 m), and the unit is the total population per pixel. WorldPop population data provides strong support in the field of spatial population related research, and its accuracy is remarkably improved compared with traditional methods [33]. In this study, the original population raster data of China in 2016 were used, and the missing values were filled on the basis of the adjacent grid values. The average value of cells in each grid was calculated as the grid population data. Figure 2 shows the WorldPop population raster data.
Social media check-in data were collected from the user data of Sina Weibo LBS. Sina Weibo is China’s largest blogging platform, with 516 million monthly active users and 12.24 billion yuan in annual revenue as at the end of 2019. Similar to Twitter, users can post real-time updates on the platform, including text, pictures, videos, location, and other information. In this study, we used the crawler of the Sina Weibo webpage [34] to obtain users’ check-in data with the location keyword of “Guiyang” from January 1, 2016 to December 31, 2016. After data cleaning, latitude and longitude range selection, and attribute selection, 41,220 data points with user ID, latitude and longitude, and release time of user check-in were retained, as illustrated in Table 1.
POI data were taken from the Baidu map open platform [35]. Baidu map is one of the most widely used high-precision pieces of navigation software used in China, covering 150 million POI data worldwide and providing application programming interface (API) invocation services for developers. In this study, the POI data were obtained by calling the Baidu map API, and a total of 65,620 data points were obtained after data cleaning.
Retail sales and store location data were collected from local partners. The retail sales data are the monthly sales data of 5504 FMCG retail stores in Guiyang from January to December 2016. The types of stores are small supermarkets and convenience stores, and the location data of stores are in the form of longitude and latitude.
Guiyang vector map data and administrative divisions were from the National Catalogue Service for Geographic Information [36]. The road network data was taken from Open Street Map (OSM), which includes motorways, trunk roads, primary roads, secondary roads, and branch roads. The length of the road was calculated using ArcGIS Pro 2.4.0.

3. Methods

In the study of the issues of retail site selection, competition degree [37] and market potential [38] are important evaluation indexes. However, considering only the competition degree of the business area factor may ignore the difference in the actual business situation of many stores. Moreover, the accurate assessment of the regional sales level may be affected by the difference of the range continuity in the spatial distribution of crowdsourced spatiotemporal data. Therefore, this study proposes a spatial competition model based on actual sales data and analyzes the spatial correlation range of crowdsourced data. On this basis, we constructed the DA-DCCNN model, which represents the relationship between the factors of site selection and market demand, and finally recommended 18 retail sites. Figure 3 shows the framework of the proposed method.

3.1. Preprocessing

3.1.1. Feature Selection and Normalization

Complex social, economic, and environmental factors must be considered in retail site selection. Given the availability of influencing factors and related literature research results [11,18,39,40], we evaluated the market potential demand of retail stores from four dimensions, namely, consumer groups, urban infrastructure, road network, and commercial competition. In this study, consumer groups were subdivided into local permanent residents and passenger flow. On the basis of the characteristics of the original data, the population data of WorldPop were used as the parameter to measure the local permanent residents, and the Sina Weibo check-in data were used as the representative of passenger flow to cover the samples affecting the retail site selection comprehensively. POIs were set as the influencing factor of surrounding facilities. Furthermore, we used the method in Section 3.2.1 to estimate the business competition of each grid. Table 2 presents the influencing factors.
Given the different specifications of each evaluation index, we used normalization in data preprocessing to improve the calculation speed and accuracy, and to avoid the influence of singular data. We scaled the data on the basis of the size of the relative maximum and minimum values on a data scale between 0 and 1; the formula of normalization is as follows:
  D i j = D i j D i m a x D i m i n ,
where D i j represents the normalized value of element j of feature i; D i j is the original value of element j of feature i; and D i m a x and D i m i n represent the maximum and minimum values of feature i, respectively.

3.1.2. Correlation Coefficient

The Pearson correlation coefficient (PCC) was introduced to measure the degree of linear correlation between two variables. The calculated value is in the interval of [−1, 1]. The variable is linearly uncorrelated when the value is 0. The [0, 1] interval indicates a positive correlation, and the negative correlation is located in the [−1, 0] interval. The closer the absolute value is to 1, the greater the correlation will be. PCC is widely used in feature selection [41] and correlation evaluation [42]. The calculation formula is as follows:
ρ X , Y = c o v ( X , Y ) σ X σ Y = E [ ( X μ X ) ( Y μ Y ) ] σ X σ Y ,
where X, Y represent different variables, and ρ X , Y represents the PCC of X and Y.

3.1.3. Data Augmentation (DA)

In real-world scenarios, a shortage exists in data sets, such as in medical imaging and business data. However, complex neural network training contains many parameters, which requires numerous data for training. Moreover, adding noise or deformation data can improve the generalization capability and robustness of the neural network. DA is a commonly used precision improvement technology for image classification [43]; it can be divided into online and offline DA. On the premise of not changing the image label, the number of training sets can be expanded on the original basis of utilizing image flip, rotation, scaling, shift, noise addition, and other technologies.
The rotation and flip of an image do not change the relative spatial position of each feature factor; thus, they do not influence the model evaluation based on the total sales volume of the region. Therefore, in this study, the model of the input matrix was augmented offline, and the data were expanded before inputting to the model. The augmentation processing of two-dimensional input matrix included the rotation of the original image by 90°, 180°, and 270° counterclockwise and flipping vertically and horizontally. The number of training data points after augmentation increased to 3102, which is 6 times the original number of data points of the training set. Figure 4 shows the DA process.

3.2. Spatial Relationship Analysis

3.2.1. Spatial Competition Index

Commercial competition is an important factor to be considered in retail site selection. Less competition implies more market share and more profits for enterprises. The degree of competition is related to the attraction and relative distance of the store to customers. Traditional attraction is measured by the business area of the store; however, the true business situation of the store is ignored. In this study, the average monthly sales of the retail store were used as the evaluation index of the attraction, which can better reflect the true business situation. On the basis of previous studies, a spatial competition index was proposed based on the gravity model to evaluate the competitive relationship between the target area (basic grid) and the adjacent grid, as shown in Figure 5. The formula of the spatial competition index as follows:
c i j = s j λ 1 + ln ( 1 + D i j ) ,
C i = j = 0 n c i j ,
where c i j is the competition degree of the center point of grid i (i = 0–m) by the surrounding store j (j = 0–n), and s j is the monthly average sales of store j. D i j is the Euclidean distance between the center point and store j, and λ is the sensitivity coefficient that prevents the variance from being excessively large. The denominator is nonzero. C i is the sum of the competition index of grid i by all the stores in the adjacent eight grids.
As shown in Figure 5, Point A is the center point of grid i, and j1–j7 are the retail stores located in the eight adjacent grids of grid i. The straight line with the arrow indicates the Euclidean distance between the center point of the grid and the adjacent grid stores. The spatial competition index of the grid i can be calculated by Equation (4).

3.2.2. Range of Feature Spatial Correlation

According to Tobler’s First Law of Geography, spatially similar objects in space have a high similarity. The distribution of different variables has different ranges of spatial correlation because the spatial distribution of variables in the actual geographical scene is not uniform. When using a CNN, the size of the convolution kernel affect the model results [44]. Therefore, in this study, we proposed the evaluation method for the range of feature spatial correlation. It can be indicated that a strong feature spatial correlation exists in a large range, when the feature spatial correlation coefficient is large and remains constant with the increase in grid size. Furthermore, CNN convolution kernels could be set largely for this kind of feature. Conversely, it can be implied that a strong spatial correlation only exists in a small range, when the feature spatial correlation coefficient is small and changes distinctly with the increase in grid size; thus, a small convolution kernel size can be set. The principle is shown in Figure 6.
As shown in Figure 6, the base grid is divided into 16 × 16 cells. C1 is the center point of the basic grid, P1–P8 represent the POIs; a–e represent the area of a 2 × 2 grid, and the ring grid area of 4 × 4 , 8 × 8 , 12 × 12 , and 16 × 16 , respectively. The evaluation steps of the range of feature spatial correlation are as follows.
Step 1: Perform spatial statistics on the total population, the sum of Sina Weibo check-in data, and the total of POIs in regions a–e (Figure 6). Taking Figure 6 as an example, the spatial statistical results of POI in regions a–e are 2, 1, 2, 2, and 1, respectively.
Step 2: Calculate the PCC between the statistical results of each feature in region a (Figure 6) and the statistical results in the adjacent ring grids (regions b–e, as shown in Figure 6), respectively. The formula is as follows:
ρ X F i , Y F i = c o v ( X F i , Y F i ) σ X F i σ Y F i = E [ ( X F i μ X F i ) ( Y F i μ Y F i ) ] σ X F i σ Y F i ,
where ρ X F i , Y F i is the PCC (Equation (2)) between the spatial statistical results of the feature in the region of the 2 × 2 grid and variable Y , and Y represents the spatial statistical result of the feature in regions b–e (Figure 6), respectively. F i (i = 0, 1, 2) represent the three types of features, namely, population, Sina Weibo check-in, and POIs, respectively.
Step 3: Compare the size and variation trend of the spatial correlation coefficient of features in regions b–e (Figure 6). On this basis, set the convolution kernel size of the different sizes of features.

3.3. Estimation of Market Potential Demand

3.3.1. Double-Channel Convolutional Neural Network (DCCNN)

The CNN is a common deep learning framework, which has been widely used in the field of imaging processing. A complete CNN usually consists of the input layer, convolutional layer, pooling layer, activation function, and the fully connected (FC) layer. In particular, the convolution layer is the core of the CNN. Image features are extracted by the convolution operation of the convolution kernel and its covering matrix. The convolution formula is as follows:
A i , j = a = 0 m b = 0 n K a , b M i + a , j + b + w ,
where A i , j represents the feature image element after convolution operation, K is the convolution kernel with the size of m × n , M is the input matrix, and w is the bias term.
The input to the CNN is in the form of a two-dimensional matrix. When the input is an RGB-colored image, the input is composed of three channels representing the three colors, and each channel is a two-dimensional matrix. After the feature matrix is convolved, the nonlinear feature of the network is enhanced by the activation function, and it is then used as the input of the pooling layer. Pooling can improve the generalization capability of the model and reduce overfitting. The FC layer plays a role of classification or regression in the CNN. This layer is composed of many tiled neurons, and maps the distribution features extracted after multiple convolution and pooling to the sample space. Figure 7 shows the DCCNN structure used in this study.
As shown in Figure 7, the DCCNN model has four input data and two parallel convolution channels.   I n p u t 1 is one of the convolution channels with C h 1 number of channels. For inputting features with a strong spatial correlation in a small range, the input format is a 16 × 16 matrix with the number of batch size. Every element of the matrix is equivalent to a pixel, and each pixel value has feature spatial statistics within the grid of 50 × 50   m 2 . After the convolution layer with a kernel size of   3 × 3 and rectified linear unit (ReLU) layer activation function were determined, four feature maps were obtained, which were the inputs of the subsequent max-pooling layer. After pooling, the feature maps were convoluted again to extract features further. C o n v 2   and   C o n v 3 represent eight filters with kernel sizes of 3 × 1 and 1 × 3 , respectively. ReLU is the activation function. The calculated output is again pooled, and the result was placed into the flatten layer ( F l a t t e n 1 ), which allocates the multidimensional matrix into a one-dimensional matrix. Another convolution channel input ( I n p u t 2 ) with C h 2 number of channels was used for features with strong spatial correlation among a large range and with an input of 16 × 16 matrix with number of batch size. Two feature maps were outputted using the convolution layer with a kernel size of 5 × 5 and ReLU activation function to obtain a large perspective field. The pooling, convolution, and flatten layers were similar to the first convolution channel. Average pooling was used in this study instead of max pooling. I n p u t 3 is a one-dimensional matrix, and the element is the spatial competition of the 16 × 16 grid area (Equation (4)). I n p u t 4 has the same shape as I n p u t 3 , and the element is the road network density of the 16 × 16 grid area. The concatenate layer connects F l a t t e n 1 , F l a t t e n 2 , I n p u t 3 , and I n p u t 4 into a one-dimensional matrix and inputs them into the FC layer with 16 neurons. Regularization dropout was used in front of the input by randomly shutting down 10% of the neurons to avoid overfitting. The output was activated by ReLU and was the input of F C 2 with only one neuron. The final output was the result of the model regression. During training, the error between the regression result of each iteration and the actual value was compared, and the parameters were adjusted in the direction of gradient descent of the loss function in the iteration until the loss function found the local or global minimum. Table 3 presents the structural parameters of the DCCNN model.

3.3.2. Accuracy Metrics

Several commonly used error evaluation indexes, including root mean square error (RMSE), mean absolute error (MAE), and mean square error (MSE), were introduced. These indexes were used to calculate the error between the true and predicted values of the model and evaluate model accuracy conveniently in comparison with other algorithms. In this study, we define MSE as the loss function while training. We define n as the number of predicted values. y i (i = 1 − n) is the true value, and y ^ i (i = 1 − n) is the predicted value corresponding to the model. RMSE is calculated as follows:
R M S E = 1 n i = 1 n ( y i y ^ i ) 2 ,  
MAE and MSE are calculated as follows:
M A E = 1 n i = 1 n | y i y ^ i | ,
M S E = 1 n i = 1 n ( y i y ^ i ) 2 .

4. Results and Analysis

4.1. Spatial Division

According to Wang et al. [45] on spatial grid partition, the modifiable area unit problem (MAUP) should be considered for scale effects because spatial statistical results will be different with the change in scale division. To address the MAUP, the general maximum of PCC between spatial statistics of features and regional sales was used to find the optimum grid size. In this study, the research area was divided into 10 types of basic grid, ranging from 100 × 100   m 2 to 1000 × 1000   m 2 . An appropriate sensitivity coefficient λ in Equation (3) was adjusted and determined to maximize the PCC between spatial competition index (Equation (4)) and summed sales in the basic grid. The determined value of λ (as shown in Table 4) was calculated as a parameter in the construction of the DCCNN model. The spatial statistics of features were calculated in each size of the grid, including size of population, count of Sina Weibo check-in, count of POIs, value of spatial competition index (Equation (4)) and density of road networks. The PCC between the statistical results and summed sales in the grid was calculated, as shown in Table 4; Pop, Check-in, POIs, and SCI represent population, Sina Weibo check-in count, POIs count, and spatial competition index, respectively. As shown in the trend results in Figure 8, the x-coordinate for the unit is hundreds of meters to the basis of the grid size, and the y-coordinate denotes the value of the PCC between results of feature spatial statistics and regional sales. The results show that the PCC between results of feature spatial statistics and regional sales increases with the grid scale. When the grid size reaches 800 × 800   m 2 , the growth rate of the correlation slows, the value tends to be stable, and the fluctuation is small.
In this study, 800 × 800   m 2 was selected as the size of the basic grid, and λ was set to 0.32. The study area was divided into 4302 grids of 800 × 800   m 2 . A total of 515 grids have retail stores, which is the experimental data set. Among the remaining 3785 grids, many have no shops but have a dense population, Sina Weibo check-ins, and POIs, and thus have market potential. In particular, 569 grids have POIs and Sina Weibo check-in data.

4.2. Evaluation for Range of Feature Spatial Correlation

According to the definition in Section 3.2.2, the calculation results of the spatial correlation coefficient of the features are shown in Figure 9, where the x-coordinate is the ring grid with different sizes, and the y-coordinate is the PCC between the spatial statistics of feature area a (Figure 6) and the spatial statistics of the grid of x-coordinate size (Equation (5)). As shown in Figure 9, the population data still have a strong spatial correlation coefficient even in a large range. However, given the limitation of population mobility and radiation range, the spatial correlation coefficient between check-in data and POI gradually decreases with the increase of distance, and only has a strong spatial correlation in a small range.
Therefore, in view of the relationship between the perceived field size and feature range of the CNN [46], the DCCNN can better reflect the actual distribution of features compared with the single-channel CNN, and thus has more advantages in theory. Therefore, we used the check-in data and POIs as the input of the same convolution channel, with a small kernel size of 3 × 3 . The population data were used as the input to another channel, with a large convolution kernel size of 5 × 5 .

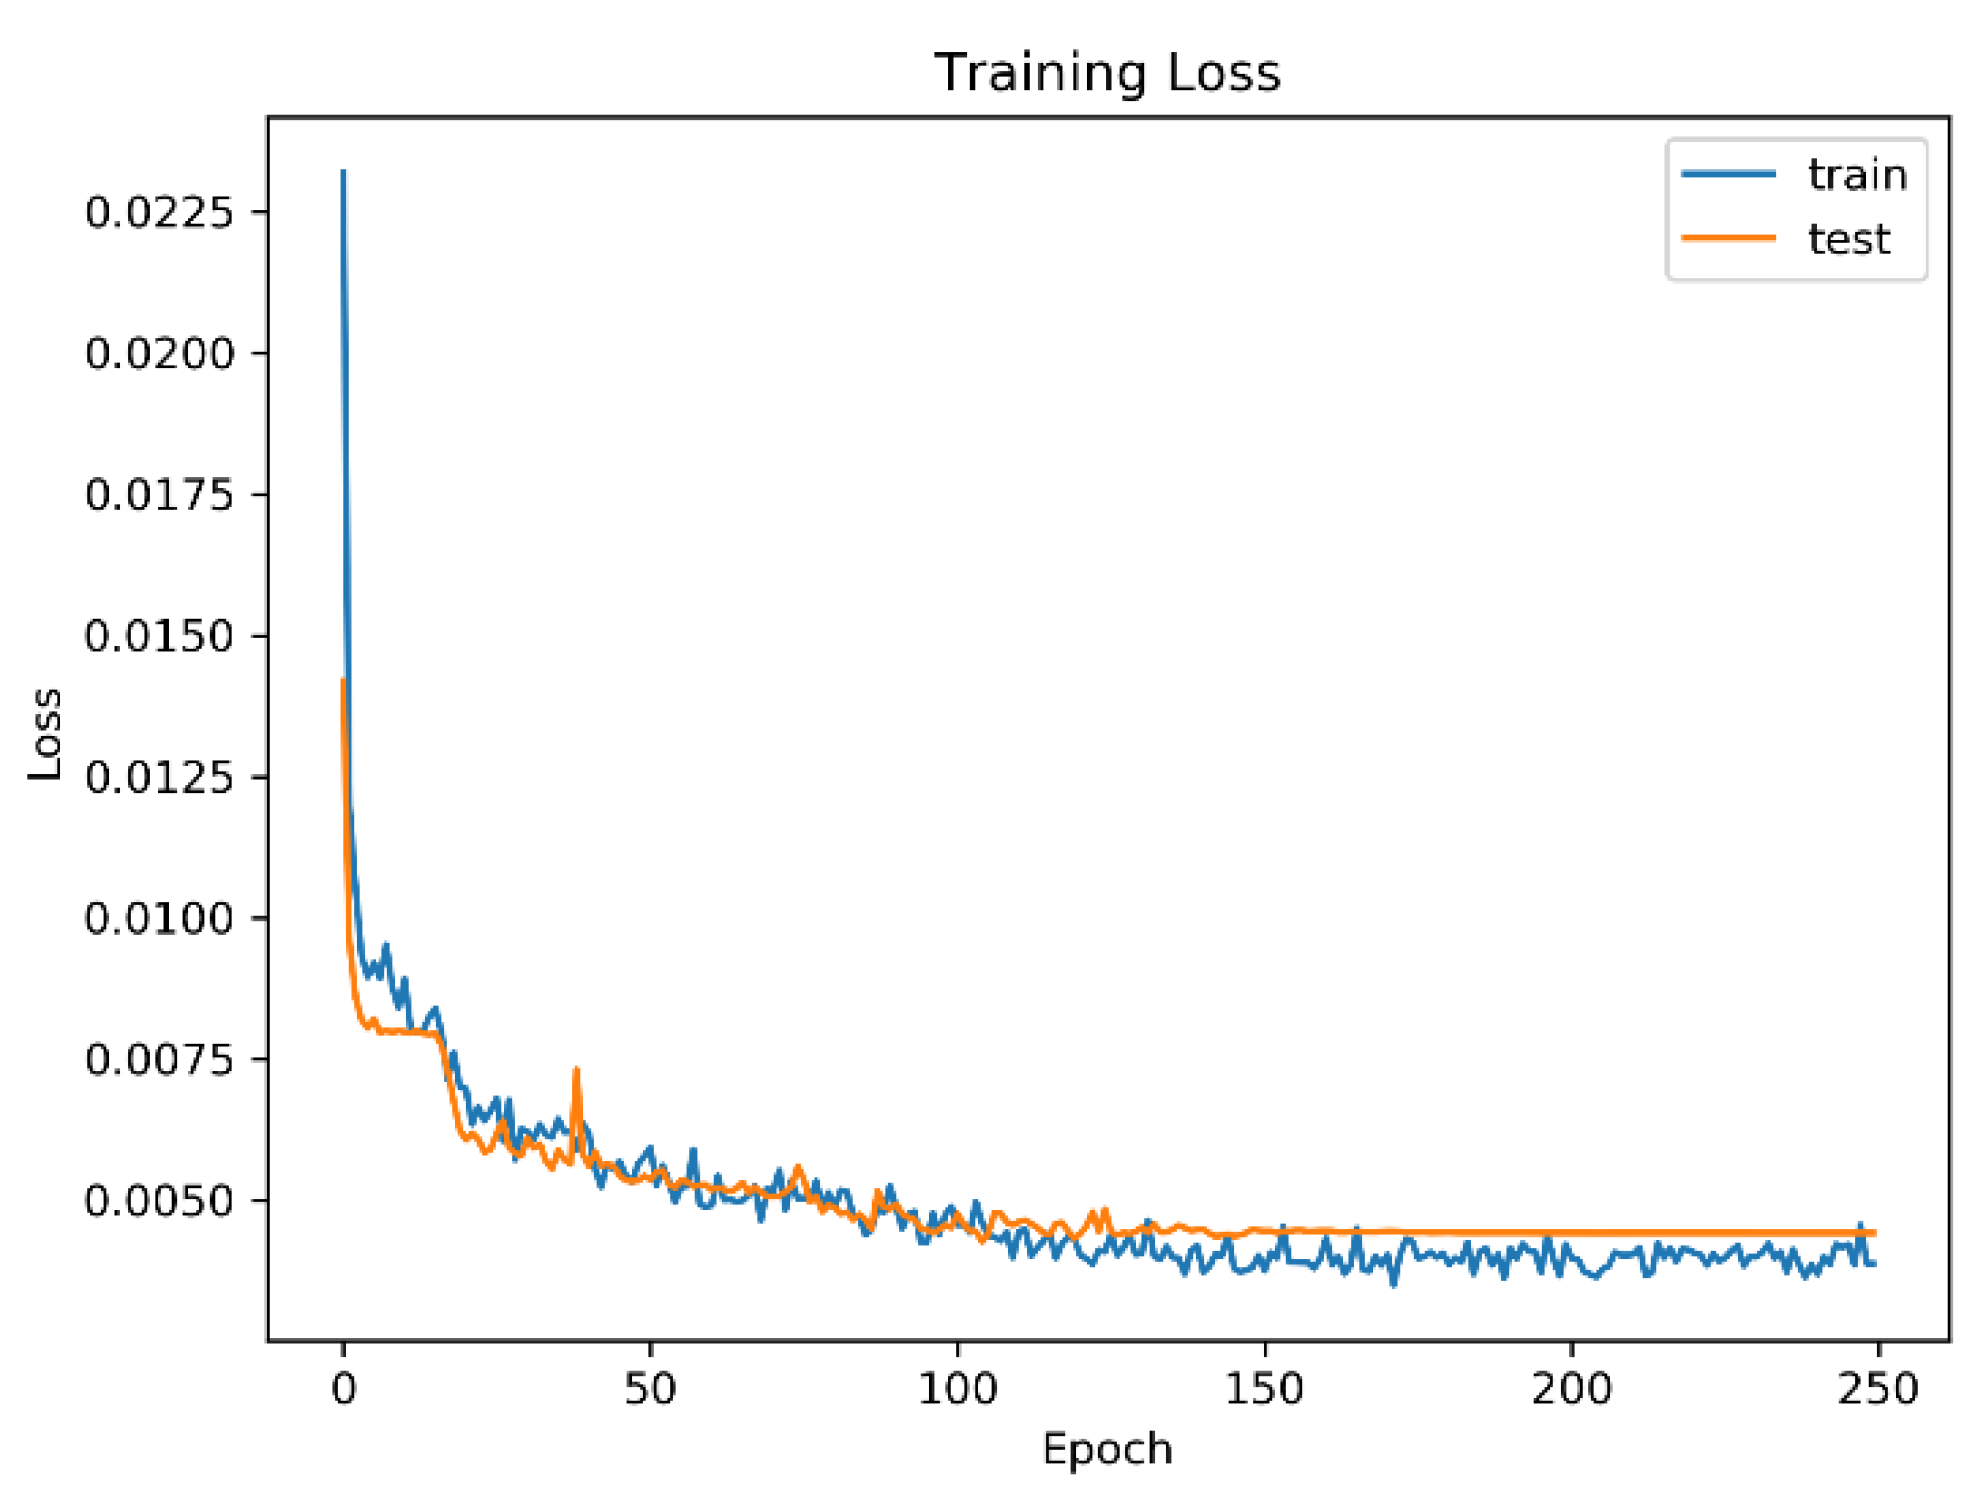
4.3. DA-DCCNN Model Training

Retail site selection aims to select sites with high market potential, that is, sites with a high market demand considering the market competition. The research area was divided into 4302 grids of 800 × 800   m 2 , among which 515 grids have store data. The original 515 data were divided into 309 for the training sets (60%), 103 for the validation set (20%), and 103 for the test set (20%). The training set was increased to 1854 after DA. The input features included population data, Sina Weibo check-in data, POIs, spatial competition index, and road network density. The output was the total monthly sales of all the retail stores in the region, and a model was constructed to express the relationship between market demand and site selection factors. The experiments were implemented based on the Scikit-learn and Keras machine learning libraries. Table 5 shows the training parameters.
After training the DA-DCCNN model parameters, the market demand of 569 grids in the research area without shops and nonempty POIs and check-in numbers was predicted. Figure 10 shows the results.
Eighteen red grids (H) are shown, which indicates that the predicted market demand is higher than the average value (RMB 330,866) of the original monthly sales data by RMB 200,000; that is, the predicted monthly sales is higher than RMB 530,866. Therefore, the market demand in this region is large, and investors can prioritize setting up retail stores in this region. A total of 38 green areas (M) exist; these are areas with predicted sales higher than the average but lower than RMB 530,866. These areas have certain market demand, and retail managers can choose appropriate sites on the basis of the specific investment environment. The remaining blue areas (L) are those areas where the market demand is predicted to be lower than the average. Decision makers should carefully consider the specific situation when selecting such areas.
The red areas in Figure 10 are the 18 recommended sites, as shown in Figure 11. The 18 recommended areas are mainly distributed in the downtown area along main roads. Table 6 shows the specific situation of some of the recommended areas.
As shown in Table 6, the grid image of the first three recommended regions is mainly red, which indicates that the population density of the region is relatively high. In particular, region 3 is the concentrated area of government agencies in Huaxi District, Guiyang, surrounded by a large area of residential areas and commercial centers; thus, the forecast market potential of this region is relatively high. Although the population density of Regions 4–6 is not as high as that of Regions 1–3, the data indicate POIs are dense and the number of Sina Weibo check-in is large; hence, passenger flow is high in this region, and the market demand is large. In the sixth area, middle schools, hospitals, commercial centers, and residential communities have many potential consumers. The seventh area has a small number of POIs and check-ins, with medium population density; moreover, the building land is mainly concentrated on both sides of the main road. The reason for the high market potential in this area may be that it is in the subcenter of the city. The number of existing shops around the area is considerably less than that in areas 1–6, and business competition is low.
On the basis of the prediction results of the DA-DCCNN, the regions with high market potential can be further screened to provide an efficient reference for the retail site selection strategy of enterprise investors. The regions with more significant market potential and less commercial competition can be selected as the locations of new stores. In the actual site selection, the strategy can be adjusted on the basis of the complex social and economic factors.

4.4. Model Accuracy Evaluation

Figure 12 shows the loss function during model training. When the epoch value is over 150, the losses of the training and test sets tend to be stable and reach the minimum value.
Support vector regression (SVR) is effective for the regression of multidimensional features. A random forest (RF) can balance data set errors and improve model robustness. XGBoost is often used in solving regression problems [47] based on the boosting tree model. In comparison with traditional machine learning algorithms, such as SVR and RF, CNN neurons can automatically extract features in the area around the target unit [48], and DCCNN retains this advantage. Table 7 presents the comparison results of the DA-DCCNN model with several previous regression prediction models.
The RMSE of SVR, RF, XGBoost, and single-channel CNN are 0.0933, 0.0858, 0.0814, and 0.0849, respectively. The MSE, MAE, and RMSE of the DA-DCCNN are the smallest among several models, with an RMSE of 0. 0657, which is 22.61% less than that of the single-channel CNN and 19.29% less than that of XGBoost. In comparison with the single-channel CNN, the proposed DA-DCCNN considers the spatial correlation range of features and obtains more data training model parameters. In comparison with SVR, RF, and XGBoost, the proposed DA-DCCNN considers the spatial properties of data and can better obtain context information. Overall, the proposed DA-DCCNN model is more accurate and can provide a more effective reference for retail site selection.

5. Conclusions

The development of China’s economy and the increase in residents’ disposable income have promoted the development of the retail industry, making retail site selection one of the most important issues in the commercial field [49]. In this study, we proposed a model to estimate the regions with the highest potential for market demand as an assessment of possible store sites considering spatial competition. The main findings and contributions of this study are as follows:
(1) A spatial competition model based on grid cells was proposed to help estimate market demand. Because consideration of the store area in isolation may ignore the real sales conditions of retailers in different regions, considering real sales data and relative distance of adjacent stores can help retail managers accurately evaluate the market competition status of the target region.
(2) A DA-DCCNN model was constructed to estimate the potential for market demand. The experimental results show that the DA-DCCNN model has higher accuracy, with an RMSE of 0.0657, which is 22.61% lower than that of a single-channel CNN and 19.29% lower than that of XGBoost. The model is highly extensible and can be adjusted on the basis of the characteristics of different cities.
The results of this study can help retail managers find sites with high market demand on the premise of commercial competition, thereby providing a reference for retail site selection and supply chain distribution.
In this study, we mainly used the location of social media users. However, the semantic, emotional, and spatiotemporal changes and other information were not fully mined; these factors can provide valuable information for consumer behavior analysis and market demand estimation. In this study, the sum of POIs of all categories was calculated as a whole feature, and the influence weight and scope of different types of POI on site selection were not considered. Therefore, in future research, we should fully integrate crowdsourced spatiotemporal big data, mine effective information, and improve the accuracy and reliability of site selection. In actual retail site selection, other complex factors, such as rent, store area, policy, public security, and local consumption structure, should be considered to further optimize the location selection results.

Author Contributions

Jiani Ouyang and Hong Fan conceived the original idea for the study; Jiani Ouyang, Luyao Wang and Mei Yang conceived and designed the methodology. Jiani Ouyang performed the experiments and wrote the paper; Jiani Ouyang, Hong Fan, Luyao Wang, Mei Yang and Yaohong Ma revised and edited the paper. All authors have read and agreed to the published version of the manuscript.

Funding

This research was supported by the National Key Research and Development Program of China (Grant No. 2019YFB1405600).

Acknowledgments

The authors would like to thank Zhou Hang for his kindly help in the data collection in the experiment.

Conflicts of Interest

The authors declare no conflict of interest.

References

  1. Zhang, Y.; Liu, X.; Zhang, T.; Gu, Z. Review of the Electric Vehicle Charging Station Location Problem. In Proceedings of the DependSys: International Conference on Dependability in Sensor, Cloud, and Big Data Systems and Applications, Guangzhou, China, 12–15 November 2019; pp. 435–445. [Google Scholar]
  2. Pachecano, L.C.; Larralde, H. Agglomeration or separation: Store patterns through an optimal location model. Phys. A Stat. Mech. Appl. 2020, 542, 123366. [Google Scholar] [CrossRef]
  3. Sen, A.; Smith, T.E.; Sen, P.D.A.; Smith, P.D.T.E. Gravity Models of Spatial Interaction Behavior; Springer Science and Business Media LLC: Berlin/Heidelberg, Germany, 1995. [Google Scholar]
  4. Le Texier, M.; Caruso, G. Aggregate and Disaggregate Dynamic Spatial Interaction Approaches to Modeling Coin Diffusion. In Spatial Analysis and Location Modeling in Urban and Regional Systems; Springer Science and Business Media LLC: Berlin/Heidelberg, Germany, 2017; pp. 193–222. [Google Scholar]
  5. Reilly, W.J. The Law of Retail Gravitation; University of California: Oakland, CA, USA, 1931. [Google Scholar]
  6. Converse, P.D. New laws of retail gravitation. J. Mark. 1949, 14, 379–384. [Google Scholar] [CrossRef]
  7. Cohen, S.B.; Applebaum, W. Evaluating store sites and determining store rents. Econ. Geogr. 1960, 36, 1–35. [Google Scholar] [CrossRef]
  8. Suhara, Y.; Bahrami, M.; Bozkaya, B.; Pentland, A.S. Validating Gravity-Based Market Share Models Using Large-Scale Transactional Data. arXiv 2019, arXiv:1902.03488. [Google Scholar]
  9. Qun-Hong, L.; Pu-Ping, Z.; Min, L. An Empirical Study of Urban Trade Area Evolutionary Mechanism Based on Gray Correlation Analysis—A Case Study in Nanchang. In Proceedings of the 19th International Symposium on Advancement of Construction Management and Real Estate; Springer Science and Business Media LLC: Berlin/Heidelberg, Germany, 2015; pp. 1111–1120. [Google Scholar]
  10. Wang, L.; Fan, H.; Wang, Y. Site Selection of Retail Shops Based on Spatial Accessibility and Hybrid BP Neural Network. ISPRS Int. J. GeoInf. 2018, 7, 202. [Google Scholar] [CrossRef] [Green Version]
  11. Tierno, N.R.; Puig, A.B.; Vera, J.M.B.; Perez, C.E. Assessing food retail competitors with a multi-criteria GIS-based method. Economía Agraria y Recursos Naturales 2018, 18, 5–22. [Google Scholar] [CrossRef]
  12. Piovani, D.; Molinero, C.; Wilson, A. Urban retail location: Insights from percolation theory and spatial interaction modeling. PLoS ONE 2017, 12, e0185787. [Google Scholar] [CrossRef] [Green Version]
  13. Widaningrum, D.L. GIS and SVM Approach for Convenience Store Location Analysis. In Proceedings of the 9th International Conference on Machine Learning and Computing, Singapore, 24–26 February 2017; pp. 112–116. [Google Scholar]
  14. Fang, J.; Hu, J.; Shi, X.; Zhao, L. Assessing disaster impacts and response using social media data in China: A case study of 2016 Wuhan rainstorm. Int. J. Disaster Risk Reduct. 2019, 34, 275–282. [Google Scholar] [CrossRef]
  15. Deng, Y.; Liu, J.; Liu, Y.; Luo, A. Detecting Urban Polycentric Structure from POI Data. ISPRS Int. J. GeoInf. 2019, 8, 283. [Google Scholar] [CrossRef] [Green Version]
  16. Jiang, W.; Wang, Y.; Dou, M.; Liu, S.; Shao, S.; Liu, H. Solving Competitive Location Problems with Social Media Data Based on Customers’ Local Sensitivities. ISPRS Int. J. GeoInf. 2019, 8, 202. [Google Scholar] [CrossRef] [Green Version]
  17. Byun, S.-E.; Han, S.; Kim, H.; Centrallo, C. US small retail businesses’ perception of competition: Looking through a lens of fear, confidence, or cooperation. J. Retail. Consum. Serv. 2020, 52, 101925. [Google Scholar] [CrossRef]
  18. Chen, T.-Y.; Chen, L.-C.; Chen, Y.-M. Mining Location-Based Service Data for Feature Construction in Retail Store Recommendation. In Proceedings of the 17th Industrial Conference Data Mining, New York, NY, USA, 12–13 July 2017; Volume 10357, pp. 68–77. [Google Scholar]
  19. Glaeser, C.K.; Fisher, M.; Su, X. Optimal Retail Location: Empirical Methodology and Application to Practice. Manuf. Serv. Oper. Manag. 2019, 21, 86–102. [Google Scholar] [CrossRef] [Green Version]
  20. Wang, J.; Tsai, C.-H.; Lin, P.-C. Applying spatial-temporal analysis and retail location theory to public bikes site selection in Taipei. Transp. Res. Part A Policy Pr. 2016, 94, 45–61. [Google Scholar] [CrossRef]
  21. Han, Z.; Cui, C.; Miao, C.; Wang, H.; Chen, X.; Cui, H.; Wang, M. Chen Identifying Spatial Patterns of Retail Stores in Road Network Structure. Sustainability 2019, 11, 4539. [Google Scholar] [CrossRef] [Green Version]
  22. Mulbi, B.; Ramli, A. The Factors Affecting Buyer Interest in Indomaret Retail in Maros City. Arch. Bus. Res. 2019, 7, 225–241. [Google Scholar]
  23. Kumar, S.N.; Fred, A.L.; Kumar, H.A.; Varghese, P.S.; Jacob, S.A. Segmentation of Anomalies in Abdomen CT Images by Convolution Neural Network and Classification by Fuzzy Support Vector Machine. In Hybrid Machine Intelligence for Medical Image Analysis; Springer Science and Business Media LLC: Berlin/Heidelberg, Germany, 2019; pp. 157–196. [Google Scholar]
  24. Li, G.; Tang, H.; Sun, Y.; Kong, J.; Jiang, G.; Jiang, D.; Tao, B.; Xu, S.; Liu, H. Hand gesture recognition based on convolution neural network. Clust. Comput. 2017, 22, 2719–2729. [Google Scholar] [CrossRef]
  25. Yang, H.; Zhao, G.; Zhang, L.; Zhu, N.; He, Y.; Zhao, C. Real-Time Emotion Recognition Framework Based on Convolution Neural Network. In Advances in Intelligent Information Hiding and Multimedia Signal Processing; Springer Science and Business Media LLC: Berlin/Heidelberg, Germany, 2019; pp. 313–321. [Google Scholar]
  26. Kowalski, P.A.; Sapała, K.; Warchałowski, W. PM10 forecasting through applying convolution neural network techniques. Int. J. Environ. Impacts 2020, 3, 31–43. [Google Scholar] [CrossRef] [Green Version]
  27. Chakraborty, S.; Paul, S.; Sarkar, R.; Nasipuri, M. Feature Map Reduction in CNN for Handwritten Digit Recognition. In Recent Developments in Machine Learning and Data Analytics; Springer Science and Business Media LLC: Berlin/Heidelberg, Germany, 2018; pp. 143–148. [Google Scholar]
  28. Zhang, J.; Zheng, Y.; Qi, D. Deep spatio-temporal residual networks for citywide crowd flows prediction. In Proceedings of the Thirty-First AAAI Conference on Artificial Intelligence, San Francisco, CA, USA, 4–9 February 2017.
  29. Wang, L.; Fan, H.; Wang, Y. Sustainability Analysis and Market Demand Estimation in the Retail Industry through a Convolutional Neural Network. Sustainability 2018, 10, 1762. [Google Scholar] [CrossRef] [Green Version]
  30. Government Official Website of Guiyang. Available online: http://www.guiyang.gov.cn/ (accessed on 8 May 2020).
  31. WorldPop. Available online: https://www.worldpop.org/ (accessed on 8 May 2020).
  32. Tatem, A.J. WorldPop, open data for spatial demography. Sci. Data 2017, 4, 170004. [Google Scholar] [CrossRef]
  33. Lloyd, C.T.; Sorichetta, A.; Tatem, A.J. High resolution global gridded data for use in population studies. Sci. Data 2017, 4, 170001. [Google Scholar] [CrossRef] [Green Version]
  34. Sina Weibo Webpage. Available online: https://weibo.cn/ (accessed on 8 May 2020).
  35. Baidu Map Open Platform. Available online: https://lbsyun.baidu.com/ (accessed on 8 May 2020).
  36. Chinese National Catalogue Service for Geographic Information. Available online: https://www.webmap.cn (accessed on 8 May 2020).
  37. Yanine, F.; Cordova, F.M.; Valenzuela, L.; Isla, P. A fresh look to an old problem: Saturation in the retail market, and how it affects both retailers and consumers. Indian J. Sci. Technol. 2019, 12, 1–10. [Google Scholar] [CrossRef]
  38. Pereira, J.; De Oliveira, E.C.B.; Gomes, L.F.A.M.; Araújo, R.M. Sorting retail locations in a large urban city by using ELECTRE TRI-C and trapezoidal fuzzy numbers. Soft Comput. 2018, 23, 4193–4206. [Google Scholar] [CrossRef]
  39. Hu, Q.; Bai, G.; Wang, S.; Ai, M. Extraction and monitoring approach of dynamic urban commercial area using check-in data from Weibo. Sustain. Cities Soc. 2019, 45, 508–521. [Google Scholar] [CrossRef]
  40. Wang, J. Using Network Analysis to Explore the Effects of Road Network on Traffic Congestion and Retail Store Sales. Master’s Thesis, University of Waterloo, Waterloo, ON, Canada, 2017. [Google Scholar]
  41. Liu, Y.; Mu, Y.; Chen, K.; Li, Y.; Guo, J. Daily Activity Feature Selection in Smart Homes Based on Pearson Correlation Coefficient. Neural Process. Lett. 2020, 51, 1771–1787. [Google Scholar] [CrossRef]
  42. Feng, W.; Zhu, Q.; Zhuang, J.; Yu, S. An expert recommendation algorithm based on Pearson correlation coefficient and FP-growth. Clust. Comput. 2018, 22, 7401–7412. [Google Scholar] [CrossRef]
  43. Cubuk, E.D.; Zoph, B.; Mane, D.; Vasudevan, V.; Le, Q.V. AutoAugment: Learning Augmentation Strategies from Data. In Proceedings of the 2019 IEEE/CVF Conference on Computer Vision and Pattern Recognition (CVPR), Long Beach, CA, USA, 15–21 June 2019; pp. 113–123. [Google Scholar]
  44. Agrawal, A.; Mittal, N. Using CNN for facial expression recognition: A study of the effects of kernel size and number of filters on accuracy. Vis. Comput. 2019, 36, 405–412. [Google Scholar] [CrossRef]
  45. Wang, L.; Fan, H.; Gong, T. The Consumer Demand Estimating and Purchasing Strategies Optimizing of FMCG Retailers Based on Geographic Methods. Sustainability 2018, 10, 466. [Google Scholar] [CrossRef] [Green Version]
  46. Luo, W.; Li, Y.; Urtasun, R.; Zemel, R. Understanding the effective receptive field in deep convolutional neural networks. In Proceedings of the Advances in Neural Information Processing Systems, Barcelona, Spain, 5–10 December 2016. [Google Scholar]
  47. Nielsen, D. Tree Boosting with XGBoost—Why does XGBoost Win “Every” Machine Learning Competition? Master’s Thesis, Norwegian University of Science and Technology, Trondheim, Norway, 2016. [Google Scholar]
  48. Goodfellow, I.; Bengio, Y.; Courville, A. Deep Learning; MIT Press: Cambridge, MA, USA, 2016. [Google Scholar]
  49. Yıldız, N.; Tuysuz, F.; Yildiz, N. A hybrid multi-criteria decision making approach for strategic retail location investment: Application to Turkish food retailing. SocioEcon. Plan. Sci. 2019, 68, 100619. [Google Scholar] [CrossRef]
Figure 1. Study Area. Six districts of Guiyang.
Ijgi 09 00357 g001
Figure 2. Original population data of the entire study area from WorldPop. The values are population per pixel ( 50 × 50   m 2 ) .
Ijgi 09 00357 g002
Figure 3. Framework for using the data augmentation-double-channel convolutional neural network (DA-DCCNN) to address retail competitive site selection.
Ijgi 09 00357 g003
Figure 4. Data augmentation (DA) process. (a) Original image; (b) original image rotated 90° counterclockwise; (c) original image rotated 180° counterclockwise; (d) original image rotated 270° counterclockwise; (e) original image flipped horizontally; (f) original image flipped vertically.
Ijgi 09 00357 g004
Figure 5. Principle of spatial competition index. Grid i is the basic target study area.
Ijgi 09 00357 g005
Figure 6. Principle of spatial correlation coefficient of features.
Ijgi 09 00357 g006
Figure 7. Structure of DCCNN. Bt: batch size, Ch: channel count, Input: input layer, Conv: convolution layer, Pool: pooling layer, Flatten: flatten layer, and FC: fully connected layer.
Ijgi 09 00357 g007
Figure 8. PCC of features and sales within different grid sizes.
Ijgi 09 00357 g008
Figure 9. Results of the feature spatial correlation coefficient.
Ijgi 09 00357 g009
Figure 10. Results of market demand estimate. H: high market demand areas; M: medium market demand areas; L: low market demand areas.
Ijgi 09 00357 g010
Figure 11. Eighteen recommended sites with high market potential.
Ijgi 09 00357 g011
Figure 12. Training data loss and test data loss during training.
Ijgi 09 00357 g012
Table 1. Samples of Sina Weibo check-in data after data collection.
User IDLatitudeLongitudeTime
XXX106.71121226.602392016/9/15 01:54
XXX106.70485726.5836792016/3/27 10:41
XXX106.68702726.5685292016/5/17 10:13
XXX106.70761926.5772712016/11/4 16:27
Table 2. Features considered in this study.
FactorsIndexDescription
Consumer groupsLocal residentWorldPop population data
Passenger flowSina Weibo check-in data
Urban infrastructurePOIsSum of POIs in grid
Road networkRoad network densityOSM road network density
Business competitionDegree of spatial competitionRelated with store sales and distance
Table 3. Structural parameters of DCCNN.
LayerFeature MapsKernel SizeStridesReLUOutput Size
C o n v 1 4(3, 3)1Yes(12, 14)
P o o l 1 4(2, 2)2No(7, 7)
C o n v 2 8(3, 1)1Yes(5, 7)
C o n v 3 8(1, 3)1Yes(5, 5)
P o o l 2 8(2, 2)3No(2, 2)
C o n v 4 2(5, 5)1Yes(12, 12)
P o o l 3 2(2, 2)2No(6, 6)
C o n v 5 4(3, 3)1Yes(4, 4)
P o o l 4 4(2, 2)2No(2, 2)
F C 1 -(1, 1)-Yes(16)
F C 2 -(1, 1)-No(1)
Table 4. Pearson correlation coefficient (PCC) of features and sales within different grid sizes.
Grid Size (m)PopCheck-inPOIsSCIRoad Density λ
1000.1505 0.0657 0.1259 0.0487 0.0067 0.25
2000.2018 0.2184 0.1786 0.1584 0.0834 0.29
3000.2170 0.2276 0.2421 0.3013 0.1421 0.31
4000.2656 0.2290 0.2927 0.4093 0.1788 0.35
5000.2765 0.3806 0.3479 0.4898 0.2314 0.38
6000.3173 0.4442 0.4146 0.5837 0.2626 0.24
7000.4052 0.4919 0.4668 0.5947 0.2953 0.34
8000.4567 0.4839 0.5078 0.6454 0.2993 0.32
9000.4548 0.5256 0.5032 0.6675 0.2958 0.26
10000.4191 0.5010 0.5515 0.6388 0.3545 0.27
Table 5. Training parameters and values.
No.ParametersValueNo.ParametersValue
1Batch size2064Channels of C h 1 2
2Epoch1205Channels of C h 2 1
3Initial learning rate0.0056Reduce learning rateReduceLROnPlateau
Table 6. Specific surroundings of samples in recommended sites.
No.Estimated SalesGrid ImageGoogle Map ImageGoogle Earth ImageCoordinates
1RMB
544,259
/month
Ijgi 09 00357 i001 Ijgi 09 00357 i002 Ijgi 09 00357 i003Lat:
26.616611
Lon: 106.704806
2RMB
633,058
/month
Ijgi 09 00357 i004 Ijgi 09 00357 i005 Ijgi 09 00357 i006Lat:
26.616556
Lon: 106.699111
3RMB
2,261,795
/month
Ijgi 09 00357 i007 Ijgi 09 00357 i008 Ijgi 09 00357 i009Lat:
26.416000
Lon:
106.664917
4RMB
545,272
/month
Ijgi 09 00357 i010 Ijgi 09 00357 i011 Ijgi 09 00357 i012Lat:
26.645111
Lon: 106.616806
5RMB
582,950
/month
Ijgi 09 00357 i013 Ijgi 09 00357 i014 Ijgi 09 00357 i015Lat:
26.715786
Lon: 106.619050
6RMB
2,234,156
/month
Ijgi 09 00357 i016 Ijgi 09 00357 i017 Ijgi 09 00357 i018Lat:
26.637889
Lon: 106.769833
7RMB
716,952
/month
Ijgi 09 00357 i019 Ijgi 09 00357 i020 Ijgi 09 00357 i021Lat:
26.389110
Lon: 106.675040
Table 7. Comparison of errors among different models.
ModelMSEMAERMSE
Support vector regression (SVR)0.34100.07540.0933
Random Forest (RF)0.00740.04980.0858
XGBoost0.00660.05430.0814
Single-channel CNN0.00720.05000.0849
DA-DCCNN (Ours)0.00430.03880.0657

