Article

Conservation of Micromeria browiczii (Lamiaceae), Endemic to Zakynthos Island (Ionian Islands, Greece)

by
Anna-Thalassini Valli
1,*,
Christos Chondrogiannis
2,
George Grammatikopoulos
2,
Gregoris Iatrou
3 and
Panayiotis Trigas
1
1
Laboratory of Systematic Botany, Department of Crop Science, School of Plant Sciences, Agricultural University of Athens, Iera Odos 75, 11855 Athens, Greece
2
Laboratory of Plant Physiology, Department of Biology, University of Patras, Rio, 26504 Patras, Greece
3
Laboratory of Botany, Department of Biology, University of Patras, Rio, 26504 Patras, Greece
*
Author to whom correspondence should be addressed.
Submission received: 6 March 2021 / Revised: 7 April 2021 / Accepted: 8 April 2021 / Published: 15 April 2021
(This article belongs to the Special Issue Taxonomy and Plant Conservation)

Abstract

:
The massive decline in biodiversity due to anthropogenic threats has led to the emergence of conservation as one of the central goals in modern biology. Conservation strategies are urgently needed for addressing the ongoing loss of plant diversity. The Mediterranean basin, and especially the Mediterranean islands, host numerous rare and threatened plants in need of urgent conservation actions. In this study, we assess the current conservation status of Micromeria browiczii, a local endemic to Zakynthos Island (Ionian Islands, Greece), and estimate its future risk of extinction by compiling and assessing scientific information on geographical distribution, population dynamics and reproductive biology. The population size and the geographical distribution of the species were monitored for five years. The current population of the species consists of 15 subpopulations. Considerable annual fluctuation of population size was detected. The species is assessed as Endangered according to the International Union for Conservation of Nature threat categories. According to population viability analysis results, its extinction risk was estimated to be 5.6% over the next 50 years, when six of the fifteen subpopulations (40%) might become extinct. The investigation of certain aspects of the species’ biology yielded important data necessary to identify critical aspects for its survival and to propose conservation measures.

1. Introduction

According to recent estimates, current plant extinction rates reach up to 1.26 extinctions per year [1]. Plants are an essential component of biodiversity and the foundation for most terrestrial ecosystems. Thus, a decline in plant diversity will be detrimental to all other groups of organisms [2,3] The Mediterranean basin consists an important center for plant diversity, where 10% of the world’s higher plants can be found in an area representing only 1.6% of the Earth’s surface [4]. This biodiversity hotspot has also been the cradle of several of the world’s greatest civilizations, which has resulted in the overexploitation of soil and the conversion of natural habitats into agricultural landscapes [5]. Islands and islets constitute important centers of plant diversity in the Mediterranean [6,7]. Narrow endemism, mainly triggered by geographical isolation and ecological specialization, is a key feature of the Mediterranean island flora, strongly influencing the plant conservation agenda in this region. Island biotas contribute disproportionately to the contemporary extinction crisis [8], and endemic Mediterranean island plants are especially threatened due to habitat loss and fragmentation, climate change, overgrazing and other human-induced activities. Conservation strategies are urgently needed for addressing the ongoing loss of plant diversity, especially the rare and threatened plants of the Mediterranean [9].
The Ionian Archipelago is located in the eastern half of the Mediterranean basin, in western Greece. Τhe recent formation of the Ionian Islands and their close proximity to the mainland have resulted in the establishment of a rich flora principally comprising common species with a low proportion of endemics [10]. Low plant endemism is probably responsible for overlooking the Ionian Islands from plant conservation studies in Greece, and only in recent years has an attempt been made to assess the conservation status of rare and threatened endemic plants of this area [11].
Rare species have an important role in the maintenance of ecosystem functions, because they contribute to the maintenance of the ecosystem diversity, serve as successful indicators of general patterns of species diversity and have a significant impact on invasion resistance, thereby affecting the ecosystem composition and functioning [12,13,14]. The effective conservation of rare plant species requires a detailed understanding of their unique distributions and habitat requirements to identify conservation targets [15]. Ecophysiological traits may have been crucial in the differentiation of narrow endemic species in Mediterranean regions [16]. Photosynthetic traits have been scarcely used in comparing endemic and non-endemic species and have been limited to measuring the maximum photosynthetic rate, Amax [17,18]. However, this specific parameter exhibits strong variation even during a single day, as it is strongly influenced by light intensity and comparisons among different species is difficult. On the other hand, the chlorophyll fluorescence parameters, when measured at the dark-adapted state, although not directly related to photosynthetic rates, reflect the fitness of the photosynthetic machinery and the environmental impact on its performance over time [19]. These indices have been used in numerous ecophysiological studies during the last decade, but never in studies comparing the attributes of endemic and non-endemic species.
Understanding the natural history of rare plants is crucial for population management and conservation [20,21,22]. The monitoring of plant populations is one of the core activities of conservation biology. Monitoring can provide critical biological data about rare species [23] and is crucial to identify species that are at risk of extinction [24], assess their conservation status and help improve management decisions [25]. Additionally, such data can lead to the development of effective conservation plans for rare species [26].
Demographic studies can provide information about population trends that is detailed enough to serve as a basis for management decisions [27,28]. Moreover, studies of survival and reproductive patterns are prerequisite to predicting the future growth or decline of populations and to help in the selection of appropriate management strategies for species conservation [29]. An understanding of a rare taxon’s general life history characteristics, reproductive biology, demography and factors constraining population growth is accepted as fundamental for the protection and restoration of the species [23,30,31].
Micromeria browiczii Ziel. & Kit Tan is a relatively recently described species [32], endemic to Zakynthos Island. It is a suffruticose perennial, growing on rocky, calcareous, sunny slopes with terra rossa in soil pockets and crevices at 13–416 m above sea level (a.s.l). It is a member of Micromeria Benth. sect. Micromeria, related to M. cristata (Hampe) Griseb., and less closely to M. cremnophila Boiss. & Heldr., but it can be distinguished by its neat revolute leaves and dense greyish indumentum [32].
In this study, we assess the current conservation status of M. browiczii and estimate its future risk of extinction by compiling and assessing scientific information on geographical distribution, population dynamics and reproductive biology. More specifically, we aim to: (a) define the geographical distribution of the species after exploring all potentially suitable habitats, (b) assess its population dynamics and reproductive biology, and (c) propose strategies and conservation measures for its management and maintenance.

2. Results

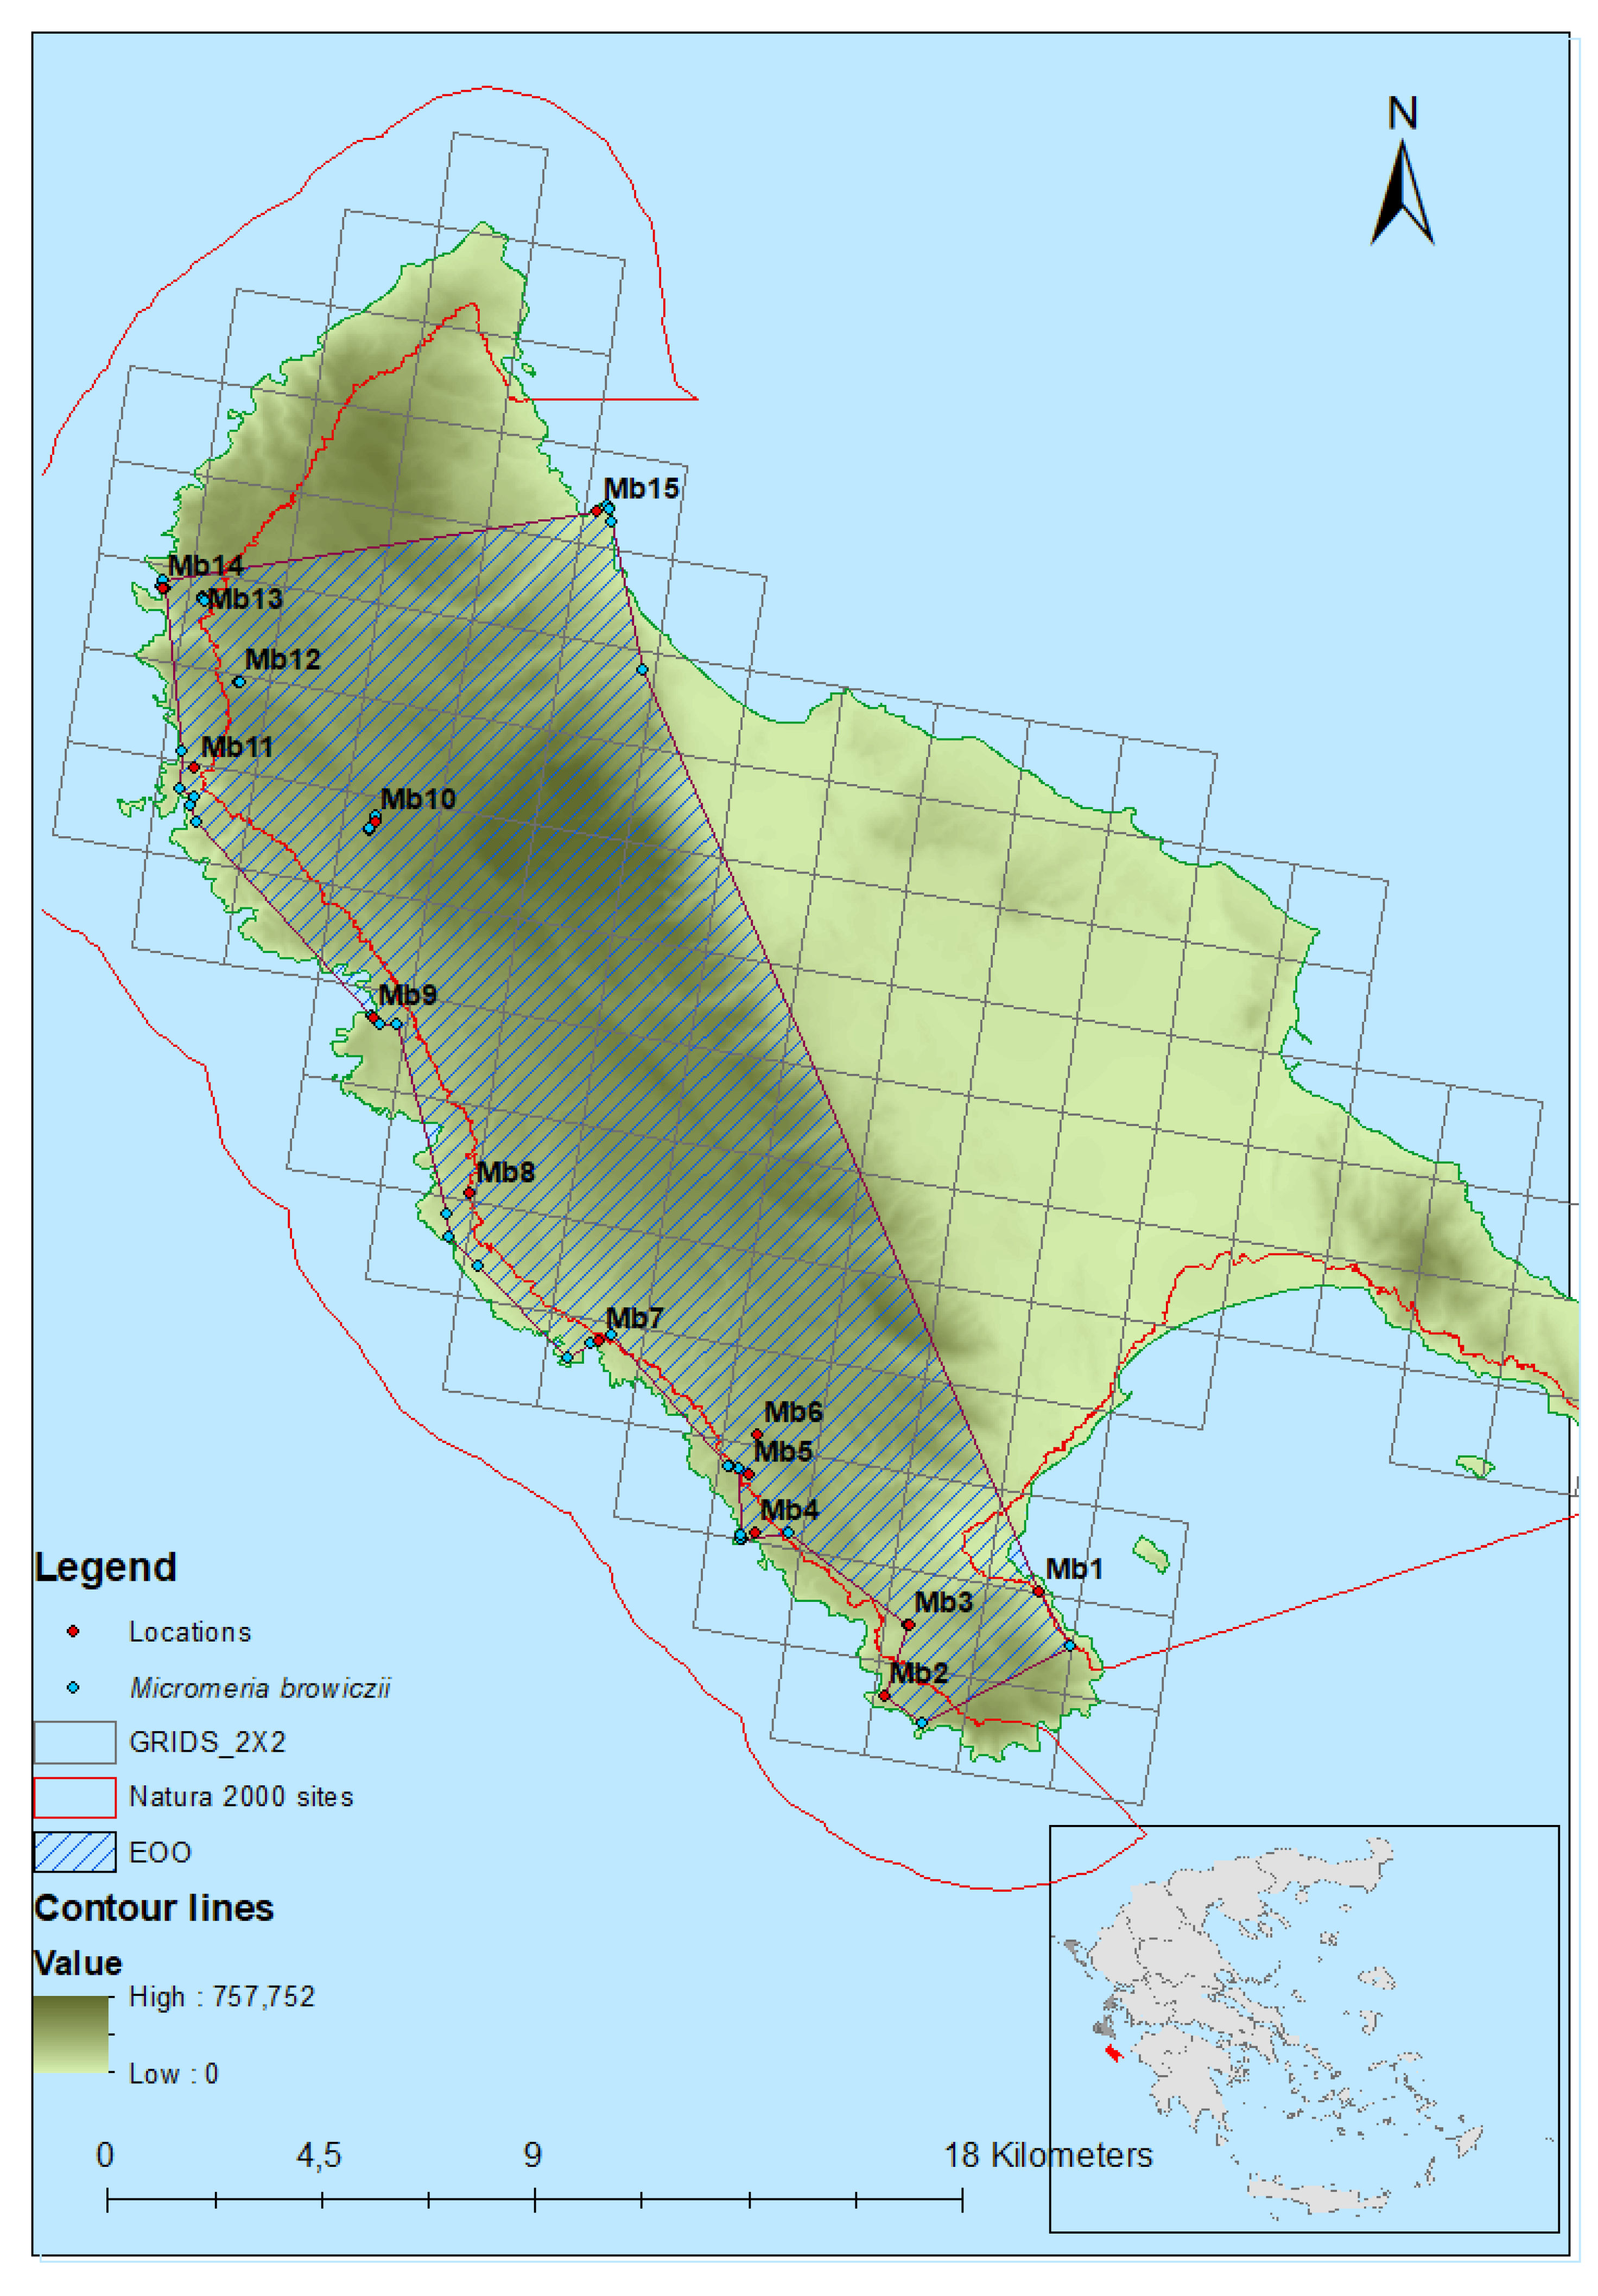
2.1. Geographical Distribution

The current distributional range of M. browiczii is shown in Table 1 and Figure 1. The entire population of the species consists of 15 subpopulations, namely Marathias (Mb1), Faros Keriou (Mb2), Ethniki (Mb3), Plakaki (Mb4), Psaris (Mb5), Agalas (Mb6), Korakonisi (Mb7), Limnionas (Mb8), Kampi (Mb9), Maries (Mb10), Porto Vromi (Mb11), Anafonitria (Mb12), Aghios Georgios (Mb13), Navagio (Mb14), and Xigia (Mb15). During the monitoring period, the species was recorded in 14 new locations, expanding its distributional and altitudinal range. Subpopulations Mb2, Mb4 (colony Pl1), Mb7, Mb8, Mb9 and a part of Mb14 are included within the site of community importance (SCI) “Dytikes kai Voreioanatolikes aktes Zakynthou” (GR2210001), while subpopulation Mb1 is included within the SCI “Kolpos Lagana Zakynthou (Akr. Geraki-Keri) kai nisides Marathonisi kai Pelouzo” (GR2210002) of the Natura 2000 network of protected areas. M. browizcii occurs in open rocky (Table 1). According to population monitoring results, the extent of occurrence (EOO) of M. browiczii is 195.36 km2, the area of occupancy (AOO) based on 2 × 2 km2 grid is 68 km2, and the local extent of occurrence of all subpopulations is 0.21 km2 (Figure 1 and Table 1).

2.2. Population Size

Micromeria browiczii forms subpopulations and colonies of varying size and extent. Population size (i.e., the total number of mature individuals in all subpopulations), as well as the size of each subpopulation, exhibited considerable annual fluctuations, with the exception of subpopulations Mb6 and Mb12, which exhibited a gradual increase in their size (Table 2). In addition, a reduction in local extent was observed, as the local extent of F1 and Pl2 colonies was dramatically decreased during the monitoring period, due to anthropogenic activities, and more specifically, agriculture and farming (see discussion).
Plant density was higher in 2018, i.e., the year of the smallest local extent of occurrence of all subpopulations (Table 2). The highest plant density was observed in subpopulation Mb12 in 2018. Stage-structure recordings (i.e., number of seedlings, non-reproductive and mature individuals per subpopulation) revealed that all subpopulations were dominated by non-reproductive individuals (61–79%), reproductive individuals represented 9–27%, while the percentage of seedlings was smaller (6–12%) (Table 3).

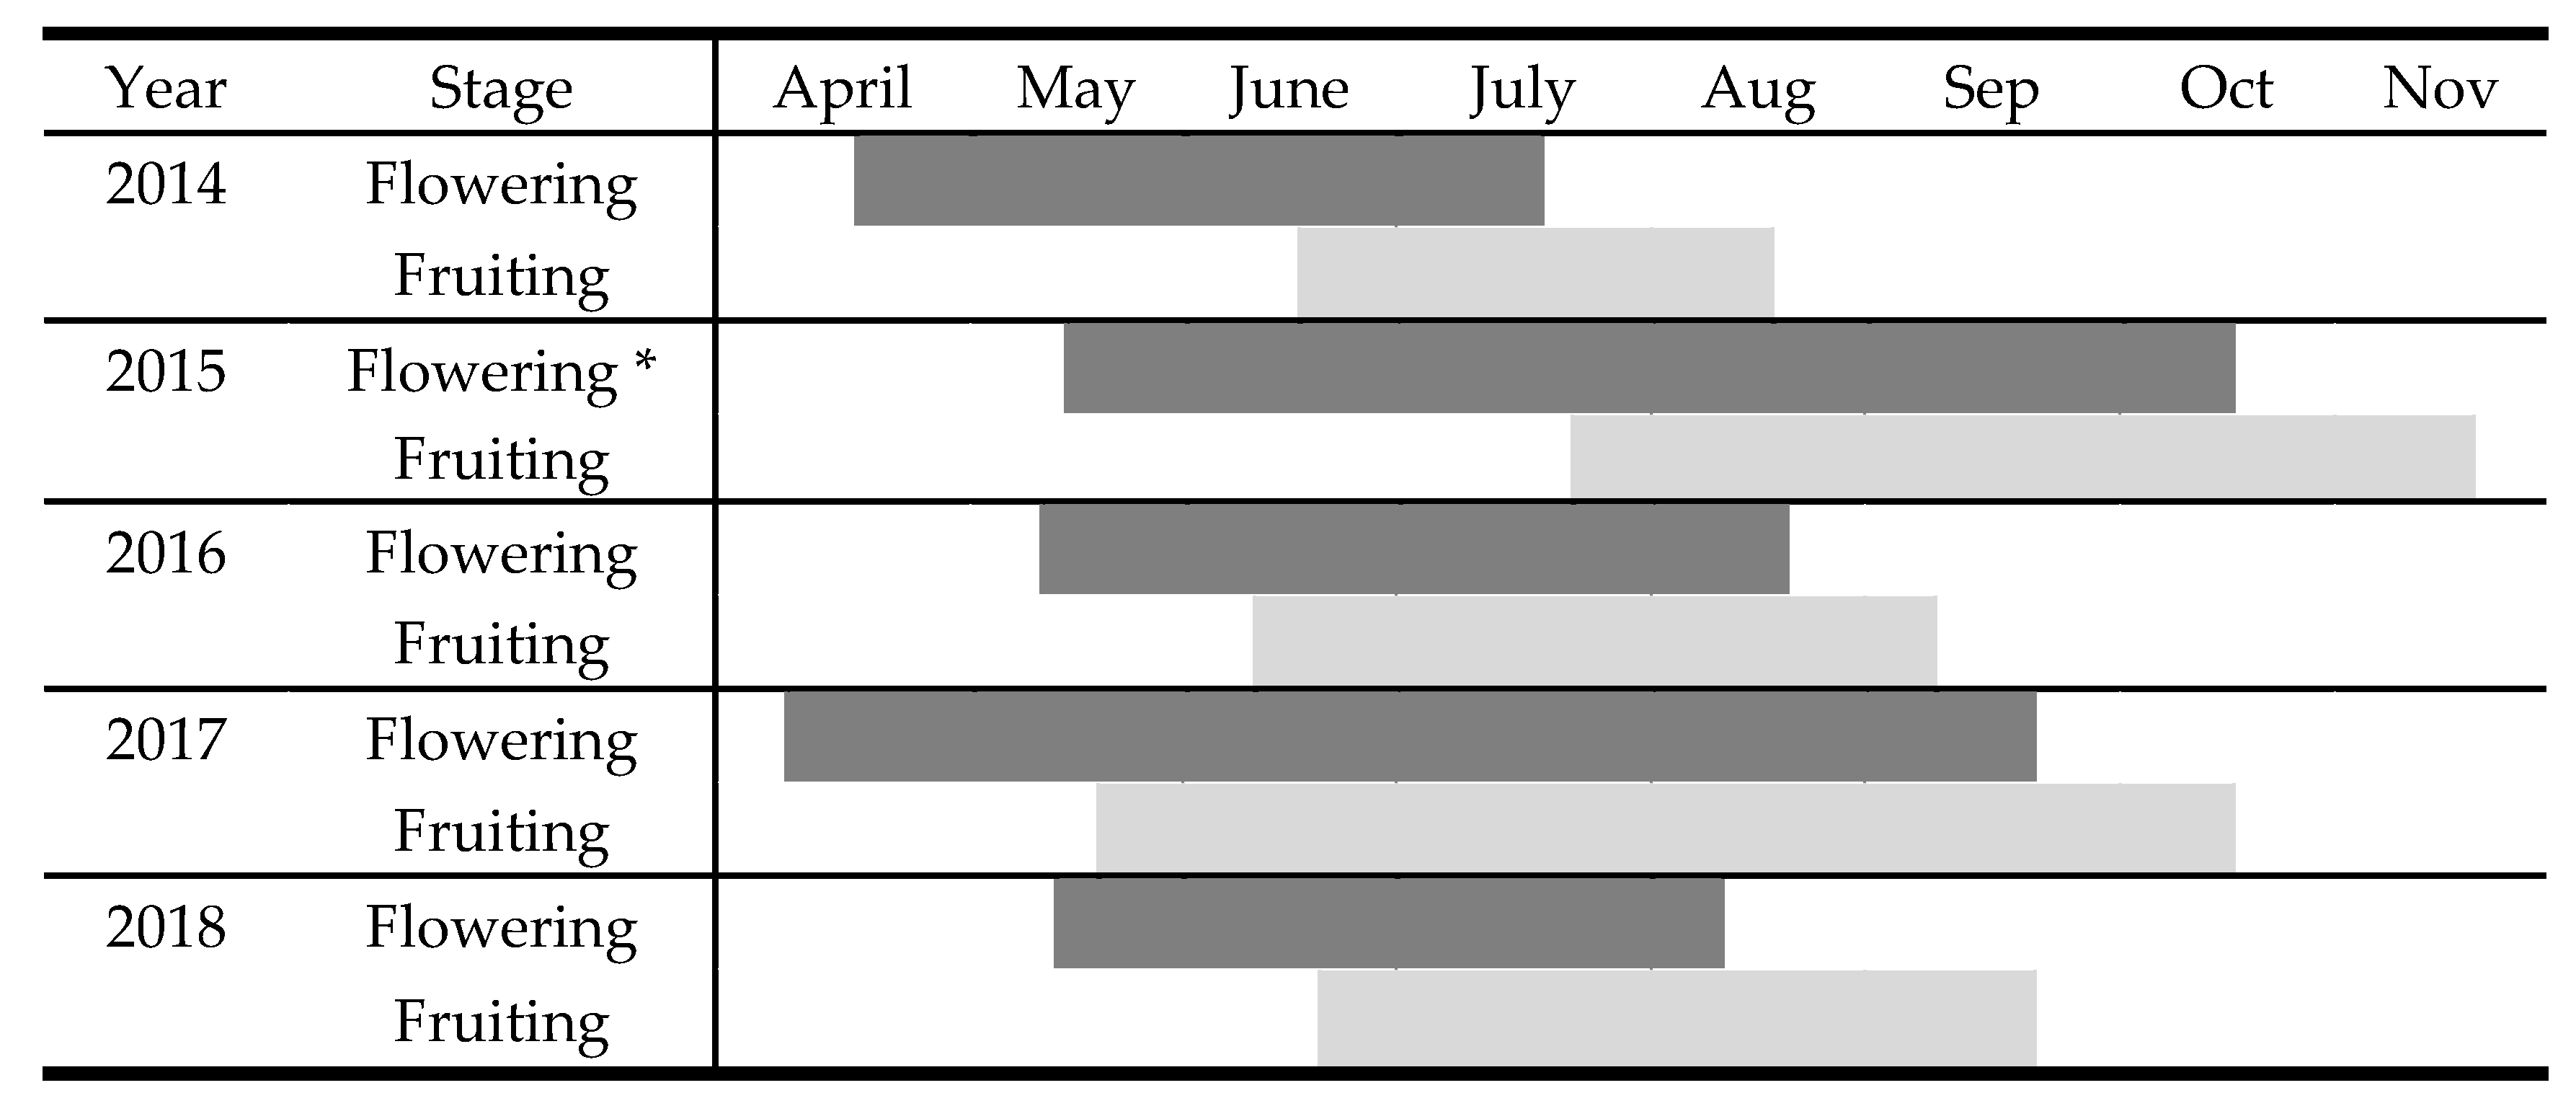
2.3. Reproductive Biology

The mean values of the reproductive characteristics of M. browiczii are shown in Table 4. The mean number of flowers per stem and per individual ranged between 3.48 ± 0.36–7.75 ± 0.69 and 22.9 ± 3.7–43.5 ± 8.08, respectively. The mean number of fruits per flower ranged from 1.78 ± 0.17–2.22 ± 0.14. The number of fruits per stem ranged between 28 ± 6.2–46 ± 7.68. The mean number of fruits per individual ranged from 246.2–306.4. Fecundity was highest in 2016, the year with the largest population size. The survival rate of juveniles ranged from 35% in 2017 to 70% in 2018. The mean values of relative reproductive success (RRS, the total percentage of all ovules maturing into seeds) per year were moderate (44.5–55.34%). However, subpopulations or colonies found on old walls showed the greatest values of RRS throughout the monitoring period, while subpopulations growing on limestone cliffs and slopes (which constitute the majority) showed the lowest percentage (Table S1). Pearson’s correlation coefficient revealed a significant positive correlation between RRS and the mean number of fruits per fruiting stem (r = 0.472, p < 0.05), as well as with the mean number of fruits per flower (r = 0.9407, p < 0.05). Moreover, an irregularity in flowering of mature individuals between successive years was recorded in subpopulation Mb11 during the years 2016–2018. Mature individuals varied tremendously in size, ranging from 8 to 74 cm in diameter and from 3 to 21 cm in height. Furthermore, mature individuals growing in shade conditions exhibited smaller sizes than those growing exposed to full sun. According to our observations, the age of first reproduction of M. browiczii is 3 years.
The begging and the duration of flowering and fruiting periods of M. browiczii exhibited annual fluctuation (Figure 2). Flowering duration was 112 days on average (early May–late August), followed by the fruiting period, which lasts 92 days on average (early June–mid September). The duration of flowering was strongly affected by annual fluctuation in temperature and precipitation (adjR2 = 0.836). More specifically, the flowering period was significantly shortened by higher mean annual temperatures (b* = −4.942, p < 0.001). Conversely, higher minimum temperatures (b* = 4.113, p < 0.001), higher maximum temperatures (b* = 2.745, p < 0.001) and increased precipitation (mm) (b* = 0.511, p < 0.001) significantly elongated the flowering period. Seedling emergence was observed from November to April.
The insect Coptocephala rubicunda subsp. rubicunda (Chrysomelidae, Coleoptera) was repeatedly recorded on the flowers of M. browiczii. This species is considered to be polinophagous [33], and probably also offers pollination services to M. browiczii, resulting in effective pollen transmission between individuals.

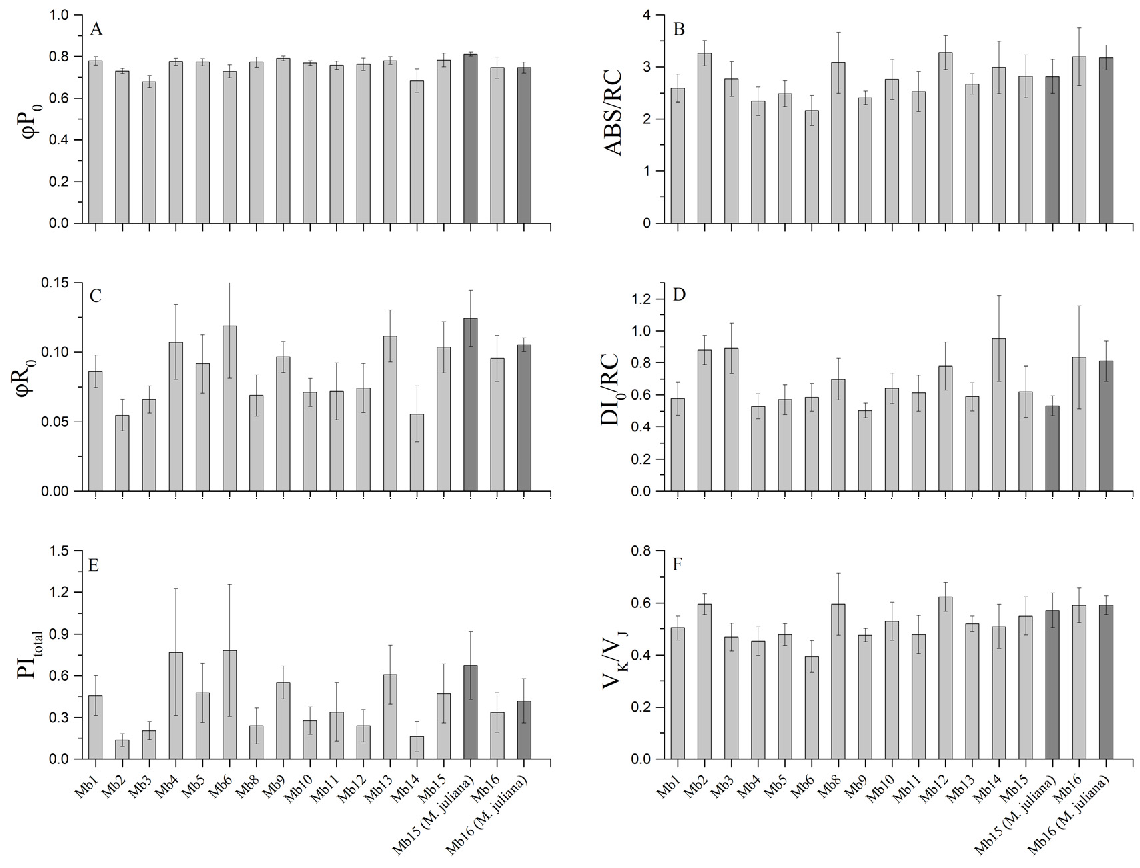
2.4. Chlorophyll Fluorescence Measurements

Chlorophyll fluorescence measurements were performed to assess the state and the level of stress on the photosynthetic apparatus of the subpopulations (Figure 3). Maximum quantum yield of primary PSII photochemistry (φP0), which is the most conservative index, showed little variation among different subpopulations. The other indices (quantum yield for reduction in end electron acceptors at the PSI acceptor side (φR), potential for energy conservation from exciton to the reduction in PSI (Photosystem I) end acceptors (PItotal), absorbed photon flux per active reaction centre (ABS/RC), dissipated energy flux per active reaction centre (DI0/RC) and measure of the relative amplitude of K band (VK/VJ)) showed significant variation among subpopulations. The results indicated a major influence of the microenvironment on the performance of the photosynthetic apparatus. A common trend among indices was recorded, with low values of φR0 and PItotal accompanied by high values of ABS/RC, DI0/RC and VK/VJ. More specifically, there was a hindered capacity of electron flow between and around the photosystems (low values of φR0 and PItotal), accompanied by inactivation of reaction centers (high values of ABS/RC), increased heat dissipation (high values of DI0/RC) and a looser connection of OEC (Oxygen Evolving Complex) with PSII (high values of VK/VJ).
When comparing the local endemic M. browiczii to the widespread M. juliana at the same locations, only marginal differences were obtained and a similar profile of energy flow in the photosynthetic apparatus was found (Figure 3). Minor or no significant differences were also recorded between plants growing on different substrates (Figure S1) and between matures and juveniles (Figure S2), while altitude (Figure S3) showed no correlation with any of the fluorescence parameters. Finally, no significant correlation was found between chlorophyll fluorescence parameters and the number of reproductive individuals (Figure S4) or the relative reproductive success (Figure S5).

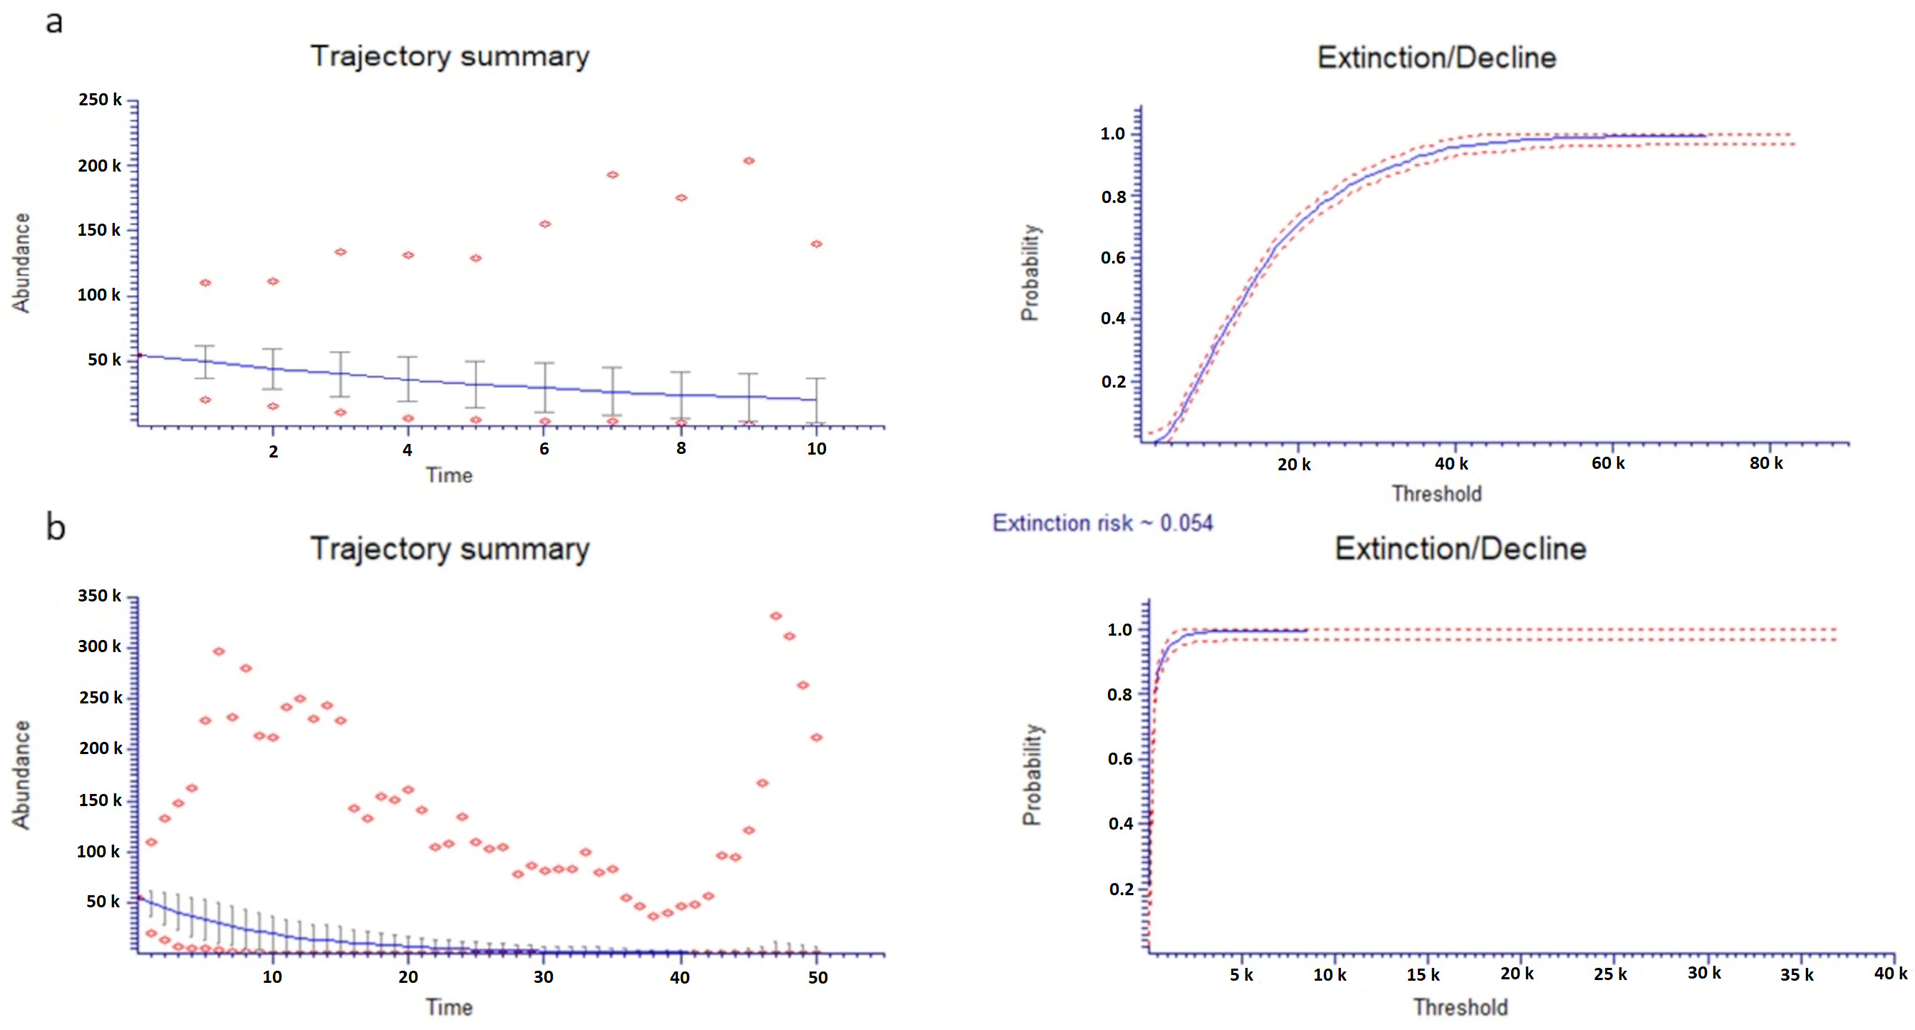
2.5. Population Viability Analysis (PVA)

PVA in M. browiczii using the total number of mature individuals was projected for the next 10 and 50 years (Figure 4). Subpopulations Mb2, Mb3, Mb4, Mb5, Mb8, Mb11 and Mb14 seem to follow a trend of gradual reduction over the next 10 years. However, the population extinction risk is zero. During the next 50 years, species extinction risk increases to 5.6%. There is a high possibility for subpopulations Mb4 (92.1%), Mb5 (91.7%), Mb2 (88.8%), Mb14 (88.3%), Mb3 (73.9%) and Mb11 (66.6%) to go extinct within the next 50 years (Figure S6).

2.6. Threats

The direct threats recognized for M. browiczii were: (a) threats resulting from agriculture and farming (threat code: 2.3) such as the expansion of agricultural land, resulting in the reduction in local extent at subpopulation Mb4 (colony Pl2); ranching and overgrazing by domestic and semi-domestic animals allowed to roam in the wild, including the impacts of fencing around farmed areas (threat code: 2.3.1) at subpopulations Mb2 (colony F1) and Mb9; (b) agricultural and forestry effluents, such as glyphosate (threat code: 9.3.3) at subpopulation Mb6; (c) tourism and recreational areas (threat code: 1.3) and recreational activities (threat code: 6.1), such as hiking and the construction of secondary roads (threat code: 4.1) at subpopulations Mb5, Mb8, Mb11 and Mb14; gathering of plants (treat code: 5.2) mainly near the hiking trails at subpopulations Mb2, Mb11 and Mb14; housing and urban areas (threat code: 1.1) and specifically villages at subpopulations Mb5, Mb6 and Mb10; and competition with other species (threat code: 12.1) at subpopulation Mb11.

2.7. Conservation Status Assessment

Based on monitoring data, M. browiczii is classified as Endangered (ΕΝ B1b(iii, iv)c(iv)+2b(iii, iv)c(iv)) [34]. More specifically, the first criterion (B1b(iii, iv)c(iv)) refers to EOO, which was less than 5,000 km2, related to the continuing decline estimated for the number of locations or subpopulations, the continuing decline of area–extent–quality of habitat and extreme fluctuations in the number of mature individuals. Criterion B2b(iii, iv)c(iv) refers to AOO, which was less than 500 km2, related to the continuing decline estimated for the number of locations or subpopulations, the continuing decline of area–extent–quality of habitat and extreme fluctuations in the number of mature individuals.

3. Discussion

Monitoring, including the estimation of species’ geographical range size, population dynamics and exposure to anthropogenic threats, is one of the core activities of conservation biology and provides predictive power [35], as it is essential for determining a species’ conservation status. However, it is time- and resource-consuming, and for these reasons, monitoring programs are especially scarce [36]. When we consider targeting the available conservation resources, island species constitute a rather highly prioritized target, as islands warrant a unique level of attention for biodiversity conservation; they make up only a small percentage of land area but are known for their high endemic species richness [37,38]. In this study, all extant subpopulations of M. browiczii, a local endemic of Zakythnos Island, were monitored for five years. The EOO and the AOO were stable during the monitoring period. However, the local extent, which expresses the true natural extent of the species [11], was significantly decreased in subpopulations Mb2 (colony F1) and Mb4 (colony Pl2) during the year 2018, due to anthropogenic activities/pressures related to agriculture and farming (i.e., cultivation of olive trees, fencing for domestic animals and trampling).
Population size, as well as the size of each subpopulation, showed significant fluctuations during the monitoring period (except for subpopulations Mb6 and Mb12 which showed an increasing trend). These fluctuations were partly generated by local habitat changes and/or in threats/pressures (e.g., in subpopulations Mb2, Mb4, Mb8 and Mb11). A reduction in subpopulation sizes at locations Plakaki, Faros Keriou and Agalas were observed as a result of agricultural expansion and intensification. At Plakaki, the cultivation of olive trees and use of agrochemicals led to a reduction in the size and local EOO of Mb4 subpopulation during 2018. In the same year, a large part of subpopulation Mb2 was fenced for animals, resulting in a reduction in subpopulation size because of trampling. Moreover, at locations Mb8 and Mb11, subpopulation size fluctuated in response to interspecific competition. Specifically, in subpopulations located in forest and scrub openings, surrounded by dense vegetation cover, the expansion of tree and shrub species led to the immediate reduction in M. browiczii subpopulation size. Zakynthos Island is characterized by dense vegetation cover, limiting endemic plant taxa to specialized habitats with low disturbance and high stress levels [10]. M. browiczii often occurs in open, disturbed areas that are usually colonized by more competitive species after a few years.
The high fluctuation observed in the number of mature individuals of M. browiczii subpopulations may be also related to climatic conditions (if similar environmental factors affect neighboring subpopulations). The effect of precipitation and mean temperature on the population dynamics of perennial herbs has been demonstrated in several studies (e.g., [39,40]). Understanding their combined effects is a prerequisite for predicting the short-term effects of climate change [41] on population persistence. However, short-time series data may not capture the full range of variation in temperature and precipitation typical for the study area. We would need additional data from longer-term monitoring to be able to confirm the effect of environmental stochasticity/variability on population dynamics.
Seedling survival showed that the transition from juvenile to mature individuals had the same pattern as population size, being lower in 2017. The observed variation in the percent survival of seedlings may be associated with competition. Α correlation between seedling survival and plant density was observed in sampling plots during the monitoring period. Intense inter-specific competition has been associated with a reduction in soil nutrients, water/light availability, and generally a reduction in available resources [42], adversely affecting seedling survival.
Fecundity and relative reproductive success (RRS) were moderate (44.5–55.3%) during the monitoring period, while higher values of RRS were recorded in subpopulations or colonies located in old walls, possibly due to reduced interspecific competition, as fewer coexisting species occur in this substrate. Moreover, walls often provide better moisture conditions than rocks do. Old walls are very porous and the presence of fractures and accumulated sediments common to brick and stone materials increases water storage [43]. Decreased interspecific competition and increased moisture availability possibly explain the increased RRS values observed in walls.
Start date (onset), duration and end date of M. browiczii flowering is highly variable. The duration of the flowering period fluctuates in response to variation in climatic factors (i.e., mean annual temperature, minimum annual temperature, maximum annual temperature and precipitation). The interaction between temperature and precipitation has been found to influence flowering time [44]. An extended flowering duration in response to increased precipitation during the preceding months has been documented in several studies in Mediterranean ecosystems [45,46]. Individuals of M. browiczii are shallowly rooted and therefore dependent on moisture fluctuations close to the soil surface. The shortened flowering period of M. browiczii with warmer mean temperatures is probably the result of reduced longevity of individual flowers.
Irregular flowering between subsequent years (i.e., individuals that are not flowering every single year) was observed in ca. 31.25% of the individuals of subpopulation Mb11 during the years 2016–2018. Individuals in this subpopulation are exposed to shaded conditions for several hours per day, as they are found next to vertical cliffs. The probability that a certain individual will flower in a given year depends on both internal (size and age) and external (e.g., light and temperature) conditions [47]. Plants growing in shaded places are smaller in size and produce fewer flowers than those growing in full light. The flowering behavior of perennial polycarpic plants depends on a complex interaction between resources currently used in reproduction, and the resources stored for future reproduction [48]. Thus, flowering in any particular year cannot be independent of the flowering status in the previous year. Moreover, linear regression analysis revealed a significant correlation between the frequency of flowering and the mean monthly temperature during winter (b* = 0.606, p < 0.05), suggesting that the conditions experienced by individuals early in the season significantly affect flowering later in the season.
Based on our chlorophyll fluorescence measurements, the local microenvironment seems to be the major contributing factor to variation in fluorescence indices. This variation could be due to many biotic and abiotic environmental parameters, such as temperature, light exposure, water reserves, soil nitrogen content, and symbiotic associations of roots [49]. Having excluded differences in light exposure and temperature through our sampling procedure, we hypothesize that it is water availability at different locations which influences photosynthetic machinery. Indeed, the photosynthesis of species growing on rocky substrates is strongly affected by Mediterranean drought during the summer [50]. Additionally, reproductive maturity is known to affect photosynthesis [51]; however, our results do not confirm this hypothesis.
Monitoring data collected during this study were used to evaluate the conservation status of M. browiczii according to IUCN categories and criteria [34]. On this basis, M. browiczii should be categorized as “Endangered” (EN). Population viability analysis (PVA) results indicate that six of the fifteen subpopulations of the species, namely Mb1, Mb3, Mb4, Mb5, Mb11 and Mb14, might go extinct within the next 50 years.
According to field observations and PVA results, subpopulations at Marathias, Ethniki, Plakaki, Psaris, Porto Vromi and Navagio should be prioritized for conservation measures. The control and/or reduction in inorganic fertilizers, pesticides, herbicides, insecticides and other agrochemicals due to intensified agricultural production near subpopulations Mb4, Mb5 and Mb6 is required. Moreover, grazing control to reduce trampling pressure in subpopulation Mb2 is deemed necessary. In addition, informing the local authorities and the community in the vicinity of famous recreation areas (i.e., Navagio and Porto Vromi) where accidental trampling has been observed is needed. Ex situ conservation may also be appropriate, since M. browiczii produces orthodox seeds, which can be preserved in a seed bank [52]. Seed banking is a necessary and cost-effective ex situ conservation measure, complementary to in situ conservation of wild plants, and it provides a vital source of material to assist in the ecological restoration of damaged and degraded habitats [53]. Seeds should be collected from all extant subpopulations, if possible, to cover the full range of genetic diversity.

4. Materials and Methods

4.1. Definitions

The terms mature individual, population, subpopulation, population size, location, EOO and AOO are used according to the definitions established by the IUCN [54]. The local extent of occurrence of each subpopulation (local extent) was calculated according to Andreou et al. [55] as the minimum area occupied by individuals of each subpopulation.
According to the definitions established by the IUCN [34], the term mature individuals is defined as “the individuals known, estimated or inferred to be capable of reproduction”. However, in the case of populations with biased adult or breeding sex ratios and where the population size fluctuates, it is appropriate to use lower estimates of mature individuals [34]. Mature (reproductive) individuals of M. browiczii are indistinguishable from juveniles (non-reproductive) ones in size. Juveniles of M. browiczii are young individuals with a diameter ranging from 2 to 45 cm (vs. 3–60 cm in matures), and a height ranging from 7 to 26 cm (vs. 7–37 cm in matures). In this study, we define mature individuals as the individuals that are flowering and/or fruiting, as the safest method of identifying mature individuals of M. browiczii.

4.2. Spatial Distribution

The wider area of the known location, as well as all suitable habitats for M. browiczii (rocky, calcareous slopes, not far from the coastal cliffs) were surveyed for five consecutive years (2014–2018), in order to delimit its distribution. A GPS device (eTrex 20, Garmin Ltd., Lenexa, Kansas, USA) was used for the capture of location data in the field. Detailed mapping, the polygon of the EOO for the total population, as well as the polygons of the local extent for each subpopulation of the species (i.e., the minimum area polygon or polygons including all the plant colonies not separated by unsuitable habitat at each location) were constructed with ArcGIS 10.5.1 (ESRI) software. AOO was estimated as the sum of the occupied 2 × 2 km2 grid cells.

4.3. Population Size

For the estimation of population size, censuses of the mature individuals (those that were flowering and/or fruiting) during the flowering/fruiting period in all subpopulations were carried out for five consecutive years. The number of plants per m2, which gives a rough estimate of plant density [56] was calculated for each subpopulation by dividing the number of mature individuals by the local extent. In addition, for the investigation of the stage-structure distribution of the species, plants were classified into three categories: seedlings, non-reproductive plants (juveniles, immatures, senescent and non-flowering) and reproductive plants (flowering/fruiting). Random sample surfaces 5 × 5 m2 were placed in Mb4 (n = 1). Mb5 (n = 5). Mb7 (n = 4). Mb8 (n = 8). Mb11 (n = 20) and Mb15 (n = 5) subpopulations for recording individuals per life stage. In the remaining subpopulations, censuses of individuals per life stage were carried out for the whole monitoring period.

4.4. Reproductive Biology

Certain aspects of the reproductive biology of M. browiczii were studied in all subpopulations during 2016 and in subpopulations Mb4, Mb5, Mb6, Mb7, Mb8, Mb11, Mb12 and Mb15 for five consecutive years, as these subpopulations are representative of the altitudinal range and geological substrates in which the species occurs. Fecundity (expressed as mean number of seeds produced per individual) [57] and relative reproductive success (RRS), were studied by tagging randomly selected mature individuals at the beginning of the flowering season. Moreover, in each plot the position of each mature individual was mapped. All monitoring and experimental procedures were approved by the Hellenic Ministry of Environment and Energy, Directorate of Forest Protection (approval no. MEE/DFP/125613/6014).
The numbers of flowering stems per individual and of flowers per flowering stem and per individual were recorded during each flowering period. The number of nutlets per stem was recorded during each fruiting period. In order to estimate the number of sound seeds per flower and per stem, two stems were collected from tagged individuals during each fruiting period and their seeds observed and evaluated for soundness with a stereoscope (Stemi 305 ZEISS, Oberkochen, Germany). RRS was calculated by dividing the actual production of sound seeds to the potential maximum seed production, based on four seeds per flower. Seed rain was estimated according to Andreou et al. [56] by multiplying the estimated number of seeds per individual by the number of mature individuals in each subpopulation and dividing by the local extent of each subpopulation. The survival rate of mature individuals (Sj), the proportion of juveniles that survive from one breeding season to the next, was studied by tagging randomly selected individuals from sample surfaces during the flowering period and checking their viability in the following flowering period. Reproductive biology data were analyzed by substrate (i.e., limestone, gravelly soil and old walls) to examine if RRS is affected by the depth of the organic horizon (Ao) (limestone: Ao = 1.5 cm, gravelly soil: Ao = 7.9 cm, and walls of old buildings: Ao = 0.7 cm), and consequently from interspecific competition in each position.
The duration of flowering and fruiting of M. browiczii was monitored every 1–2 weeks over five consecutive years in all subpopulations. The association of annual climate data (mean temperature, maximum temperature, minimum temperature, and precipitation) and the duration of flowering was examined with stepwise multiple linear regression analysis, to investigate the impact of these variables on flowering period. Meteorological data were obtained from Hellenic National Meteorological Service. Statistical analyses were performed with Statistica 8.0 software (StatSoft Inc., Tula, Oklahoma, USA). Moreover, to identify possible pollinators, all insect species that were associated with M. browiczii pollination were photographed, and samples were collected for identification to the lowest possible taxonomic level.
Comparisons of data regarding reproductive biology were performed by repeated measures ANOVA. Differences among pairs of means were checked by Tukey’s Method with Statistica 8.0.

4.5. Chlorophyll Fluorescence Measurements

Chlorophyll fluorescence measurements were performed during early summer, in mature individuals of M. browiczii at all locations, and of M. juliana at the two locations where the two species coexist (Mb15 and Mb16). In subpopulations Mb6 and Mb8, juveniles were also measured, while, in Mb5 and Mb14, measurements were taken on individuals growing on different substrates. For all the measurements, intact, fully developed leaves from plants fully exposed to solar irradiation were used, following the JIP-test protocol [19,58]. A high-time resolution portable fluorometer (HandyPEA, Hansatech Instruments, King’s Lynn, Norfolk, UK) was used. Raw fluorescence data were further analyzed according to JIP-test and six indices calculated: φP0, maximum quantum yield of primary PSII photochemistry; φR0, quantum yield for reduction in end electron acceptors at the PSI acceptor side; PItotal, potential for energy conservation from exciton to the reduction in PSI end acceptors; ABS/RC, absorbed photon flux per active reaction center; DI0/RC, dissipated energy flux per active reaction center; and VK/VJ, related to oxygen evolving complex inactivation.

4.6. Population Viability Analysis and Conservation Status Assessment

PVA was carried out using the total number of mature individuals during the first year of monitoring (i.e., 2014) as initial abundance and the survival rate of juveniles as survival rate, taking into consideration demographic stochasticity but without considering any density-dependent parameters. Population growth was calculated as the interannual variation in the total number of mature individuals (Nt/Nt+1). The analysis was implemented with provision for the next 10 and 50 years, with RAMAS Ecolab v.2 software [59].
The assessment of the conservation status of M. browiczii was assessed following the guidelines of IUCN Red List Categories and Criteria [34].

4.7. Threats

The direct threats that have impacted, are impacting, or may impact the status of M. browiczii, as well as the stresses they cause to this species were recorded and classified according to IUCN [54].

Supplementary Materials

The following are available online at https://0-www-mdpi-com.brum.beds.ac.uk/article/10.3390/plants10040778/s1, Figure S1: Chlorophyll fluorescence parameters of mature plants growing on limestone (grey columns) or gravelly (white striped columns) substrate (Mb5 and Mb14 subpopulations), Figure S2: Chloro-phyll fluorescence parameters of mature plants (grey columns) and juvenile plants (white striped columns) of the subpopulations Mb6 and Mb8, Figure S3: Correlation of chlorophyll fluorescence parameters with the altitude of each subpopulation, Figure S4: Correlation of chlorophyll fluores-cence parameters with the number of mature plats of each subpopulation, Figure S5: Correlation of chlorophyll fluorescence parameters with relative reproductive success (RRS, %) of each sub-population, Figure S6: Population Viability Analysis of Micromeria browiczii subpopulations in the next 50 years.

Author Contributions

Conceptualization, A.-T.V., G.I. and P.T.; methodology, A.-T.V., G.G., G.I. and P.T.; formal analysis, A.-T.V. and C.C.; investigation, A.-T.V. and C.C.; resources, A.-T.V. and P.T.; writing—original draft preparation, A.-T.V., C.C. and P.T.; writing—review and editing, A.-T.V., G.G., G.I. and P.T.; visualization, A.-T.V. and C.C.; supervision, P.T.; funding acquisition, A.-T.V. and P.T. All authors have read and agreed to the published version of the manuscript.

Funding

This research was funded by the General Secretariat for Research and Technology (GSRT) and the Hellenic Foundation for Research and Innovation (HFRI), grant number 1585 to Valli A.T.

Data Availability Statement

Data is contained within the article or Supplementary Material.

Acknowledgments

The authors would like to thank Antonios Tsagkarakis (Agricultural University of Athens) for his assistance with insect identification.

Conflicts of Interest

The authors declare no conflict of interest. The funders had no role in the design of the study; in the collection, analyses, or interpretation of data; in the writing of the manuscript; or in the decision to publish the results.

Abbreviations

ABS/RCabsorbed photon flux per active reaction centre
Amaxmaximum photosynthetic rate
DI0/RCdissipated energy flux per active reaction centre
PItotalpotential for energy conservation from exciton to the reduction in PSI end acceptors
VK/VJmeasure of the relative amplitude of K band
φP0maximum quantum yield of primary PSII photochemistry
φR0quantum yield for reduction in end electron acceptors at the PSI acceptor side
EOOExtent of Occurrence
AOOArea of Occupancy
Local Extentlocal extent of occurrence of each subpopulation, i.e., the minimum area polygon or polygons including all the plant individuals/colonies not separated by unsuitable habitat at each location
SPsubpopulation

References

  1. Le Roux, J.J.; Hui, C.; Castillo, M.L.; Iriondo, J.M.; Keet, J.-H.; Khapugin, A.A.; Médail, F.; Rejmánek, M.; Theron, G.; Yannelli, F.A.; et al. Recent Anthropogenic Plant Extinctions Differ in Biodiversity Hotspots and Coldspots. Curr. Biol. 2019, 29, 2912–2918. [Google Scholar] [CrossRef]
  2. Pereira, H.M.; Leadley, P.W.; Proença, V.; Alkemade, R.; Scharlemann, J.P.W.; Fernandez-Manjarrés, J.F.; Araújo, M.B.; Balvanera, P.; Biggs, R.; Cheung, W.W.L.; et al. Scenarios for Global Biodiversity in the 21st Century. Science 2010, 330, 1496–1501. [Google Scholar] [CrossRef] [Green Version]
  3. Brummitt, N.A.; Bachman, S.P.; Griffiths-Lee, J.; Lutz, M.; Moat, J.F.; Farjon, A.; Donaldson, J.S.; Hilton-Taylor, C.; Meagher, T.R.; Albuquerque, S.; et al. Green Plants in the Red: A Baseline Global Assessment for the IUCN Sampled Red List Index for Plants. PLoS ONE 2015, 10, e0135152. [Google Scholar] [CrossRef] [Green Version]
  4. Medail, F.; Quezel, P. Hot-Spots Analysis for Conservation of Plant Biodiversity in the Mediterranean Basin. Ann. Mo. Bot. Gard. 1997, 84, 112. [Google Scholar] [CrossRef]
  5. Vogiatzakis, I.N.; Mannion, A.M.; Sarris, D. Mediterranean island biodiversity and climate change: The last 10,000 years and the future. Biodivers. Conserv. 2016, 25, 2597–2627. [Google Scholar] [CrossRef]
  6. Medail, F.; Quezel, P. Biodiversity Hotspots in the Mediterranean Basin: Setting Global Conservation Priorities. Conserv. Biol. 1999, 13, 1510–1513. [Google Scholar] [CrossRef]
  7. Rosselló, J.A.; Cosín, R.; Bacchetta, G.; Brullo, S.; Mayol, M. Nuclear and chloroplast DNA variation in Cephalaria squamiflora (Dipsacaceae), a disjunct Mediterranean species. Taxon 2009, 58, 1242–1253. [Google Scholar] [CrossRef]
  8. Whittaker, R.J.; Fernández-Palacios, J.M.; Matthews, T.J.; Borregaard, M.K.; Triantis, K.A. Island biogeography: Taking the long view of nature’s laboratories. Science 2017, 357, eaam8326. [Google Scholar] [CrossRef] [PubMed] [Green Version]
  9. Eliades, N.-G.H.; Andreou, M.; Laguna, E.; Kounnamas, C.; Georghiou, K.; Costantinou, C.; Kouzali, I.; Thanos, C.A.; Kadis, C. Integrated conservation of important plant taxa through the improvement of the original plant micro-reserve (PMR) approach: The intensive PMR monitoring case of Ophrys kotschyi. J. Environ. Manag. 2021, 280, 111731. [Google Scholar] [CrossRef] [PubMed]
  10. Valli, A.-T.; Kougioumoutzis, K.; Iliadou, E.; Panitsa, M.; Trigas, P. Determinants of alpha and beta vascular plant diversity in Mediterranean island systems: The Ionian islands, Greece. Nord. J. Bot. 2018, 37, e02156. [Google Scholar] [CrossRef] [Green Version]
  11. Valli, A.-T.; Koumandou, V.L.; Iatrou, G.; Andreou, M.; Papasotiropoulos, V.; Trigas, P. Conservation biology of threatened Mediterranean chasmophytes: The case of Asperula naufraga endemic to Zakynthos island (Ionian islands, Greece). PLoS ONE 2021, 16, e0246706. [Google Scholar] [CrossRef]
  12. Lyons, K.G.; Schwartz, M.W. Rare species loss alters ecosystem function—Invasion resistance. Ecol. Lett. 2001, 4, 358–365. [Google Scholar] [CrossRef] [Green Version]
  13. Lyons, K.G.; Brigham, C.A.; Traut, B.; Schwartz, M.W. Rare Species and Ecosystem Functioning. Conserv. Biol. 2005, 19, 1019–1024. [Google Scholar] [CrossRef]
  14. Ferrer-Sánchez, Y.; Rodríguez-Estrella, R. How rare species conservation management can be strengthened with the use of ecological niche modelling: The case for endangered endemic Gundlach’s Hawk and Cuban Black-Hawk. Glob. Ecol. Conserv. 2016, 5, 88–99. [Google Scholar] [CrossRef] [Green Version]
  15. Crain, B.J.; Sánchez-Cuervo, A.M.; White, J.W.; Steinberg, S.J. Conservation ecology of rare plants within complex local habitat networks. Oryx 2014, 49, 696–703. [Google Scholar] [CrossRef] [Green Version]
  16. Lavergne, S.; Thompson, J.D.; Garnier, E.; Debussche, M. The biology and ecology of narrow endemic and widespread plants: A comparative study of trait variation in 20 congeneric pairs. Oikos 2004, 107, 505–518. [Google Scholar] [CrossRef]
  17. Gulías, J.; Flexas, J.; Mus, M.; Cifre, J.; Lefi, E.; Medrano, H. Relationship between Maximum Leaf Photosynthesis, Nitrogen Content and Specific Leaf Area in Balearic Endemic and Non-endemic Mediterranean Species. Ann. Bot. 2003, 92, 215–222. [Google Scholar] [CrossRef] [PubMed]
  18. Catoni, R.; Gratani, L. Morphological and physiological adaptive traits of Mediterranean narrow endemic plants: The case of Centaurea gymnocarpa (Capraia Island, Italy). Flora Morphol. Distrib. Funct. Ecol. Plants 2013, 208, 174–183. [Google Scholar] [CrossRef]
  19. Strasser, R.J.; Tsimilli-Michael, M.; Srivastava, A. Analysis of the Chlorophyll a Fluorescence Transient. In Chlorophyll a Fluorescence: A Signature of Photosynthesis; Papageorgiou, G., Govindjee, Eds.; Springer: Dordrecht, The Netherlands, 2004; pp. 321–362. [Google Scholar]
  20. Adams, V.M.; Marsh, D.M.; Knox, J.S. Importance of the seed bank for population viability and population monitoring in a threatened wetland herb. Biol. Conserv. 2005, 124, 425–436. [Google Scholar] [CrossRef]
  21. Lehtila, K.; Syrjanen, K.; Leimu, R.; Garcia, M.B.; Ehrlen, J. Habitat change and demography of Primula veris: Identification of management targets. Conserv. Biol. 2006, 20, 833–843. [Google Scholar] [CrossRef]
  22. Massey, J.R.; Whitson, P.D. Species Biology, the Key to Plant Preservation. Rhodora 1980, 82, 97–103. [Google Scholar]
  23. Schemske, D.W.; Husband, B.C.; Ruckelshaus, M.H.; Goodwillie, C.; Parker, I.M.; Bishop, J.G. Evaluating Approaches to the Conservation of Rare and Endangered Plants. Ecology 1994, 75, 584–606. [Google Scholar] [CrossRef] [Green Version]
  24. Marsh, D.M.; Trenham, P.C. Current Trends in Plant and Animal Population Monitoring. Conserv. Biol. 2008, 22, 647–655. [Google Scholar] [CrossRef] [PubMed]
  25. Yoccoz, N.G.; Nichols, J.D.; Boulinier, T. Monitoring of biological diversity in space and time. Trends Ecol. Evol. 2001, 16, 446–453. [Google Scholar] [CrossRef]
  26. Pino, J.; De Roa, E. Population biology of Kosteletzkya pentacarpos (Malvaceae) in the Llobregat delta (Catalonia, NE of Spain). Plant Ecol. 2006, 188, 1–16. [Google Scholar] [CrossRef]
  27. Davy, A.J.; Jefferies, R.L. Approaches to the Monitoring of Rare Plant Populations. In The Biological Aspects of Rare Plant Conservation; Synge, H., Ed.; John Wiley and Sons: New York, NY, USA, 1981; pp. 219–232. [Google Scholar]
  28. Pavlik, B.M. Perspectives, Tools, and Institutions for Conserving Rare Plants. Southwest. Nat. 1997, 42, 375–383. [Google Scholar]
  29. Donovan, T.M.; Welden, C.W. Conservation Biology and Landscape Ecology; Sinauer Associates: Sunderland, MA, USA, 2001. [Google Scholar]
  30. Pavlik, B.M. Demographic Monitoring and the Recovery of Endangered Plant Populations. In Restoration of Endangered Species; Cambridge University Press: Cambridge, UK, 1994; pp. 322–350. [Google Scholar]
  31. Yates, C.J.; Broadhurst, L.M. Assessing limitations on population growth in two critically endangered Acacia taxa. Biol. Conserv. 2002, 108, 13–26. [Google Scholar] [CrossRef]
  32. Tan, K.; Zielinski, J. “Micromeria browiczii” (Labiatae), an unusual new species from Zakinthos (Ionian Islands, Greece). Pol. Bot. J. 2001, 46, 31–34. [Google Scholar]
  33. Šerá, B.; Feráková, V.; Kocianová, E.; Vágenknecht, V.; Majzlan, O.; Dúbravcová, Z. Peucedanum arenarium subsp. arenarium—A critically endangered species of the Slovak flora (morphometry, distribution, biology). Biologia 2005, 60, 17–23. [Google Scholar]
  34. IUCN. Guidelines for Using the IUCN Red List Categories and Criteria; Version 14; IUCN: Gland, Switzerland, 2019; Available online: http://www.iucnredlist.org/documents/RedListGuidelines.pdf (accessed on 1 September 2020).
  35. Tienes, M.; Skogen, K.; Vitt, P.; Havens, K. Optimal Monitoring of Rare Plant Populations: Report for the USDA Forest Service; Chicago Botanic Garden: Glencoe, IL, USA, 2010. [Google Scholar]
  36. Heywood, V.H.; Iriondo, J.M. Plant conservation: Old problems, new perspectives. Biol. Conserv. 2003, 113, 321–335. [Google Scholar] [CrossRef]
  37. Kier, G.; Kreft, H.; Lee, T.M.; Jetz, W.; Ibisch, P.L.; Nowicki, C.; Mutke, J.; Barthlott, W. A global assessment of endemism and species richness across island and mainland regions. Proc. Natl. Acad. Sci. USA 2009, 106, 9322–9327. [Google Scholar] [CrossRef] [Green Version]
  38. Weigelt, P.; Jetz, W.; Kreft, H. Bioclimatic and physical characterization of the world’s islands. Proc. Natl. Acad. Sci. USA 2013, 110, 15307–15312. [Google Scholar] [CrossRef] [PubMed] [Green Version]
  39. Lucas, R.W.; Forseth, I.N.; Casper, B.B. Using rainout shelters to evaluate climate change effects on the demography of Cryptantha flava. J. Ecol. 2008, 96, 514–522. [Google Scholar] [CrossRef]
  40. Dahlgren, D.K.; Guttery, M.R.; Messmer, T.A.; Caudill, D.; Elmore, R.D.; Chi, R.; Koons, D.N. Evaluating vital rate contributions to greater sage-grouse population dynamics to inform conservation. Ecosphere 2016, 7, e01249. [Google Scholar] [CrossRef] [Green Version]
  41. Pachauri, R.K.; Allen, M.R.; Barros, V.R.; Broome, J.; Cramer, W.; Christ, R.; Church, J.A.; Clarke, L.; Dahe, Q.; Dasgupta, P.; et al. Climate Change 2014: Synthesis Report; IPCC: Geneva, Switzerland, 2014; p. 151. [Google Scholar]
  42. Collet, C.; Le Moguedec, G. Individual seedling mortality as a function of size, growth and competition in naturally regenerated beech seedlings. Forestry 2007, 80, 359–370. [Google Scholar] [CrossRef] [Green Version]
  43. Hall, C.; Hoff, W.D. Water Transport in Brick, Stone and Concrete; Taylor & Francis: Abingdon, UK, 2002. [Google Scholar]
  44. Moore, L.M.; Lauenroth, W.K. Differential effects of temperature and precipitation on early- vs. late-flowering species. Ecosphere 2017, 8, e01819. [Google Scholar] [CrossRef] [Green Version]
  45. Gordon, C.; Llorens, L.; Nielsen, T.; Tietema, A.; Beier, C.; Bruna, P.; Emmett, B.; Estiarte, M.; Gorissen, A. Nonintrusive Field Experiments Show Different Plant Responses to Warming and Drought Among Sites, Seasons, and Species in a North–South European Gradient. Ecosystems 2004, 7, 598–612. [Google Scholar] [CrossRef]
  46. Prieto, P.; Peñuelas, J.; Ogaya, R.; Estiarte, M. Precipitation-dependent Flowering of Globularia alypum and Erica multiflora in Mediterranean Shrubland Under Experimental Drought and Warming, and its Inter-annual Variability. Ann. Bot. 2008, 102, 275–285. [Google Scholar] [CrossRef] [PubMed]
  47. De Jong, T.J.; Roo, L.G.-D.; Klinkhamer, P.G.L. Is the threshold size for flowering in Cynoglossum officinale fixed or dependent on environment? New Phytol. 1998, 138, 489–496. [Google Scholar] [CrossRef]
  48. BrysRichard, R.; Shefferson, R.P.; Jacquemyn, H. Impact of herbivory on flowering behaviour and life history trade-offs in a polycarpic herb: A 10-year experiment. Oecologia 2010, 166, 293–303. [Google Scholar] [CrossRef]
  49. Ashraf, M.; Harris, P.J.C. Photosynthesis under stressful environments: An overview. Photosynthetica 2013, 51, 163–190. [Google Scholar] [CrossRef]
  50. Gouvra, E.; Grammatikopoulos, G. Diurnal and seasonal trends of water relations in five co-occurring chasmophytic species. Flora Morphol. Distrib. Funct. Ecol. Plants 2007, 202, 237–248. [Google Scholar] [CrossRef]
  51. Chondrogiannis, C.; Grammatikopoulos, G. Photosynthesis in developing leaf of juveniles and adults of three Mediterranean species with different growth forms. Photosynth. Res. 2016, 130, 427–444. [Google Scholar] [CrossRef] [PubMed]
  52. Roberts, E.H. Physiological Aspects of Ex Situ Seed Conservation. In Conservation Biology; Kapoor-Vijay, P., White, J., Eds.; The Commonwealth Secretariat: London, UK, 1992; pp. 171–177. [Google Scholar]
  53. Maunder, M.; Guerrant, E.O.; Havens, K.; Dixon, K.W. Realizing the Full Potential of Ex Situ Contributions to Global Plant Conservation. In Ex Situ Plant Conservation: Supporting Species Survival in the Wild; Guerrant, E.O., Havens-Young, K., Maunder, M., Eds.; Society for Ecological Restoration International: Washington, DC, USA; Center for Plant Conservation: Escondido, CA, USA; Island Press: Washington, DC, USA, 2004; pp. 389–418. [Google Scholar]
  54. IUCN. Threats Classification Scheme; Version 3.2; IUCN: Gland, Switzerland, 2012; Available online: https://www.iucnredlist.org/technicaldocuments/classification-schemes/threatsclassification-scheme (accessed on 20 May 2020).
  55. Andreou, M.; Delipetrou, P.; Kadis, C.; Tsiamis, G.; Bourtzis, K.; Georghiou, K. An integrated approach for the conservation of threatened plants: The case of Arabis kennedyae (Brassicaceae). Acta Oecologica 2011, 37, 239–248. [Google Scholar] [CrossRef]
  56. Andreou, M.; Kadis, C.; Delipetrou, P.; Georghiou, K. Conservation biology of Chionodoxa lochiae and Scilla morrisii (Asparagaceae): Two priority bulbous plant species of the European Union in Cyprus. Glob. Ecol. Conserv. 2015, 3, 511–525. [Google Scholar] [CrossRef] [Green Version]
  57. Burns, J.H.; Pardini, E.A.; Schutzenhofer, M.R.; Chung, Y.A.; Seidler, K.J.; Knight, T.M. Greater sexual reproduction contributes to differences in demography of invasive plants and their noninvasive relatives. Ecology 2013, 94, 995–1004. [Google Scholar] [CrossRef] [Green Version]
  58. Stirbet, A. Govindjee on the relation between the Kautsky effect (chlorophyll a fluorescence induction) and Photosystem II: Basics and applications of the OJIP fluorescence transient. J. Photochem. Photobiol. B Biol. 2011, 104, 236–257. [Google Scholar] [CrossRef] [PubMed]
  59. Rexstad, E.; Akçakaya, H.R.; Burgman, M.A.; Ginzburg, L.R. Applied Population Ecology: Principles and Computer Exercises Using RAMAS EcoLab. J. Wildl. Manag. 2000, 64, 1093. [Google Scholar] [CrossRef]
Figure 1. Geographical distribution of Micromeria browiczii subpopulations (blue dots) on Zakynthos Island, the estimated extent of occurrence (EOO), and area of occupancy (AOO) based on 2 × 2 km2 grid.
Plants 10 00778 g001
Figure 2. Flowering and fruiting period of M. browiczii during five consecutive years (2014–2018). * Subpopulation Mb3 exhibited extended flowering period during 2015 (from 4 May 2015 to 31 January 2016).
Plants 10 00778 g002
Figure 3. Chlorophyll fluorescence parameters for the different subpopulations of M. browiczii (light grey columns) and of M. juliana (dark grey columns). Mean values ± SD, (n = 10–15). (A): Maximum quantum yield of primary PSII photochemistry (φP0, A); (B): absorbed photon flux per active reaction center (ABS/RC); (C): quantum yield for reduction in end electron acceptors at the PSI acceptor side (φR0); (D): dissipated energy flux per active reaction centre (DI0/RC); (E): potential for energy conservation from exciton to the reduction in PSI end acceptors (PItotal) and (F): measure of the relative amplitude of K band (VK/VJ) (related to oxygen evolving complex inactivation).
Plants 10 00778 g003
Figure 4. Population viability analysis of Micromeria browiczii over (a) the next 10 and (b) the next 50 years. The average (line), ±1 standard deviation and minimum and maximum (dots) numbers of the population of M. browiczii are shown.
Plants 10 00778 g004
Table 1. Geographical data of Micromeria browiczii subpopulations. Abbreviations as follows: SP, subpopulation; Ao, depth of organic horizon; local extent, the minimum area polygon or polygons including all the plant colonies not separated by unsuitable habitat at each location; AOO, area of occupancy.
LocationIUCN SPColonyAltitude (m)LongitudeLatitudeAspect (°)Slope (°)SubstrateAo (cm)Local Extent (km2)AOO (km2)
MarathiasMb1M1104–11220.851298°37.667198°22.5–67.5 (NE)45–90Rock1.50.00012578
M221–31667.5–112.5 (E)
Faros KeriouMb2F1141–18820.807577°37.656210°247–337.5 (W. NW)45–90Rock1.50.0080164
F2
F3
EthnikiMb3 154–15920.812783°37.669883°202.5–247.5 (SW)80Rock1.50.0000274
Plakaki (l.c.)Mb4Pl181–22020.777832°37.689664°247.5–292.5 (W. S)45–110Rock1.50.1024
Pl2202.5–247.5 (SW)
PsarisMb5 183–22720.769923°37.698439°247.5–337.5
(NW. W)
20–50Rock1.50.011194
Gravel7.9
AgalasMb6 272–28720.774257°37.707252°202.5–247.5 (SW)45–90Wall0.70.002184
Rock1.5
KorakonisiMb7 32–20520.739322°37.722931°22.5–67.5 (NE)20–45Rock1.50.012954
LimnionasMb8 21–17820.703129°37.746664°157.5–247.5 (SW. S)30–90Rock1.50.0294112
KampiMb9K1166–18220.681802°37.780336°337.5–360 (N)10–50Rock1.50.0023034
K2158–167292.5–337.5 (NW)
K3163292.5–337.5 (NW)
K4164247.5–292.5 (W)
MariesMb10 343–41620.678940°37.819131°202.5–292.5 (SW. W)45–90Rock1.50.0006534
Porto VromiMb11 13–22820.631936°37.829057°112.5–292.5 (SE. S. SW. W)45–90Rock1.50.015494
AnafonitriaMb12 310–31720.644937°37.844176°202.5–247.5 (SW)90Wall0.70.00002554
Aghios GeorgiosMb13 309–32520.635926°37.859460°205.5–247.5 (SW)10–90Gravel7.90.0004024
NavagioMb14 200–22920.625690°37.862401°247.5–292.5
(W)
45Rock1.50.0103784
Gravel7.9
XigiaMb15 10–3820.731328°37.879880°67.5–112.5 (E)30–90Rock1.50.0062448
Table 2. Number of mature individuals (subpopulation size), local extent (the minimum area polygon or polygons including all the plant colonies not separated by unsuitable habitat at each location) and plants per m2 for each subpopulation per year. Subpopulation abbreviations as in Table 1. SP: subpopulation.
SPColony20142015201620172018
SP Size L. extent (m2)Plants/m2SP sizeL. extent (m2)Plants/m2SP SizeL. extent (m2)Plants/m2SP Size L. extent (m2)Plants/m2SP Size L. extent (m2)Plants/m2
Mb1M1428.10.14228.10.07028.10228.10.071228.10.43
M2197.50.011197.50.113897.50.08497.50.048197.50.83
Mb2F11937900.0033337900.0092737900.0075237900.014202500.08
F227270.00337270.004147270.0277270.0147270.006
F3491920.0004691920.00073591920.0041191920.00123791920.004
Mb3 13270.481270.03711270.411270.427271
Mb4Pl112492,6530.00133292,6520.00038192,6520.00094192,6520.000499926,520.0001
Pl24394110.0051794110.0029294110.0115294110.02431200.36
Mb5 324511,1920.3135411,1920.12356211,1920.32126011,1920.112163211,1920.146
Mb6 6121800.0286321800.0288621800.0398721800.0427621800.13
Mb7 142512,9500.11116612,9500.09103612,9500.0825912,9500.01990712,9500.07
Mb8 78229,4120.02638229,4120.012214729,4120.0744129,4120.015382429,4120.13
Mb9K15915460.042615460.0176115460.042515460.0164815460.03
K21517.50.861017.50.571417.50.81917.51.091417.50.8
K314475.70.0318475.70.03825475.70.0520475.70.0434475.70.07
K4690.80.07090.80190.80.01090.80590.80.06
Mb10 1646530.33366530.53726530.565686530.873476530.53
Mb11 92615,4900.06143115,4900.09134515,4900.08616815,4900.0116815,4900.01
Mb12 8625.53.418525.57.2518425.57.223925.59.3727425.510.6
Mb13 234020.06124020.029294020.0754020.01414020.1
Mb14 11510,3780.016510,3780.0068810,3780.0085810,3780.00555410,3780.0052
Mb15 137462440.2249962440.0831262440.0530062440.04868762440.11
TOTAL 854722,2831 5641222,831 952322,2831 3725222,831 8579210,000
Table 3. Percentage of seedlings, non-reproductive and mature individuals of Micromeria browiczii during monitoring period.
YearSeedlings (%)Non-Reproductive Individuals (%)Mature Individuals (%)
201412.0172.2915.69
20156.4678.6914.86
201612.3561.0626.88
201712.1879.188.64
20186.4367.6125.94
Table 4. Characteristics of reproductive biology and fecundity (expressed as mean number of fruits produced per individual) of M. browiczii during five consecutive years (2014–2018). n = sample size (i.e., number of randomly selected mature individuals or number of stems from tagged individuals).
2014n2015n2016n2017n2018n
Stems/individuals ± SE28.1 ± 5 a,*6021.24 ± 5.5 a6012.2 ± 1.8 b11512.38 ± 1.4 a6014.7 ± 1.9 a60
Flowering or fruiting stems per individual (F) ± SE5.43 ± 0.7 a607.89 ± 1.49 a606.38 ± 1.58 a1155.03 ± 0.57 a606.58 ± 0.97 a60
Mean number of flowers per stem ± SE7.18 ± 0.99 a603.48 ± 0.36 b605.38 ± 0.55 a1157.75 ± 0.69 c604.88 ± 0.55 a60
Mean number of flowers per individual ± SE29.25 ± 6.3 a6022.9 ± 3.7 a6036.4 ± 10.09 a11543.5 ± 8.08 a6042.55 ± 9.6 a60
Mean number of fruits (nutlets) per flower1.78 ± 0.17 a1201.93 ± 0.08 a1202.22 ± 0.14 a2302.095 ± 0.13 a1202.13 ± 0.19 a120
Mean number of fruits (nutlets) per stem (S) ± SE50.5 ± 6.8 a12038.09 ± 5 a12048.03 ± 6.5 a23048.95 ± 9.2 a12040.89 ± 4.06 a120
Fecundity (mean number of fruits per individual) (S × F)274.2 300.5 306.4 246.2 269.06
Seed rain (seeds/m2)0.065 0.028 0.086 0.04 0,047
Survival of juveniles (%) (Sj) 64.5 45 35 70
Relative Reproductive Success (%)44.5 ± 4.35 a 48.26 ± 2.1 a 55.34 ± 3.5 b 52.4 ± 3.2 a 53.6 ± 3.88 a
Different letters represent significant differences (p < 0.05) among the study years, for each reproductive parameters.
Publisher’s Note: MDPI stays neutral with regard to jurisdictional claims in published maps and institutional affiliations.

