
Influence of Local Burning on Difference Reflectance Indices Based on 400–700 nm Wavelengths in Leaves of Pea Seedlings

 , , and
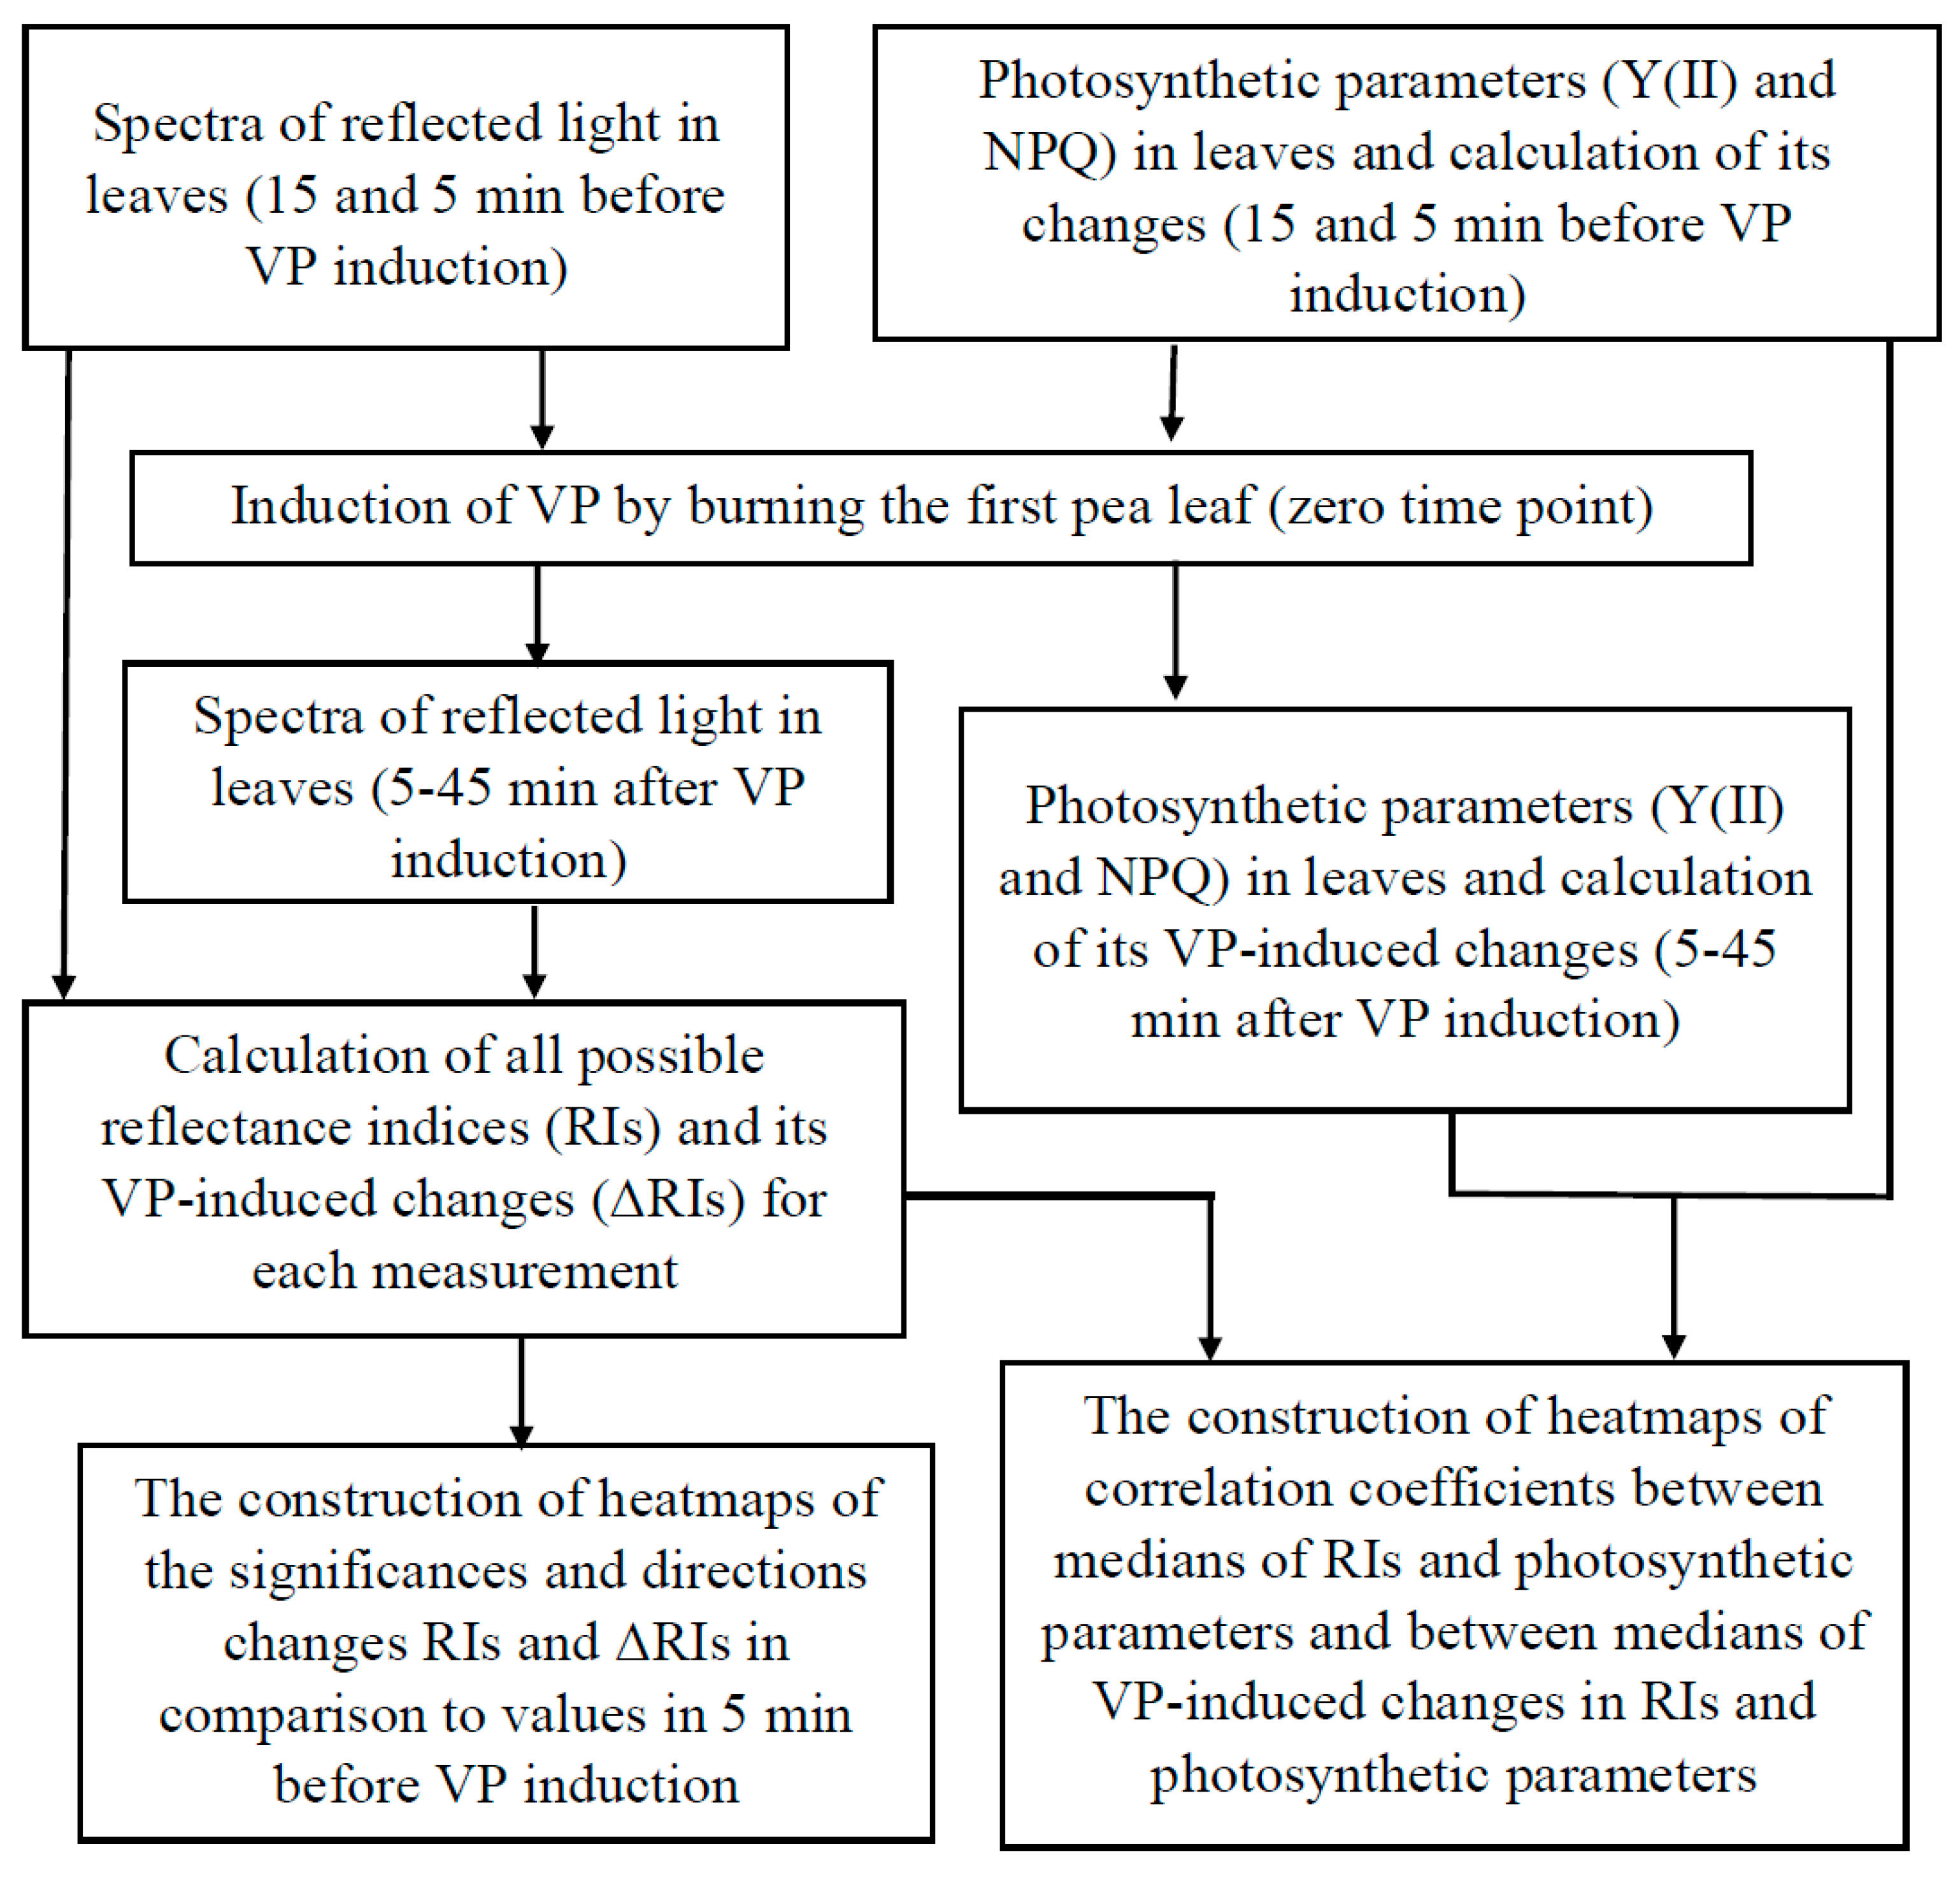
Abstract
:1. Introduction
2. Data Analysis
2.1. General Scheme of Data Analysis
2.2. Calculation of Difference Reflectance Indices and Construction of Heat Maps
3. Results
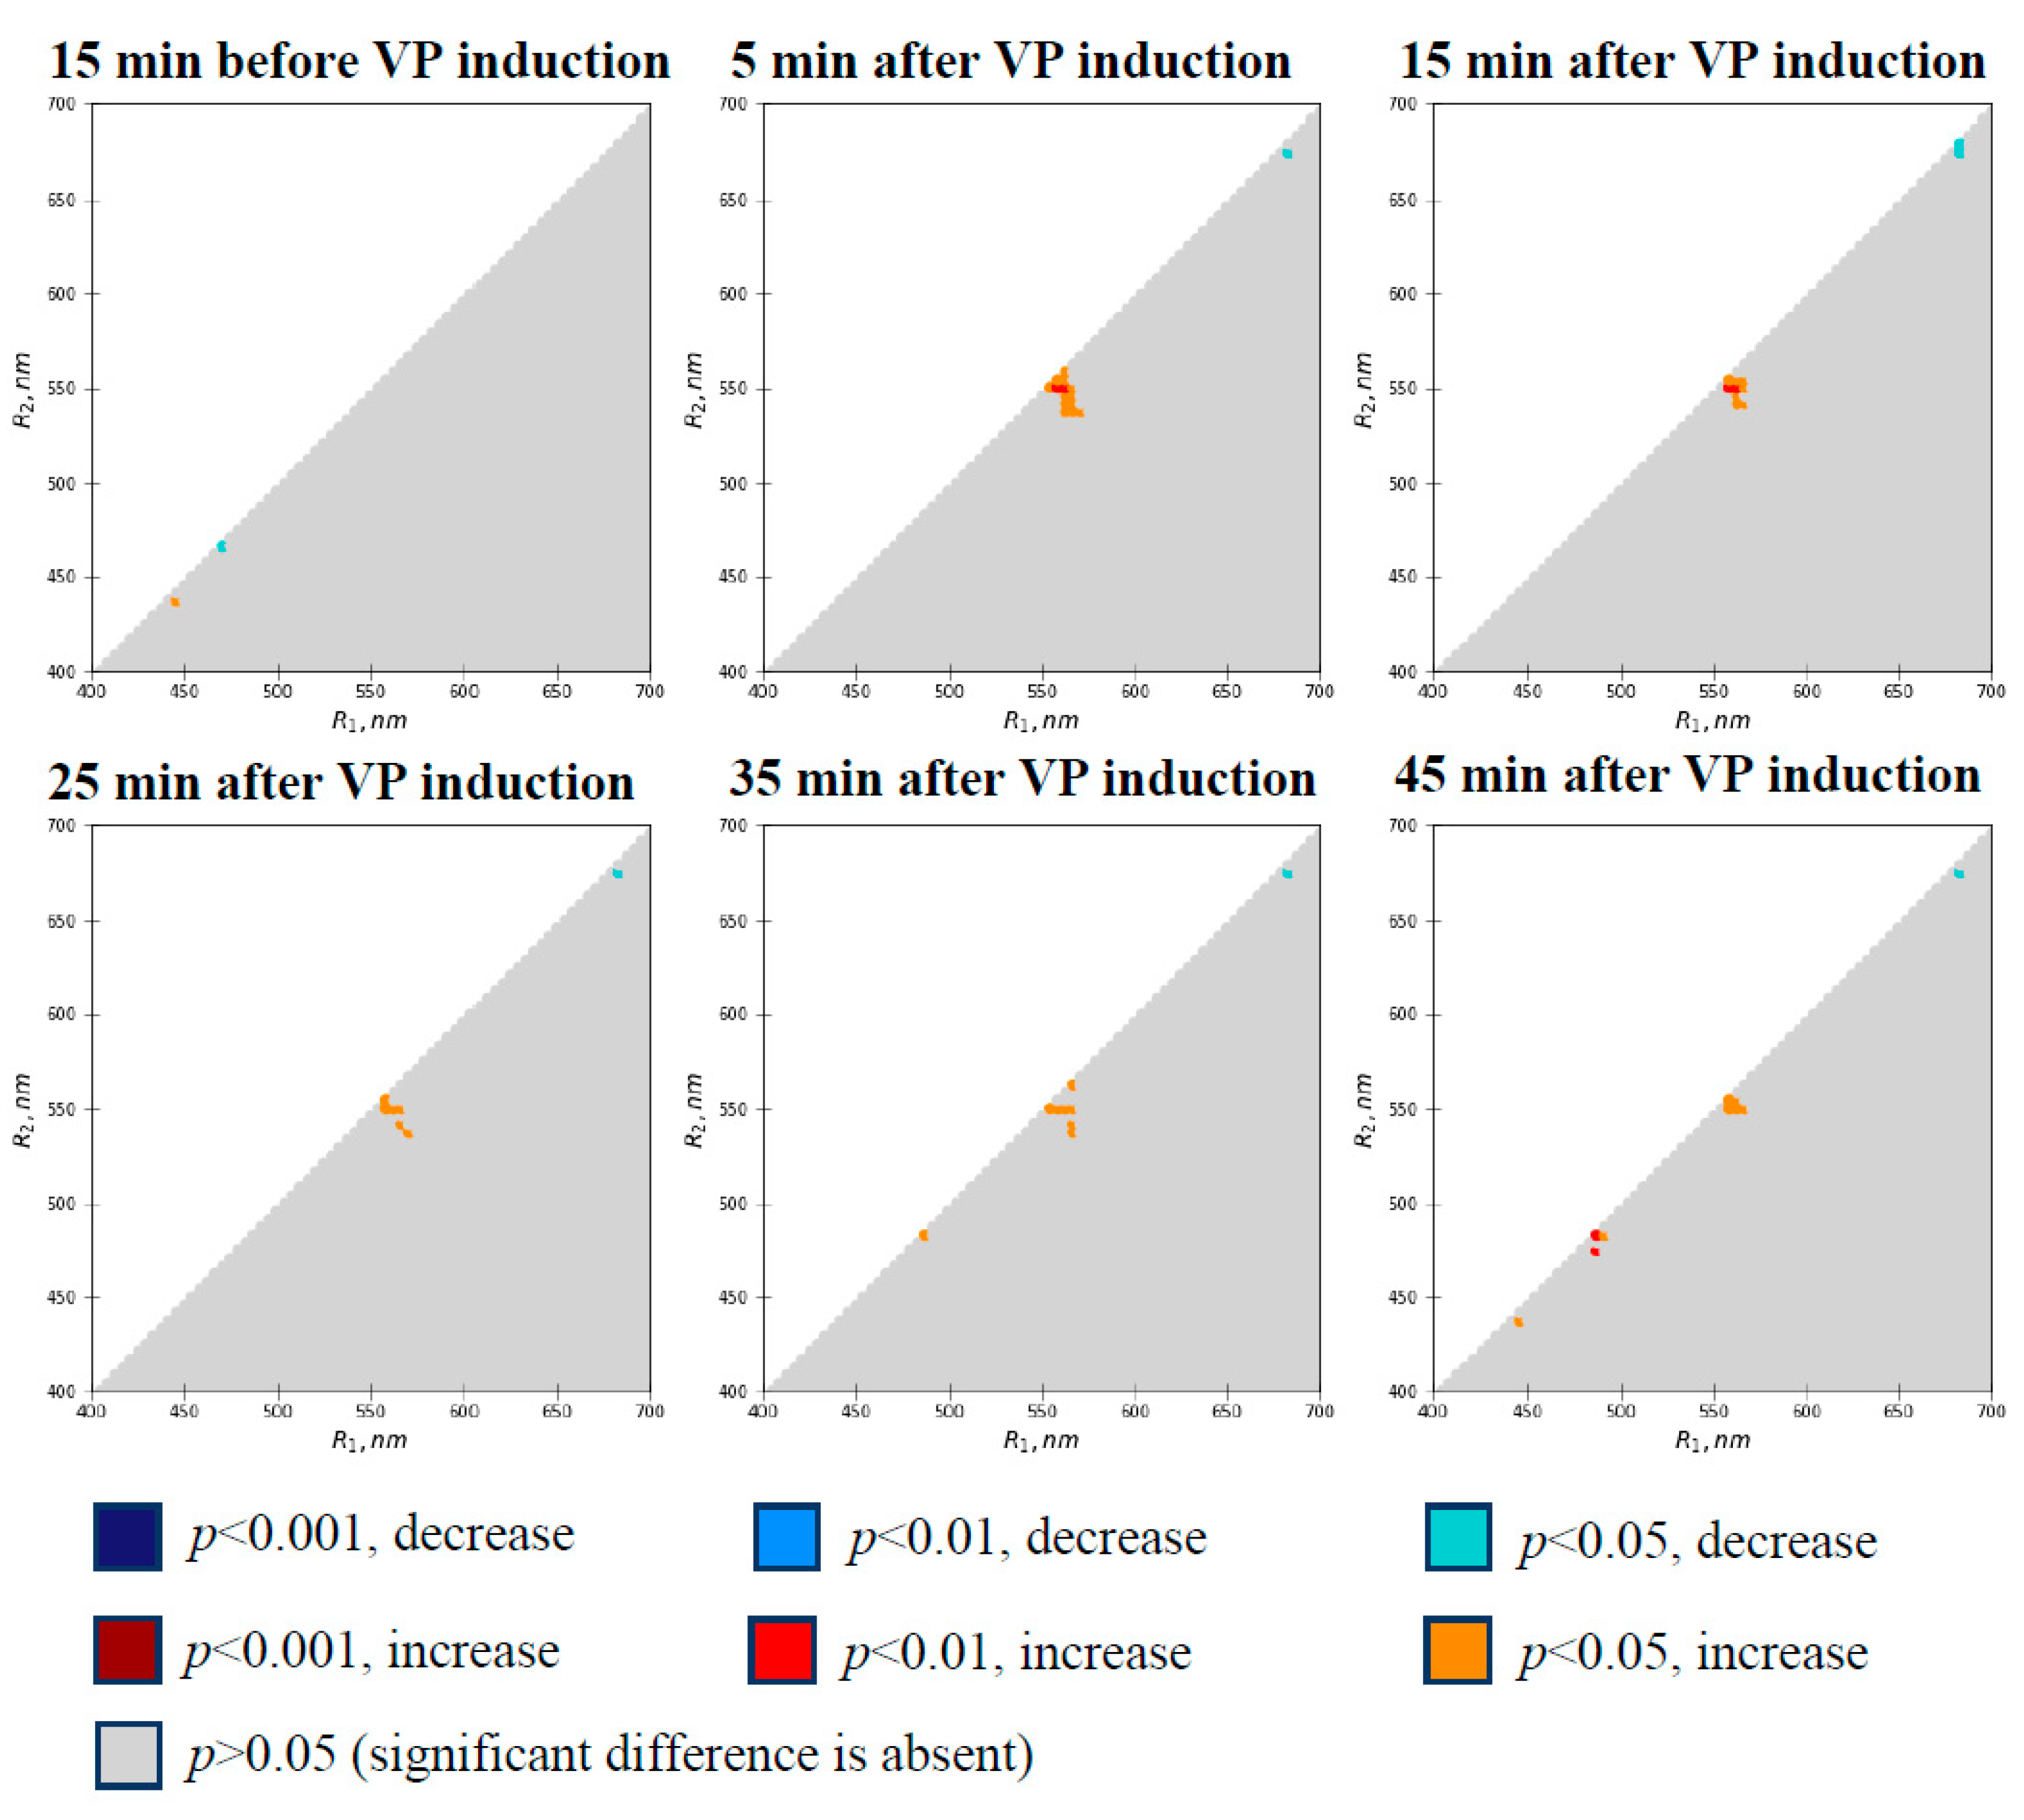
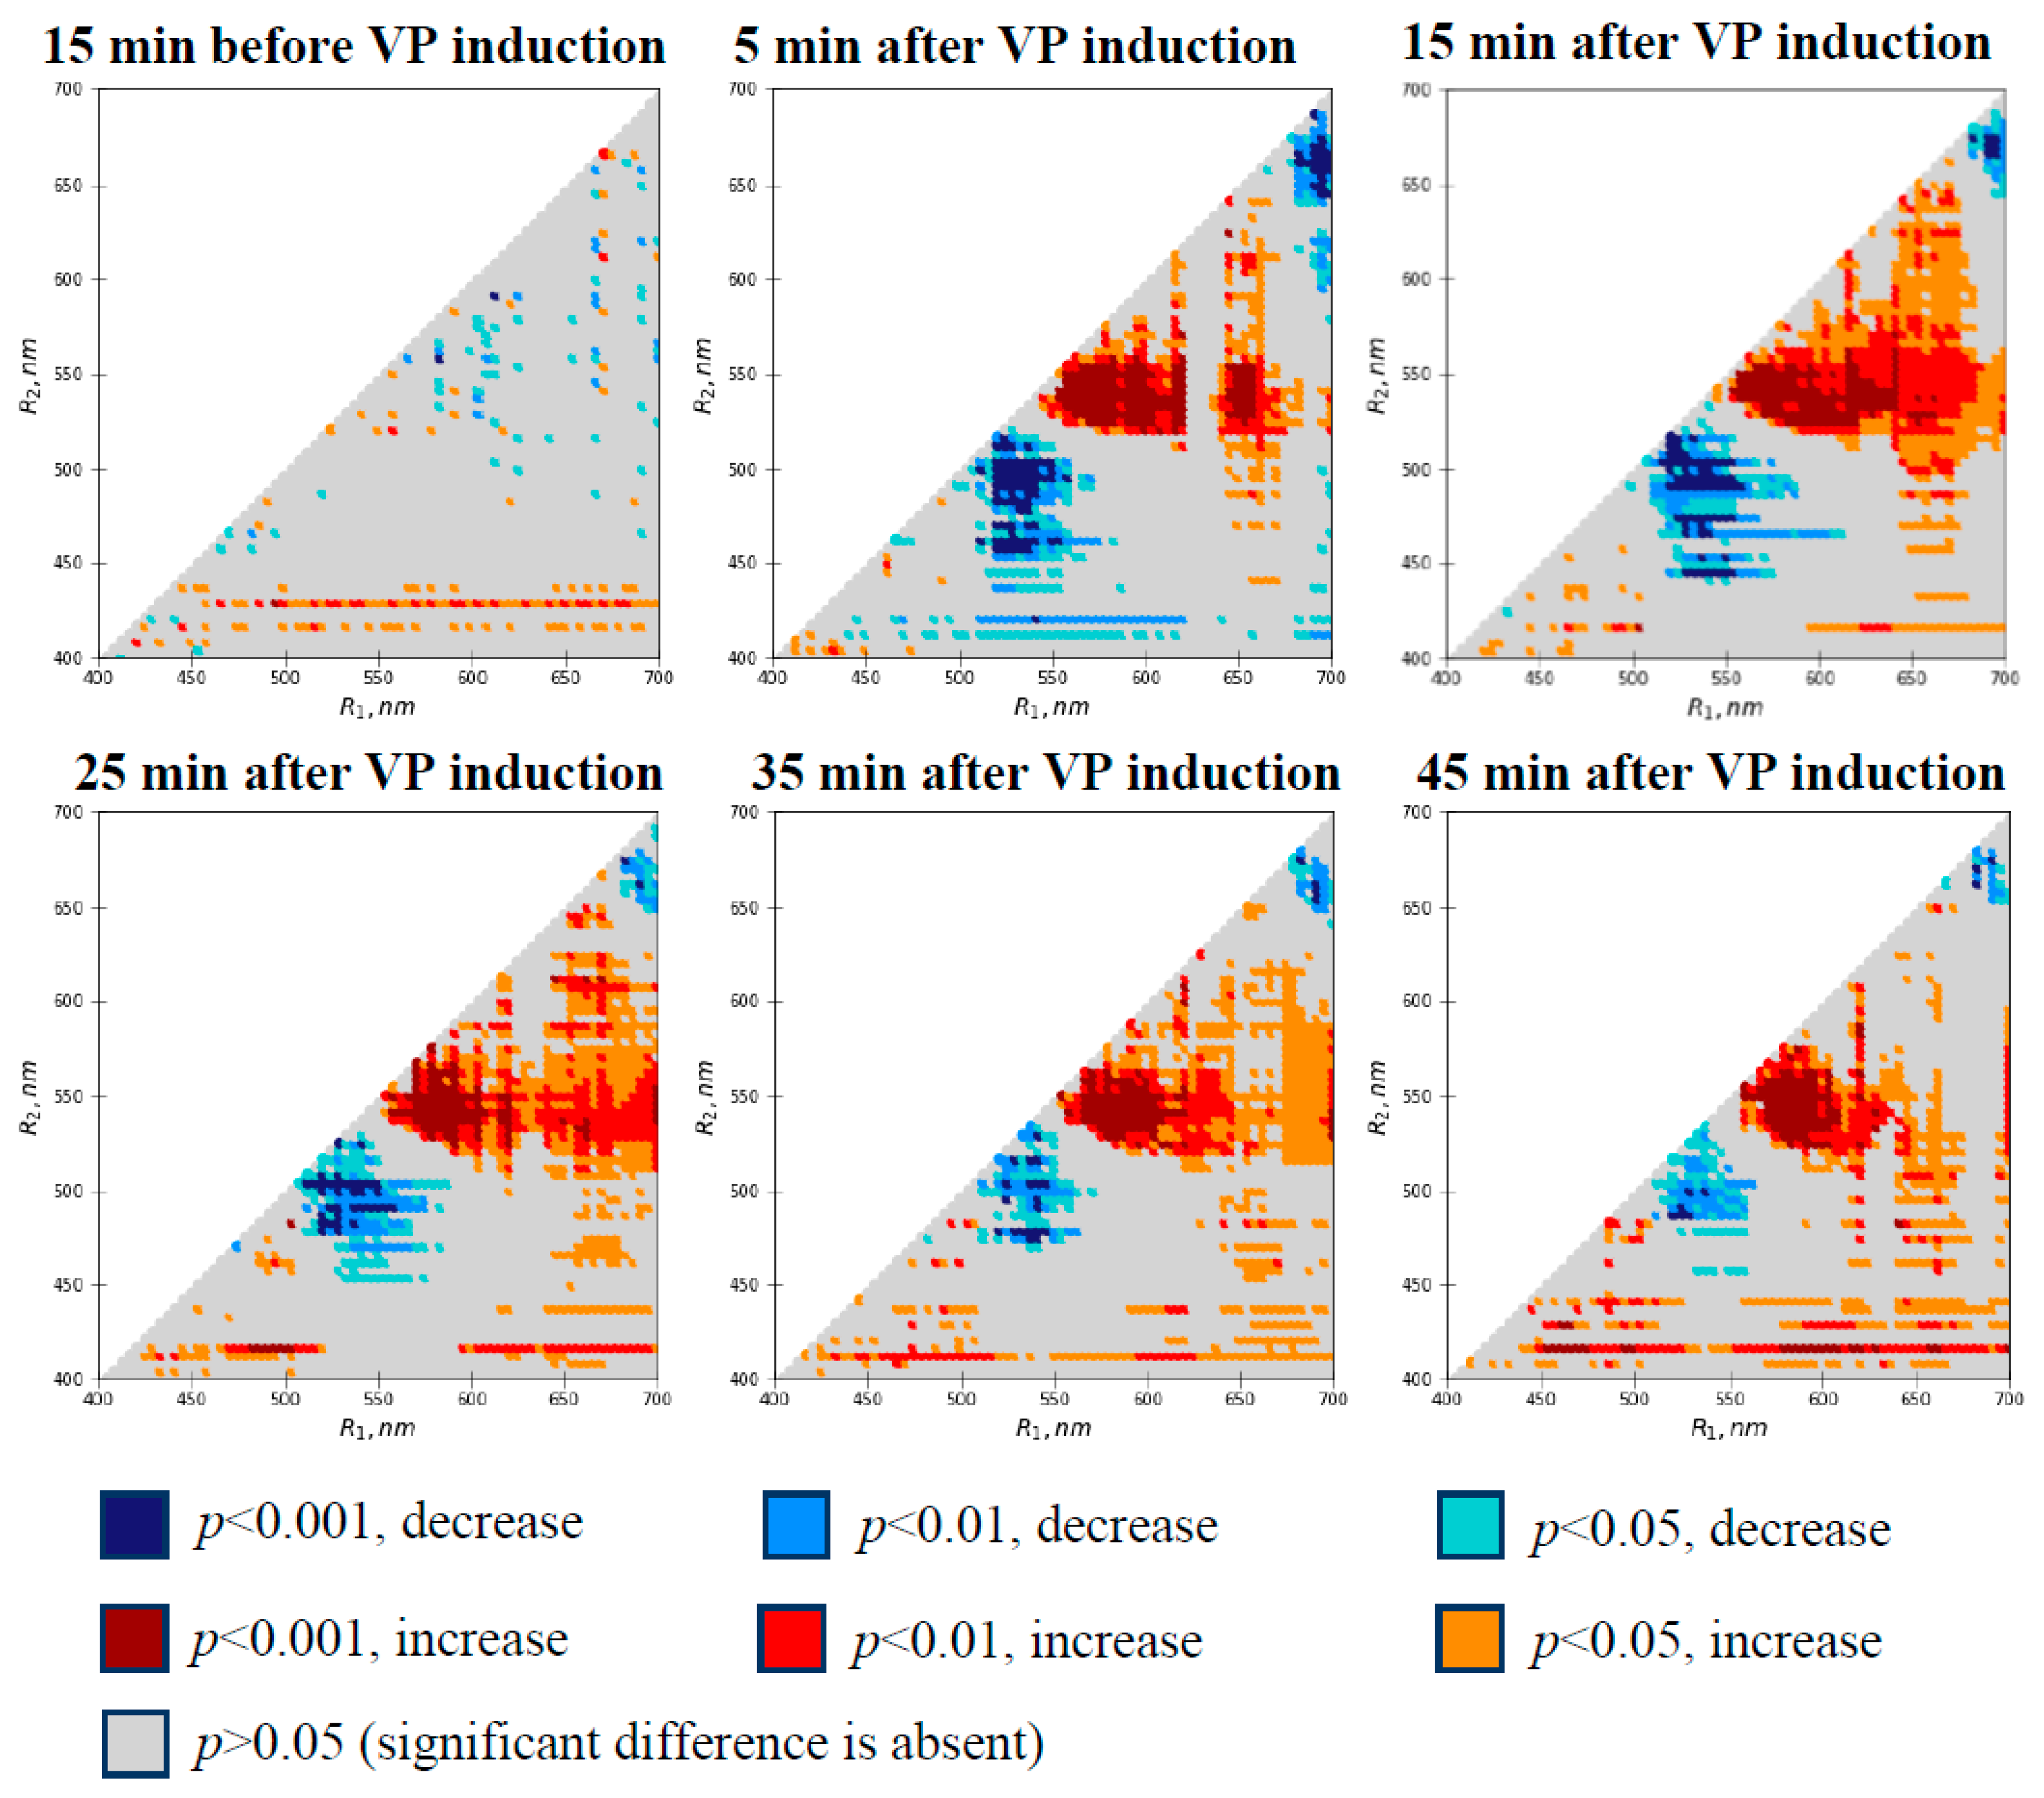
3.1. Local Burning-Induced Changes in Difference Reflectance Indices
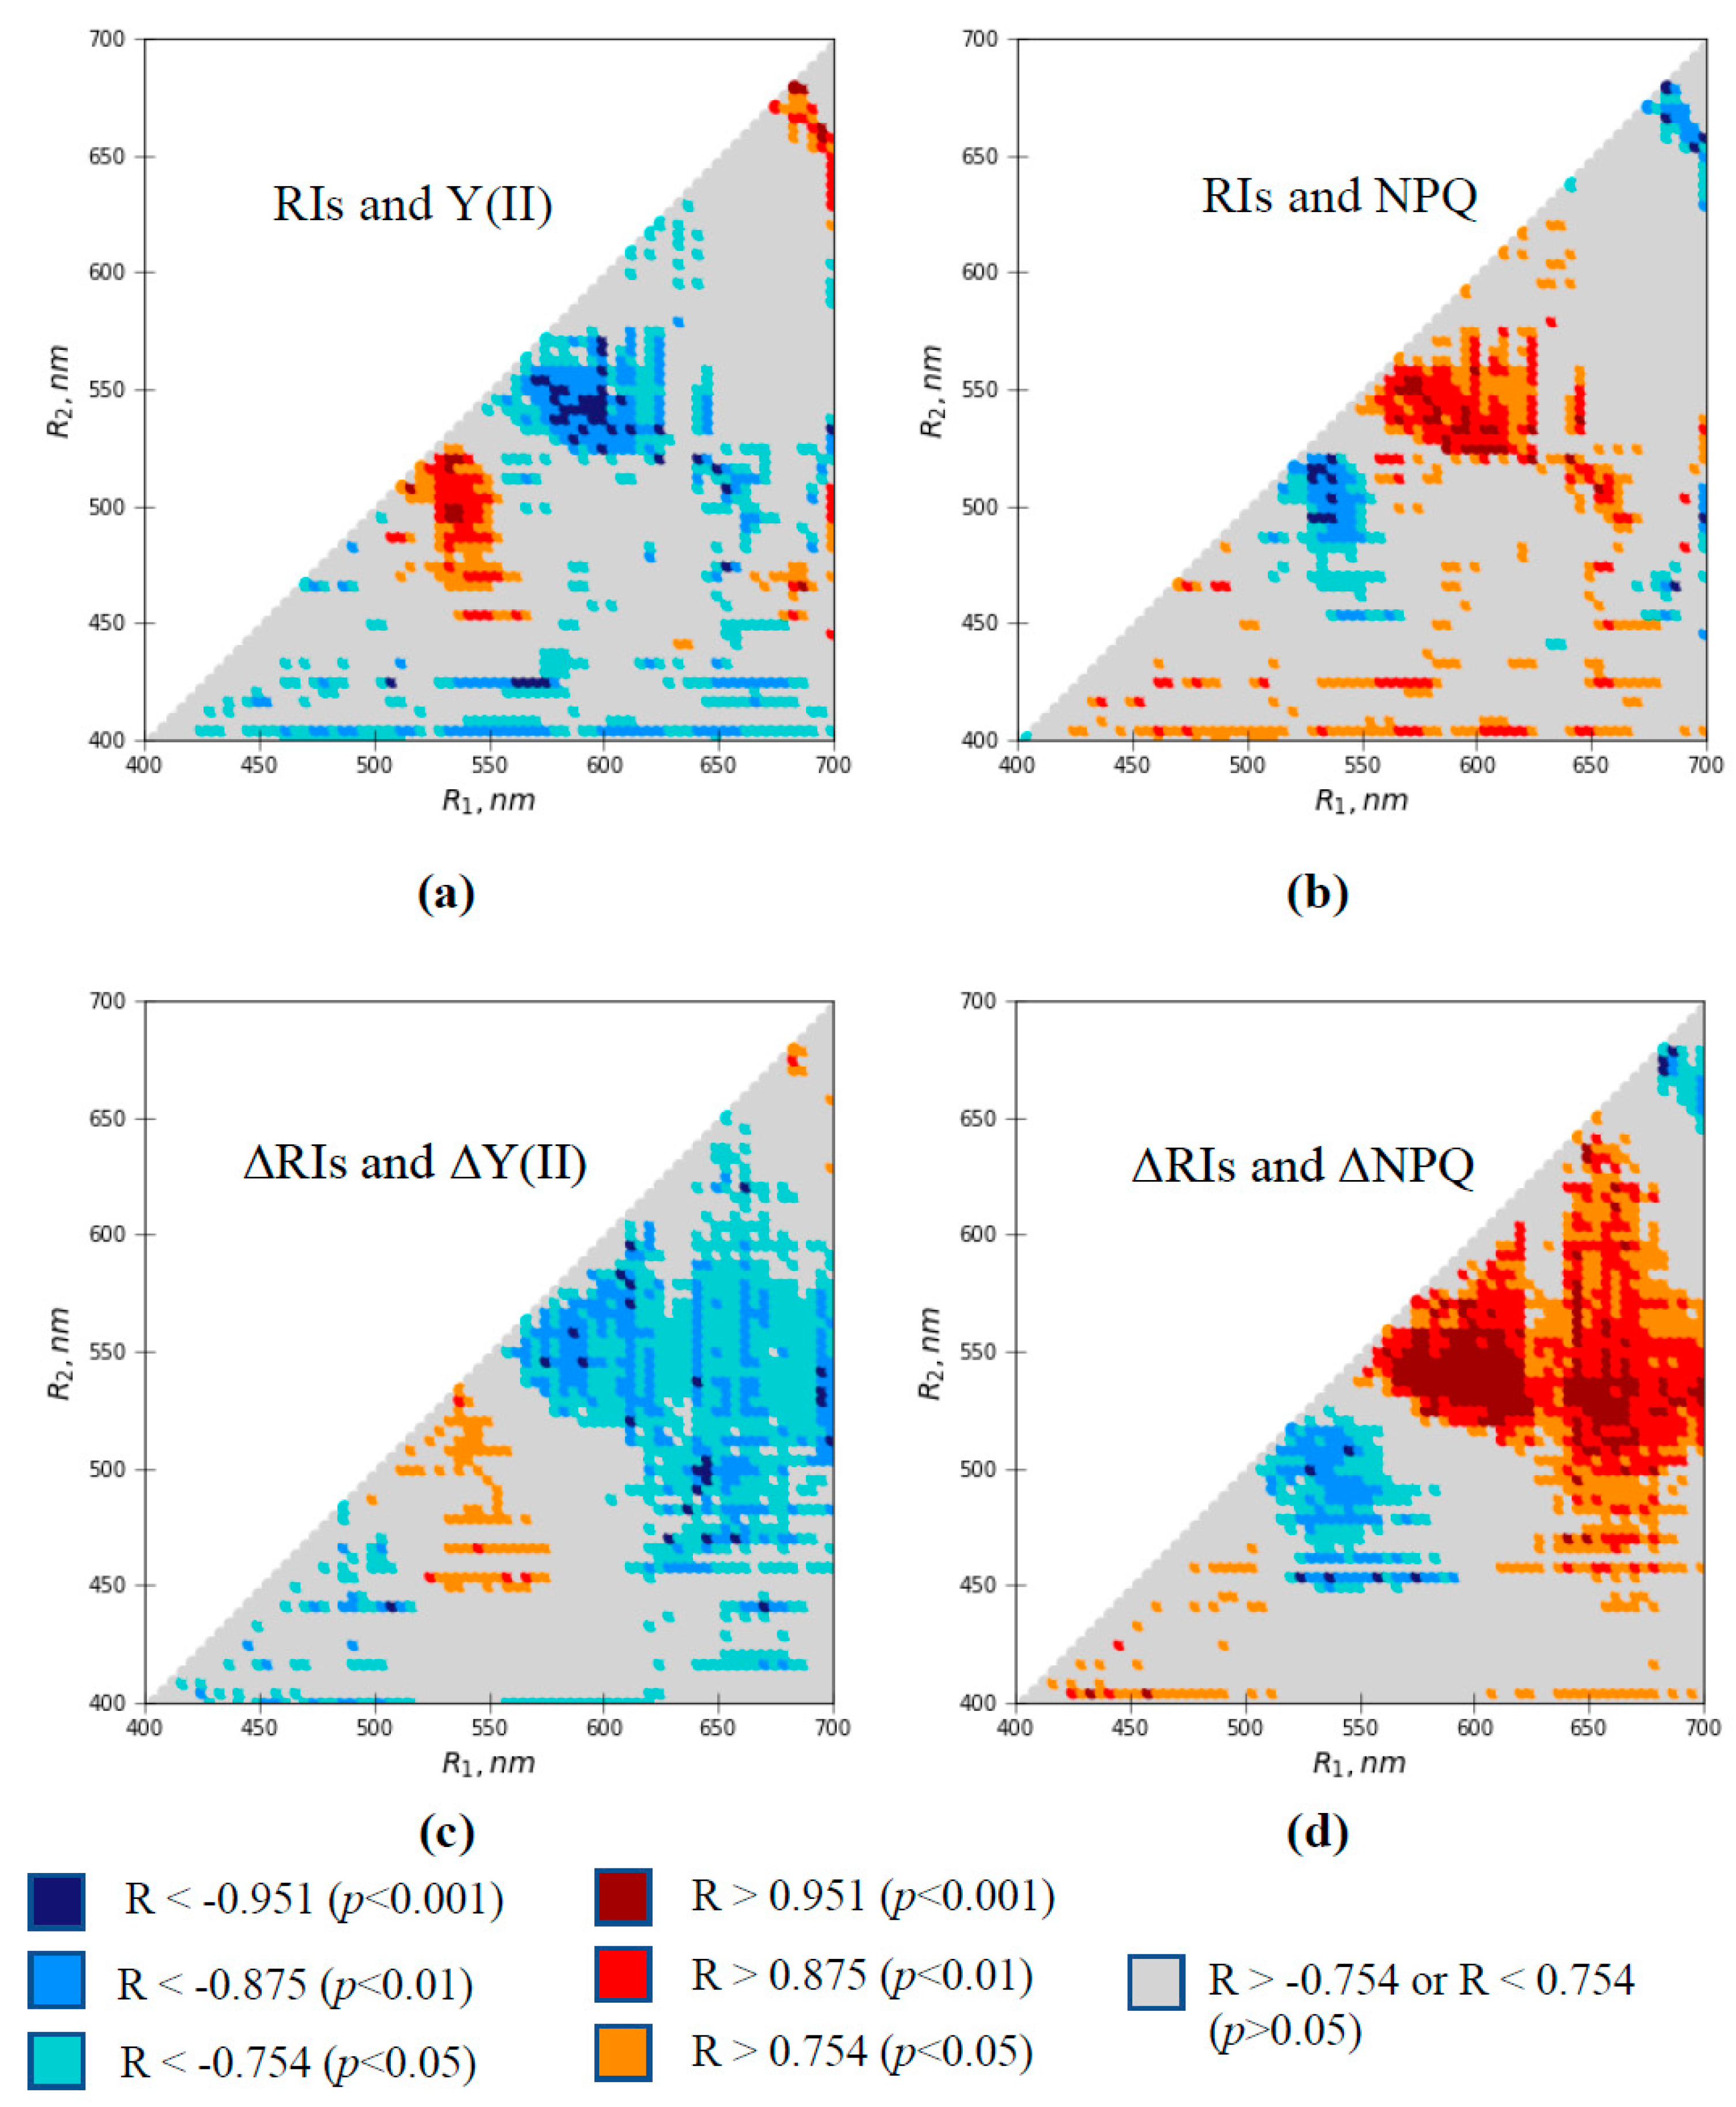
3.2. Relations of Local Burning-Induced Changes in Difference Reflectance Indices to Changes in Photosynthetic Parameters
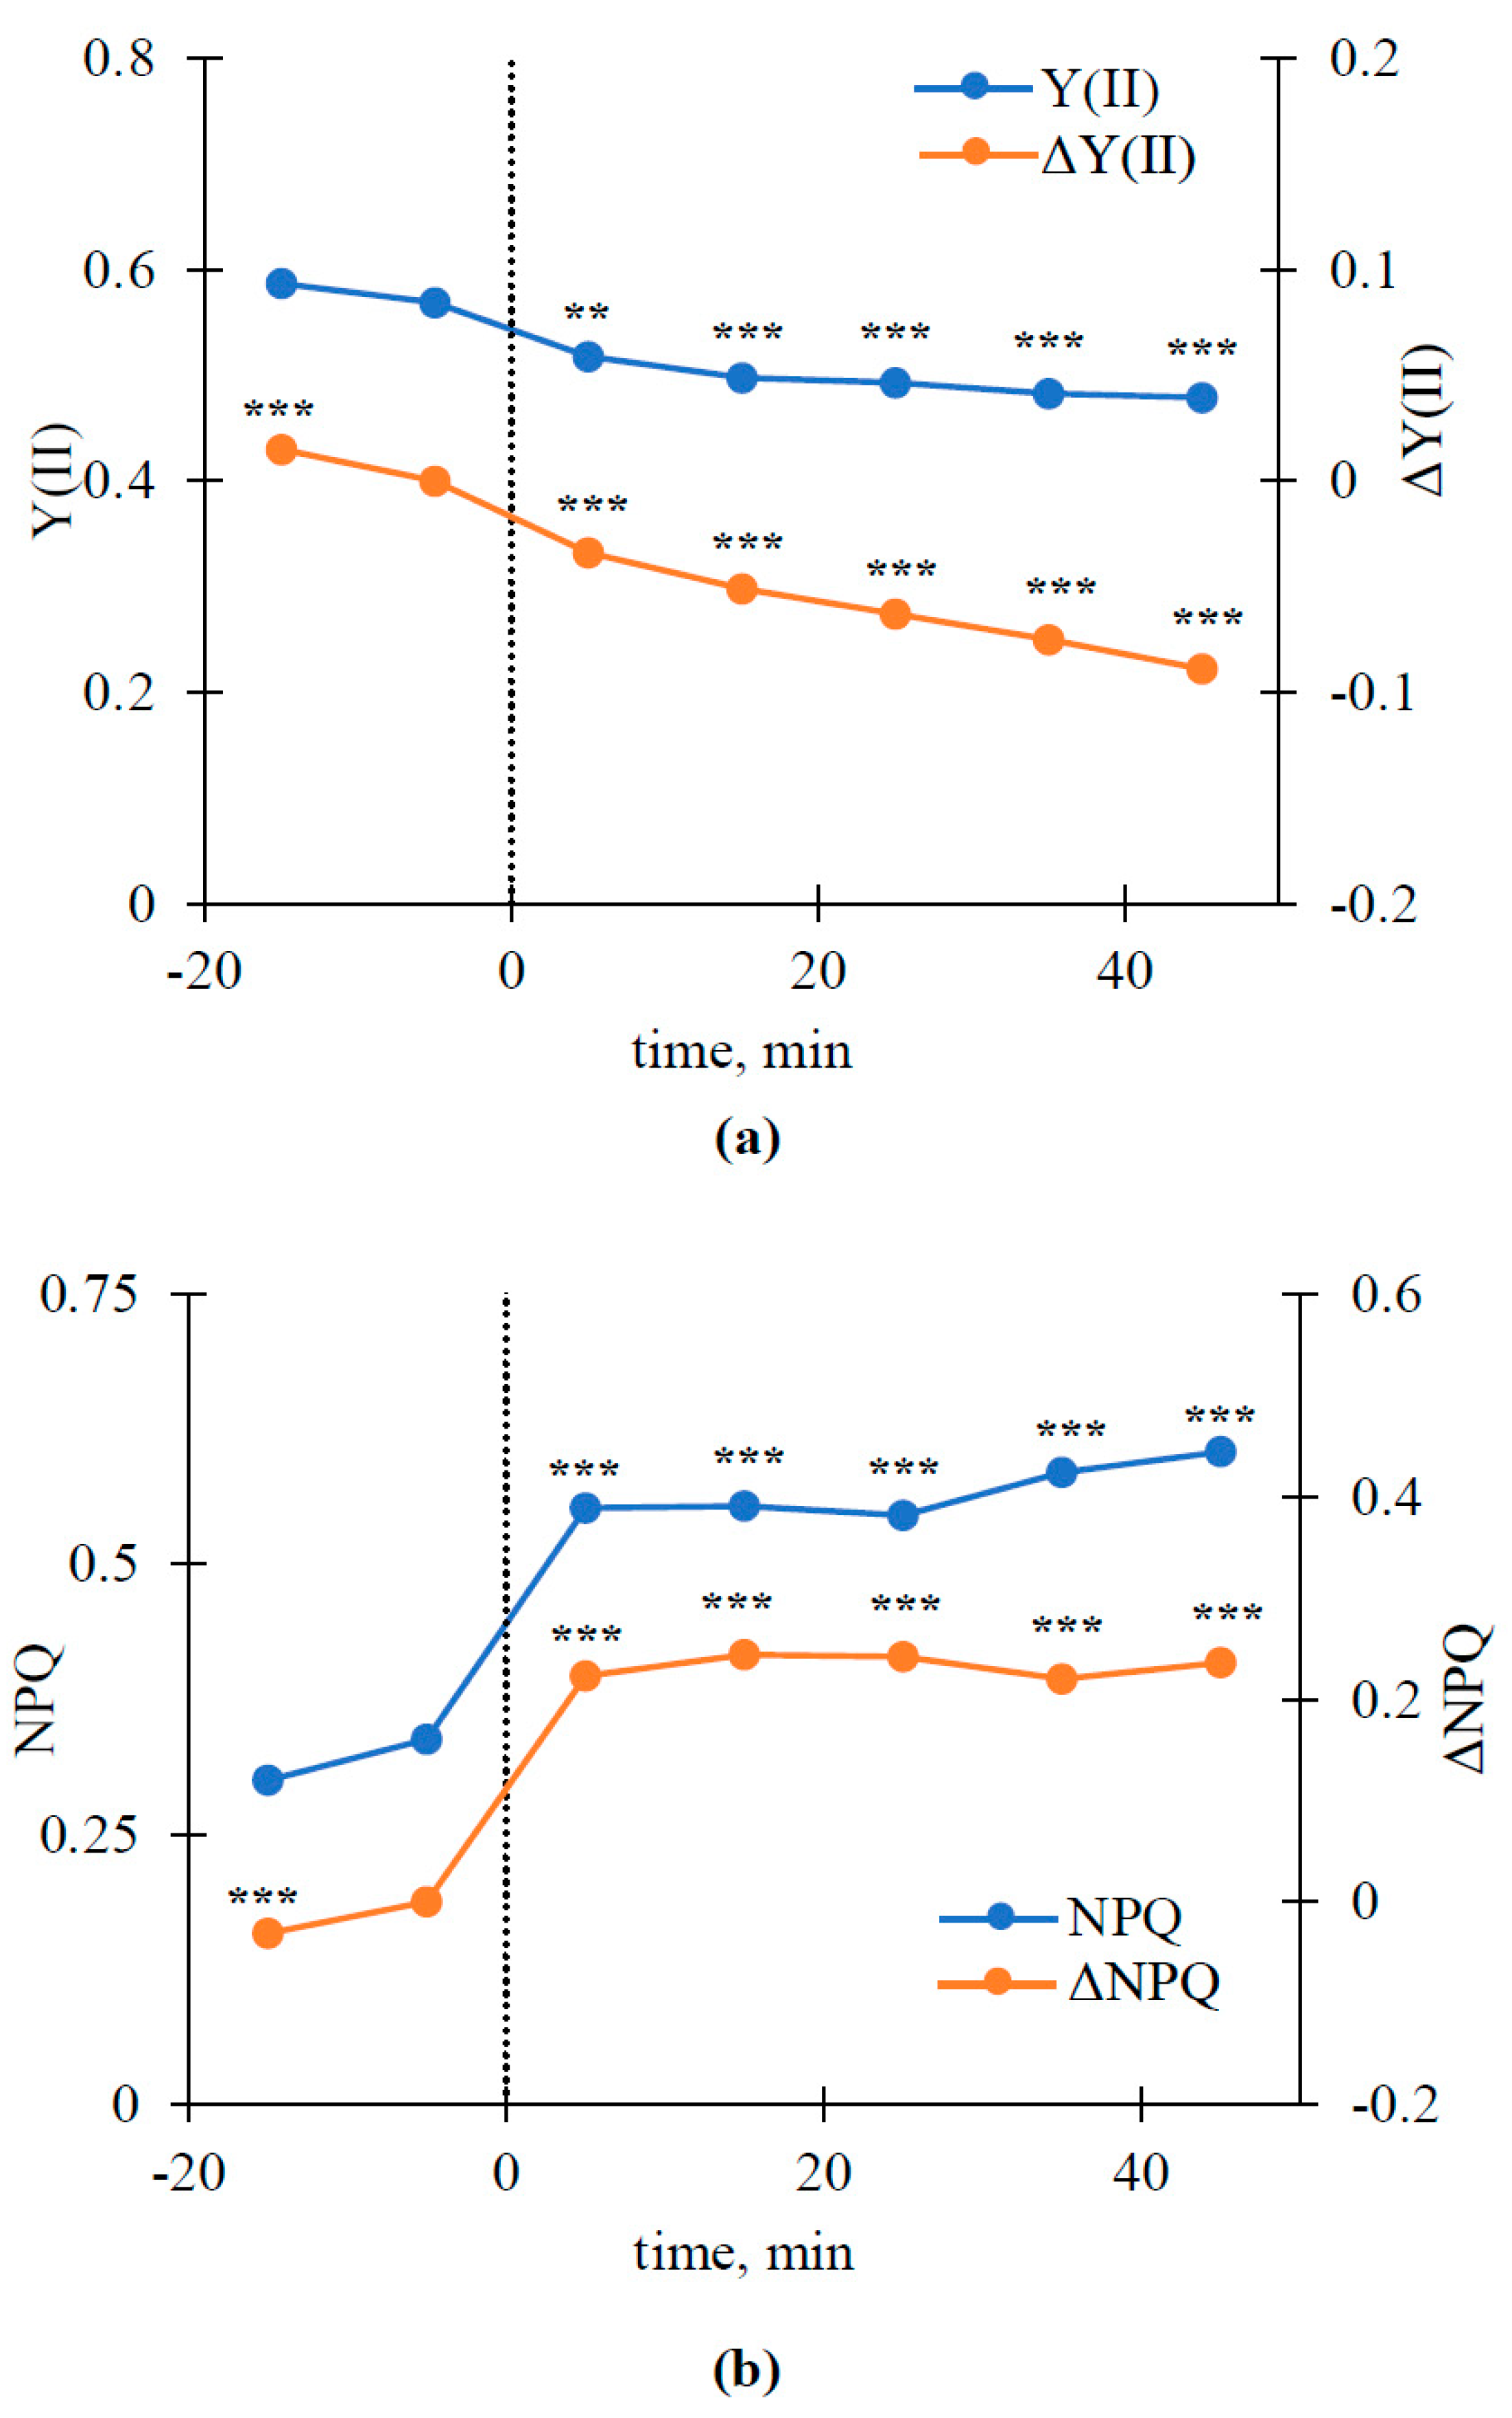
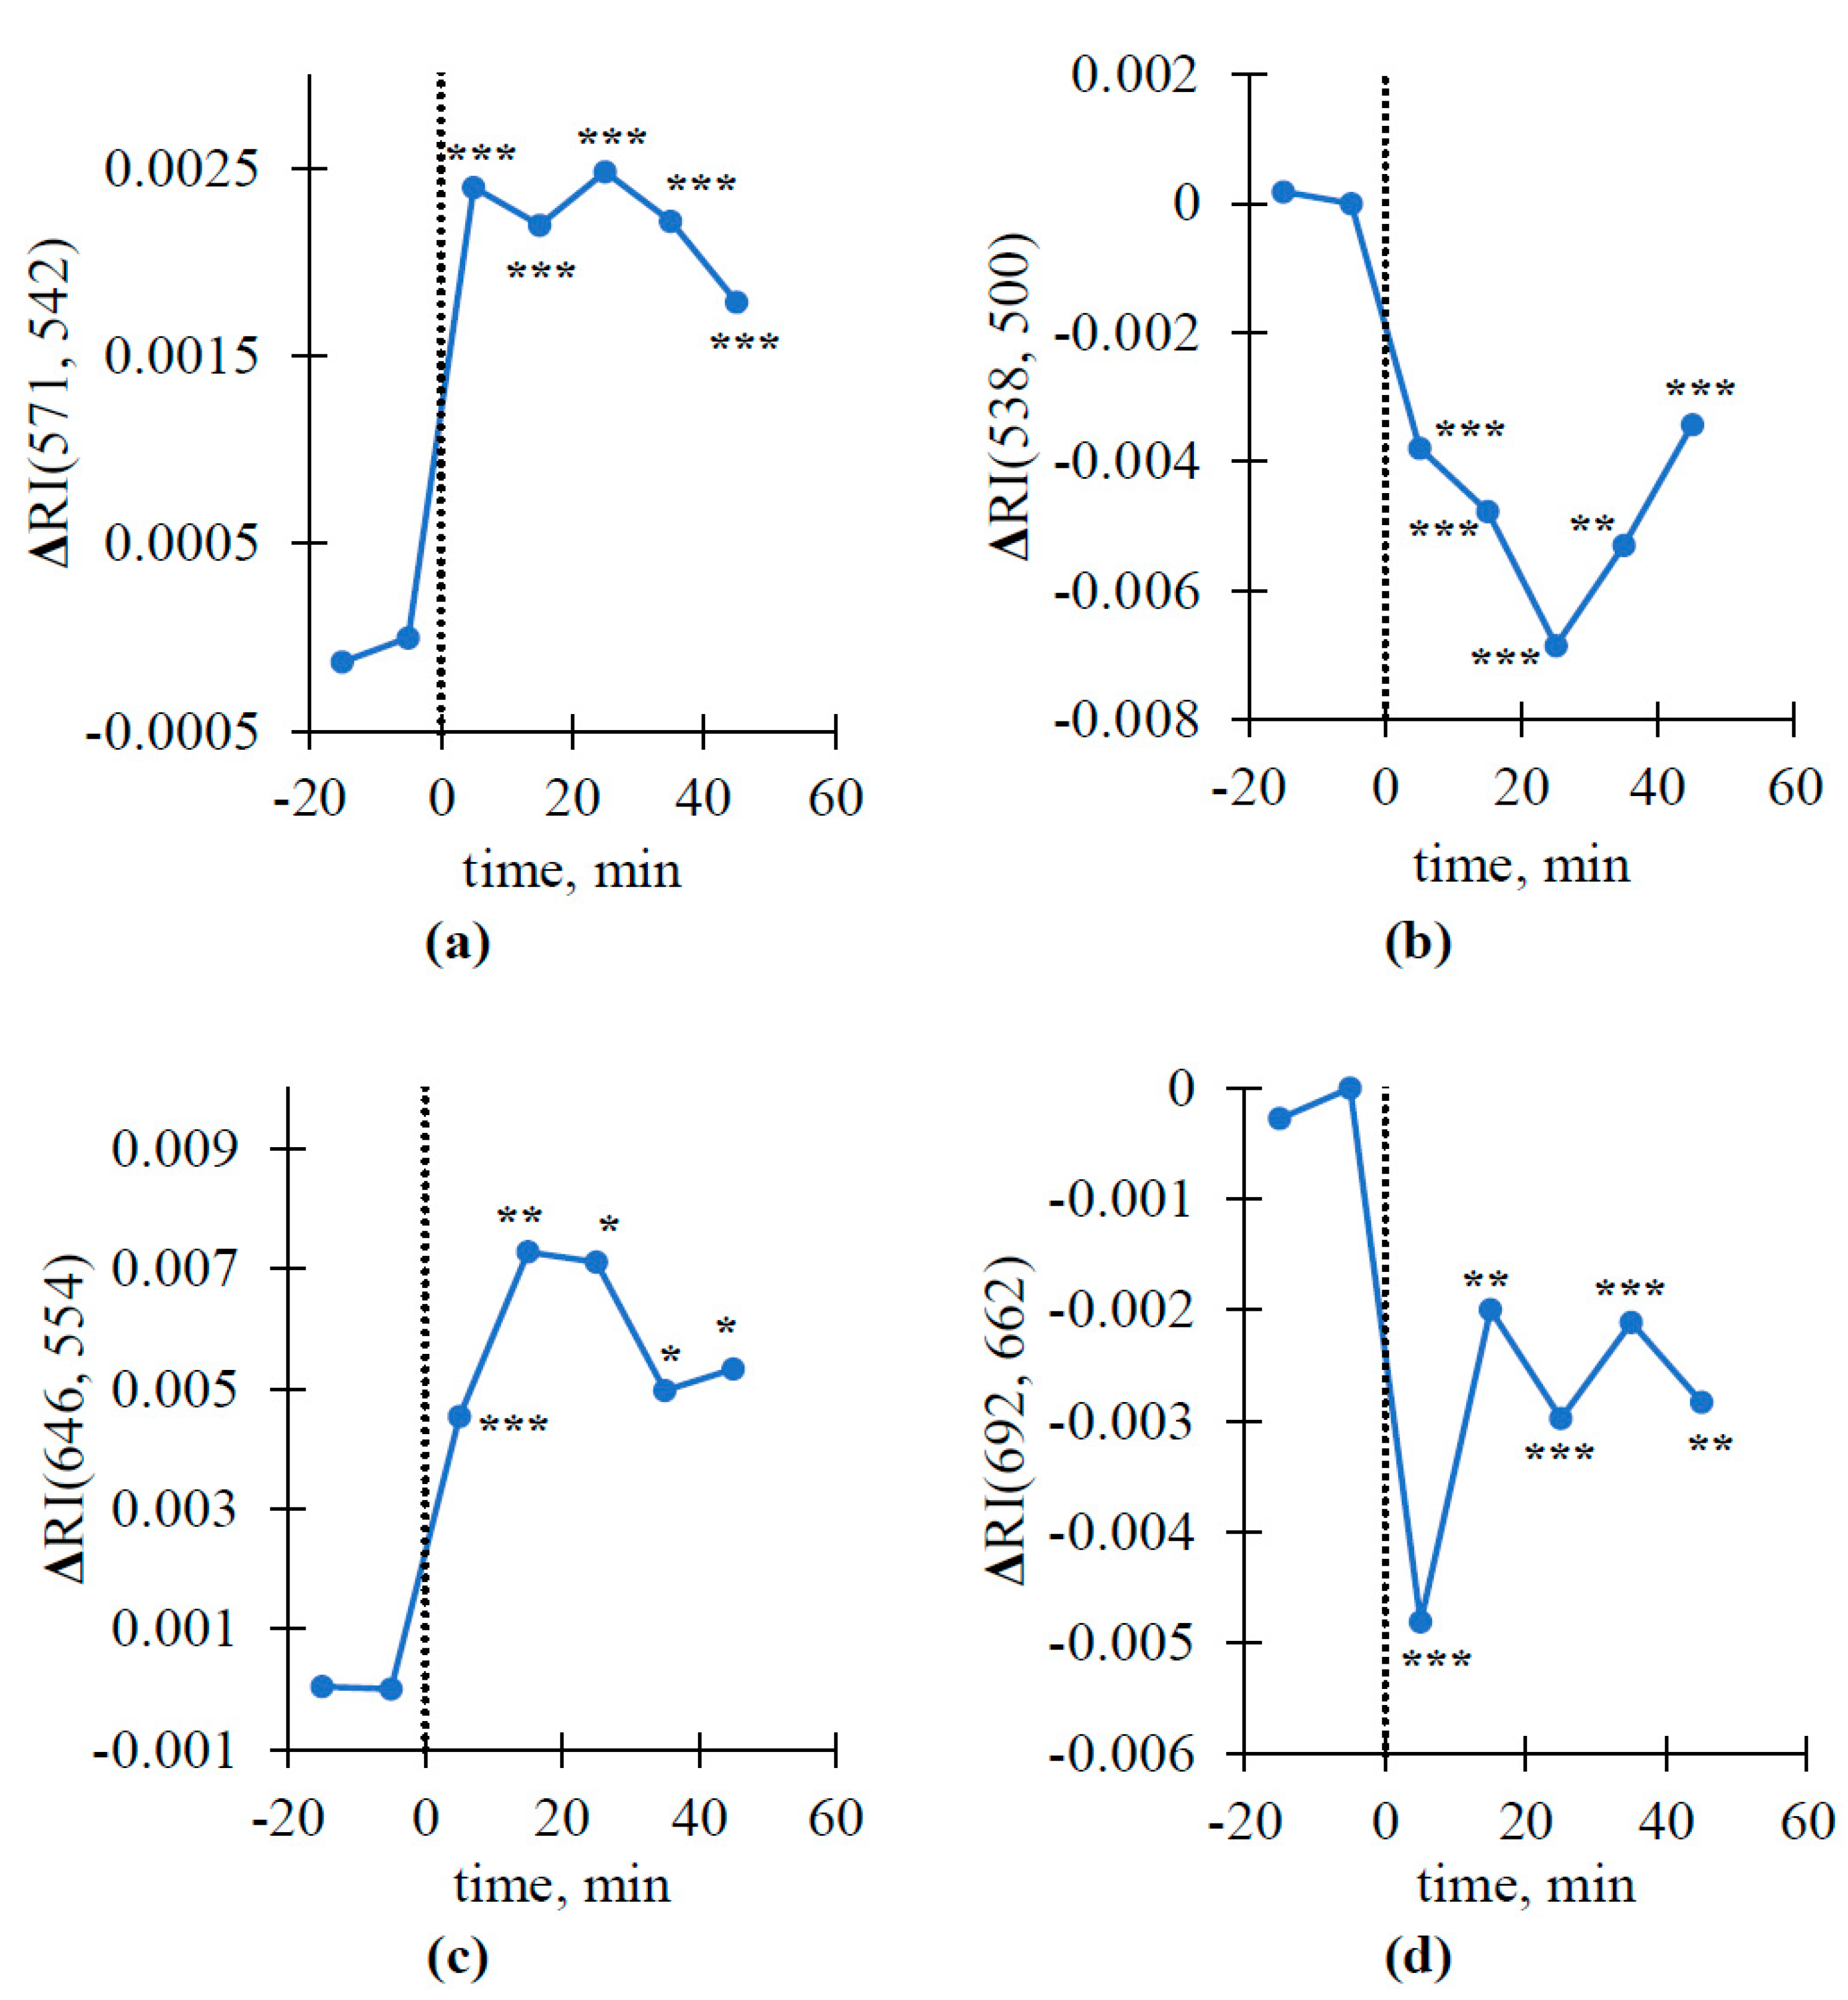
3.3. Dynamics of Local Burning-Induced Changes in Some Revealed Reflectance Indices
4. Discussion
5. Materials and Methods
Author Contributions
Funding
Institutional Review Board Statement
Informed Consent Statement
Data Availability Statement
Conflicts of Interest
References
- Trebacz, K.; Dziubinska, H.; Krol, E. Electrical signals in long-distance communication in plants. In Communication in Plants. Neuronal Aspects of Plant Life; Baluška, F., Mancuso, S., Volkmann, D., Eds.; Springer: Berlin/Heidelberg, Germany; New York, NY, USA, 2006; pp. 277–290. [Google Scholar]
- Fromm, J.; Lautner, S. Electrical signals and their physiological significance in plants. Plant Cell Environ. 2007, 30, 249–257. [Google Scholar] [CrossRef]
- Gallé, A.; Lautner, S.; Flexas, J.; Fromm, J. Environmental stimuli and physiological responses: The current view on electrical signaling. Environ. Exp. Bot. 2015, 114, 15–21. [Google Scholar] [CrossRef]
- Vodeneev, V.; Akinchits, E.; Sukhov, V. Variation potential in higher plants: Mechanisms of generation and propagation. Plant Signal. Behav. 2015, 10, e1057365. [Google Scholar] [CrossRef] [PubMed]
- Sukhov, V. Electrical signals as mechanism of photosynthesis regulation in plants. Photosynth. Res. 2016, 130, 373–387. [Google Scholar] [CrossRef] [PubMed]
- Sukhova, E.; Akinchits, E.; Sukhov, V. Mathematical models of electrical activity in plants. J. Membr. Biol. 2017, 250, 407–423. [Google Scholar] [CrossRef] [PubMed]
- Szechyńska-Hebda, M.; Lewandowska, M.; Karpiński, S. Electrical signaling, photosynthesis and systemic acquired acclimation. Front. Physiol. 2017, 8, 684. [Google Scholar] [CrossRef] [PubMed]
- Sukhov, V.; Sukhova, E.; Vodeneev, V. Long-distance electrical signals as a link between the local action of stressors and the systemic physiological responses in higher plants. Progr. Biophys. Mol. Biol. 2019, 146, 63–84. [Google Scholar] [CrossRef]
- Farmer, E.E.; Gao, Y.Q.; Lenzoni, G.; Wolfender, J.L.; Wu, Q. Wound- and mechanostimulated electrical signals control hormone responses. New Phytol. 2020, 227, 1037–1050. [Google Scholar] [CrossRef]
- Felle, H.H.; Zimmermann, M.R. Systemic signalling in barley through action potentials. Planta 2007, 226, 203–214. [Google Scholar] [CrossRef]
- Zimmermann, M.R.; Maischak, H.; Mithöfer, A.; Boland, W.; Felle, H.H. System potentials, a novel electrical long-distance apoplastic signal in plants, induced by wounding. Plant Physiol. 2009, 149, 1593–1600. [Google Scholar] [CrossRef] [Green Version]
- Zimmermann, M.R.; Mithöfer, A.; Will, T.; Felle, H.H.; Furch, A.C. Herbivore-triggered electrophysiological reactions: Candidates for systemic signals in higher plants and the challenge of their identification. Plant Physiol. 2016, 170, 2407–2419. [Google Scholar] [CrossRef] [Green Version]
- Stahlberg, R.; Cleland, R.E.; van Volkenburgh, E. Slow wave potentials—A propagating electrical signal unique to higher plants. In Communication in Plants. Neuronal Aspects of Plant Life; Baluška, F., Mancuso, S., Volkmann, D., Eds.; Springer: Berlin/Heidelberg, Germany; New York, NY, USA, 2006; pp. 291–308. [Google Scholar]
- Stahlberg, R.; Cosgrove, D.J. The propagation of slow wave potentials in pea epicotyls. Plant Physiol. 1997, 113, 209–217. [Google Scholar] [CrossRef] [PubMed] [Green Version]
- Mancuso, S. Hydraulic and electrical transmission of wound-induced signals in Vitis vinifera. Aust. J. Plant Physiol. 1999, 26, 55–61. [Google Scholar] [CrossRef] [Green Version]
- Sukhova, E.; Akinchits, E.; Gudkov, S.V.; Pishchalnikov, R.Y.; Vodeneev, V.; Sukhov, V. A theoretical analysis of relations between pressure changes along xylem vessels and propagation of variation potential in higher plants. Plants 2021, 10, 372. [Google Scholar] [CrossRef] [PubMed]
- Toyota, M.; Spencer, D.; Sawai-Toyota, S.; Jiaqi, W.; Zhang, T.; Koo, A.J.; Howe, G.A.; Gilroy, S. Glutamate triggers long-distance, calcium-based plant defense signaling. Science 2018, 361, 1112–1115. [Google Scholar] [CrossRef] [PubMed]
- Malone, M. Wound-induced hydraulic signals and stimulus transmission in Mimosa pudica L. New Phytol. 1994, 128, 49–56. [Google Scholar] [CrossRef] [PubMed]
- Evans, M.J.; Morris, R.J. Chemical agents transported by xylem mass flow propagate variation potentials. Plant J. 2017, 91, 1029–1037. [Google Scholar] [CrossRef] [PubMed] [Green Version]
- Vodeneev, V.; Mudrilov, M.; Akinchits, E.; Balalaeva, I.; Sukhov, V. Parameters of electrical signals and photosynthetic responses induced by them in pea seedlings depend on the nature of stimulus. Funct. Plant Biol. 2018, 45, 160–170. [Google Scholar] [CrossRef]
- Blyth, M.G.; Morris, R.J. Shear-enhanced dispersion of a wound substance as a candidate mechanism for variation potential transmission. Front. Plant Sci. 2019, 10, 1393. [Google Scholar] [CrossRef]
- Wildon, D.C.; Thain, J.F.; Minchin, P.E.H.; Gubb, I.R.; Reilly, A.J.; Skipper, Y.D.; Doherty, H.M.; O’Donnell, P.J.; Bowles, D. Electrical signalling and systemic proteinase inhibitor Induction in the wounded plant. Nature 1992, 360, 62–65. [Google Scholar] [CrossRef]
- Peña-Cortés, H.; Fisahn, J.; Willmitzer, L. Signals involved in wound-induced proteinase inhibitor II gene expression in tomato and potato plants. Proc. Natl. Acad. Sci. USA 1995, 92, 4106–4113. [Google Scholar] [CrossRef] [Green Version]
- Stanković, B.; Davies, E. Both action potentials and variation potentials induce proteinase inhibitor gene expression in tomato. FEBS Lett. 1996, 390, 275–279. [Google Scholar] [CrossRef] [Green Version]
- Mousavi, S.A.; Chauvin, A.; Pascaud, F.; Kellenberger, S.; Farmer, E.E. GLUTAMATE RECEPTOR-LIKE genes mediate leaf-to-leaf wound signalling. Nature 2013, 500, 422–426. [Google Scholar] [CrossRef] [Green Version]
- Filek, M.; Kościelniak, J. The effect of wounding the roots by high temperature on the respiration rate of the shoot and propagation of electric signal in horse bean seedlings (Vicia faba L. minor). Plant Sci. 1997, 123, 39–46. [Google Scholar] [CrossRef]
- Pavlovič, A.; Slováková, L.; Pandolfi, C.; Mancuso, S. On the mechanism underlying photosynthetic limitation upon trigger hair irritation in the carnivorous plant Venus flytrap (Dionaea muscipula Ellis). J. Exp. Bot. 2011, 62, 1991–2000. [Google Scholar] [CrossRef]
- Surova, L.; Sherstneva, O.; Vodeneev, V.; Katicheva, L.; Semina, M.; Sukhov, V. Variation potential-induced photosynthetic and respiratory changes increase ATP content in pea leaves. J. Plant Physiol. 2016, 202, 57–64. [Google Scholar] [CrossRef] [PubMed]
- Lautner, S.; Stummer, M.; Matyssek, R.; Fromm, J.; Grams, T.E.E. Involvement of respiratory processes in the transient knockout of net CO2 uptake in Mimosa pudica upon heat stimulation. Plant Cell Environ. 2014, 37, 254–260. [Google Scholar] [CrossRef]
- Hlavácková, V.; Krchnák, P.; Naus, J.; Novák, O.; Spundová, M.; Strnad, M. Electrical and chemical signals involved in short-term systemic photosynthetic responses of tobacco plants to local burning. Planta 2006, 225, 235–244. [Google Scholar] [CrossRef] [PubMed]
- Krausko, M.; Perutka, Z.; Šebela, M.; Šamajová, O.; Šamaj, J.; Novák, O.; Pavlovič, A. The role of electrical and jasmonate signalling in the recognition of captured prey in the carnivorous sundew plant Drosera capensis. New Phytol. 2017, 213, 1818–1835. [Google Scholar] [CrossRef] [PubMed] [Green Version]
- Pavlovič, A.; Mithöfer, A. Jasmonate signalling in carnivorous plants: Copycat of plant defence mechanisms. J. Exp. Bot. 2019, 70, 3379–3389. [Google Scholar] [CrossRef]
- Fromm, J. Control of phloem unloading by action potentials in Mimosa. Physiol. Plant 1991, 83, 529–533. [Google Scholar] [CrossRef]
- Furch, A.C.; van Bel, A.J.; Fricker, M.D.; Felle, H.H.; Fuchs, M.; Hafke, J.B. Sieve element Ca2+ channels as relay stations between remote stimuli and sieve tube occlusion in Vicia faba. Plant Cell. 2009, 21, 2118–2132. [Google Scholar] [CrossRef] [Green Version]
- Furch, A.C.; Zimmermann, M.R.; Will, T.; Hafke, J.B.; van Bel, A.J. Remote-controlled stop of phloem mass flow by biphasic occlusion in Cucurbita maxima. J. Exp. Bot. 2010, 61, 3697–3708. [Google Scholar] [CrossRef] [PubMed]
- Shiina, T.; Tazawa, M. Action potential in Luffa cylindrica and its effects on elongation growth. Plant Cell Physiol. 1986, 27, 1081–1089. [Google Scholar]
- Krupenina, N.A.; Bulychev, A.A. Action potential in a plant cell lowers the light requirement for non-photochemical energy-dependent quenching of chlorophyll fluorescence. Biochim. Biophys. Acta 2007, 1767, 781–788. [Google Scholar] [CrossRef] [PubMed] [Green Version]
- Grams, T.E.; Lautner, S.; Felle, H.H.; Matyssek, R.; Fromm, J. Heat-induced electrical signals affect cytoplasmic and apoplastic pH as well as photosynthesis during propagation through the maize leaf. Plant Cell Environ. 2009, 32, 319–326. [Google Scholar] [CrossRef]
- Sukhov, V.; Sherstneva, O.; Surova, L.; Katicheva, L.; Vodeneev, V. Proton cellular influx as a probable mechanism of variation potential influence on photosynthesis in pea. Plant Cell Environ. 2014, 37, 2532–2541. [Google Scholar] [CrossRef]
- Gallé, A.; Lautner, S.; Flexas, J.; Ribas-Carbo, M.; Hanson, D.; Roesgen, J.; Fromm, J. Photosynthetic responses of soybean (Glycine max L.) to heat-induced electrical signalling are predominantly governed by modifications of mesophyll conductance for CO2. Plant Cell Environ. 2013, 36, 542–552. [Google Scholar] [CrossRef]
- Vuralhan-Eckert, J.; Lautner, S.; Fromm, J. Effect of simultaneously induced environmental stimuli on electrical signalling and gas exchange in maize plants. J. Plant Physiol. 2018, 223, 32–36. [Google Scholar] [CrossRef]
- Yudina, L.; Sukhova, E.; Sherstneva, O.; Grinberg, M.; Ladeynova, M.; Vodeneev, V.; Sukhov, V. Exogenous abscisic acid can influence photosynthetic processes in peas through a decrease in activity of H+-ATPase in the plasma membrane. Biology 2020, 9, 324. [Google Scholar] [CrossRef]
- Yudina, L.; Sherstneva, O.; Sukhova, E.; Grinberg, M.; Mysyagin, S.; Vodeneev, V.; Sukhov, V. Inactivation of H+-ATPase participates in the influence of variation potential on photosynthesis and respiration in peas. Plants 2020, 9, 1585. [Google Scholar] [CrossRef]
- Sukhov, V.; Surova, L.; Sherstneva, O.; Katicheva, L.; Vodeneev, V. Variation potential influence on photosynthetic cyclic electron flow in pea. Front. Plant Sci. 2015, 5, 766. [Google Scholar] [CrossRef] [Green Version]
- Sukhova, E.; Mudrilov, M.; Vodeneev, V.; Sukhov, V. Influence of the variation potential on photosynthetic flows of light energy and electrons in pea. Photosynth. Res. 2018, 136, 215–228. [Google Scholar] [CrossRef] [PubMed]
- Retivin, V.G.; Opritov, V.A.; Fedulina, S.B. Generation of action potential induces preadaptation of Cucurbita pepo L. stem tissues to freezing injury. Russ. J. Plant Physiol. 1997, 44, 432–442. [Google Scholar]
- Retivin, V.G.; Opritov, V.A.; Lobov, S.A.; Tarakanov, S.A.; Khudyakov, V.A. Changes in the resistance of photosynthesizing cotyledon cells of pumpkin seedlings to cooling and heating, as induced by the stimulation of the root system with KCl solution. Russ. J. Plant Physiol. 1999, 46, 689–696. [Google Scholar]
- Sukhov, V.; Surova, L.; Sherstneva, O.; Vodeneev, V. Influence of variation potential on resistance of the photosynthetic machinery to heating in pea. Physiol. Plant 2014, 152, 773–783. [Google Scholar] [CrossRef]
- Sukhov, V.; Surova, L.; Sherstneva, O.; Bushueva, A.; Vodeneev, V. Variation potential induces decreased PSI damage and increased PSII damage under high external temperatures in pea. Funct. Plant Biol. 2015, 42, 727–736. [Google Scholar] [CrossRef]
- Surova, L.; Sherstneva, O.; Vodeneev, V.; Sukhov, V. Variation potential propagation decreases heat-related damage of pea photosystem I by 2 different pathways. Plant Sign. Behav. 2016, 11, e1145334. [Google Scholar] [CrossRef] [Green Version]
- Sukhov, V.; Gaspirovich, V.; Mysyagin, S.; Vodeneev, V. High-temperature tolerance of photosynthesis can be linked to local electrical responses in leaves of pea. Front. Physiol. 2017, 8, 763. [Google Scholar] [CrossRef]
- Suzuki, N.; Miller, G.; Salazar, C.; Mondal, H.A.; Shulaev, E.; Cortes, D.F.; Shuman, J.L.; Luo, X.; Shah, J.; Schlauch, K.; et al. Temporal-spatial interaction between reactive oxygen species and abscisic acid regulates rapid systemic acclimation in plants. Plant Cell. 2013, 25, 3553–3569. [Google Scholar] [CrossRef] [Green Version]
- Souza, G.M.; Ferreira, A.S.; Saraiva, G.F.; Toledo, G.R. Plant “electrome” can be pushed toward a self-organized critical state by external cues: Evidences from a study with soybean seedlings subject to different environmental conditions. Plant Signal Behav. 2017, 12, e1290040. [Google Scholar] [CrossRef] [PubMed] [Green Version]
- Saraiva, G.F.R.; Ferreira, A.S.; Souza, G.M. Osmotic stress decreases complexity underlying the electrophysiological dynamic in soybean. Plant Biol. 2017, 19, 702–708. [Google Scholar] [CrossRef]
- Debono, M.W.; Souza, G.M. Plants as electromic plastic interfaces: A mesological approach. Prog. Biophys. Mol. Biol. 2019, 146, 123–133. [Google Scholar] [CrossRef] [PubMed]
- Simmi, F.Z.; Dallagnol, L.J.; Ferreira, A.S.; Pereira, D.R.; Souza, G.M. Electrome alterations in a plant-pathogen system: Toward early diagnosis. Bioelectrochemistry 2020, 133, 107493. [Google Scholar] [CrossRef] [PubMed]
- Parise, A.G.; Reissig, G.N.; Basso, L.F.; Senko, L.G.S.; Oliveira, T.F.C.; de Toledo, G.R.A.; Ferreira, A.S.; Souza, G.M. Detection of different hosts from a distance alters the behaviour and bioelectrical activity of Cuscuta racemosa. Front. Plant Sci. 2021, 12, 594195. [Google Scholar] [CrossRef] [PubMed]
- Chatterjee, S.K.; Ghosh, S.; Das, S.; Manzella, V.; Vitaletti, A.; Masi, E.; Santopolo, L.; Mancuso, S.; Maharatna, K. Forward and inverse modelling approaches for prediction of light stimulus from electrophysiological response in plants. Measurement 2014, 53, 101–116. [Google Scholar] [CrossRef] [Green Version]
- Chatterjee, S.K.; Das, S.; Maharatna, K.; Masi, E.; Santopolo, L.; Mancuso, S.; Vitaletti, A. Exploring strategies for classification of external stimuli using statistical features of the plant electrical response. J. R. Soc. Interface 2015, 12, 20141225. [Google Scholar] [CrossRef]
- Chen, Y.; Zhao, D.-J.; Wang, Z.-Y.; Wang, Z.-Y.; Tang, G.; Huang, L. Plant electrical signal classification based on waveform similarity. Algorithms 2016, 9, 70. [Google Scholar] [CrossRef]
- Chatterjee, S.K.; Malik, O.; Gupta, S. Chemical sensing employing plant electrical signal response-classification of stimuli using curve fitting coefficients as features. Biosensors 2018, 8, 83. [Google Scholar] [CrossRef] [Green Version]
- Qin, X.-H.; Wang, Z.-Y.; Yao, J.-P.; Zhou, Q.; Zhao, P.-F.; Wang, Z.-Y.; Huang, L. Using a one-dimensional convolutional neural network with a conditional generative adversarial network to classify plant electrical signals. Comp. Electron. Agric. 2020, 174, 105464. [Google Scholar] [CrossRef]
- Sukhova, E.; Yudina, L.; Akinchits, E.; Vodeneev, V.; Sukhov, V. Influence of electrical signals on pea leaf reflectance in the 400-800-nm range. Plant Signal. Behav. 2019, 14, 1610301. [Google Scholar] [CrossRef]
- Sukhova, E.; Yudina, L.; Gromova, E.; Nerush, V.; Vodeneev, V.; Sukhov, V. Burning-induced electrical signals influence broadband reflectance indices and water index in pea leaves. Plant Signal. Behav. 2020, 15, 1737786. [Google Scholar] [CrossRef]
- Sukhov, V.; Sukhova, E.; Gromova, E.; Surova, L.; Nerush, V.; Vodeneev, V. The electrical signal-induced systemic photosynthetic response is accompanied by changes in the photochemical reflectance index in pea. Func. Plant Biol. 2019, 46, 328–338. [Google Scholar] [CrossRef] [PubMed]
- Gamon, J.A.; Peñuelas, J.; Field, C.B. A narrow-waveband spectral index that tracks diurnal changes in photosynthetic efficiency. Remote Sens. Environ. 1992, 41, 35–44. [Google Scholar] [CrossRef]
- Filella, I.; Amaro, T.; Araus, J.L.; Peñuelas, J. Relationship between photosynthetic radiation-use efficiency of barley canopies and the photochemical reflectance index (PRI). Physiol. Plant. 1996, 96, 211–216. [Google Scholar] [CrossRef]
- Gamon, J.A.; Serrano, L.; Surfus, J.S. The photochemical reflectance index: An optical indicator of photosynthetic radiation use efficiency across species, functional types, and nutrient levels. Oecologia 1997, 112, 492–501. [Google Scholar] [CrossRef] [PubMed]
- Garbulsky, M.F.; Peñuelas, J.; Gamon, J.; Inoue, Y.; Filella, I. The photochemical reflectance index (PRI) and the remote sensing of leaf, canopy and ecosystem radiation use efficiencies. A review and meta-analysis. Remote Sens. Environ. 2011, 115, 281–297. [Google Scholar] [CrossRef]
- Peñuelas, J.; Garbulsky, M.F.; Filella, I. Photochemical reflectance index (PRI) and remote sensing of plant CO₂ uptake. New Phytol. 2011, 191, 596–599. [Google Scholar] [CrossRef]
- Porcar-Castell, A.; Garcia-Plazaola, J.I.; Nichol, C.J.; Kolari, P.; Olascoaga, B.; Kuusinen, N.; Fernández-Marín, B.; Pulkkinen, M.; Juurola, E.; Nikinmaa, E. Physiology of the seasonal relationship between the photochemical reflectance index and photosynthetic light use efficiency. Oecologia 2012, 170, 313–323. [Google Scholar] [CrossRef]
- Zhang, C.; Filella, I.; Garbulsky, M.F.; Peñuelas, J. Affecting factors and recent improvements of the photochemical reflectance index (PRI) for remotely sensing foliar, canopy and ecosystemic radiation-use efficiencies. Remote Sens. 2016, 8, 677. [Google Scholar] [CrossRef] [Green Version]
- Sukhova, E.; Sukhov, V. Connection of the photochemical reflectance index (PRI) with the photosystem II quantum yield and nonphotochemical quenching can be dependent on variations of photosynthetic parameters among investigated plants: A meta-analysis. Remote Sens. 2018, 10, 771. [Google Scholar] [CrossRef] [Green Version]
- Kováč, D.; Veselá, B.; Klem, K.; Večeřová, K.; Kmecová, Z.M.; Peñuelas, J.; Urban, O. Correction of PRI for carotenoid pigment pools improves photosynthesis estimation across different irradiance and temperature conditions. Remote Sens. Environ. 2020, 244, 111834. [Google Scholar] [CrossRef]
- Evain, S.; Flexas, J.; Moya, I. A new instrument for passive remote sensing: 2. Measurement of leaf and canopy reflectance changes at 531 nm and their relationship with photosynthesis and chlorophyll fluorescence. Remote Sens. Environ. 2004, 91, 175–185. [Google Scholar] [CrossRef]
- Sukhova, E.; Sukhov, V. Analysis of light-induced changes in the photochemical reflectance index (PRI) in leaves of pea, wheat, and pumpkin using pulses of green-yellow measuring light. Remote Sens. 2019, 11, 810. [Google Scholar] [CrossRef] [Green Version]
- Sukhova, E.; Sukhov, V. Relation of photochemical reflectance indices based on different wavelengths to the parameters of light reactions in photosystems I and II in pea plants. Remote Sens. 2020, 12, 1312. [Google Scholar] [CrossRef] [Green Version]
- Van Wittenberghe, S.; Laparra, V.; García-Plazaola, J.I.; Fernández-Marín, B.; Porcar-Castell, A.; Moreno, J. Combined dynamics of the 500-600 nm leaf absorption and chlorophyll fluorescence changes in vivo: Evidence for the multifunctional energy quenching role of xanthophylls. Biochim. Biophys. Acta Bioenergy 2021, 1862, 148351. [Google Scholar] [CrossRef]
- Sukhov, V.; Surova, L.; Morozova, E.; Sherstneva, O.; Vodeneev, V. Changes in H+-ATP synthase activity, proton electrochemical gradient, and pH in pea chloroplast can be connected with variation potential. Front Plant Sci. 2016, 7, 1092. [Google Scholar] [CrossRef] [Green Version]
- Balzarolo, M.; Peñuelas, J.; Filella, I.; Portillo-Estrada, M.; Ceulemans, R. Assessing ecosystem isoprene emissions by hyperspectral remote sensing. Remote Sens. 2018, 10, 1086. [Google Scholar] [CrossRef] [Green Version]
- Sytar, O.; Brücková, K.; Kovár, M.; Živčák, M.; Hemmerich, I.; Brestič, M. Nondestructive detection and biochemical quantification of buckwheat leaves using visible (VIS) and near-infrared (NIR) hyperspectral reflectance imaging. J. Centr. Eur. Agric. 2017, 18, 864–878. [Google Scholar] [CrossRef] [Green Version]
- Sun, H.; Feng, M.; Xiao, L.; Yang, W.; Wang, C.; Jia, X.; Zhao, Y.; Zhao, C.; Muhammad, S.K.; Li, D. Assessment of plant water status in winter wheat (Triticum aestivum L.) based on canopy spectral indices. PLoS ONE 2019, 14, e0216890. [Google Scholar] [CrossRef] [PubMed]
- Sukhova, E.; Yudina, L.; Gromova, E.; Ryabkova, A.; Kior, D.; Sukhov, V. Complex analysis of the efficiency of difference reflectance indices on the basis of 400–700 nm wavelengths for revealing the influences of water shortage and heating on plant seedlings. Remote Sens. 2021, 13, 962. [Google Scholar] [CrossRef]
- Ibaraki, Y.; Dutta Gupta, S. Nondestructive evaluation of the photosynthetic properties of micropropagated plantlets by imaging photochemical reflectance index under low light intensity. In Vitro Cell. Dev. Biol. Plant. 2010, 46, 530–536. [Google Scholar] [CrossRef]
- Yudina, L.; Sukhova, E.; Gromova, E.; Nerush, V.; Vodeneev, V.; Sukhov, V. A light-induced decrease in the photochemical reflectance index (PRI) can be used to estimate the energy-dependent component of non-photochemical quenching under heat stress and soil drought in pea, wheat, and pumpkin. Photosynth. Res. 2020, 146, 175–187. [Google Scholar] [CrossRef] [PubMed]
- Kováč, D.; Veselovská, P.; Klem, K.; Večeřová, K.; Ač, A.; Peñuelas, J.; Urban, O. Potential of photochemical reflectance index for indicating photochemistry and light use efficiency in leaves of European beech and Norway spruce trees. Remote Sens. 2018, 10, 1202. [Google Scholar] [CrossRef] [Green Version]
- Białasek, M.; Górecka, M.; Mittler, R.; Karpiński, S. Evidence for the Involvement of electrical, calcium and ROS signaling in the systemic regulation of non-photochemical quenching and photosynthesis. Plant Cell Physiol. 2017, 58, 207–215. [Google Scholar] [CrossRef] [PubMed]
- Porcar-Castell, A.; Tyystjärvi, E.; Atherton, J.; van der Tol, C.; Flexas, J.; Pfündel, E.E.; Moreno, J.; Frankenberg, C.; Berry, J.A. Linking chlorophyll a fluorescence to photosynthesis for remote sensing applications: Mechanisms and challenges. J. Exp. Bot. 2014, 65, 4065–4095. [Google Scholar] [CrossRef]
- Kohzuma, K.; Hikosaka, K. Physiological validation of photochemical reflectance index (PRI) as a photosynthetic parameter using Arabidopsis thaliana mutants. Biochem. Biophys. Res. Commun. 2018, 498, 52–57. [Google Scholar] [CrossRef]
- Murakami, K.; Ibaraki, Y. Time course of the photochemical reflectance index during photosynthetic induction: Its relationship with the photochemical yield of photosystem II. Physiol. Plant. 2019, 165, 524–536. [Google Scholar] [CrossRef]
- Müller, P.; Li, X.P.; Niyogi, K.K. Non-photochemical quenching. A response to excess light energy. Plant Physiol. 2001, 125, 1558–1566. [Google Scholar] [CrossRef] [Green Version]
- Ruban, A.V. Nonphotochemical chlorophyll fluorescence quenching: Mechanism and effectiveness in protecting plants from photodamage. Plant Physiol. 2016, 170, 1903–1916. [Google Scholar] [CrossRef] [Green Version]
- Ruban, A.V.; Pascal, A.A.; Robert, B.; Horton, P. Activation of zeaxanthin is an obligatory event in the regulation of photosynthetic light harvesting. J. Biol. Chem. 2002, 277, 7785–7789. [Google Scholar] [CrossRef] [PubMed] [Green Version]
- Schreiber, U.; Klughammer, C. New accessory for the DUAL-PAM-100: The P515/535 module and examples of its application. PAM Appl. Notes. 2008, 1, 1–10. [Google Scholar]
- Klughammer, C.; Siebke, K.; Schreiber, U. Continuous ECS-indicated recording of the proton-motive charge flux in leaves. Photosynth Res. 2013, 117, 471–487. [Google Scholar] [CrossRef] [PubMed] [Green Version]


Publisher’s Note: MDPI stays neutral with regard to jurisdictional claims in published maps and institutional affiliations. |
© 2021 by the authors. Licensee MDPI, Basel, Switzerland. This article is an open access article distributed under the terms and conditions of the Creative Commons Attribution (CC BY) license (https://creativecommons.org/licenses/by/4.0/).
Share and Cite
Sukhova, E.; Yudina, L.; Gromova, E.; Ryabkova, A.; Vodeneev, V.; Sukhov, V. Influence of Local Burning on Difference Reflectance Indices Based on 400–700 nm Wavelengths in Leaves of Pea Seedlings. Plants 2021, 10, 878. https://0-doi-org.brum.beds.ac.uk/10.3390/plants10050878
Sukhova E, Yudina L, Gromova E, Ryabkova A, Vodeneev V, Sukhov V. Influence of Local Burning on Difference Reflectance Indices Based on 400–700 nm Wavelengths in Leaves of Pea Seedlings. Plants. 2021; 10(5):878. https://0-doi-org.brum.beds.ac.uk/10.3390/plants10050878
Chicago/Turabian StyleSukhova, Ekaterina, Lyubov Yudina, Ekaterina Gromova, Anastasiia Ryabkova, Vladimir Vodeneev, and Vladimir Sukhov. 2021. "Influence of Local Burning on Difference Reflectance Indices Based on 400–700 nm Wavelengths in Leaves of Pea Seedlings" Plants 10, no. 5: 878. https://0-doi-org.brum.beds.ac.uk/10.3390/plants10050878