Objective Definition of Climatologically Homogeneous Areas in the Southern Balkans Based on the ERA5 Data Set


Laboratory of Meteorology, Department of Physics, University of Ioannina, 45110 Ioannina, Greece
*
Author to whom correspondence should be addressed.
Climate 2018, 6(4), 96; https://0-doi-org.brum.beds.ac.uk/10.3390/cli6040096
Submission received: 15 November 2018
/
Revised: 5 December 2018
/
Accepted: 5 December 2018
/
Published: 7 December 2018
(This article belongs to the Special Issue Climate Variability and Change in the 21th Century)
Abstract
:An objective definition of climatologically homogeneous areas in the southern Balkans is attempted with the use of daily 0.25° × 0.25° ERA5 meteorological data of air temperature, dew point, zonal and meridional wind components, Convective Available Potential Energy, Convective Inhibition, and total cloud cover. The classification of the various grid points into climatologically homogeneous areas is carried out by applying Principal Component Analysis and K-means Cluster Analysis on the mean spatial anomaly patterns of the above parameters for the 10-year period of 2008 to 2017. According to the results, 12 climatologically homogenous areas are found. From these areas, eight are mainly over the sea and four are mainly over the land. The mean intra-annual variations of the spatial anomalies of the above parameters reveal the main climatic characteristics of these areas for the above period. These characteristics refer, for example, to how much warmer or cloudy the climate of a specific area is in a specific season relatively to the rest of the geographical domain. The continentality, the latitude, the altitude, the orientation, and the seasonal variability of the thermal and dynamic factors affecting the Mediterranean region are responsible for the climate characteristics of the 12 areas and the differences among them.
1. Introduction
The Mediterranean Sea is located in a transitional climatic area between Europe, Africa, and Asia and its climate is widely known as “the Mediterranean climate”. The Mediterranean climate is generally characterized by considerable seasonal variations in almost all climatic parameters, for example air temperature, cloudiness, precipitation, lightning activity, etc. [1,2,3,4,5]. Although these seasonal variations appear over the whole Mediterranean region, they present significant differences among the various subregions. These differences are connected to various atmospheric and geographical factors. The position and the variability of the large-scale atmospheric circulation systems (e.g., the subtropical anticyclone of the North Atlantic and the south Asian summer low) and the global atmospheric oscillations affecting the region are dominant atmospheric circulation factors connected to the significant spatial variability of climate within the Mediterranean region [6,7,8]. The North Atlantic Oscillation (NAO), which refers to the sea level pressure seesaw between the Icelandic low and the subtropical anticyclone of the North Atlantic, affects the atmospheric conditions over most of the Mediterranean region. Specifically, positive/negative values of the NAO index are generally connected to below/above normal cyclonic activity and precipitation over the Mediterranean [9,10]. The Arctic Oscillation (AO) is connected to the variation of the intensity of the polar low. Positive values of the AO index are generally associated with anticyclonic conditions and dryness over the Mediterranean, while negative AO index values are connected to the transfer of cold masses towards the south and the prevalence of cyclonic activity and above normal precipitation over the same region [11,12]. The North Sea–Caspian Pattern (NCP) is a pressure seesaw between the North Sea and the Caspian Sea. A positive phase of NCP is accompanied by northeasterly flow over a part of the Eastern Mediterranean (Balkans and Western Turkey), while a negative phase is accompanied by southwesterly flow over the same regions [13,14]. Furthermore, the spatial variability of climate characteristics is enhanced by the complicated geographical features of the region (coastline, relief, land–sea alteration), which affect significantly most of the climatic parameters including temperature, cloudiness, precipitation, and wind. For example, the windward or leeward character of a specific region, as well as its distance from the sea, plays an important role on its cloudiness and precipitation regimes. These regimes are strongly affected by the associated atmospheric humidity and static stability levels and the frequent prevalence of adiabatic sink (warming) or rise (cooling) [3,15]. Considering the above atmospheric and geographical features of the Mediterranean region and the associated high spatial variability of its climate, climatological studies, which can be carried out with the use of high-resolution meteorological data, would lead to interesting results referring to the detailed spatial characteristics of the Mediterranean climate. This is further supported by the fact that the future climatic changes, as they are forecasted by the climatic models, are also expected to be characterized by high spatial variability over the same region [16,17].
The climate of the Balkans, a Mediterranean subregion of great climatological interest, has been extensively studied by means of the spatial regimes of specific climatic parameters [18,19] and their connection to specific atmospheric circulation modes [20]. The impacts of the acting teleconnections, global warming, and local surface warming (land–atmosphere interactions) reveal high spatial complexity over the region. Most studies involve station meteorological data and/or Reanalysis data of spatial resolution up to 1° × 1°. Moreover, an attempt for a climate regionalization of the Balkan Peninsula has been made with the application of Cluster Analysis on station sea level pressure data over the region [21]. Nowadays, the recently introduced ERA5 high resolution meteorological data set [22] provides the scientific community with an extra useful tool for studying the spatial variability of climate over a region with relatively complex relief. The southern Balkans is such a region and the present study aims at examining this variability by defining climatologically homogeneous subregions within it, i.e., subregions with characteristic seasonal variations of the main climatic parameters. This is achieved with the application of a multivariate statistical scheme including Principal Component Analysis and Cluster Analysis on the high-resolution ERA5 meteorological data set. The temporal availability of the data set is at the moment restricted to the recent 10-year period of 2008 to 2017. Although this period is relatively short, not being sufficient for the full establishment of the statistical parameters connected to the climate of the region, the general characteristics of the spatial variability of climate, especially those that are significantly influenced by the complicated relief, can be highlighted by means of the high spatial resolution and the reliability of the recently introduced data set.
2. Materials and Methods
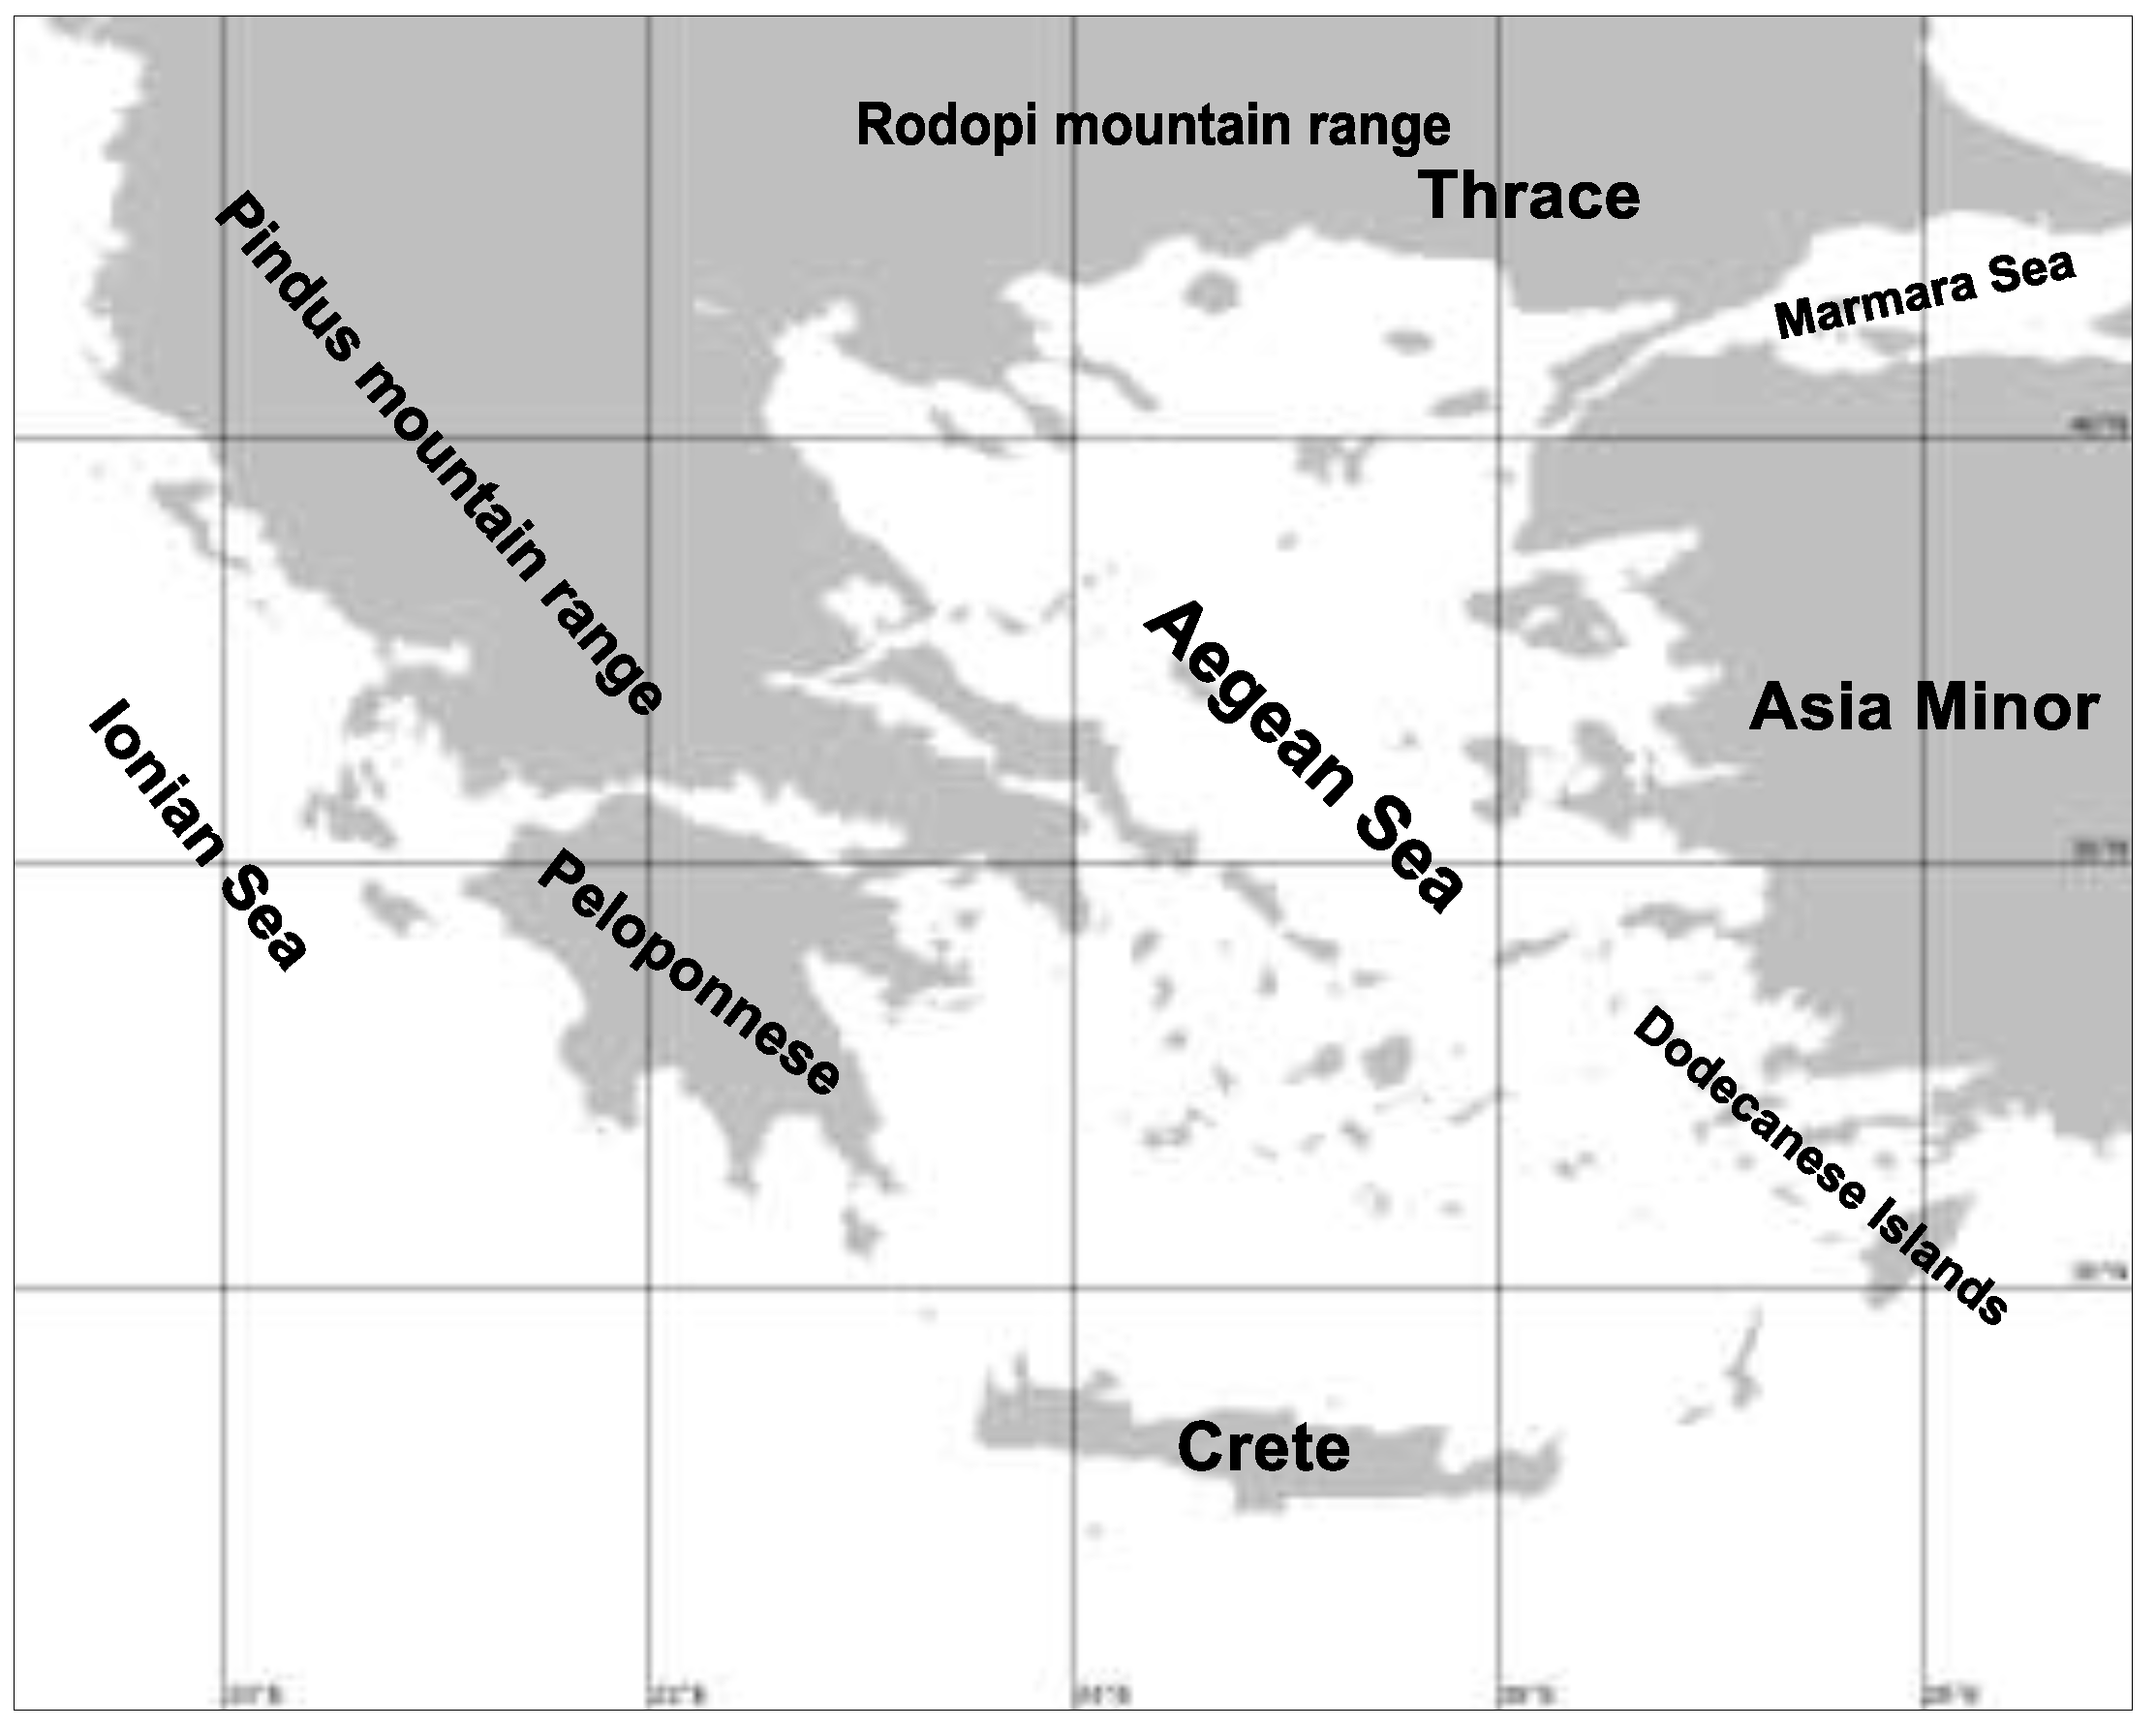
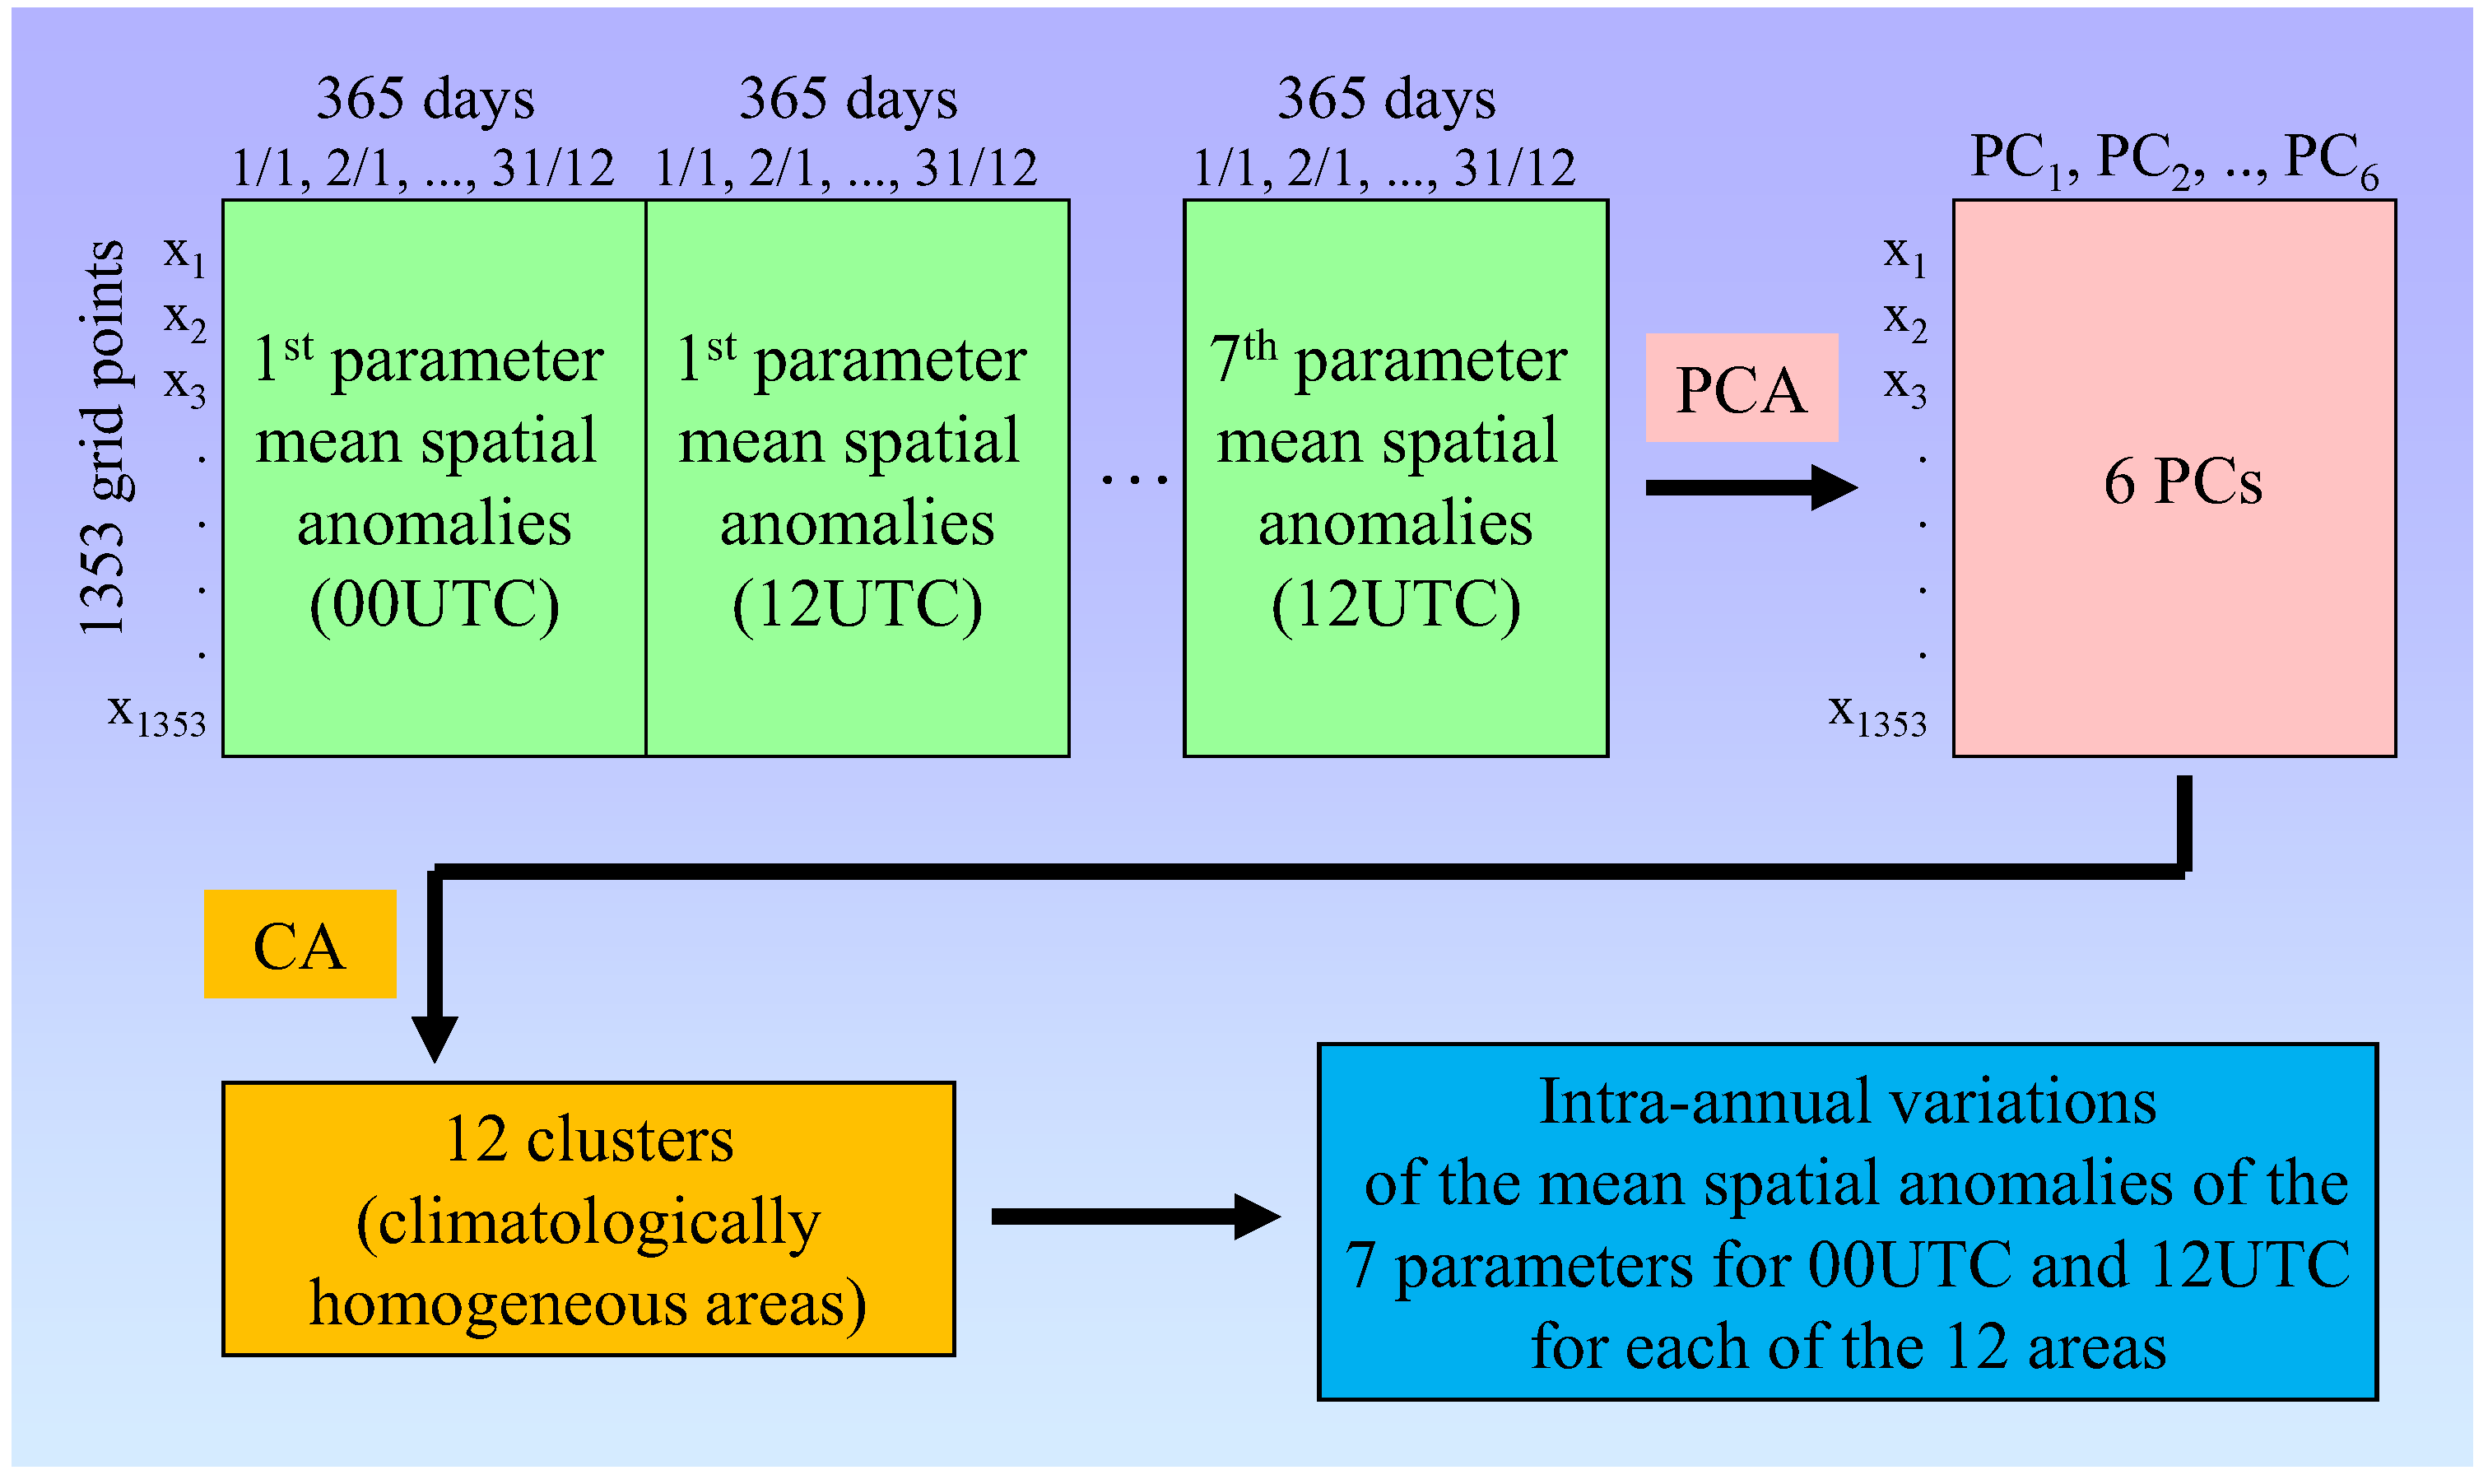
The data used in the present study are daily (00UTC and 12UTC) 0.25° × 0.25° grid point values of air temperature (AT), dew point temperature (DP), zonal (ZW) and meridional (MW) wind components, Convective Available Potential Energy (CAPE), Convective Inhibition (CIN), and total cloud cover (TCC) for the southern Balkans area (19°–29° E, 34°–42° N) (Figure 1) for the 10-year period of 2008 to 2017, obtained from the ERA5 Reanalysis data set [22]. The selection of the above parameters has been made taking into account that their values over the examined area are directly connected to the climate of the region, by either determining its main characteristics (AT, DP, ZW, MW, and TCC) or being responsible for the in situ extreme precipitation events related to thunderstorms (CAPE and CIN). This is not the case for other parameters for example sea level pressure or geopotential height, which affect the climate characteristics of the region indirectly and remotely and have to be examined over a broader area. Also, the data corresponds to 00UTC and 12UTC hours in order to involve both midnight and midday atmospheric conditions, which are generally different especially during the warm period of the year, mainly because of the intense daytime land warming and the development of small-scale circulations (e.g., see breezes). ERA5 is a recently introduced ECWF data set, which provides hourly values of many atmospheric, land, and oceanic parameters at a horizontal resolution of 31 km on 137 levels from the surface up to 0.01 hPa (~80 km above the earth’s surface). It combines large quantities of historical observations into global estimates with the use of advanced modeling and data assimilation procedures [22]. For each of the above parameters (AT, DP, ZW, MW, CAPE, CIN, and TCC) and time (00UTC and 12UTC), the 2008–2017 long-term mean spatial anomaly patterns are calculated for each of the 365 calendar days of the year. The spatial anomaly pattern of a specific parameter for a specific calendar day is calculated by subtracting the spatial average from the value of each grid point. Thus, a matrix containing all the long-term mean spatial anomaly patterns of the above parameters at 00UTC and 12UTC for the 365 calendar days of the year is constructed. Each column of the matrix corresponds to a specific parameter, a specific hour (00UTCor 12UTC) and a specific calendar date of the year, while each line corresponds to a specific grid point of the study area.
Principal Component Analysis (PCA), with varimax rotation, is applied on the above matrix as a dimensionality reduction tool. PCA is a multivariate statistical method which projects a set of possibly correlated variables onto a set of uncorrelated variables, which are called principal components. Only the statistically significant components are used for the next step and their number is indicated by the SCREE plot and the physical hypostasis of the results [23,24]. Next, K-Means Cluster Analysis (CA) is applied on the time series of the standardized significant principal components in order to group grid points, and thus to define the areas with homogenous climate characteristics regarding the spatial anomalies of specific climatic parameters during specific sub-periods of the year. CA is a statistical method that classifies cases of a set of variables into objectively defined distinct and homogeneous clusters. The squared Euclidean distance is selected to be the measure of similarity, while the k-means technique succeeds in the continuous rearrangement of the cases in new clusters optimizing the final classification [25,26,27]. The optimum number of clusters is indicated by the distortion test [28]. For the grid points classified into each of the clusters, the mean intra-annual variations of all the climatic parameters are constructed. These intra-annual variations are smoothed by averaging the daily values over each of the 73 (365/5) 5-day periods of the year. In this way the main climate characteristics of the objectively defined areas regarding the magnitude of each climatic parameter, relatively to the spatial average, during the year, are revealed. The methodology scheme, which is followed in the present study and is described in the above paragraphs, is presented in Figure 2. Finally, a comparison between the ERA5 and ERA-Interim data sets is carried out for the common period of 2008 to 2017. This comparison involves air temperature and total cloud cover, parameters which are connected to the most significant climate characteristics, and it is performed separately for the land and the sea areas. For this purpose, daily values of ERA-Interim 1° × 1° grid point data of air temperature and total cloud cover are also used [29].
3. Results
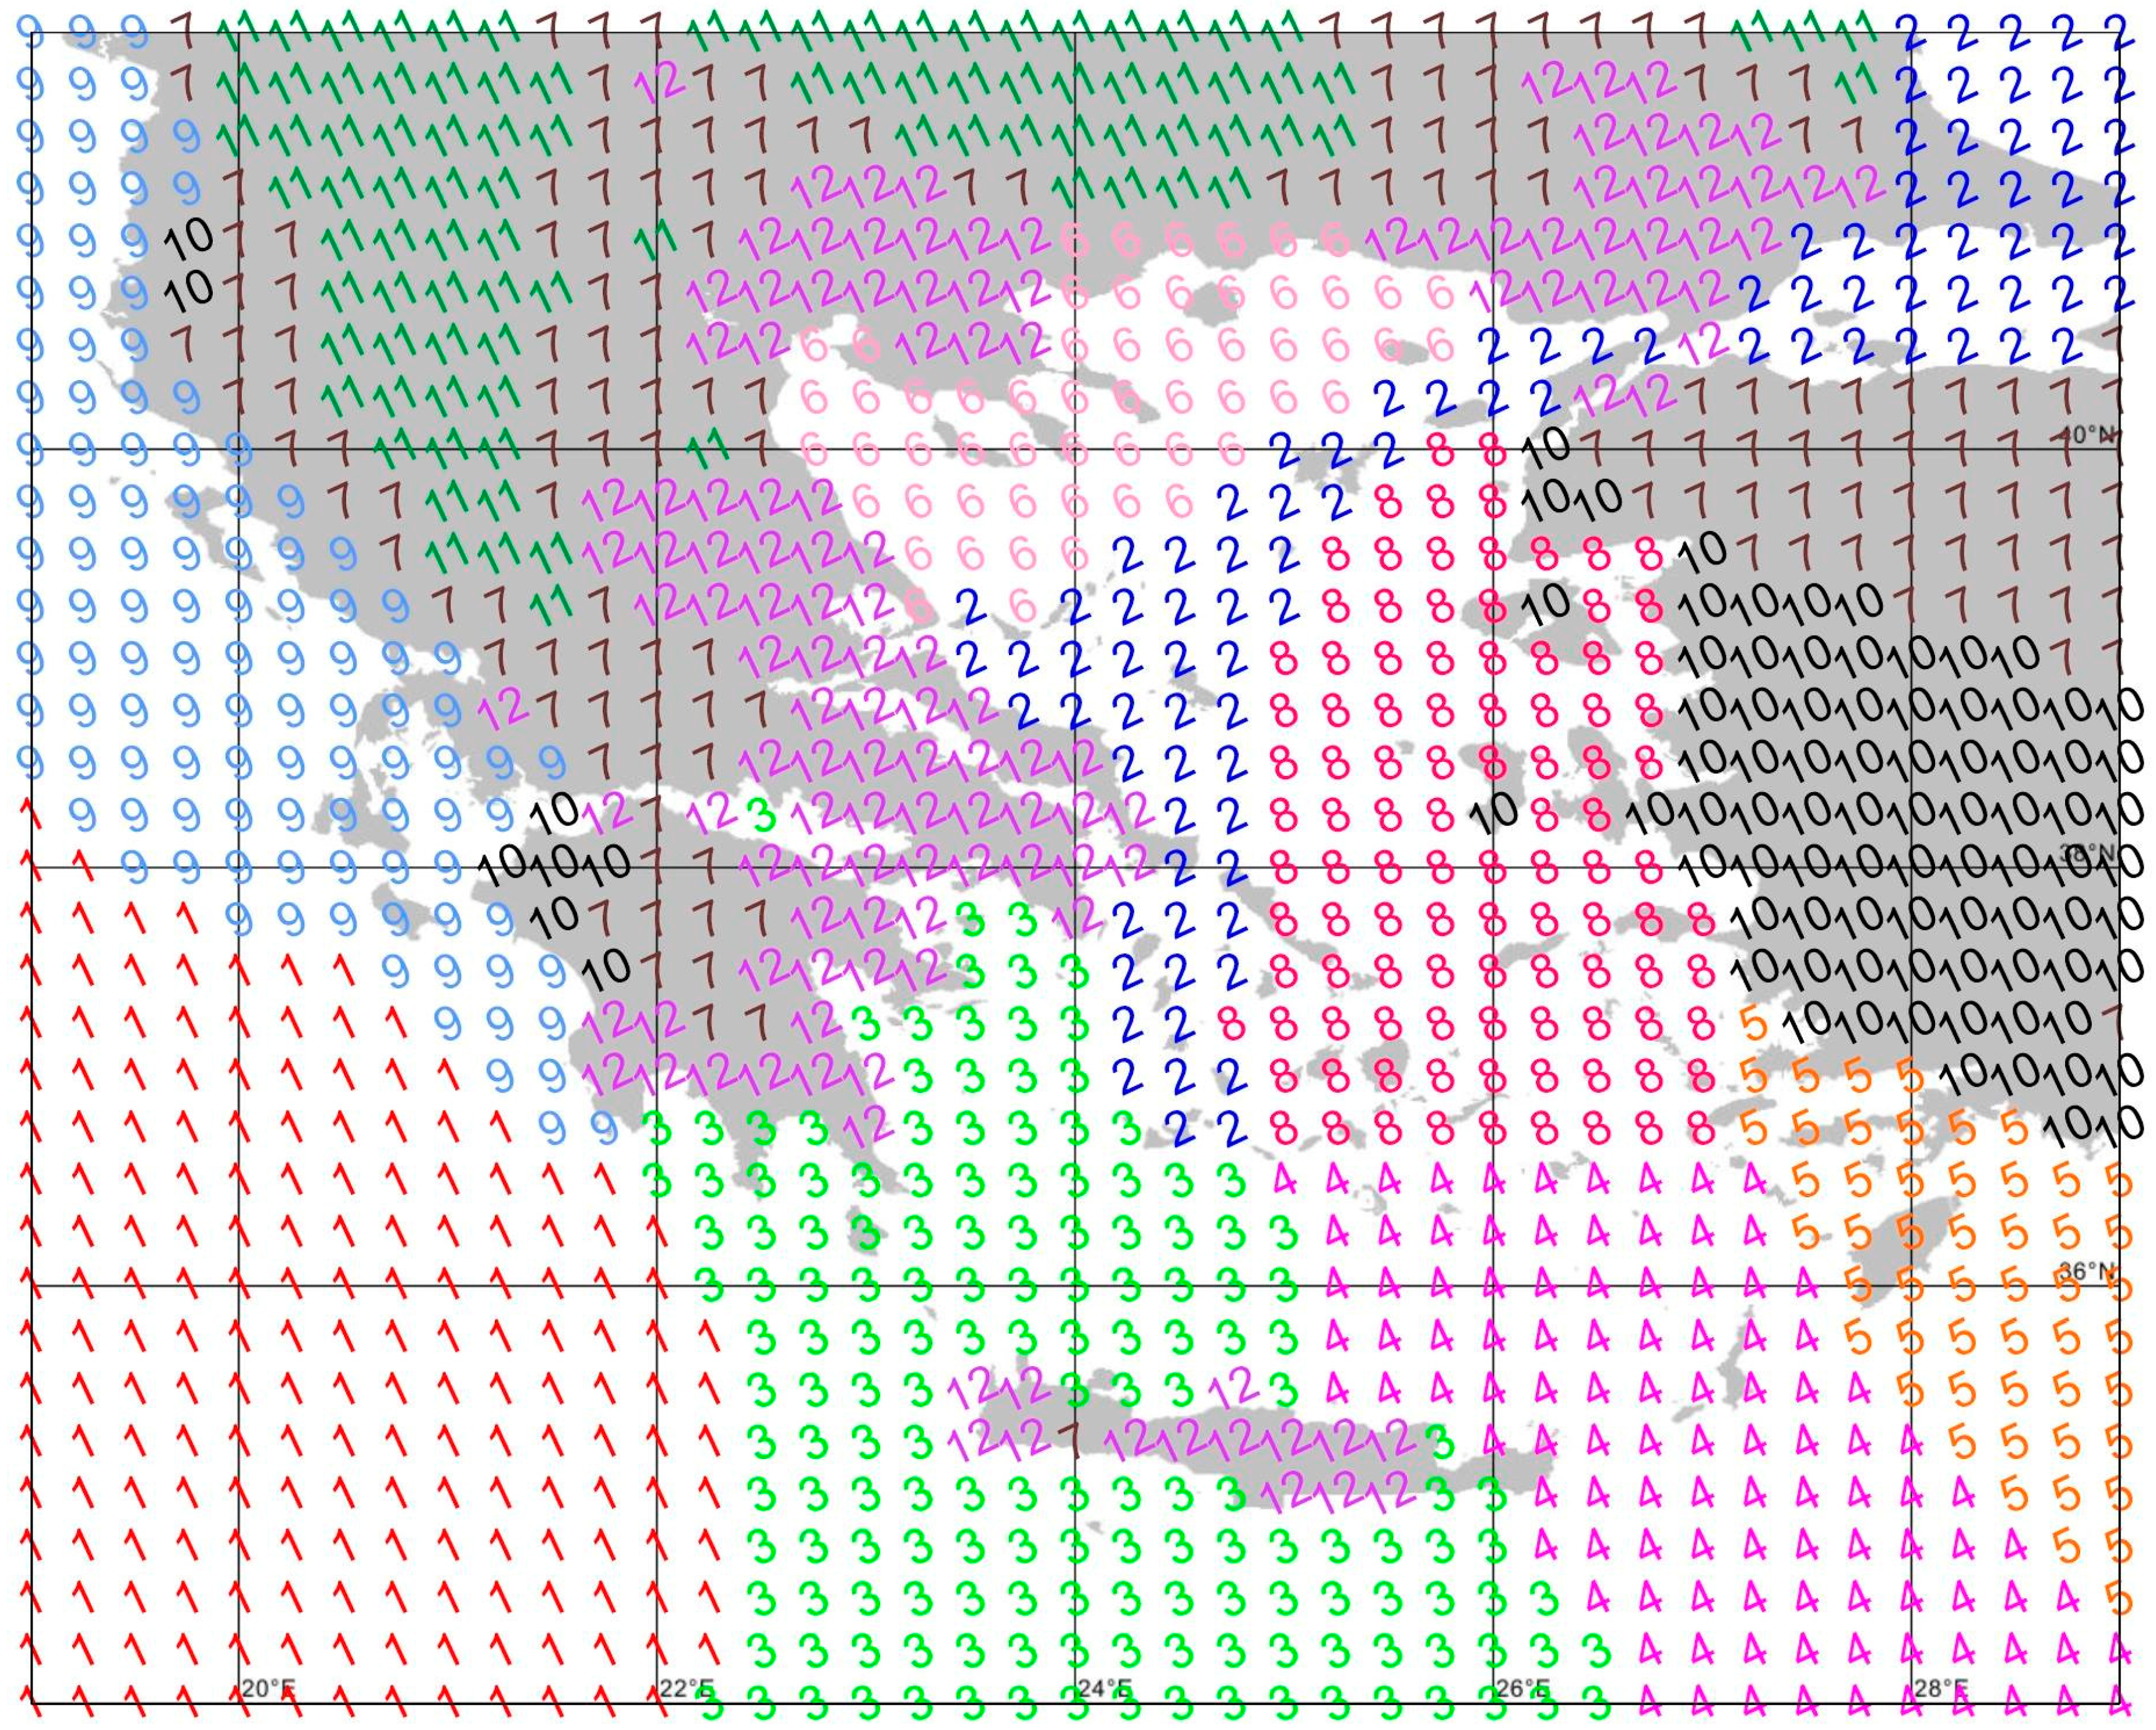
The application of PCA leads to six PCs accounting for 74% of the total variance and the application of CA leads to 12 clusters (Figure 2). The 12 clusters correspond to specific geographical areas, which are presented in Figure 3. Each area is characterized by specific seasonal variations of the climatic parameters’ spatial anomalies, which are presented in Figure 4, Figure 5, Figure 6, Figure 7, Figure 8 and Figure 9. The main climatic characteristics of each cluster (subregion) are presented in the following paragraphs.
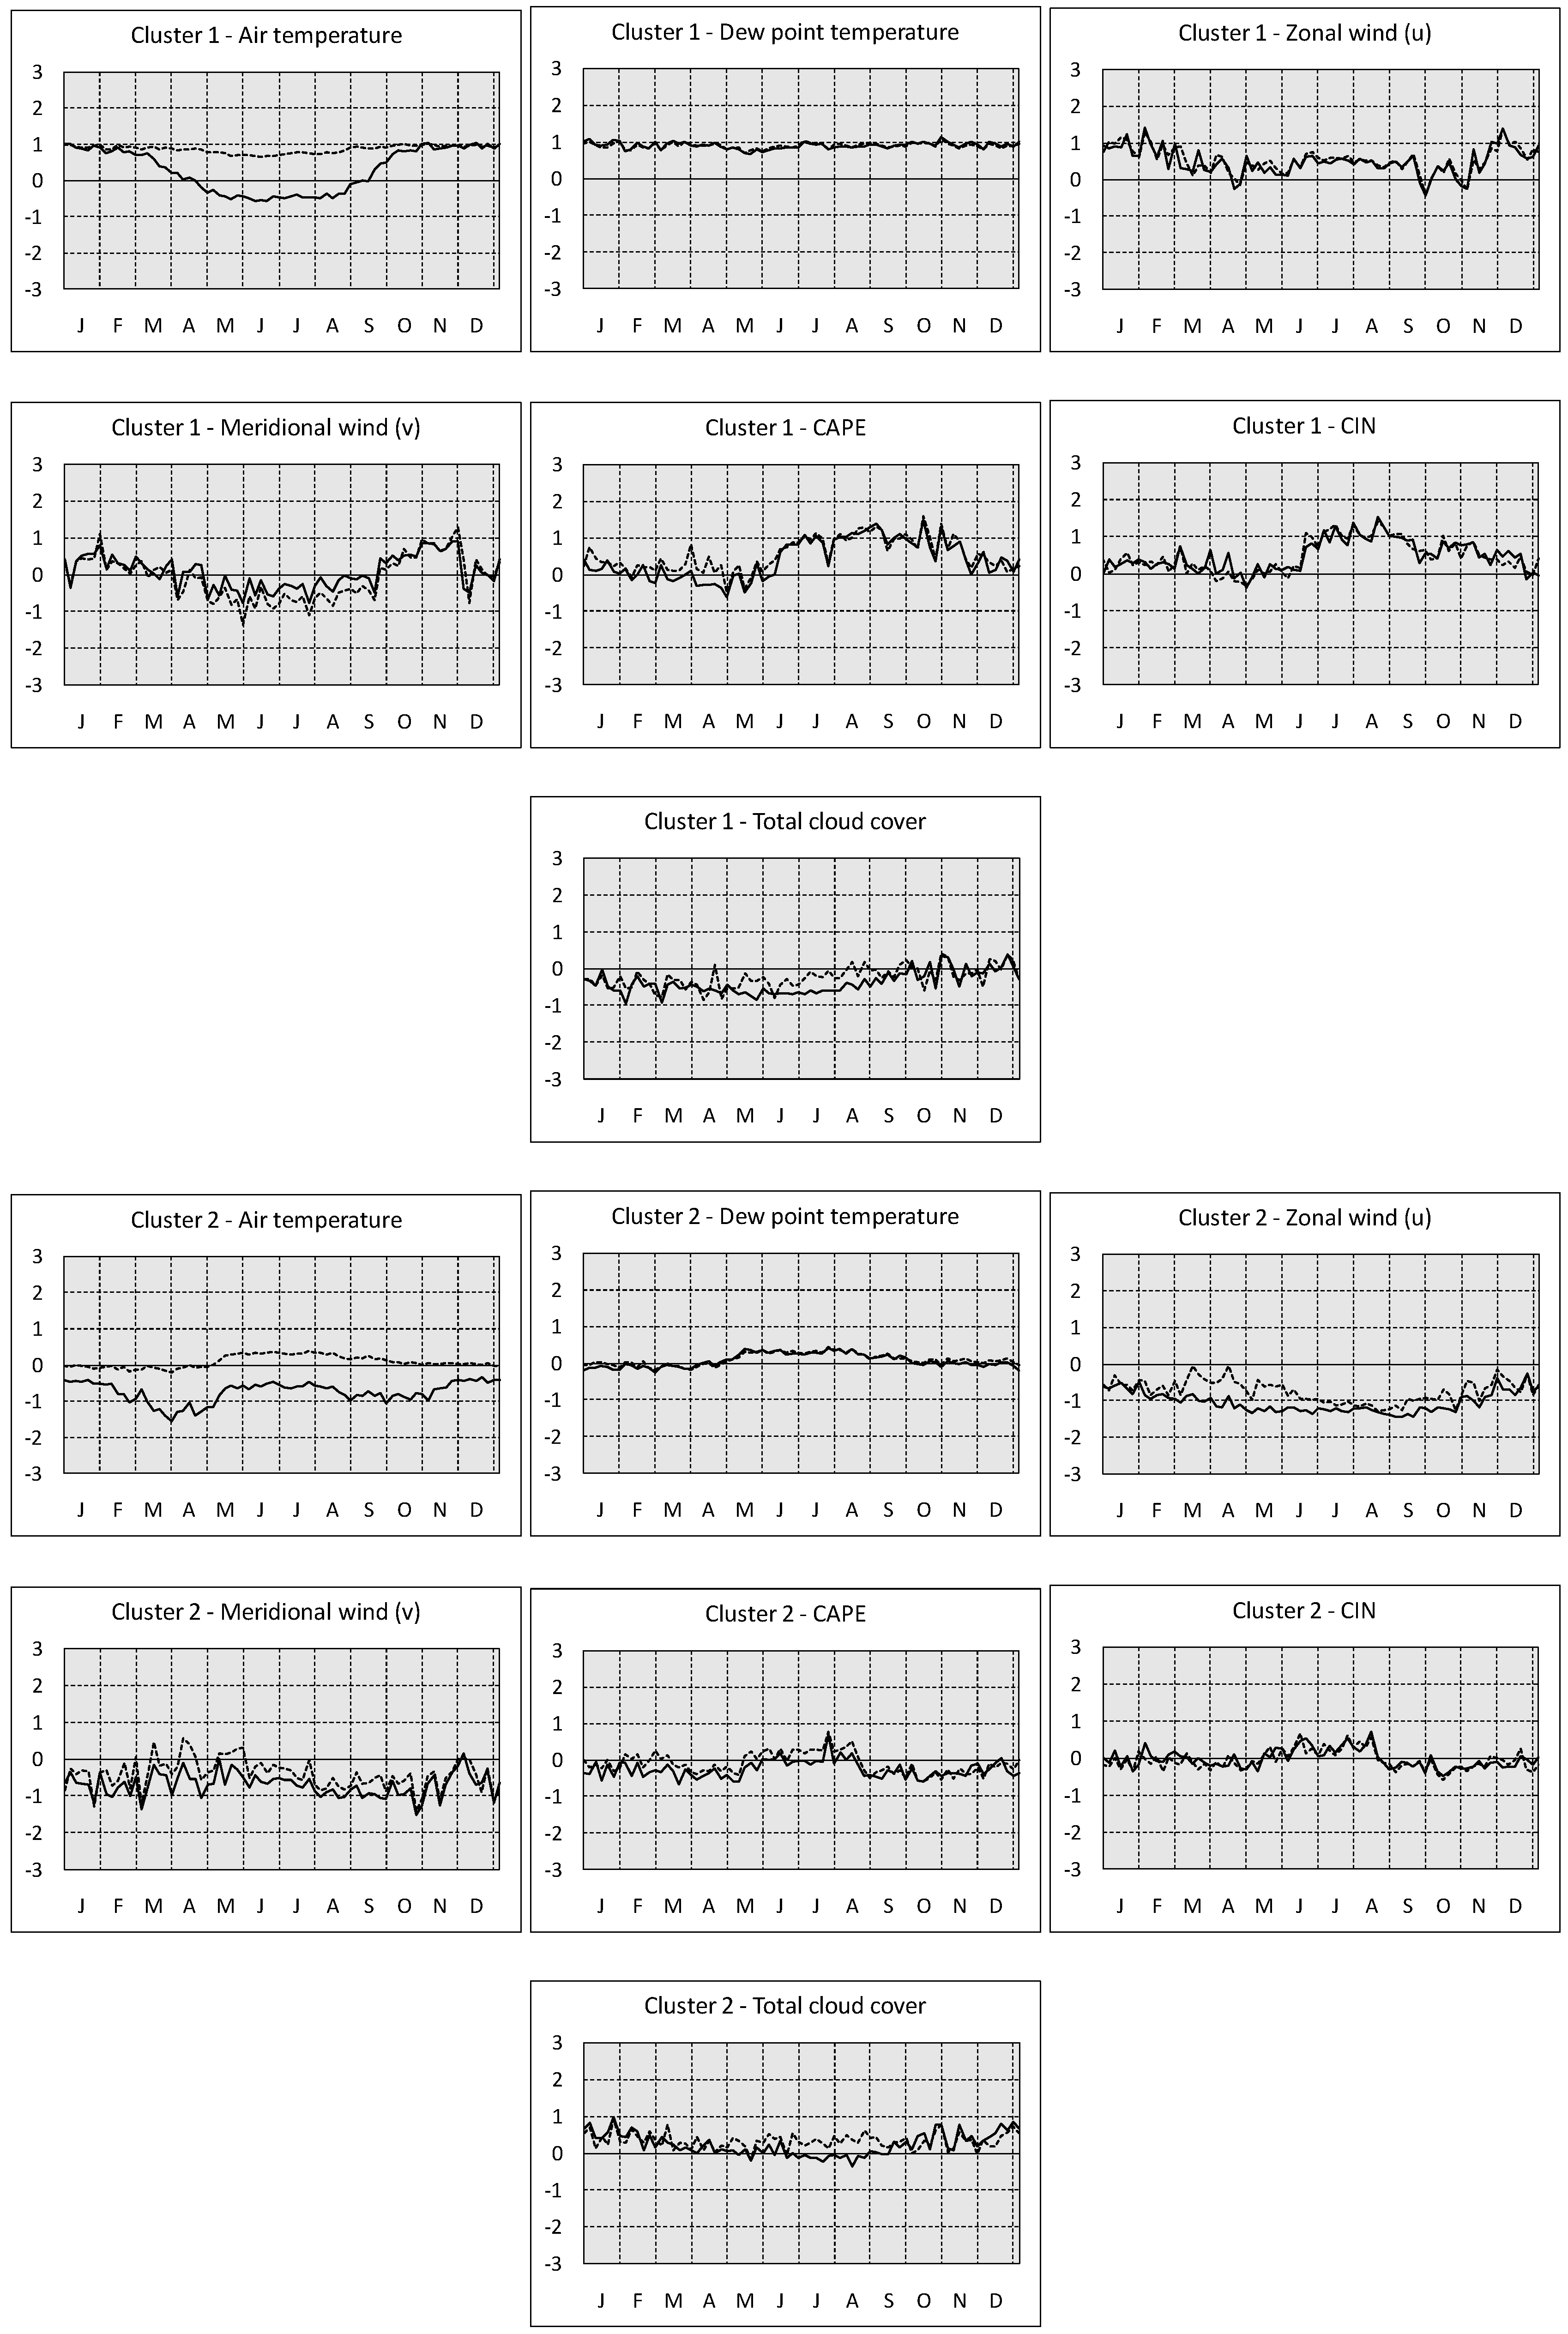
Cluster 1 comprises the grid points of the southern Ionian Sea (Figure 3). The intra-annual variations of the anomalies of the climatic parameters in this area are presented in Figure 4. It is seen that 12UTC air temperature over the southern Ionian is higher than the spatial average from the middle of September to the middle of April by one standard deviation, while it is lower than the spatial average by half standard deviation during the rest of the year. This is not valid for 00UTC air temperature which is equally higher than the spatial average during the whole year. These seasonal variations of temperature anomalies are due to the fact that at night sea-surface is generally warmer than land during the whole year, while during daytime this is valid only for the cold period as for the warm period the high insolation leads to intense land warming and highest temperature anomalies over the land. For the rest of the parameters, there is not any notable difference between 00UTC and 12UTC intra-annual variations, except for cloud cover, which presents a small difference in summer. Dew point is about one standard deviation above the spatial average during the whole year. The zonal wind component is higher than the spatial average during almost the whole year with highest values in winter, while the meridional wind component is highest during late autumn. Both wind seasonal variations are in agreement with the high frequency of southwesterly winds associated with the passages of Mediterranean depressions during late autumn and winter. CAPE and CIN spatial anomalies are highest in summer and early autumn when they are approximately one standard deviation higher than the spatial average. This agrees with the findings of Lolis [30] for the spatial distribution of CAPE in the Mediterranean region. Finally, total cloud cover is generally lower than the spatial average during the whole year except autumn, while for late spring and summer 12UTC anomalies are considerably lower than 00UTC anomalies. The low cloud cover values relatively to the spatial average during late spring and summer are due to the convective cloud development over the land during the same period [1].
Cluster 2 contains a relatively narrow geographical zone mainly covered by the sea, which is extended from the western central Aegean to the Marmara Sea and the Black Sea, while it includes also a part of Eastern Thrace (Figure 3). According to the intra-annual variations of the anomalies (Figure 4), it appears that the nighttime temperature is near the spatial average during the whole year, while the daytime temperature is below the spatial average. The prevalence of low daytime temperature anomalies is probably a result of the frequent and/or strong northeast winds in both the cold and the warm period appearing in the anomalies of the wind components. The northeast winds over this area are mainly a result of stationary synoptic conditions, which in the warm period are associated with the prevalence of the etesian winds [31,32]. The CAPE and CIN anomalies do not present considerable variations during the year, while cloud cover is generally above the spatial average during the whole year. An exception exists for summer during daytime when the spatial maximum of cloud cover is located over the land because of the intense land warming there.
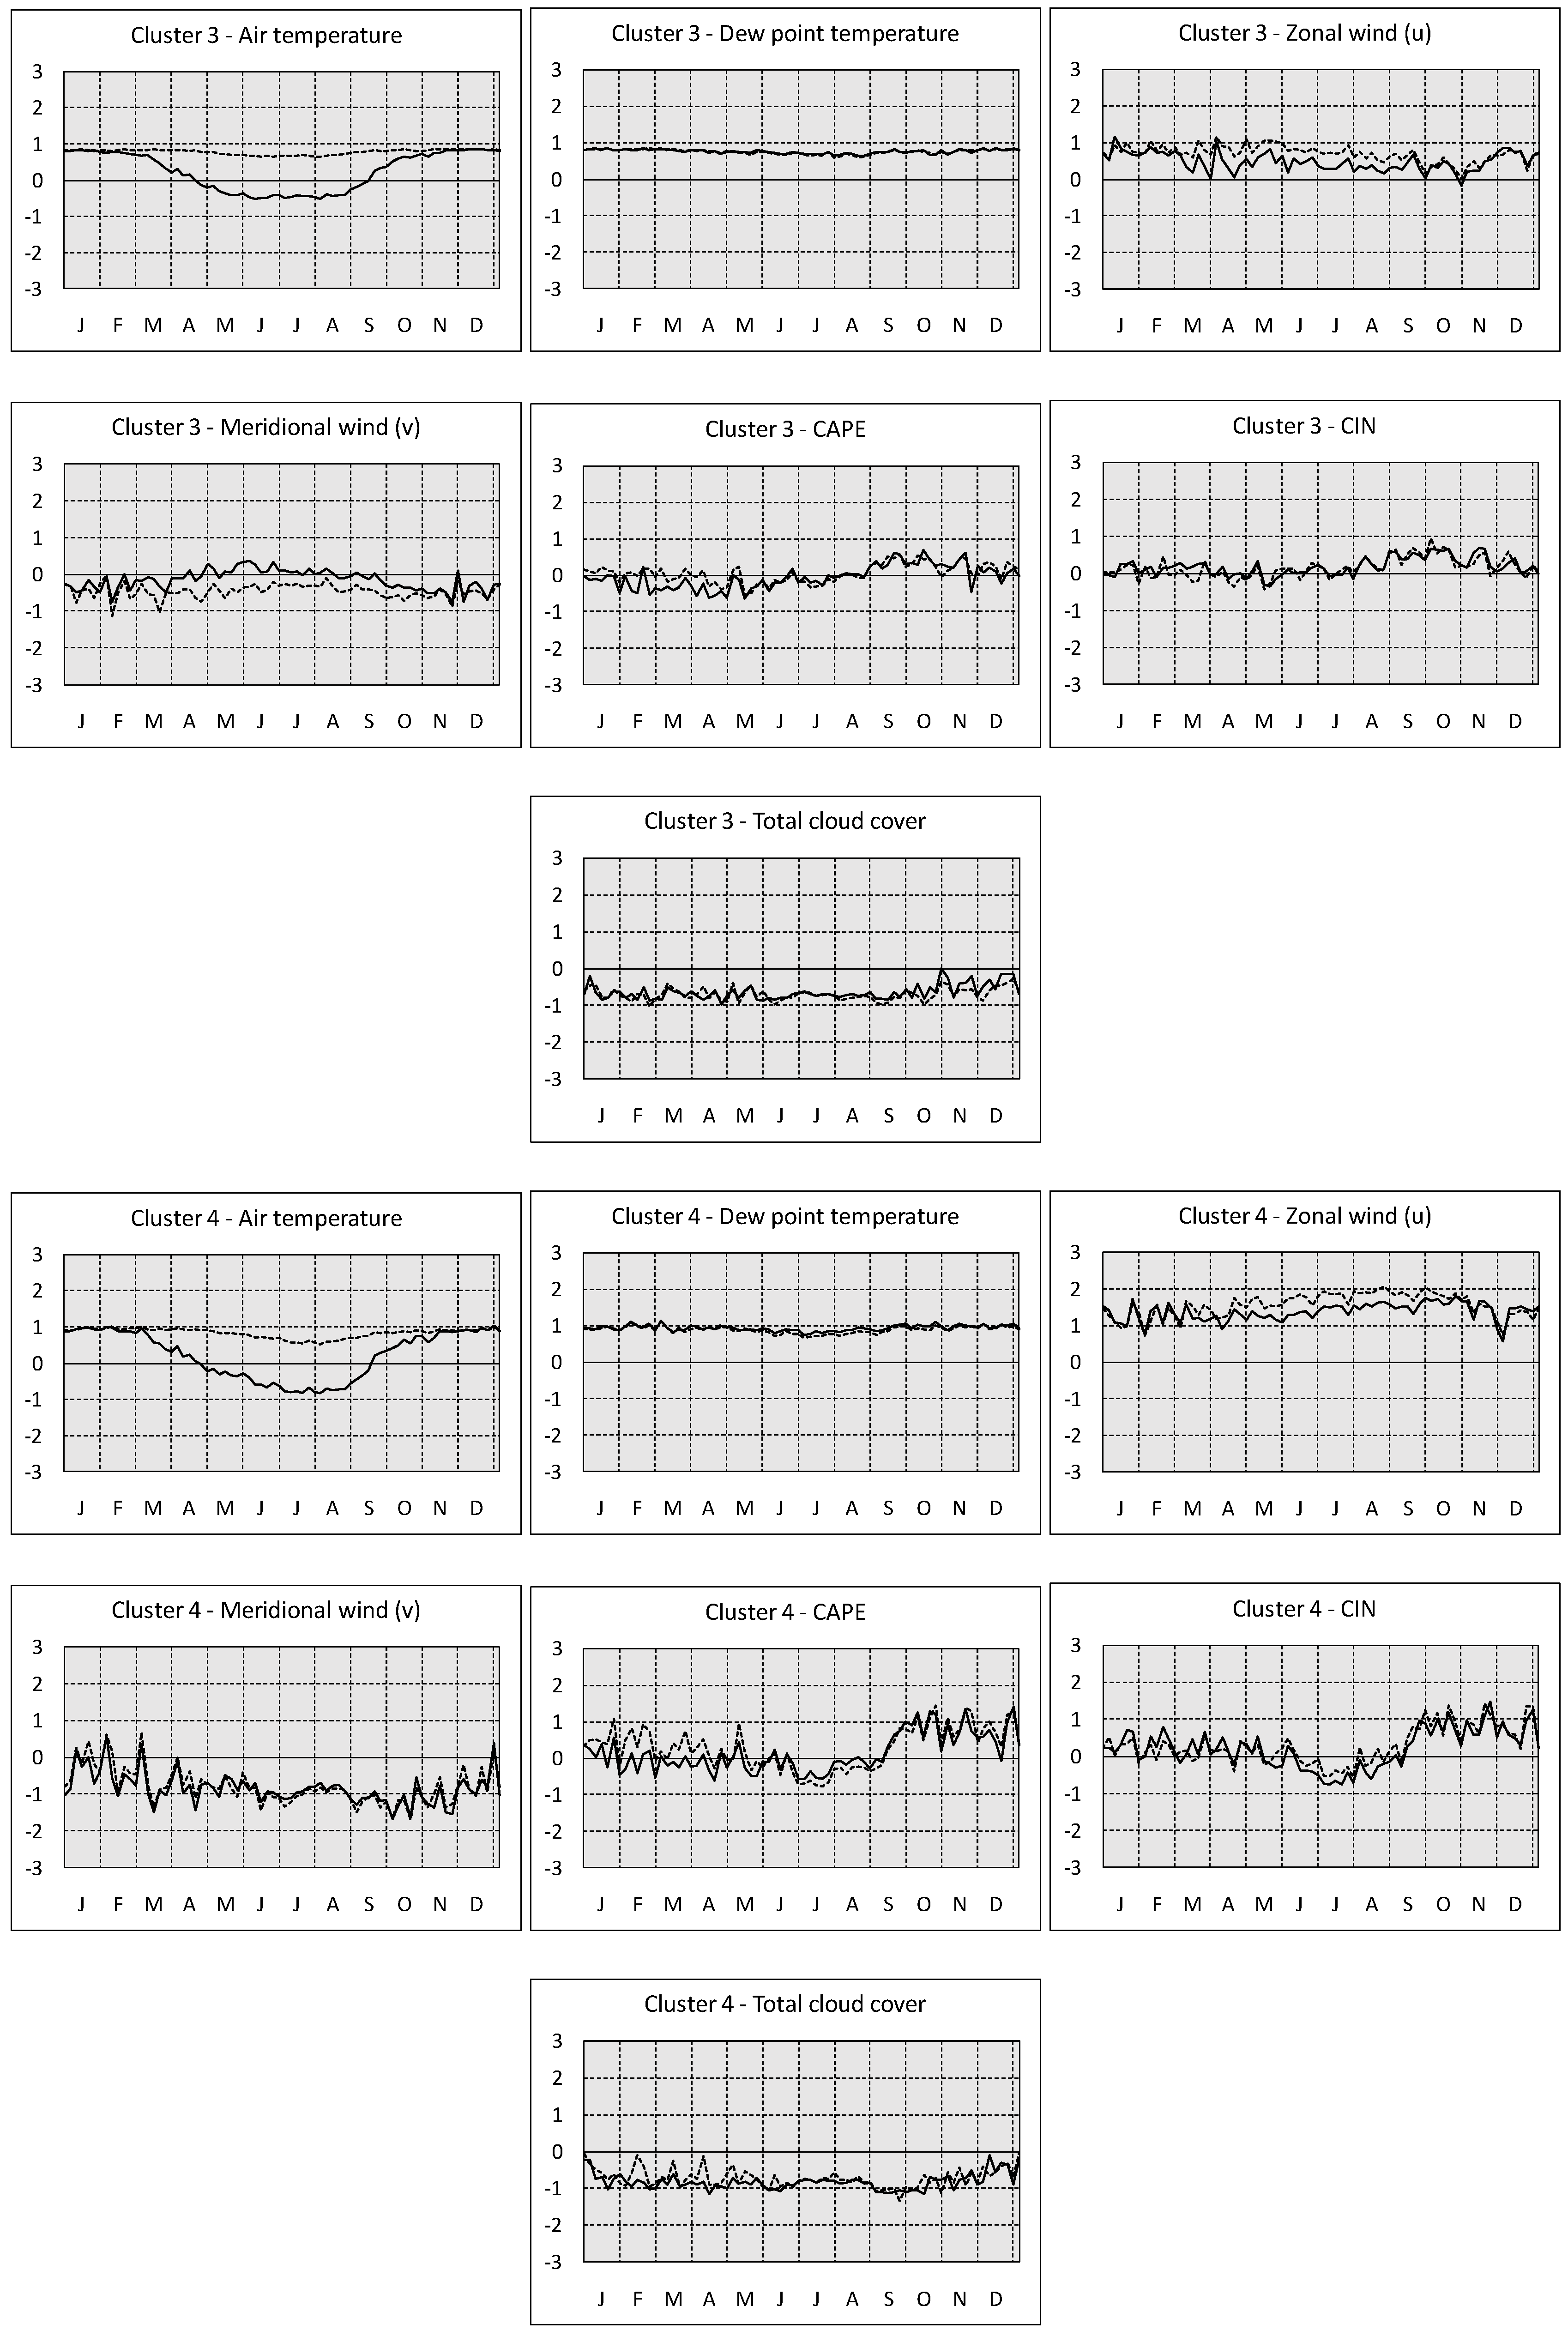
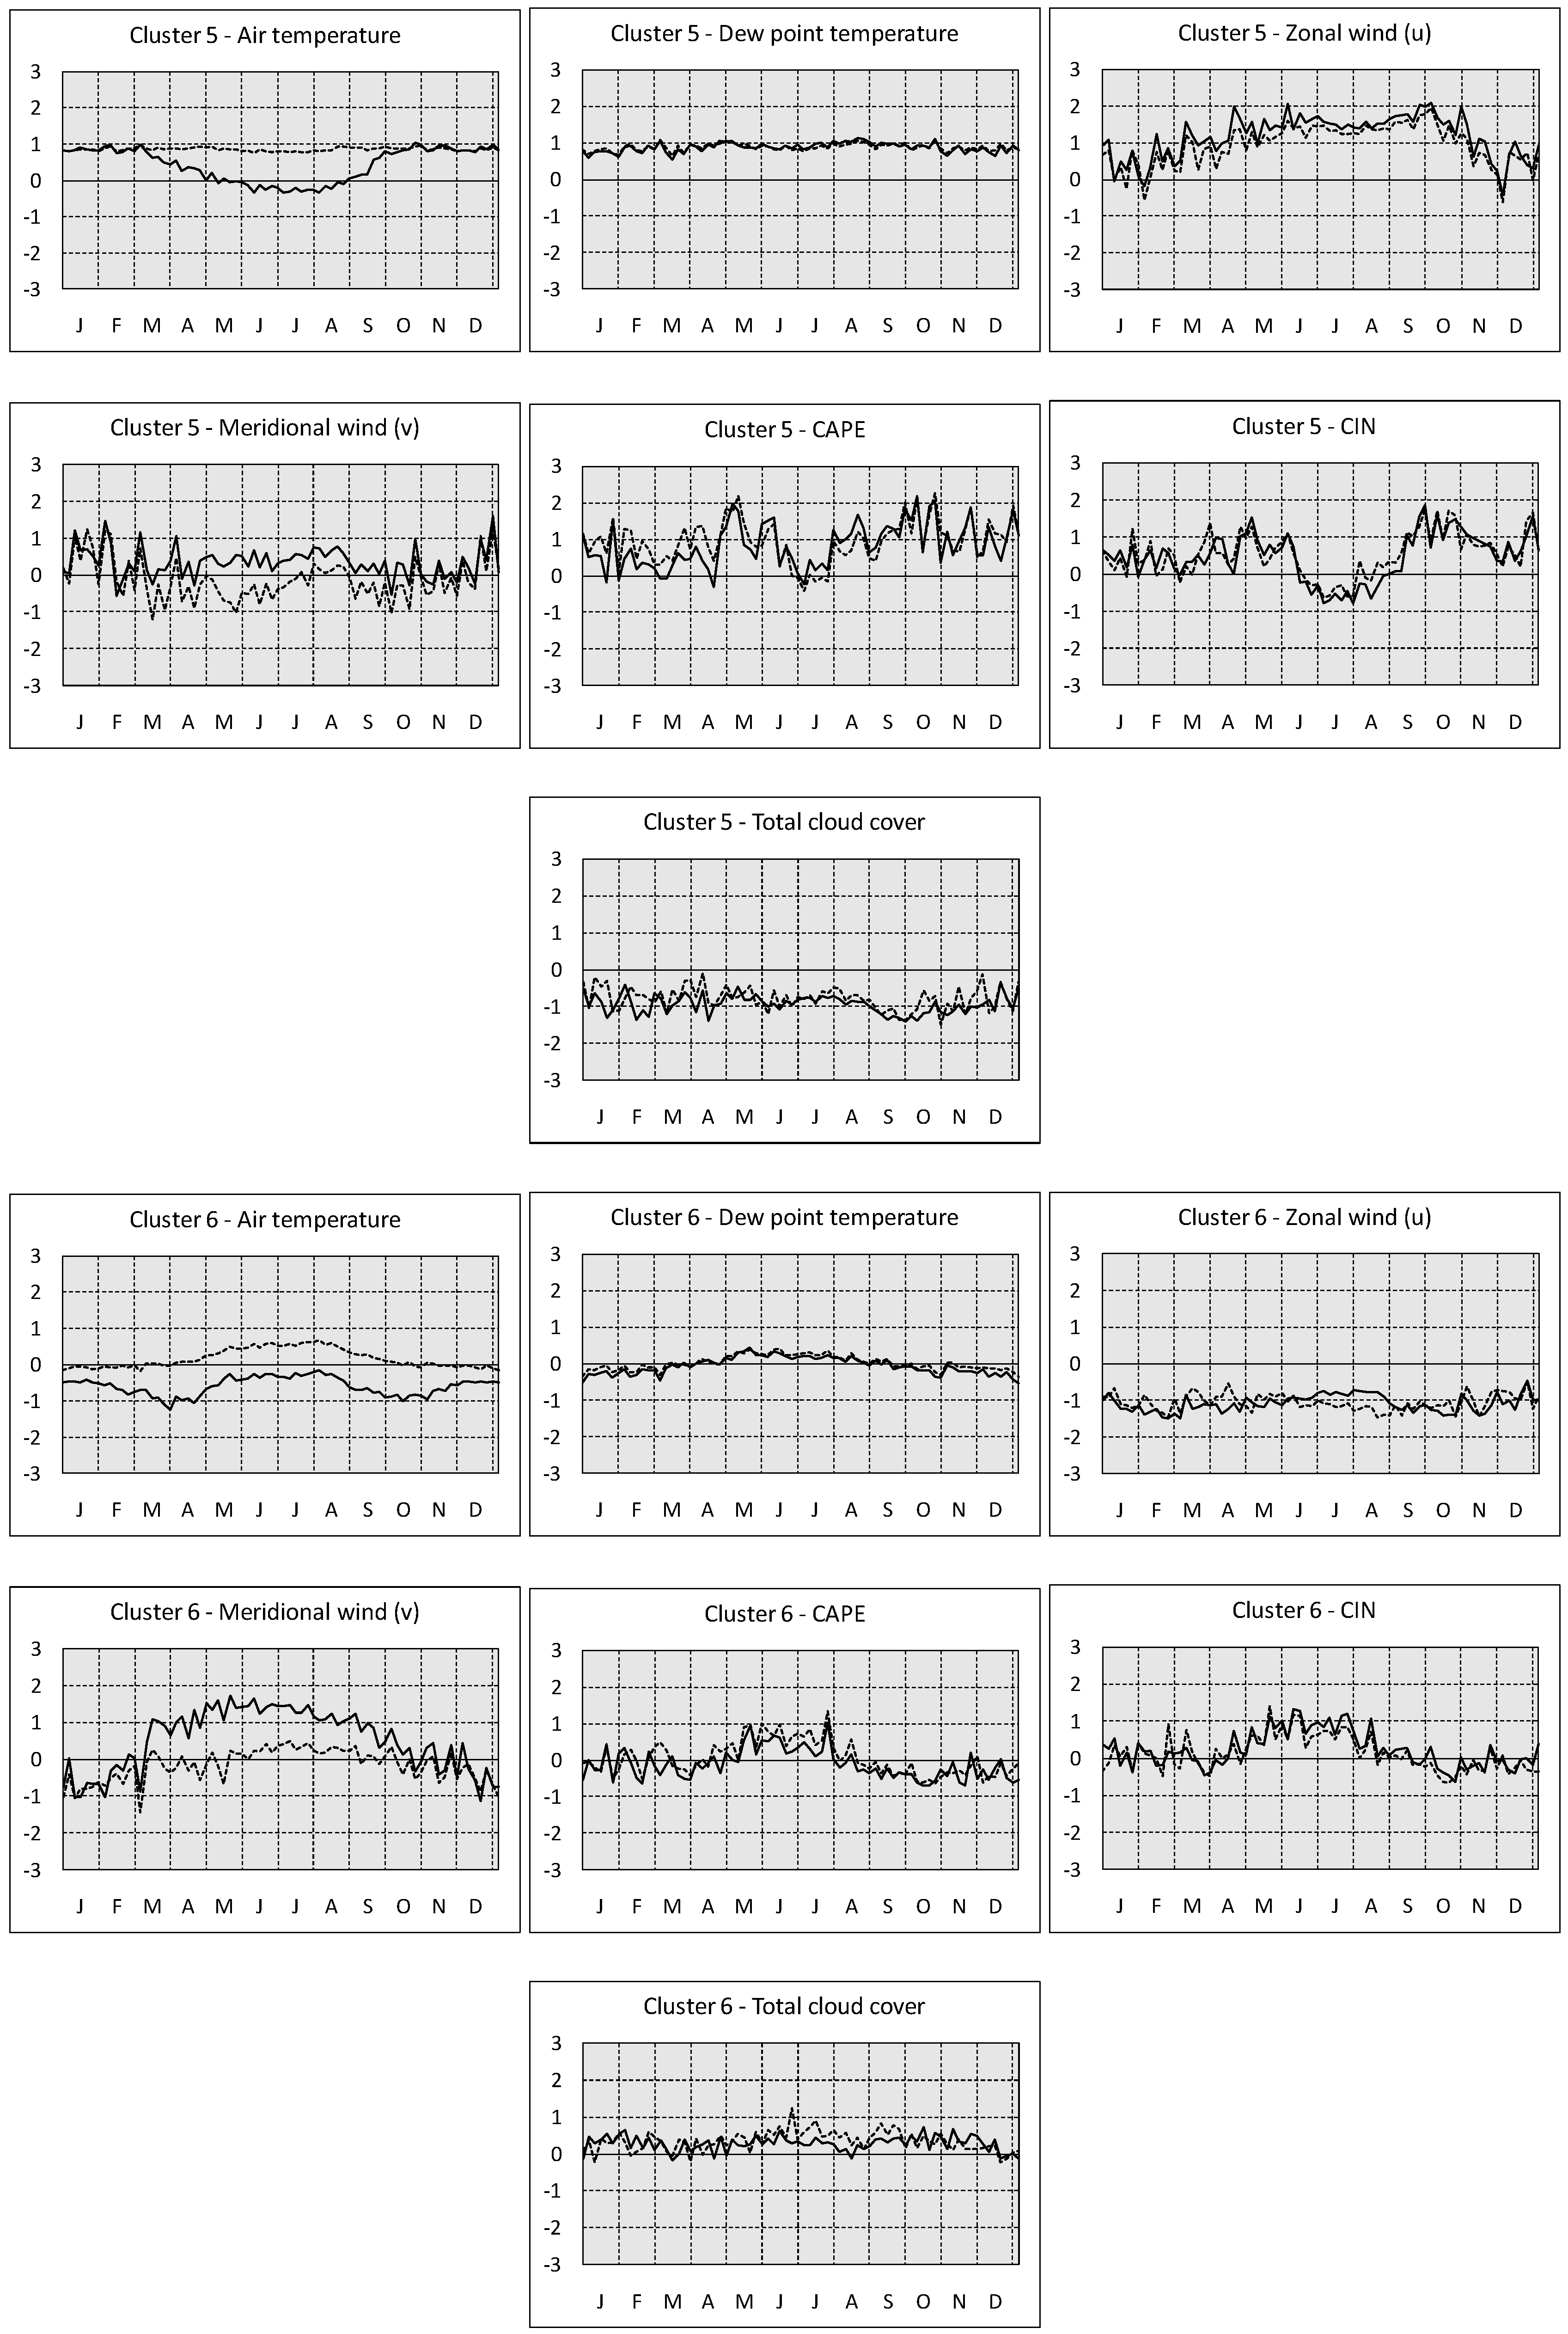
Clusters 3, 4, and 5 comprise the southern Aegean and the sea area south of Crete and the Dodecanese islands (Figure 3). According to the intra-annual variations of the spatial anomalies (Figure 5 and Figure 6), the above area is characterized by a remarkable difference between the daytime and nighttime temperature anomalies during the warm period, which was the case for the previously analyzed neighboring sea area of cluster 1 (southern Ionian Sea). Other characteristics of the areas of clusters 3, 4, and 5 are the positive anomalies of the zonal wind component during the whole year, the autumn CAPE and CIN maxima and the negative anomalies of cloud cover which are mainly associated with the low latitude and the large distance from the land in summer and the absence of orographic effect in winter. The main differences among the areas of the above three clusters mainly refer to the sign and the magnitude of the meridional wind, CAPE and CIN anomalies. Specifically, one of the main differences is that the area of cluster 5 is characterized by high CAPE and CIN variations relatively to the other two areas, while two maxima appear instead of one, the first in spring and the second in autumn.
Cluster 6 corresponds to the northern Aegean (Figure 3). In this area, the 12UTC air temperature anomalies are remarkably lower than the 00UTC ones, not only during the warm period as is the case for the rest of the sea areas, but during the whole year (Figure 6). This can be attributed to the frequent advection of cold masses from the neighboring continental areas of the Balkans to the Aegean via the frequent northeasterly winds in winter. This justification is also supported by the negative anomalies of the zonal and meridional wind components in winter. In the warm period, it is seen that the daytime meridional wind component anomalies are remarkably higher than the nighttime ones, which can be attributed to the effect of the southerly sea breeze from the Aegean to the coasts of Macedonia and Thrace and the weak etesian winds (relative to the rest of the Aegean Sea). Regarding the rest of the parameters, cloud cover is slightly above the spatial average, while CAPE and CIN are higher than the spatial average during late spring and early summer.
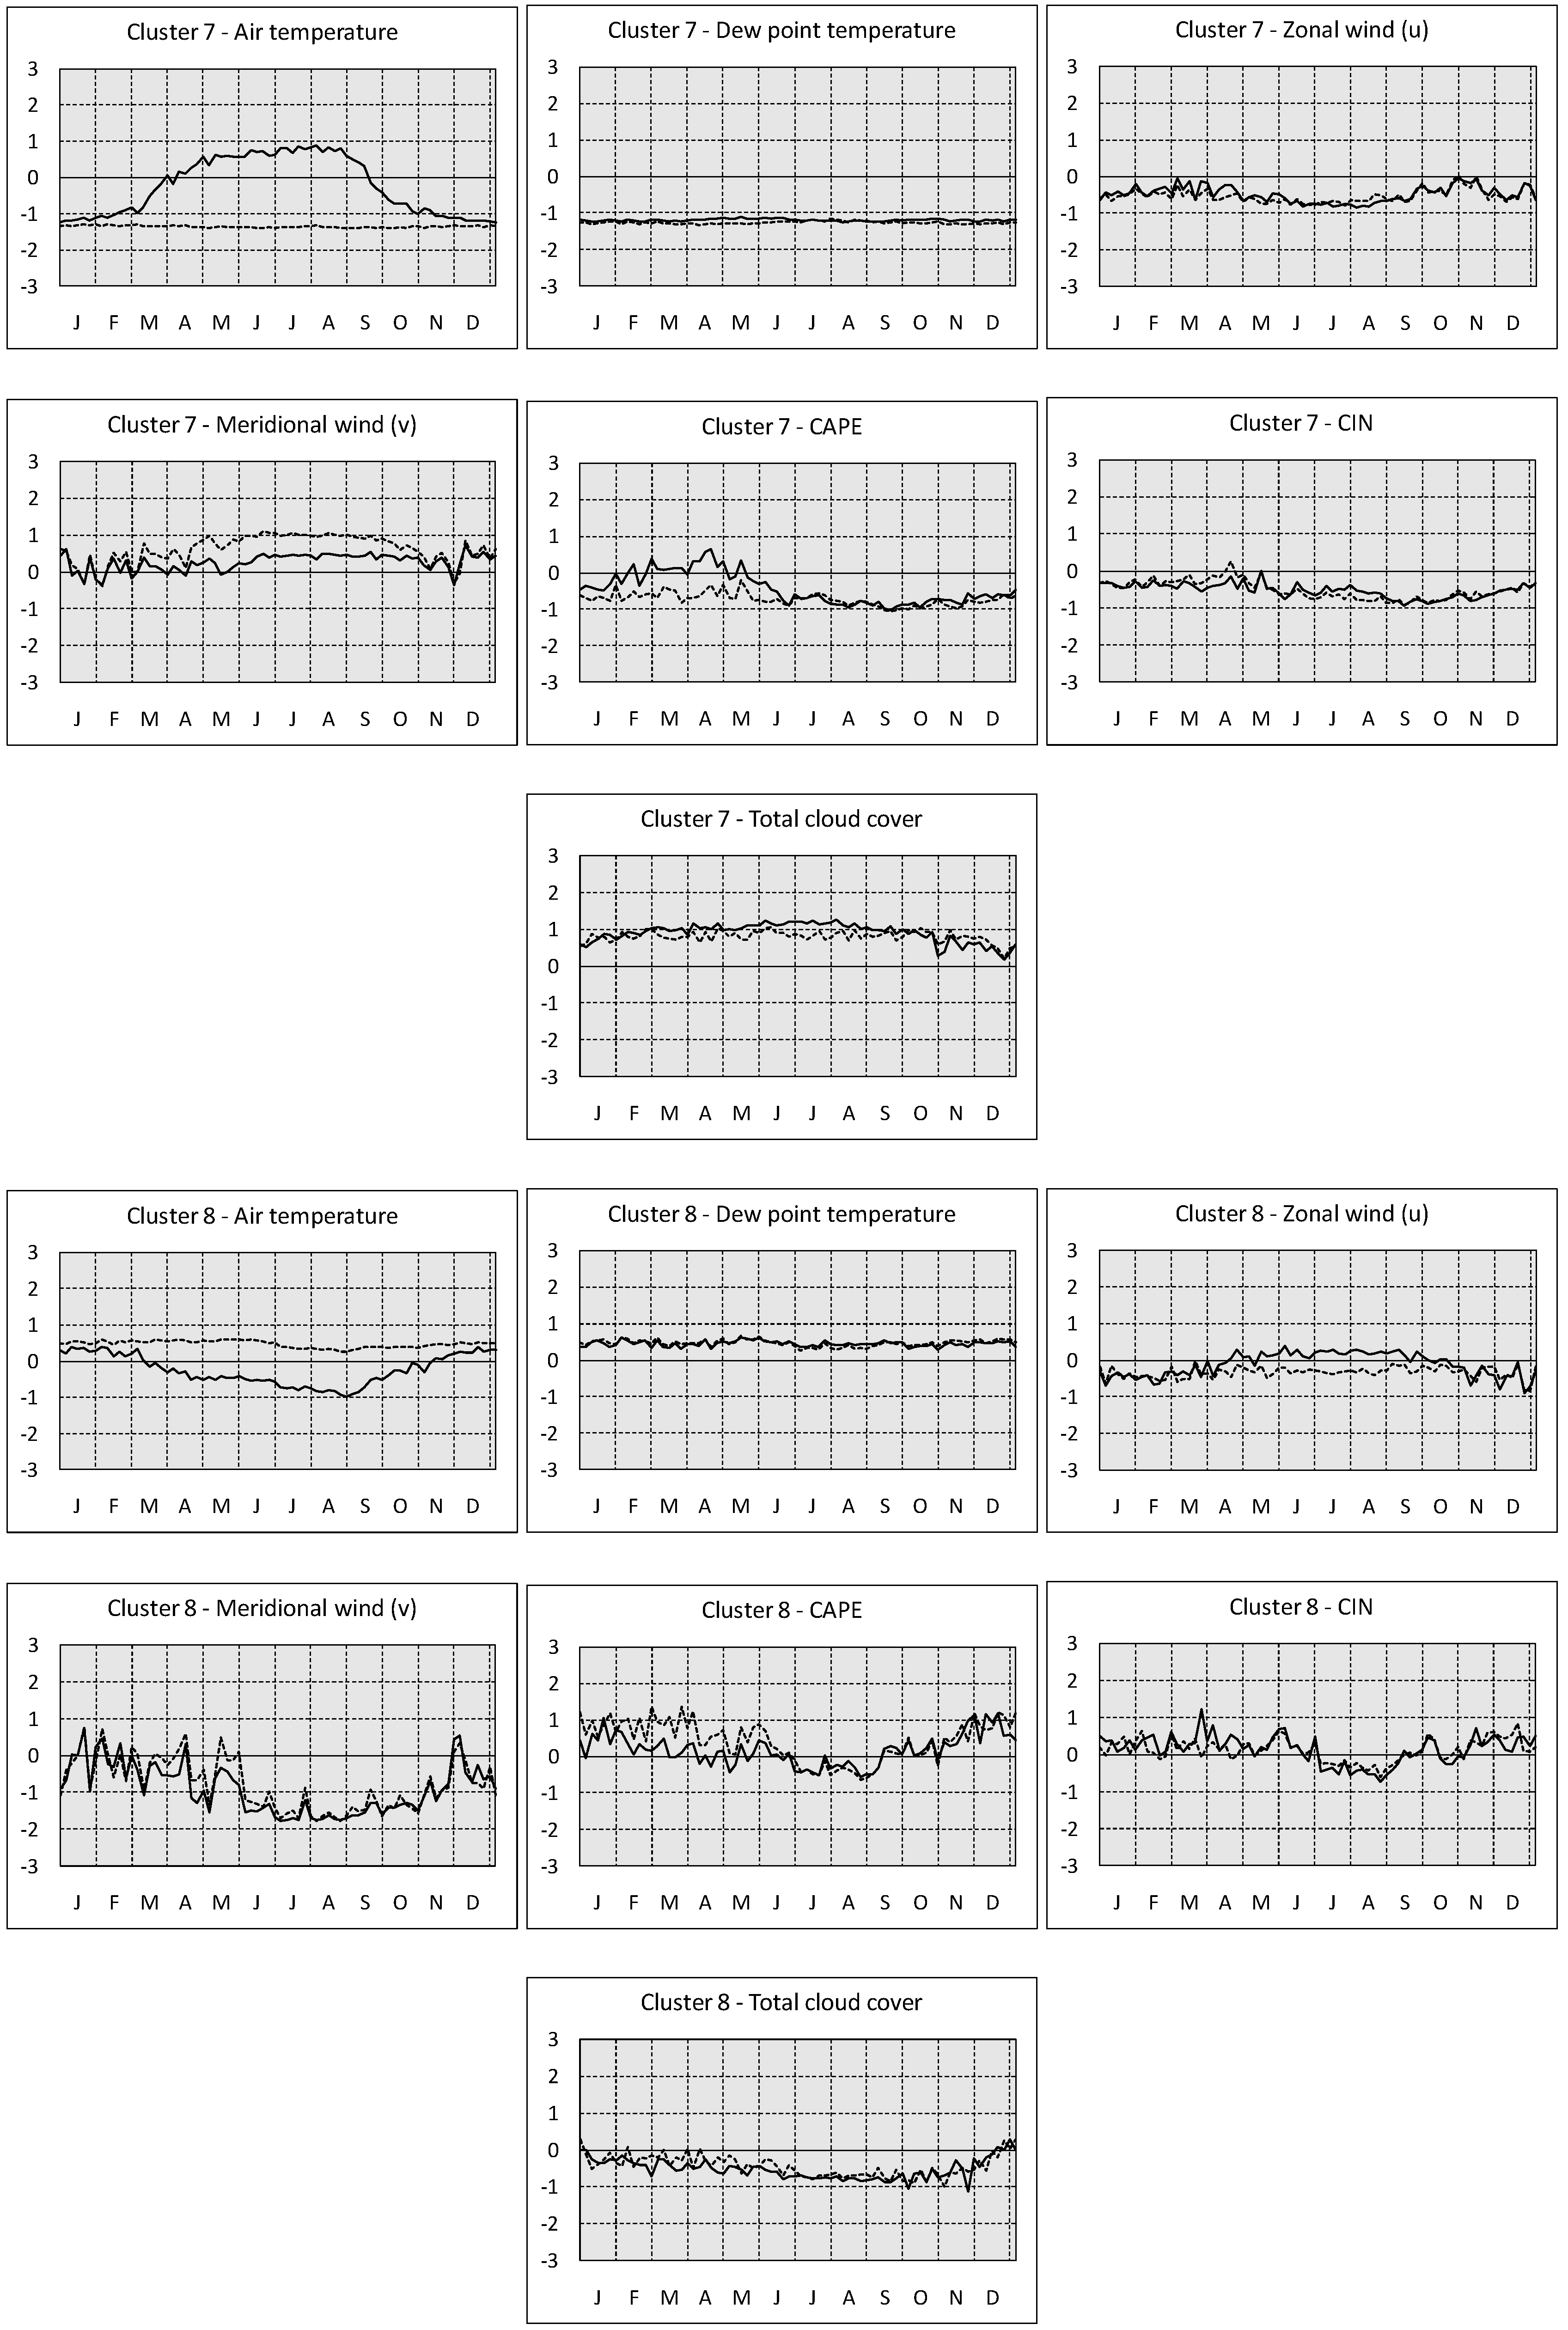
Cluster 7 comprises inland areas which are mainly areas of intermediate altitudes between the plains and the mountainous ones (Figure 3). Such areas are shown over both the Balkan Peninsula and northwestern Asia Minor. According to the intra-annual variation of the anomalies (Figure 7), their climate is characterized by low temperatures during winter and high daytime and low nighttime temperatures during summer. The low nighttime temperature anomalies prevailing during the whole year are connected to the inland character of the areas favoring nighttime radiative cooling and the presence of high altitude mountainous areas in their vicinity favoring the development of mountain breezes. Another characteristic of cluster 7 is the high cloud cover values associated with the windward character of the regions favoring the formation of orographic clouds in the cold period and the inland character of the region favoring convective cloud development in the warm period [1].
Cluster 8 comprises the area of central and eastern Aegean Sea (Figure 3), which presents most of the climate characteristics found for the rest of sea areas. The remarkable difference between daytime and nighttime temperature anomalies during summer and the high dew point anomalies during the whole year are among these characteristics, while furthermore it has to be noted that the high negative meridional wind anomalies are in agreement with the fact that the north etesian winds are very frequent, persistent, and strong over this area [32].
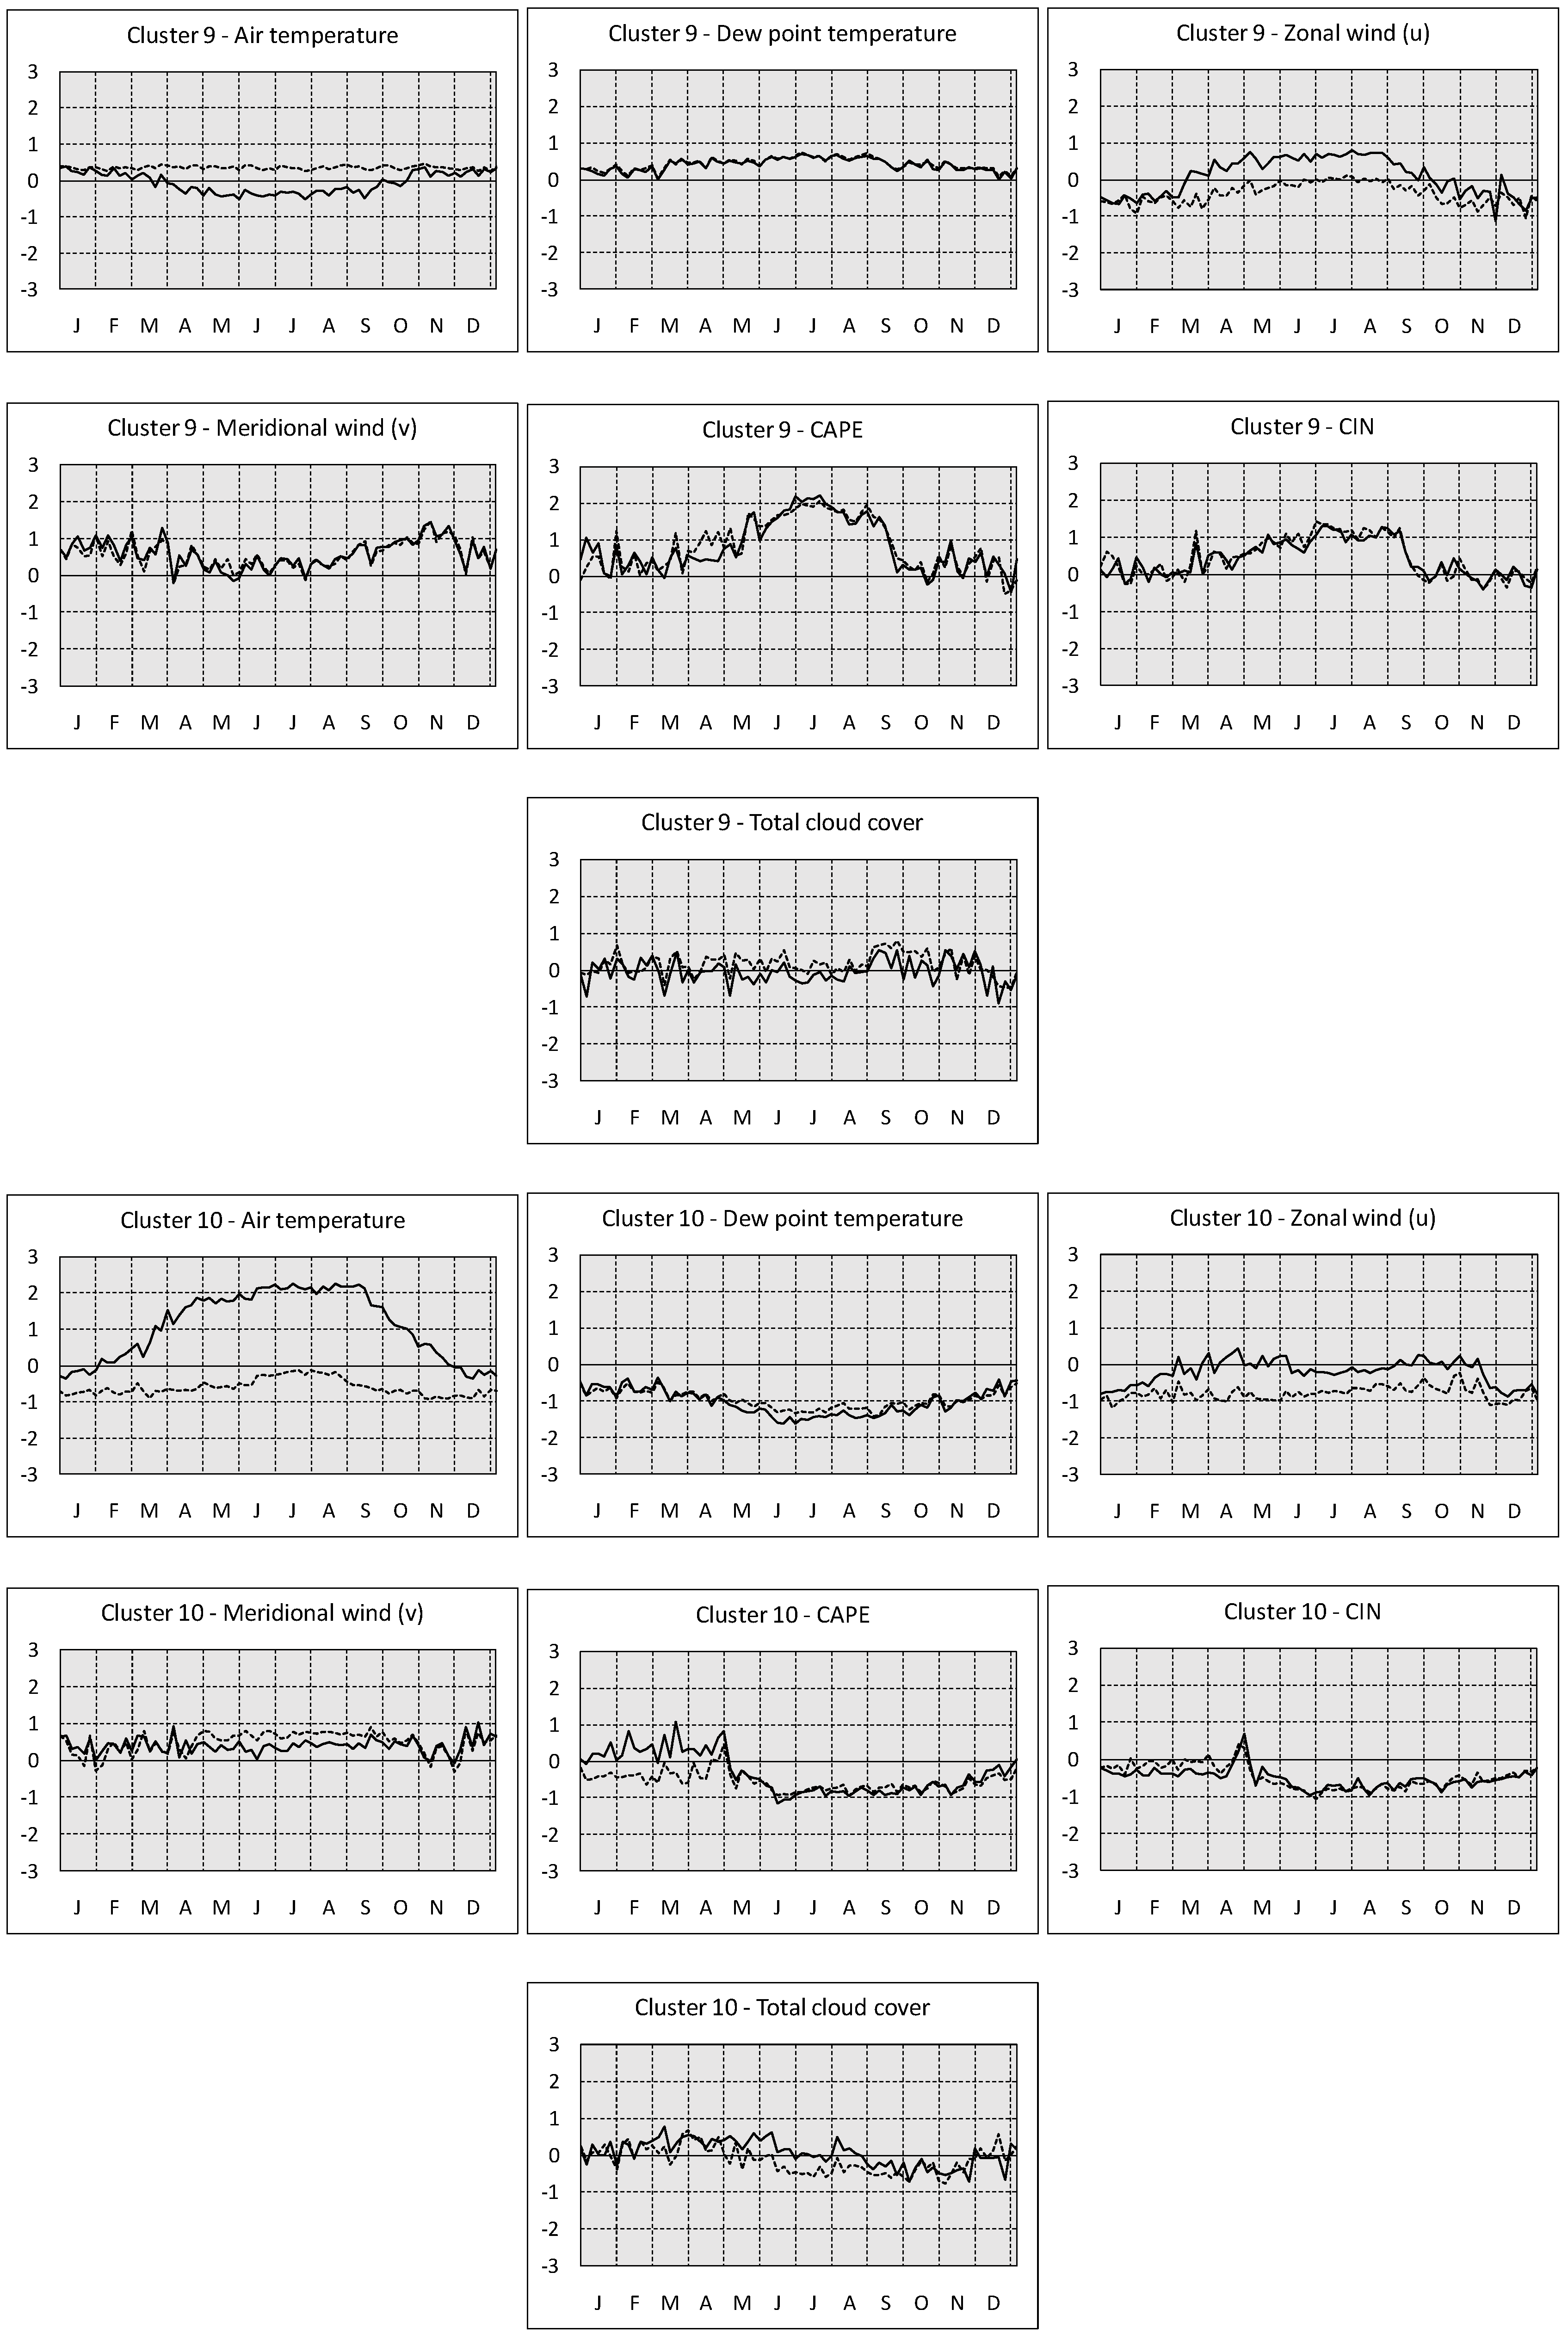
Cluster 9 corresponds to the north Ionian Sea and the coasts of northwestern Greece and Albania (Figure 3). The main characteristics of the seasonal variations of the anomalies (Figure 8) are (i) the difference between daytime and nighttime air temperatures in summer, which has been found for most sea areas; (ii) the difference between daytime and nighttime zonal wind component anomalies in the warm period, which is due to the sea breeze circulation between the Ionian Sea and the Balkan Peninsula; and (iii) the broad and strong summer maximum of CAPE (approximately two standard deviations above the spatial average), which in agreement with the climatology of CAPE in the Mediterranean region [30].
Cluster 10 comprises the areas of northwestern Peloponnese and southwestern Asia Minor (Figure 3). These areas are characterized by very high daytime air temperature in the warm period of the year relative to the spatial average, low values of dew point during the whole year, low values of CAPE and CIN during summer and autumn, and approximately one standard deviation difference between daytime and nighttime zonal wind anomalies (Figure 8). The high 12UTC summer temperature anomalies are due to the intense land warming and the katabatic character of the etesian winds over the above areas.
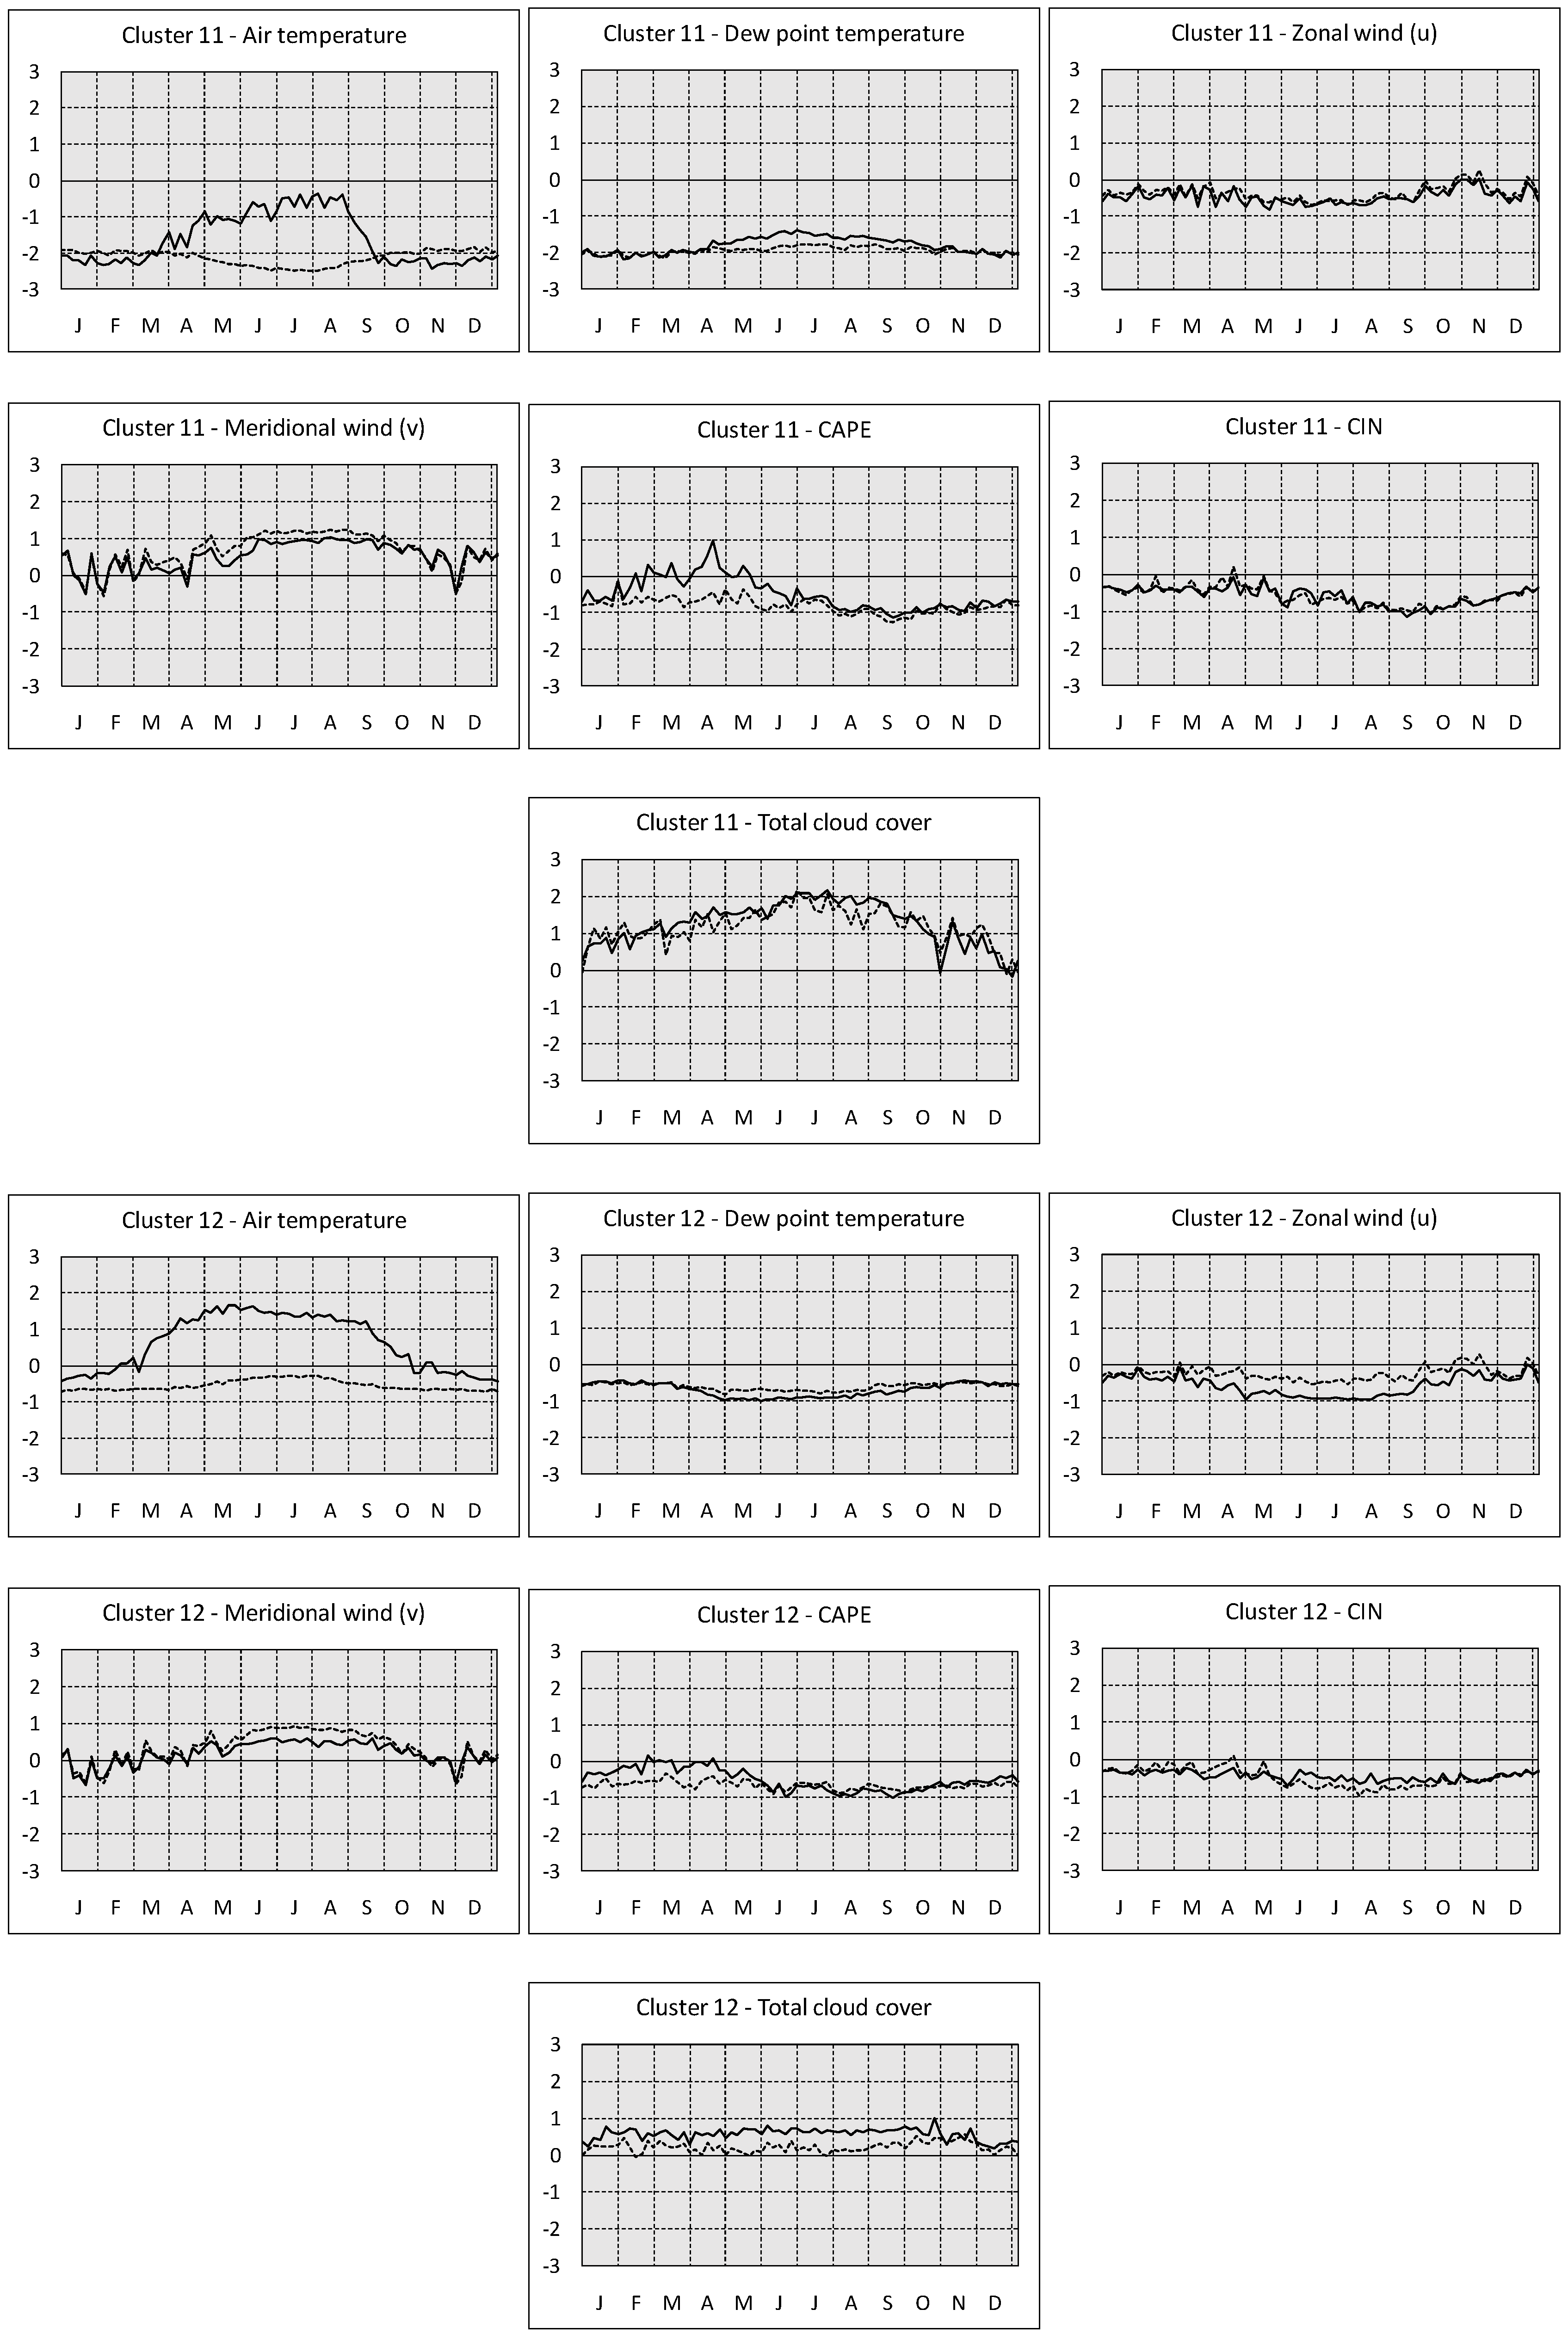
Cluster 11 corresponds to the high altitude mountainous areas of the southern Balkans, which include the Pindus and Rodopi mountain ranges (Figure 3). The very low air temperature and dew point values and the very high values of cloudiness relatively to the spatial averages are the main climate characteristics of these areas. Also, the spring maximum of daytime CAPE is responsible for the frequent appearance of air mass thunderstorms during the same season, as this maximum is not accompanied by a corresponding maximum of CIN (Figure 9).
Cluster 12 comprises mainly the plains of eastern Greek mainland, Thrace, and Crete (Figure 3). The climate over these areas is relatively warm and dry during the whole year as it can be seen in the seasonal variations of temperature and dew point. Furthermore, upper air static stability appears to be stronger relatively to the other areas, while cloud cover is slightly higher than the spatial average, especially at noon (Figure 9).
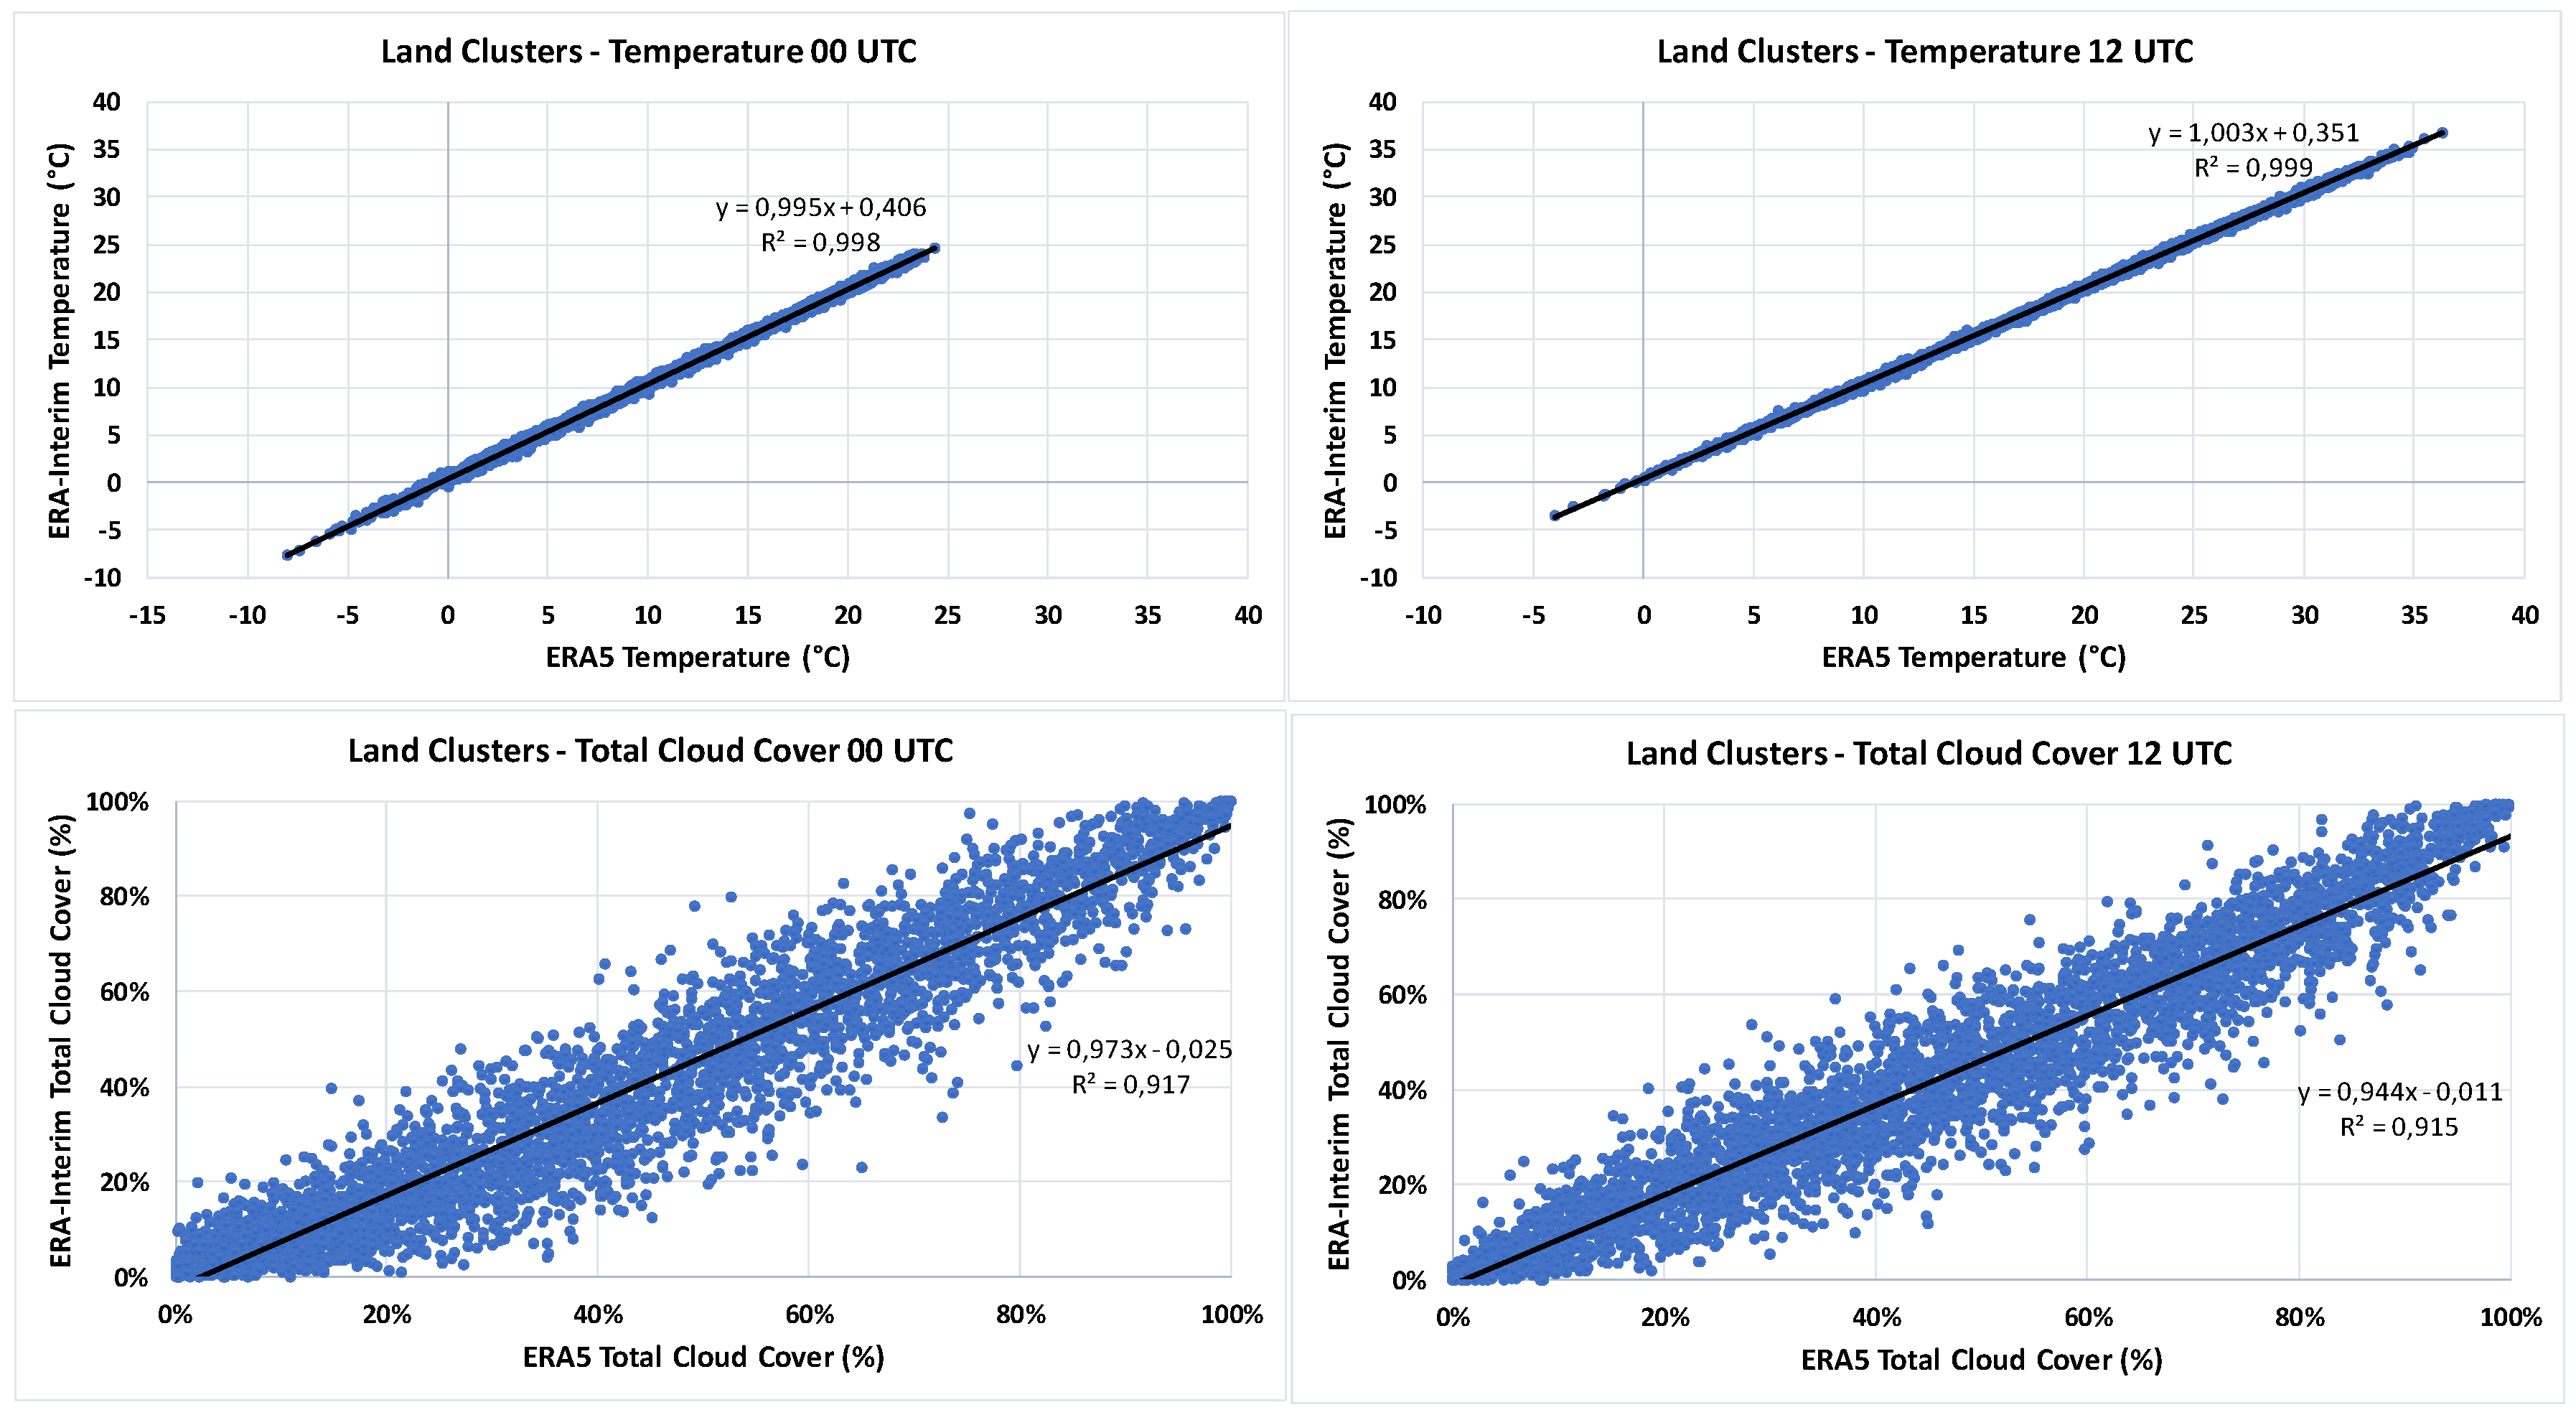
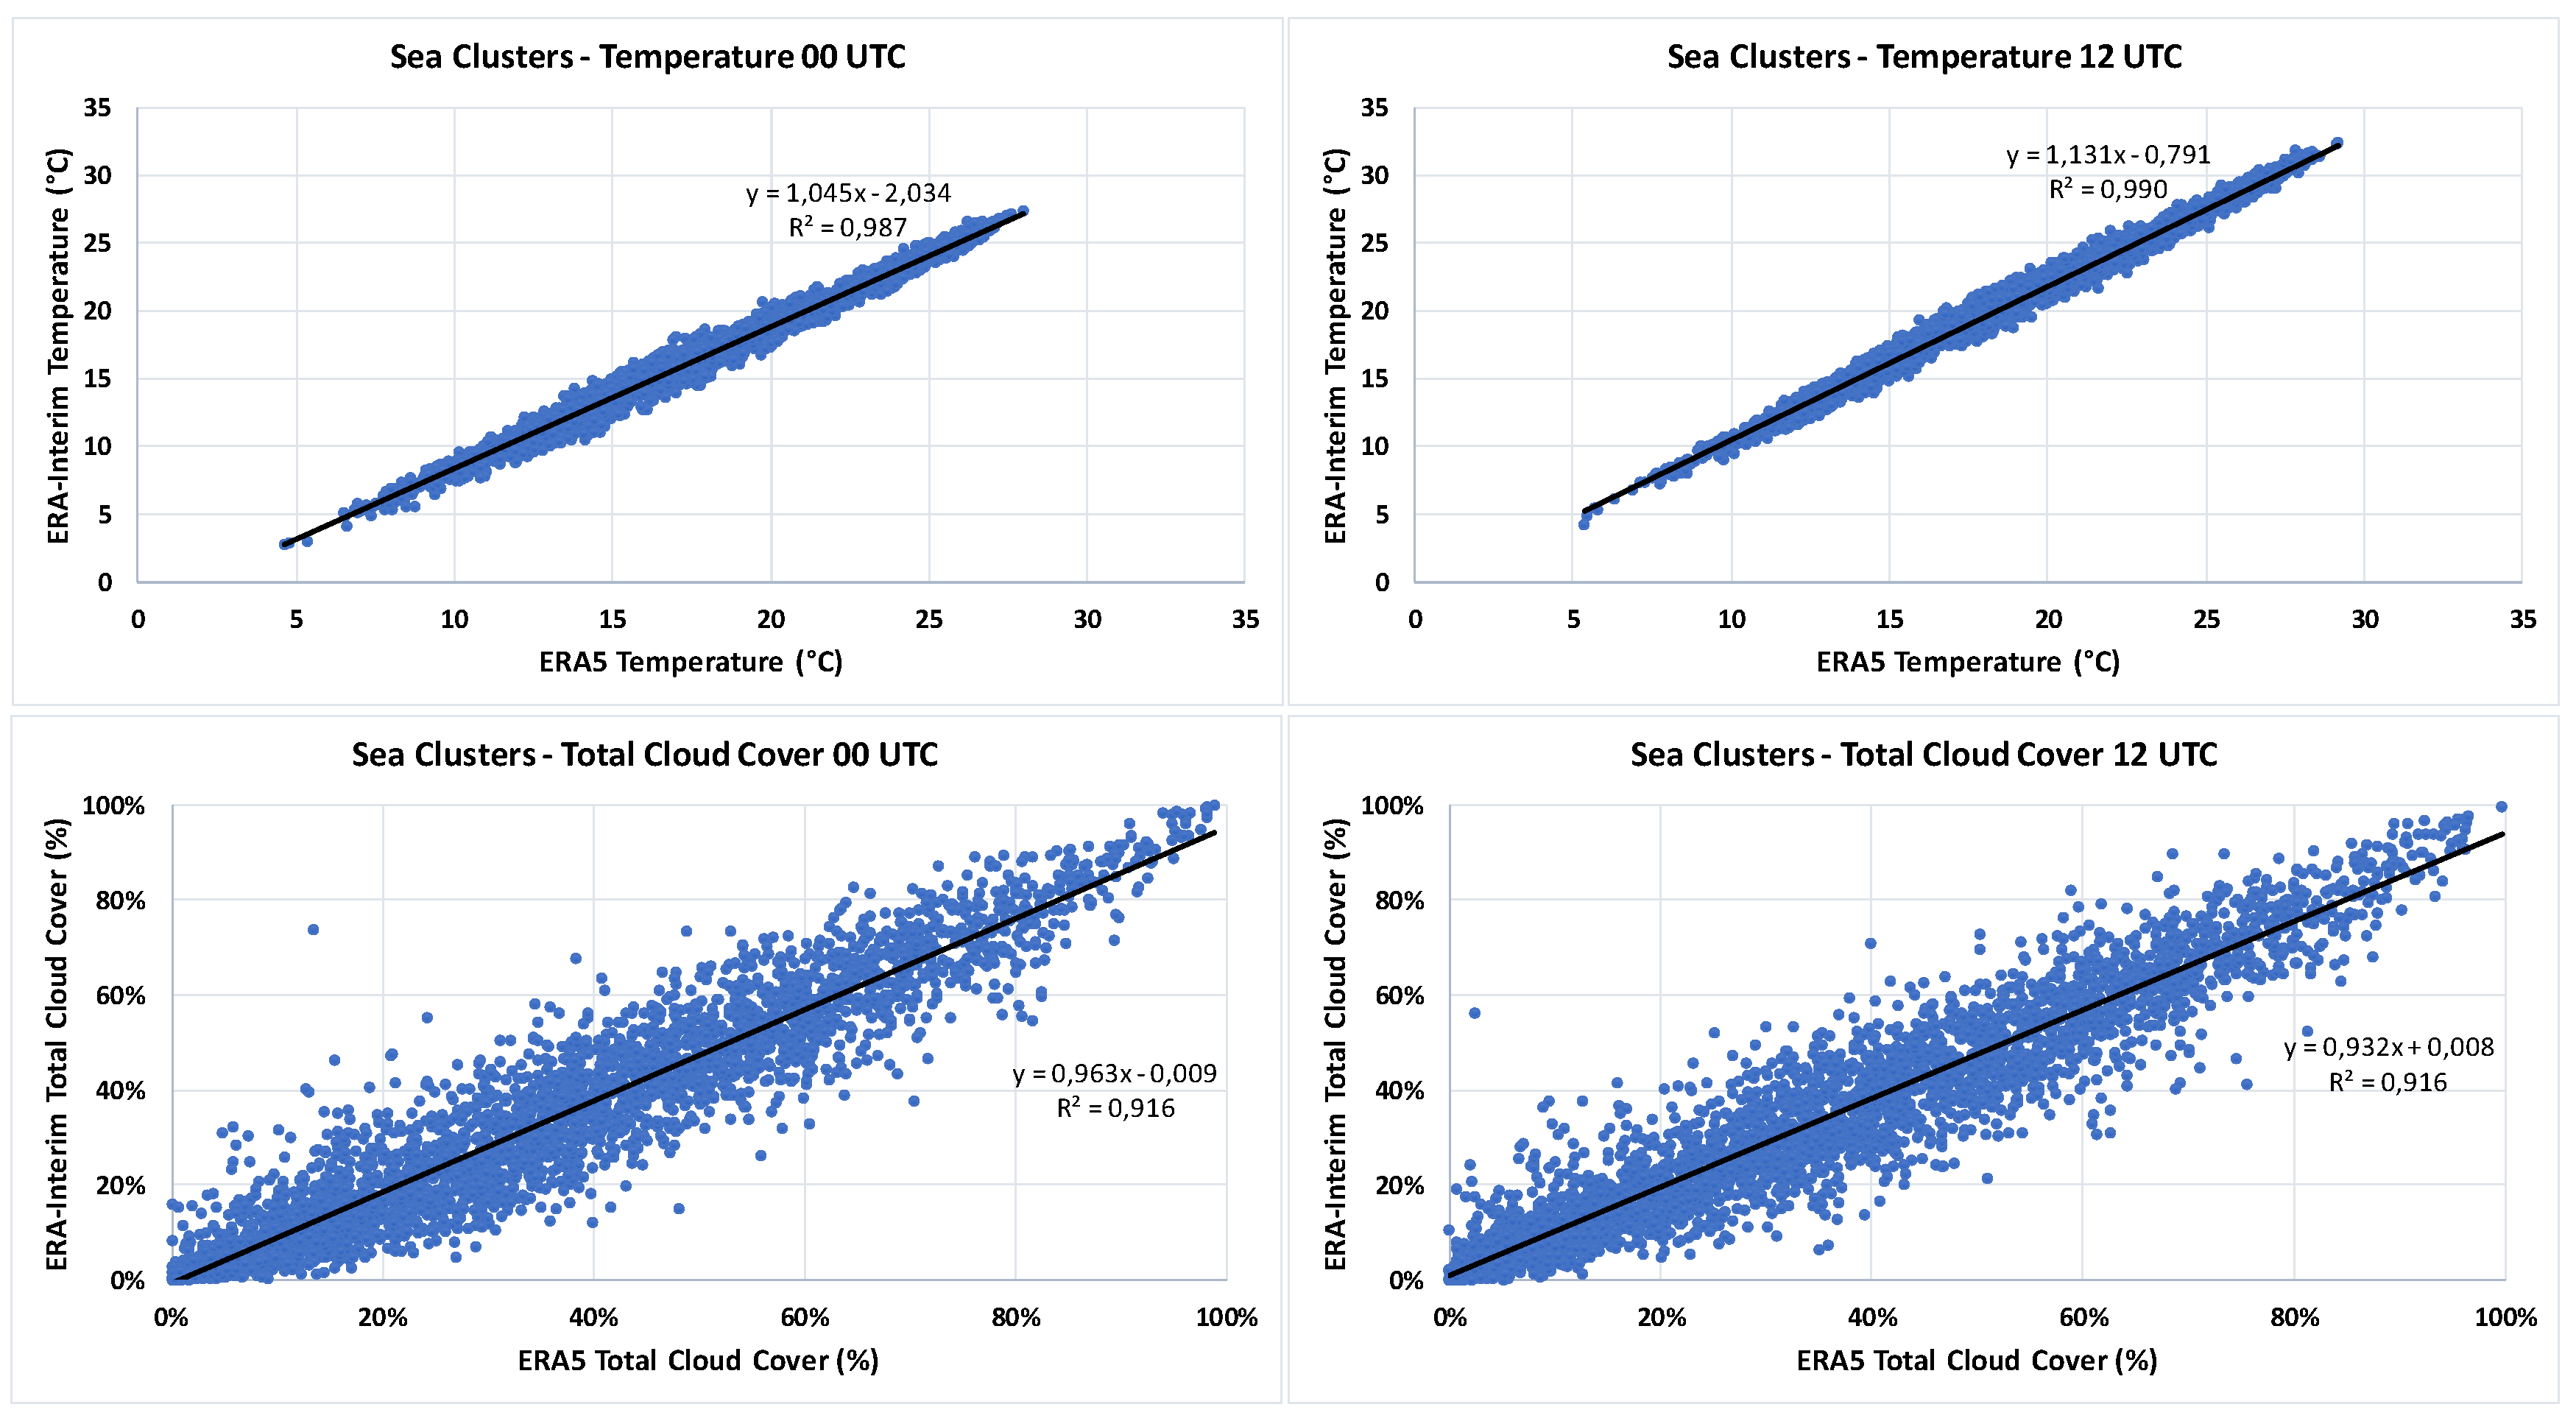
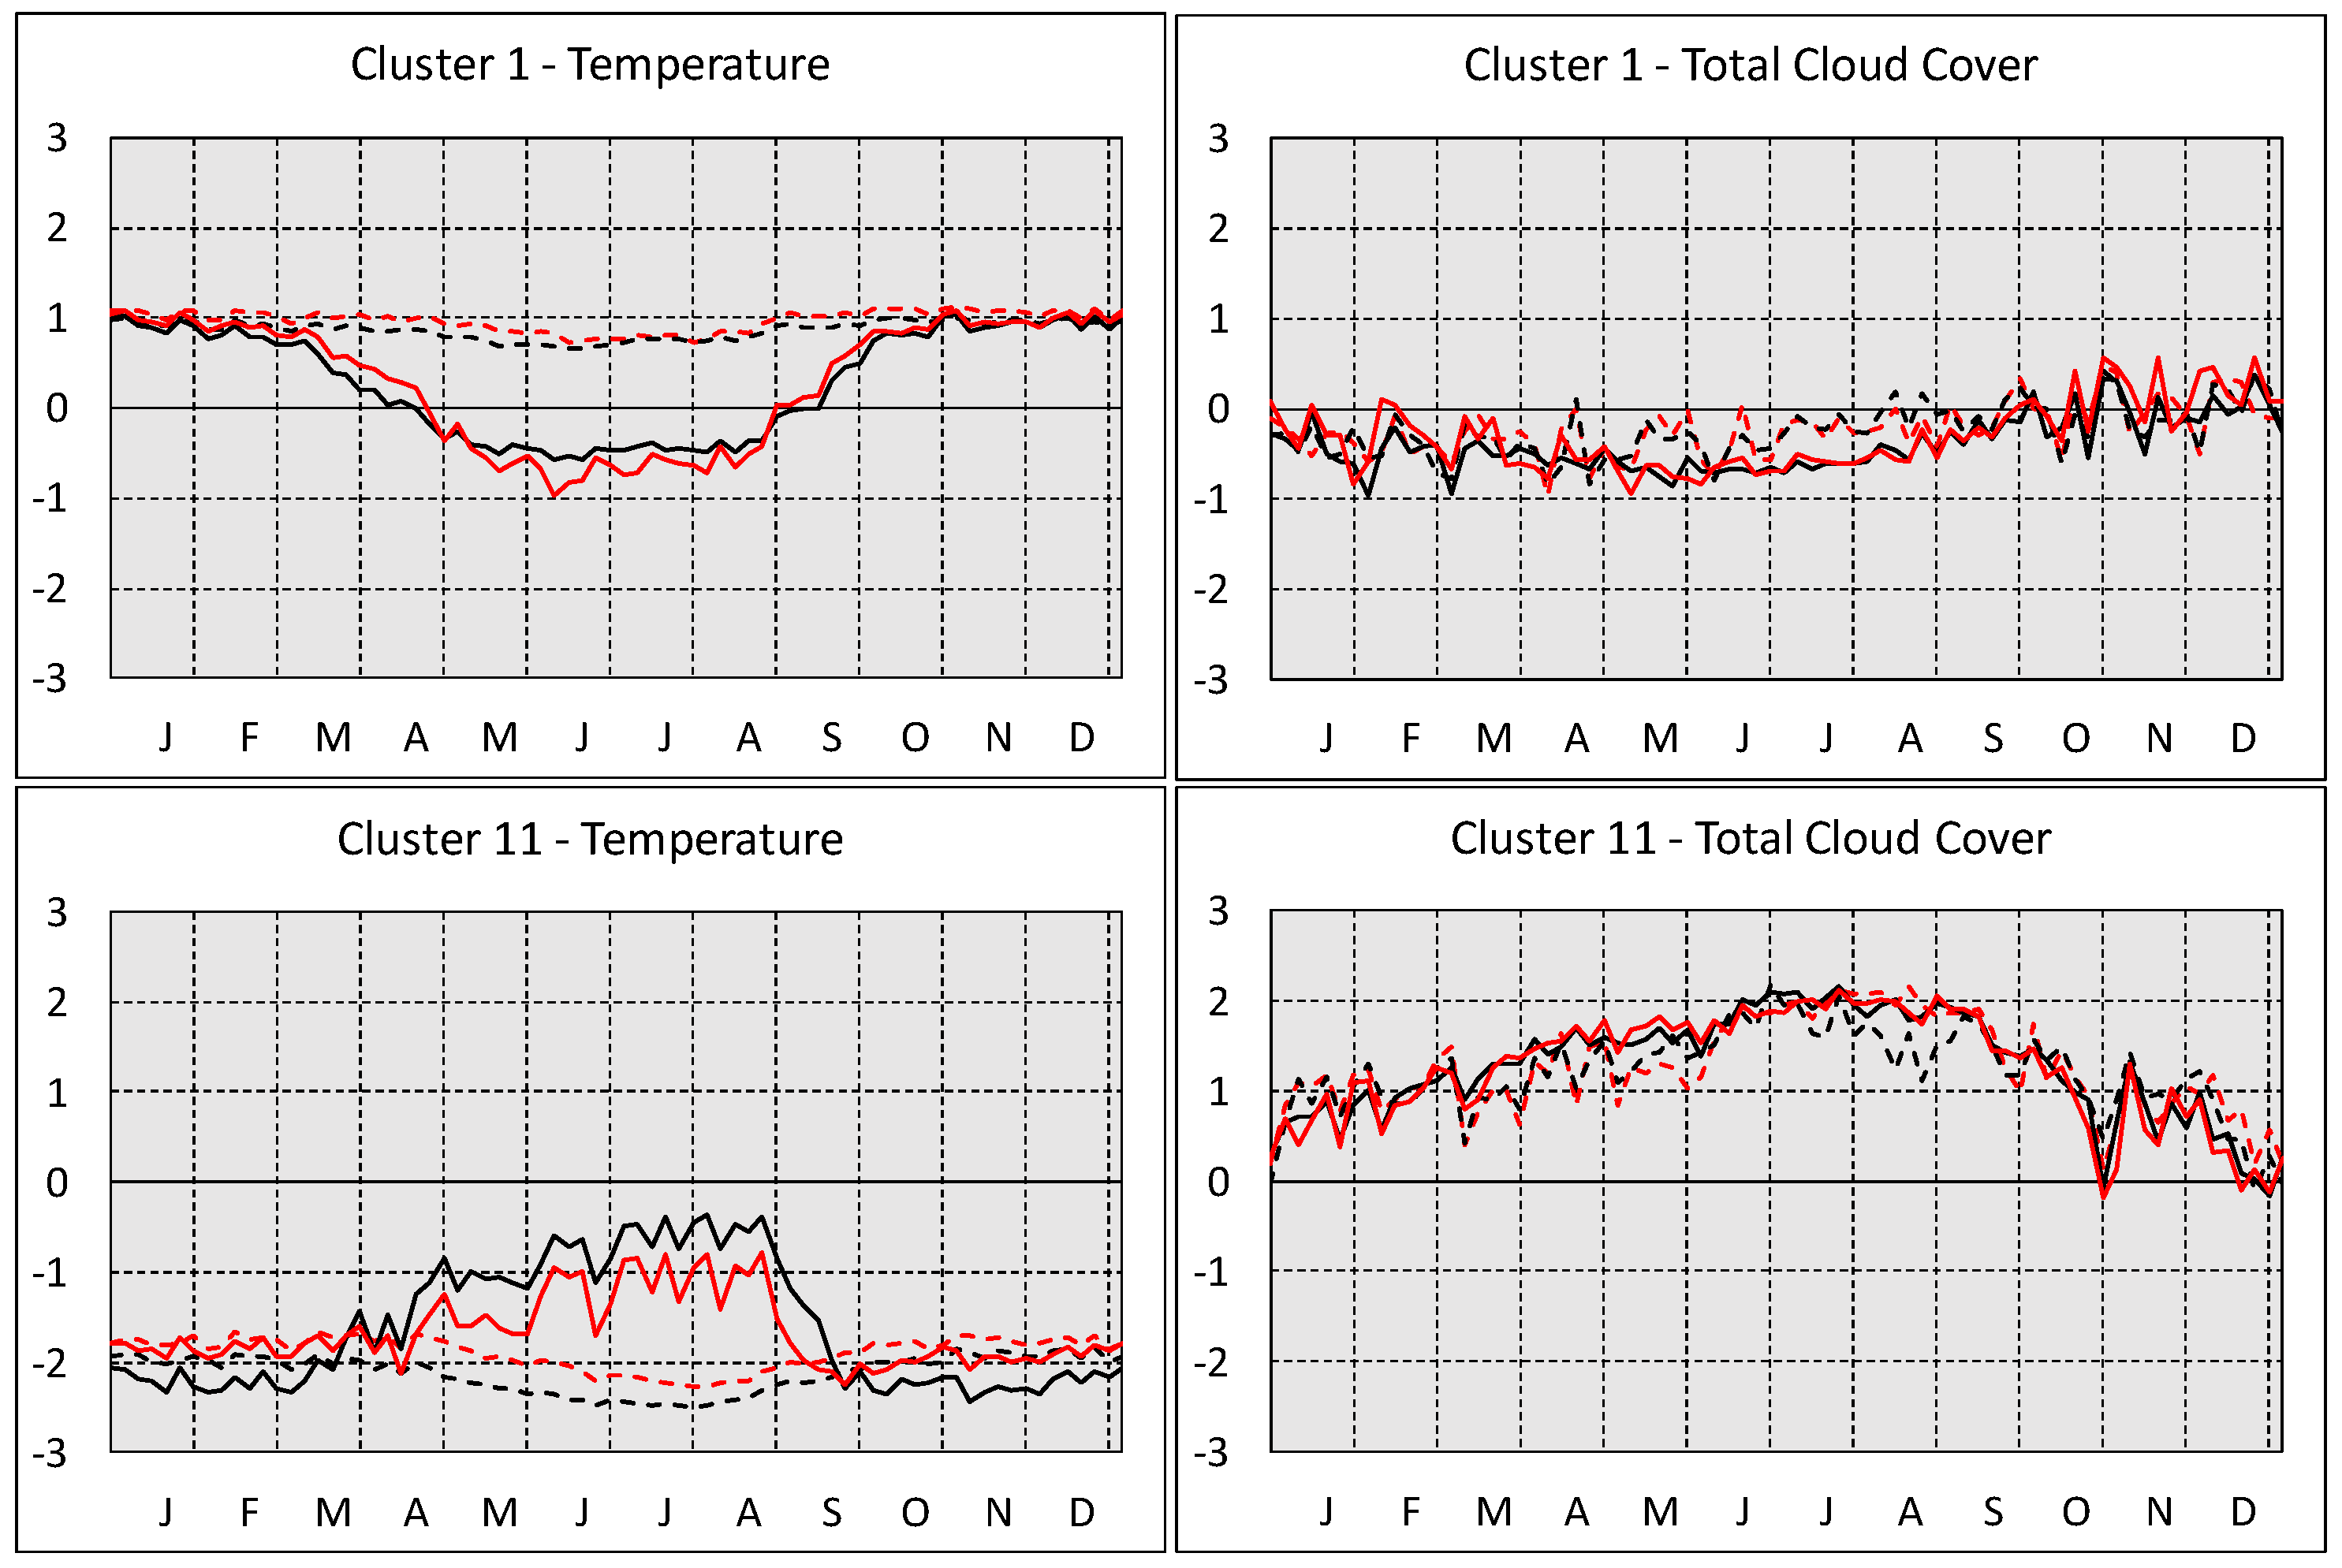
Finally, in order to validate the results that are based on the ERA5 database, an attempt is made to compare them with that of the ERA-Interim database. The ERA-Interim data used refer to 1° × 1° grid point values and the parameters of air temperature and total cloud cover (00UTC and 12UTC) are selected as an example. The 12 clusters are separated into two categories: land (clusters 7, 10, 11, and 12) and sea (clusters 1, 2, 3, 4, 5, 6, 8, and 9). For the integer coordinates of the two datasets (the common grid points) and for the above two parameters, the scatterplots of the spatial mean daily values are constructed and are presented for the land and sea clusters in Figure 10 and Figure 11. According to the results, there is a very high linear correlation between the two datasets for both land and sea areas: R2 is higher than 0.98 for air temperature, while it is equal to 0.92 for cloud cover. These values imply a high degree of covariability between the two data sets even for cloud cover, which is a very sensitive parameter to the variations of dynamic and geomorphologic factors. The agreement between the two data sets is also reflected to the mean intra-annual variations of the spatial anomalies of air temperature and total cloud cover for the 12 clusters. These variations have been calculated also for ERA-Interim data set for all clusters and the results are found to be similar to the ones of ERA5. The small differences found can be mainly attributed to the different resolution of the data sets. In Figure 12, an example of this comparison is presented for clusters 1 and 11, which correspond to sea and mountainous areas, respectively. As it can be seen, the intra-annual variations of air temperature and cloud cover for both 00UTC and 12UTC are quite similar and this is also supported by the corresponding correlation coefficients. For cluster 1, these correlation coefficients are 0.95 and 0.99 for 00UTC and 12UTC air temperature and 0.81 and 0.88 for 00UTC and 12UTC total cloud cover, respectively. The corresponding coefficients for cluster 11 are 0.94 and 0.90 for 00UTC and 12UTC air temperature and 0.89 and 0.98 for 00UTC and 12UTC total cloud cover, respectively. The high correlation coefficients enhance the reliability of the results and confirm the suitability of both data sets for such climatic studies.
4. Discussion
The division of the southern Balkans into 12 areas with characteristic homogeneous climatic characteristics confirms the significant spatial variability of climate, which is directly connected to the complicated coastline and relief of the greater region. For each area, the deviations of the climatic parameters from the spatial averages have to be examined and interpreted taking into account that some spatial averages can be affected by the portion between land and sea coverage of the geographical domain. The 12 areas can be generally distributed into two groups depending on whether they are sea or land areas. The first group consists of eight areas which are mainly over the sea, while the second group consists of the rest four areas which are over the land. The areas of each group present some common characteristics that they are connected to the effect of land or sea surface to the temperature, humidity, or stability characteristics of the overlying air, but they also present significant differences based on the specific geographical position, atmospheric circulation, orientation, latitude, and altitude characteristics of each area. The sea areas are generally characterized by (i) high dew point values due to the high evaporation rates which lead to saturation conditions and (ii) low summer daytime temperatures relatively to the land areas due to the high thermal capacity and conductivity of the water. Their differences refer mainly to the wind, cloud cover, and stability characteristics, which are significantly affected by the latitude and their location relatively to large-scale circulation systems (extend of the Azores high, Asian thermal low, etc.) [20,21] being responsible for the prevalence of specific wind regimes, for example the etesian winds [31]. On the other hand, the land areas are generally characterized by (i) high summer daytime temperatures relatively to the sea areas due to the low thermal capacity and conductivity of soil, (ii) low dew point values because of the lower evaporation rates relatively to the sea areas, and (iii) static instability maxima in spring associated with the high solar radiation and lapse rate values during this season. Their differences refer mainly to wind, static and dynamic instability, and cloud cover regimes, which are significantly affected by the orientation and the altitude of the areas via their effect on the orographic cloud development and the lifted condensation level [33]. The climatologically homogenous areas and their geographical borders present both similarities and differences compared with the results of the recent climate regionalization made by Nojarov [21], but it has to be taken into account that Nojarov has made the regionalization using sea level pressure, while in the present work a set of meteorological parameters including temperature, cloudiness, etc., over the study area is used.
Also, it has to be mentioned that the above characteristics of the 12 regions refer to the 10-year period of 2008 to 2017 and may present significant deviations from the corresponding climate characteristics of the past and the future decades. The derived 2008–2017 regional characteristics could simply be an expression of coinciding several dynamical factors (i.e., North Atlantic Oscillation, teleconnection with Indian monsoon, and climate change), which can sometimes hinder or amplify the derived spatial relationships/features. In order to detect such deviations, data availability for a very longer period and climate simulations for the future decades are needed [34,35,36].
The special type of climatic classification, which has been achieved in the present study with the use of the recently released ERA5 high resolution data set, can be considered as an initial attempt for climate classifications using high resolution grid point data. As mentioned above, such a classification can be significantly improved in the future when the database will have been extended to the past and a longer data period will be available (now only available from 2008). This will allow the incorporation of precipitation data in the classification, which is not used at the moment because of (i) the fact that they consist of forecast and not of analysis values and (ii) the relatively short 10-year period does not allow the establishment of the main statistical parameters, including the long-term averages. However, the study provides significant evidence about the spatial variability of the climate and it can be considered as a useful tool by the scientists dealing with the Mediterranean climate. Also, it has to be taken into account that the spatial variations of the associated parameters might change under the influence of the ongoing climatic change [37].
5. Conclusions
In the present work an objective definition of 12 climatologically homogeneous areas in the southern Balkans has been carried out for the 10-year period of 2008 to 2017 with the use of 0.25° × 0.25° ERA5 meteorological data and the following main conclusions can be drawn.
- The high resolution of the ERA5 data set reveal spatial variations in climate which are connected to the complicated relief of the region and cannot be adequately described with the use of a low resolution data set.
- The geographical distribution of land and sea is one of the dominant factors affecting the definition and the geographical borders of the 12 areas.
- The complicated geographical relief of the area being responsible for the windward or leeward character of the various subregions affects significantly the spatial distribution of humidity and cloud cover.
- There are significant differences between nighttime and daytime cloud cover over the land areas. The low thermal capacity and conductivity of the soil allow the significant influence of daytime radiative heating of its surface on the temperature and static stability regimes of the lowest atmospheric layers, regulating convection and cloud development.
- There are significant differences between nighttime and daytime wind regimes, especially near the coasts. These differences are associated with the development of diurnal small-scale circulations between land and sea (see breezes).
- The main climatic characteristics of the 12 areas for the above period have been also confirmed with the use of the ERA-Interim data base. Strong similarity is found between the ERA5 and the ERA-Interim results. The small differences that exist are mainly associated to the different resolution of the data sets.
- A time extension of the high resolution data set to the past would allow the full establishment of the statistical parameters associated with the climate of the region.
- The effect of the future climate change on the characteristics of the 12 areas revealed in the present work can be examined using also the results of climate model simulations and it is an interesting subject for a future research work.
Author Contributions
Conceptualization, C.J.L.; Methodology, C.J.L. and G.K.; Data Curation, G.K.; Writing—Original draft preparation, C.J.L.; Writing—Review and editing, C.J.L., G.K., and A.B.; Visualization, G.K.; Supervision, A.B.
Funding
This research received no external funding.
Acknowledgments
Acknowledgement is made for the use of ECMWF’s computing and archive facilities in this research, generated using Copernicus Climate Change Service information [2018].
Conflicts of Interest
The authors declare no conflicts of interest.
References
- Ioannidis, E.; Lolis, C.J.; Papadimas, C.D.; Hatzianastassiou, N.; Bartzokas, A. On the intra-annual variation of cloudiness over the Mediterranean region. Atmos. Res. 2018, 208, 246–256. [Google Scholar] [CrossRef]
- Galanaki, E.; Kotroni, V.; Lagouvardos, K.; Argiriou, A. A ten-year analysis of cloud-to-ground lightning activity over the Eastern Mediterranean region. Atmos. Res. 2015, 166, 213–222. [Google Scholar] [CrossRef]
- Hatzianastassiou, N.; Papadimas, C.D.; Lolis, C.J.; Bartzokas, A.; Levizzani, V.; Pnevmatikos, J.D.; Katsoulis, B.D. Spatial and temporal variability of precipitation over the Mediterranean Basin based on 32-year satellite global precipitation climatology project data, part I: Evaluation and climatological patterns. Int. J. Climatol. 2016, 36, 4741–4754. [Google Scholar] [CrossRef]
- Ziv, B.; Saaroni, H.; Alpert, P. The factors governing the summer regime of the eastern Mediterranean. Int. J. Climatol. 2004, 24, 1859–1871. [Google Scholar] [CrossRef] [Green Version]
- Harpaz, T.; Ziv, B.; Saaroni, H.; Beja, E. Extreme summer temperatures in the East Mediterranean—Dynamical analysis. Int. J. Climatol. 2014, 34, 849–862. [Google Scholar] [CrossRef]
- Davis, R.E.; Hayden, B.P.; Gay, D.A.; Phillips, W.L.; Jones, G.V. The North Atlantic subtropical anticyclone. J. Clim. 1997, 10, 728–744. [Google Scholar] [CrossRef]
- Tyrlis, E.; Lelieveld, J.; Steil, B. The summer circulation over the eastern Mediterranean and the Middle East: Influence of the South Asian monsoon. Clim. Dyn. 2013, 40, 1103–1123. [Google Scholar] [CrossRef]
- Cherchi, A.; Annamalai, H.; Masina, S.; Navarra, A. South Asian Summer Monsoon and the Eastern Mediterranean Climate: The Monsoon–Desert Mechanism in CMIP5 Simulations. J. Clim. 2014, 27, 6877–6903. [Google Scholar] [CrossRef]
- Wanner, H.; Brönnimann, S.; Casty, C.; Gyalistras, D.; Luterbacher, J.; Schmutz, C.; Stephenson, D.B.; Xoplaki, E. North Atlantic Oscillation—Concepts and studies. Surv. Geophys. 2001, 22, 321–382. [Google Scholar] [CrossRef]
- Nasr-Esfahany, M.A.; Ahmadi-Givi, F.; Mohebalhojeh, A.R. An energetic view of the relation between the Mediterranean storm track and the North Atlantic Oscillation. Q. J. R. Meteorol. Soc. 2011, 137, 749–756. [Google Scholar] [CrossRef] [Green Version]
- Thompson, D.W.J.; Wallace, J.M. The Arctic Oscillation signature in the wintertime geopotential height and temperature fields. Geophys. Res. Lett. 1998, 25, 1297–1300. [Google Scholar] [CrossRef]
- Grassi, B.; Redaelli, G.; Visconti, G. Arctic sea ice reduction and extreme climate events over the Mediterranean region. J. Clim. 2013, 26, 10101–10110. [Google Scholar] [CrossRef]
- Kutiel, H.; Maheras, P.; Türkeş, M.; Paz, S. North Sea—Caspian Pattern (NCP)—An upper level atmospheric teleconnection affecting the eastern Mediterranean—Implications on the regional climate. Theor. Appl. Climatol. 2002, 72, 173–192. [Google Scholar] [CrossRef]
- Kutiel, H.; Benaroch, Y. North Sea-Caspian pattern (NCP)—An upper level atmospheric teleconnection affecting the Eastern Mediterranean: Identification and definition. Theor. Appl. Climatol. 2002, 71, 17–28. [Google Scholar] [CrossRef]
- Kotsias, G.; Lolis, C.J. A study on the total cloud cover variability over the Mediterranean region during the period 1979–2014 with the use of the ERA-Interim database. Theor. Appl. Climatol. 2018, in press. [Google Scholar] [CrossRef]
- Hertig, E.; Jacobeit, J. Considering observed and future non-stationarities in statistical downscaling of Mediterranean precipitation. Theor. Appl. Climatol. 2015, 122, 667–683. [Google Scholar] [CrossRef]
- Paxian, A.; Hertig, E.; Seubert, S.; Vogt, J.; Jacobeit, J.; Paeth, H. Present-day and future Mediterranean precipitation extremes assessed by different statistical approaches. Clim. Dyn. 2014, 44, 845–860. [Google Scholar] [CrossRef]
- Lolis, C.J. High-resolution precipitation over the southern Balkans. Clim. Res. 2012, 55, 167–179. [Google Scholar] [CrossRef]
- Gatidis, C.; Lolis, C.J.; Lagouvardos, K.; Kotroni, V.; Bartzokas, A. On the seasonal variability and the spatial distribution of lightning activity over the broader Greek area and their connection to atmospheric circulation. Atmos. Res. 2018, 208, 180–190. [Google Scholar] [CrossRef]
- Kostopoulou, E.; Jones, P.D. Comprehensive analysis of the climate variability in the eastern Mediterranean. Part I: Map-pattern classification. Int. J. Climatol. 2007, 27, 1189–1214. [Google Scholar] [CrossRef]
- Nojarov, P.J. Genetic climatic regionalization of the Balkan Peninsula using cluster analysis. J. Geogr. Sci. 2017, 27, 43–61. [Google Scholar] [CrossRef]
- ERA5 Data Documentation. Available online: https://www.ecmwf.int/en/forecasts/datasets/archive-datasets/reanalysis-datasets/era5 (accessed on 11 September 2018).
- Jolliffe, I.T. Principal Component Analysis; Springer: New York, NY, USA, 1986. [Google Scholar]
- Richman, M.B. Rotation of principal components. J. Climatol. 1986, 6, 293–335. [Google Scholar] [CrossRef]
- Sharma, S. Applied Multivariate Techniques; Wiley: New York, NY, USA, 1995. [Google Scholar]
- Davis, R.E.; Walker, D.R. An upper air synoptic climatology of the western United States. J. Clim. 1992, 5, 1449–1467. [Google Scholar] [CrossRef]
- Kalkstein, L.S.; Nichols, M.C.; Barthel, C.D.; Greene, J.S. A new spatial synoptic classification: Application to air mass analysis. Int. J. Climatol. 1996, 16, 983–1004. [Google Scholar] [CrossRef]
- Sugar, A.C.; James, M.G. Finding the number of clusters in a dataset: An information—Theoretic approach. J. Am. Stat. Assoc. 2003, 98, 750–763. [Google Scholar] [CrossRef]
- Dee, D.P.; Uppala, S.M.; Simmons, A.J.; Berrisford, P.; Poli, P.; Kobayashi, S.; Andrae, U.; Balmaseda, M.A.; Balsamo, G.; Bauer, P.; et al. The ERA-Interim reanalysis: Configuration and performance of the data assimilation system. Q. J. R. Meteorol. Soc. 2011, 137, 553–597. [Google Scholar] [CrossRef]
- Lolis, C.J. A climatology of convective available potential energy in the Mediterranean region. Clim. Res. 2017, 74, 15–30. [Google Scholar] [CrossRef]
- Anagnostopoulou, C.; Zanis, P.; Katragkou, E.; Tegoulias, I.; Tolika, K. Recent past and future patterns of the Etesian winds based on regional scale climate model simulations. Clim. Dyn. 2014, 42, 1819–1836. [Google Scholar] [CrossRef]
- Tyrlis, E.; Lelieveld, J. Climatology and dynamics of the summer Etesian winds over the eastern Mediterranean. J. Atmos. Sci. 2013, 70, 3374–3396. [Google Scholar] [CrossRef]
- Saaroni, H.; Halfon, N.; Ziv, B.; Alpert, P.; Kutiel, H. Links between the rainfall regime in Israel and location and intensity of Cyprus lows. Int. J. Climatol. 2010, 30, 1014–1025. [Google Scholar] [CrossRef]
- Spinoni, J.; Vogt, J.V.; Barbosa, P.; Dosio, A.; McCormick, N.; Bigano, A.; Füssel, H.-M. Changes of heating and cooling degree-days in Europe from 1981 to 2100. Int. J. Climatol. 2018, 38, e191–e208. [Google Scholar] [CrossRef]
- Ruosteenoja, K.; Räisänen, P. Seasonal Changes in Solar Radiation and Relative Humidity in Europe in response to Global Warming. J. Clim. 2013, 26, 2467–2481. [Google Scholar] [CrossRef]
- Rizou, D.; Flocas, H.A.; Hatzaki, M.; Bartzokas, A. A statistical investigation of the impact of the Indian monsoon on the eastern Mediterranean circulation. Atmosphere 2018, 9, 90. [Google Scholar] [CrossRef]
- El-Samra, R.; Bou-Zeid, E.; Bangalath, H.K.; Stenchikov, G.; El-Fadel, M. Seasonal and Regional Patterns of Future Temperature Extremes: High-Resolution Dynamic Downscaling Over a Complex Terrain. J. Geophys. Res. Atmos. 2018, 123, 6669–6689. [Google Scholar] [CrossRef]
Figure 1.
The geographical domain used.

Figure 2.
The methodology scheme used in the present study.

Figure 3.
The spatial distribution of the 12 clusters.

Figure 4.
Mean intra-annual variations of the spatial anomalies of the meteorological parameters for the areas of clusters 1 and 2. Continuous and dashed lines correspond to 12UTC and 00UTC respectively.
Figure 4.
Mean intra-annual variations of the spatial anomalies of the meteorological parameters for the areas of clusters 1 and 2. Continuous and dashed lines correspond to 12UTC and 00UTC respectively.

Figure 5.
As in Figure 4, but for clusters 3 and 4.
Figure 5.
As in Figure 4, but for clusters 3 and 4.

Figure 6.
As in Figure 4, but for clusters 5 and 6.
Figure 6.
As in Figure 4, but for clusters 5 and 6.

Figure 7.
As in Figure 4, but for clusters 7 and 8.
Figure 7.
As in Figure 4, but for clusters 7 and 8.

Figure 8.
As in Figure 4, but for clusters 9 and 10.
Figure 8.
As in Figure 4, but for clusters 9 and 10.

Figure 9.
As in Figure 4, but for clusters 11 and 12.
Figure 9.
As in Figure 4, but for clusters 11 and 12.

Figure 10.
Scatterplots of the spatial mean values of ERA-Interim and ERA5 air temperature and total cloud cover for the areas of clusters 7 and 10–12 (land areas).
Figure 10.
Scatterplots of the spatial mean values of ERA-Interim and ERA5 air temperature and total cloud cover for the areas of clusters 7 and 10–12 (land areas).

Figure 11.
As in Figure 10, but for clusters 1–6 and 8–9 (sea areas).
Figure 11.
As in Figure 10, but for clusters 1–6 and 8–9 (sea areas).

Figure 12.
The mean intra-annual variations of the spatial anomalies of air temperature and total cloud cover for clusters 1 and 11. Black lines represent the ERA5 dataset while red lines represent the ERA-Interim dataset. Solid and dashed lines correspond to 12UTC and 00UTC, respectively.
Figure 12.
The mean intra-annual variations of the spatial anomalies of air temperature and total cloud cover for clusters 1 and 11. Black lines represent the ERA5 dataset while red lines represent the ERA-Interim dataset. Solid and dashed lines correspond to 12UTC and 00UTC, respectively.

© 2018 by the authors. Licensee MDPI, Basel, Switzerland. This article is an open access article distributed under the terms and conditions of the Creative Commons Attribution (CC BY) license (http://creativecommons.org/licenses/by/4.0/).
Share and Cite
MDPI and ACS Style
Lolis, C.J.; Kotsias, G.; Bartzokas, A. Objective Definition of Climatologically Homogeneous Areas in the Southern Balkans Based on the ERA5 Data Set. Climate 2018, 6, 96. https://0-doi-org.brum.beds.ac.uk/10.3390/cli6040096
AMA Style
Lolis CJ, Kotsias G, Bartzokas A. Objective Definition of Climatologically Homogeneous Areas in the Southern Balkans Based on the ERA5 Data Set. Climate. 2018; 6(4):96. https://0-doi-org.brum.beds.ac.uk/10.3390/cli6040096
Chicago/Turabian StyleLolis, Christos J., Georgios Kotsias, and Aristides Bartzokas. 2018. "Objective Definition of Climatologically Homogeneous Areas in the Southern Balkans Based on the ERA5 Data Set" Climate 6, no. 4: 96. https://0-doi-org.brum.beds.ac.uk/10.3390/cli6040096
Note that from the first issue of 2016, this journal uses article numbers instead of page numbers. See further details here.