Next Issue
Volume 7, December
Previous Issue
Volume 7, October


Climate, Volume 7, Issue 11 (November 2019) – 9 articles

Cover Story (view full-size image): 
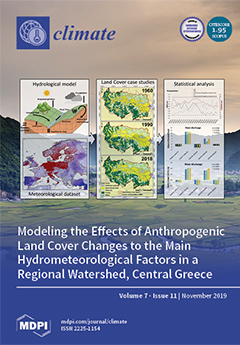
In order to investigate the effects of anthropogenic land cover changes to the hydrological cycle components of a regional watershed in Central Greece, the physically based hydrological model MIKE SHE and Copernicus Climate Change Service E-OBS gridded meteorological dataset were employed. Analysis of the simulation results showed that the transition from forest to pastures or agricultural land reduced the annual actual evapotranspiration and increased the average annual river discharge, while intensifying the vulnerability to hydrometeorological-related hazards, such as droughts or floods. Hence, the quantitative assessment of land cover effects presented in this study can contribute to the design and implementation of successful land cover and climate change mitigation and adaptation policies. View this paper
  • Issues are regarded as officially published after their release is announced to the table of contents alert mailing list.
  • You may sign up for e-mail alerts to receive table of contents of newly released issues.
  • PDF is the official format for papers published in both, html and pdf forms. To view the papers in pdf format, click on the "PDF Full-text" link, and use the free Adobe Reader to open them.
Order results
Result details
Section
Select all
Export citation of selected articles as:
11 pages, 3318 KiB  
Article
Land Use Changes in a Peri-Urban Area and Consequences on the Urban Heat Island
by Marianna Nardino and Nicola Laruccia
Climate 2019, 7(11), 133; https://0-doi-org.brum.beds.ac.uk/10.3390/cli7110133 - 13 Nov 2019
Cited by 5 | Viewed by 2761
Abstract
The effect of urbanization on microclimatic conditions is known as “urban heat islands”. In comparison with surrounding rural areas, urban climate is characterized by higher mean temperature, especially during heat waves and during nights. This results in a higher energy requirement for air [...] Read more.
The effect of urbanization on microclimatic conditions is known as “urban heat islands”. In comparison with surrounding rural areas, urban climate is characterized by higher mean temperature, especially during heat waves and during nights. This results in a higher energy requirement for air conditioning in buildings and in a greater bioclimatic discomfort for urban populations. The reasons of this phenomena are ascribable principally to the increase of solar radiation storage and to the decrease of dissipation of water by evapotranspiration in urban environment respect to rural ones. The aim of this paper is to give a quantification of the air temperature increase due to an urbanization process. This quantification is conducted by comparing surface energy balance (incoming and outcoming radiation and turbulent fluxes) in urbanized area versus rural areas. This quantitative approach will be validated using a fluidodynamic model (Envi-Met) in a case study area representative of one among the various regional models of urban area growth. In particular, the model of expansion of small towns around big cities (2003–2008 land use changes) of a plain near-urban area in the Po Valley region (Italy) was used. Full article
(This article belongs to the Special Issue Urban Climate and Adaptation Tools)
Show Figures

Figure 1

23 pages, 296 KiB  
Review
The Dynamics of Climate Change Adaptation in Sub-Saharan Africa: A Review of Climate-Smart Agriculture among Small-Scale Farmers
by Victor O. Abegunde, Melusi Sibanda and Ajuruchukwu Obi
Climate 2019, 7(11), 132; https://0-doi-org.brum.beds.ac.uk/10.3390/cli7110132 - 13 Nov 2019
Cited by 68 | Viewed by 9923
Abstract
Climate-smart agriculture (CSA) as a credible alternative to tackle food insecurity under the changing climate is gaining wide acceptance. However, many developing countries have realized that concepts that have been recommended as solutions to existing problems are not suitable in their contexts. This [...] Read more.
Climate-smart agriculture (CSA) as a credible alternative to tackle food insecurity under the changing climate is gaining wide acceptance. However, many developing countries have realized that concepts that have been recommended as solutions to existing problems are not suitable in their contexts. This paper synthesizes a subset of literature on CSA in the context of small-scale agriculture in sub-Saharan Africa as it relates to the need for CSA, factors influencing CSA adoption, and the challenges involved in understanding and scaling up CSA. Findings from the literature reveal that age, farm size, the nature of farming, and access to extension services influence CSA adoption. Many investments in climate adaptation projects have found little success because of the sole focus on the technology-oriented approach whereby innovations are transferred to farmers whose understanding of the local farming circumstances are limited. Climate-smart agriculture faces the additional challenge of a questionable conceptual understanding among policymakers as well as financing bottlenecks. This paper argues that the prospects of CSA in small-scale agriculture rest on a thorough socio-economic analysis that recognizes the heterogeneity of the small farmer environment and the identification and harnessing of the capacities of farming households for its adoption and implementation. Full article
19 pages, 5920 KiB  
Article
Algorithm to Predict the Rainfall Starting Point as a Function of Atmospheric Pressure, Humidity, and Dewpoint
by Alfonso Gutierrez-Lopez, Ivonne Cruz-Paz and Martin Muñoz Mandujano
Climate 2019, 7(11), 131; https://0-doi-org.brum.beds.ac.uk/10.3390/cli7110131 - 12 Nov 2019
Cited by 4 | Viewed by 5802
Abstract
Forecasting extreme precipitations is one of the main priorities of hydrology in Latin America and the Caribbean (LAC). Flood damage in urban areas increases every year, and is mainly caused by convective precipitations and hurricanes. In addition, hydrometeorological monitoring is limited in most [...] Read more.
Forecasting extreme precipitations is one of the main priorities of hydrology in Latin America and the Caribbean (LAC). Flood damage in urban areas increases every year, and is mainly caused by convective precipitations and hurricanes. In addition, hydrometeorological monitoring is limited in most countries in this region. Therefore, one of the primary challenges in the LAC region the development of a good rainfall forecasting model that can be used in an early warning system (EWS) or a flood early warning system (FEWS). The aim of this study was to provide an effective forecast of short-term rainfall using a set of climatic variables, based on the Clausius–Clapeyron relationship and taking into account that atmospheric water vapor is one of the variables that determine most meteorological phenomena, particularly regarding precipitation. As a consequence, a simple precipitation forecast model was proposed from data monitored at every minute, such as humidity, surface temperature, atmospheric pressure, and dewpoint. With access to a historical database of 1237 storms, the proposed model allows use of the right combination of these variables to make an accurate forecast of the time of storm onset. The results indicate that the proposed methodology was capable of predicting precipitation onset as a function of the atmospheric pressure, humidity, and dewpoint. The synoptic forecast model was implemented as a hydroinformatics tool in the Extreme Precipitation Monitoring Network of the city of Queretaro, Mexico (RedCIAQ). The improved forecasts provided by the proposed methodology are expected to be useful to support disaster warning systems all over Mexico, mainly during hurricanes and flashfloods. Full article
(This article belongs to the Special Issue Precipitation: Forecasting and Climate Projections)
Show Figures

Figure 1

11 pages, 5826 KiB  
Article
Development of a Front Identification Scheme for Compiling a Cold Front Climatology of the Mediterranean
by E. Bitsa, H. Flocas, J. Kouroutzoglou, M. Hatzaki, I. Rudeva and I. Simmonds
Climate 2019, 7(11), 130; https://0-doi-org.brum.beds.ac.uk/10.3390/cli7110130 - 11 Nov 2019
Cited by 9 | Viewed by 3106
Abstract
The objective of this work is the development of an automated and objective identification scheme of cold fronts in order to produce a comprehensive climatology of Mediterranean cold fronts. The scheme is a modified version of The University of Melbourne Frontal Tracking Scheme [...] Read more.
The objective of this work is the development of an automated and objective identification scheme of cold fronts in order to produce a comprehensive climatology of Mediterranean cold fronts. The scheme is a modified version of The University of Melbourne Frontal Tracking Scheme (FTS), to take into account the particular characteristics of the Mediterranean fronts. We refer to this new scheme as MedFTS. Sensitivity tests were performed with a number of cold fronts in the Mediterranean using different threshold values of wind-related criteria in order to identify the optimum scheme configuration. This configuration was then applied to a 10-year period, and its skill was assessed against synoptic surface charts using statistic metrics. It was found that the scheme performs well with the dynamic criteria employed and can be successfully applied to cold front identification in the Mediterranean. Full article
(This article belongs to the Special Issue Climate and Atmospheric Dynamics and Predictability)
Show Figures

Figure 1

27 pages, 54441 KiB  
Article
Modeling the Effects of Anthropogenic Land Cover Changes to the Main Hydrometeorological Factors in a Regional Watershed, Central Greece
by Angeliki Mentzafou, George Varlas, Elias Dimitriou, Anastasios Papadopoulos, Ioannis Pytharoulis and Petros Katsafados
Climate 2019, 7(11), 129; https://0-doi-org.brum.beds.ac.uk/10.3390/cli7110129 - 07 Nov 2019
Cited by 17 | Viewed by 3479
Abstract
In this study, the physically-based hydrological model MIKE SHE was employed to investigate the effects of anthropogenic land cover changes to the hydrological cycle components of a regional watershed in Central Greece. Three case studies based on the land cover of the years [...] Read more.
In this study, the physically-based hydrological model MIKE SHE was employed to investigate the effects of anthropogenic land cover changes to the hydrological cycle components of a regional watershed in Central Greece. Three case studies based on the land cover of the years 1960, 1990, and 2018 were examined. Copernicus Climate Change Service E-OBS gridded meteorological data for 45 hydrological years were used as forcing for the model. Evaluation against observational data yielded sufficient quality for daily air temperature and precipitation. Simulation results demonstrated that the climatic variabilities primarily in precipitation and secondarily in air temperature affected basin-averaged annual actual evapotranspiration and average annual river discharge. Nevertheless, land cover effects can locally outflank the impact of climatic variability as indicated by the low interannual variabilities of differences in annual actual evapotranspiration among case studies. The transition from forest to pastures or agricultural land reduced annual actual evapotranspiration and increased average annual river discharge while intensifying the vulnerability to hydrometeorological-related hazards such as droughts or floods. Hence, the quantitative assessment of land cover effects presented in this study can contribute to the design and implementation of successful land cover and climate change mitigation and adaptation policies. Full article
(This article belongs to the Special Issue Climate and Atmospheric Dynamics and Predictability)
Show Figures

Figure 1

27 pages, 8638 KiB  
Article
Air Pollution Flow Patterns in the Mexico City Region
by Alejandro Salcido, Susana Carreón-Sierra and Ana-Teresa Celada-Murillo
Climate 2019, 7(11), 128; https://0-doi-org.brum.beds.ac.uk/10.3390/cli7110128 - 05 Nov 2019
Cited by 2 | Viewed by 3614
Abstract
According to the Mexico City Emissions Inventory, mobile sources are responsible for approximately 86% of nitrogen oxide emissions in this region, and correspond to a NOx emission of 51 and 58 kilotons per year in Mexico City and the State of Mexico, respectively. [...] Read more.
According to the Mexico City Emissions Inventory, mobile sources are responsible for approximately 86% of nitrogen oxide emissions in this region, and correspond to a NOx emission of 51 and 58 kilotons per year in Mexico City and the State of Mexico, respectively. Ozone levels in this region are often high and persist as one of the main problems of air pollution. Identifying the main scenarios for the transport and dispersion of air pollutants requires the knowledge of their flow patterns. This work examines the surface flow patterns of air pollutants (NO2, O3, SO2, and PM10) in the area of Mexico City (a region with strong orographic influences) over the period 2001–2010. The flow condition of a pollutant depends on the spatial distribution of its concentration and the mode of wind circulation in the region. We achieved the identification and characterization of the pollutant flow patterns through the exploitation of the 1-hour average values of the pollutant concentrations and wind data provided by the atmospheric monitoring network of Mexico City and the application of the k-means method of cluster analysis. The data objects for the cluster analysis were obtained by modeling Mexico City as a 4-cell spatial domain and describing, for each pollutant, the flow state in a cell by the spatial averages of the horizontal pollutant flow vector and its gradients (the divergence and curl of the flow vector). We identified seven patterns for wind circulation and nine patterns for each of NO2, O3, PM10, and SO2 pollutant flows. Their seasonal and annual average intensities and probabilities of occurrence were estimated. Full article
(This article belongs to the Special Issue Urban Climate and Adaptation Tools)
Show Figures

Figure 1

24 pages, 8279 KiB  
Article
Modeling Hydrological Response to Climate Change in a Data-Scarce Glacierized High Mountain Astore Basin Using a Fully Distributed TOPKAPI Model
by Iqra Atif, Javed Iqbal and Li-jun Su
Climate 2019, 7(11), 127; https://0-doi-org.brum.beds.ac.uk/10.3390/cli7110127 - 28 Oct 2019
Cited by 6 | Viewed by 3765
Abstract
Water scarcity is influencing environmental and socio-economic development on a global scale. Pakistan is ranked third among the countries facing water scarcity. This situation is currently generating intra-provincial water disputes and could lead to transboundary water conflicts. This study assessed the future water [...] Read more.
Water scarcity is influencing environmental and socio-economic development on a global scale. Pakistan is ranked third among the countries facing water scarcity. This situation is currently generating intra-provincial water disputes and could lead to transboundary water conflicts. This study assessed the future water resources of Astore basin under representative concentration pathways (RCP) 4.5 and 8.5 scenarios using fully distributed TOPographic Kinematic APproximation and Integration (TOPKAPI) model. TOPKAPI model was calibrated and validated over five years from 1999–2003 with a Nash coefficient ranging from 0.93–0.97. Towards the end of the 21st century, the air temperature of Astore will increase by 3°C and 9.6 °C under the RCP4.5 and 8.5 scenarios, respectively. The rise in air temperature can decrease the snow cover with Mann Kendall trend of –0.12%/yr and –0.39%/yr (p ≥ 0.05) while annual discharge projected to be increased 11% (p ≤ 0.05) and 37% (p ≥ 0.05) under RCP4.5 and RCP8.5, respectively. Moreover, the Astore basin showed a different pattern of seasonal shifts, as surface runoff in summer monsoon season declined further due to a reduction in precipitation. In the spring season, the earlier onset of snow and glacier melting increased the runoff due to high temperature, regardless of the decreasing trend of precipitation. This increased surface runoff from snow/glacier melt of Upper Indus Basin (UIB) can potentially be utilized to develop water policy and planning new water harvesting and storage structures, to reduce the risk of flooding. Full article
Show Figures

Figure 1

12 pages, 1606 KiB  
Article
Impact of Climate Variability on Crop Yield in Kalahandi, Bolangir, and Koraput Districts of Odisha, India
by Arpita Panda, Netrananda Sahu, Swadhin Behera, Takahiro Sayama, Limonlisa Sahu, Ram Avtar, R.B. Singh and Masafumi Yamada
Climate 2019, 7(11), 126; https://0-doi-org.brum.beds.ac.uk/10.3390/cli7110126 - 28 Oct 2019
Cited by 19 | Viewed by 5975
Abstract
Most tropical regions in the world are vulnerable to climate variability, given their dependence on rain-fed agricultural production and limited adaptive capacity owing to socio-economic conditions. The Kalahandi, Bolangir, and Koraput districts of the south-western part of Odisha province of India experience an [...] Read more.
Most tropical regions in the world are vulnerable to climate variability, given their dependence on rain-fed agricultural production and limited adaptive capacity owing to socio-economic conditions. The Kalahandi, Bolangir, and Koraput districts of the south-western part of Odisha province of India experience an extreme sub-humid tropical climate. Based on the observed changes in the magnitude and distribution of rainfall and temperature, this study evaluates the potential impact of climate variation on agricultural yield and production in these districts. The study is conducted by taking into account meteorological data like rainfall and temperature from 1980 to 2017 and crop productivity data from 1980–81 to 2016–17. Additionally, climate variability indices like Monsoon Index, Oceanic Nino Index, and NINO-3 and NINO 3.4 are used. To analyse the data, various statistical techniques like correlation and multiple linear regression are used. The amount of monsoon rainfall is found to have a significant impact on crop productivity, compared to temperature, in the study area, and as a result the Monsoon Index has a determining impact on crop yield among various indices. Full article
Show Figures

Figure 1

18 pages, 2961 KiB  
Article
An Innovative Damage Model for Crop Insurance, Combining Two Hazards into a Single Climatic Index
by Dorothée Kapsambelis, David Moncoulon and Jean Cordier
Climate 2019, 7(11), 125; https://0-doi-org.brum.beds.ac.uk/10.3390/cli7110125 - 26 Oct 2019
Cited by 7 | Viewed by 4024
Abstract
Extreme weather events have strong impacts on agriculture and crop insurance. In France, drought (2003, 2011, 2017, and 2018) and excess of water (2016) are considered the most significant events in terms of economic losses. The crop (re)insurance industry must estimate its financial [...] Read more.
Extreme weather events have strong impacts on agriculture and crop insurance. In France, drought (2003, 2011, 2017, and 2018) and excess of water (2016) are considered the most significant events in terms of economic losses. The crop (re)insurance industry must estimate its financial exposure to climatic events in terms of the average annual losses and potential extreme damages. Therefore, the objective of this paper was to develop a model that links meteorological indices to crop yield losses with a specific focus on extreme climatic events. We designed a meteorological index (DOWKI: Drought and Overwhelmed Water Key Indicator) based on a water balance cumulative anomaly that can explain drought and excess of water at the department scale. We propose a crop damage model calibrated by combining historical yield records and the DOWKI values. To estimate the financial exposure of insured crops at a national level, stochastic simulations of the DOWKI were performed to produce one thousand years of yield losses. Our objective was to estimate the effect of climatic extremes affecting the global production. Simulated average annual losses and the possible maximum claim for three crops (soft winter wheat, winter barley, and sunflower) are presented in the results. Full article
Show Figures

Figure 1

Previous Issue
Next Issue
Back to TopTop