Modelling Maize Yield and Water Requirements under Different Climate Change Scenarios


1
Pan African University Institute of Water and Energy Sciences, c/o Abou Bekr Belkaid University of Tlemcen B.P. 119, Tlemcen 13000, Algeria
2
Land and Water Division, Food and Agriculture Organization of the United Nations (FAO), 00153 Rome, Italy
3
The Center for Middle Eastern Studies, Lund University, 22100 Lund, Sweden
4
The Centre for Sustainable Visions, 22100 Lund, Sweden
*
Author to whom correspondence should be addressed.
Climate 2020, 8(11), 127; https://0-doi-org.brum.beds.ac.uk/10.3390/cli8110127
Submission received: 21 September 2020
/
Revised: 30 October 2020
/
Accepted: 2 November 2020
/
Published: 4 November 2020
(This article belongs to the Special Issue Climate Change and Water-Related Agricultural Risks)
Abstract
:African countries such as Nigeria are anticipated to be more susceptible to the impacts of climate change due to large dependence on rainfed agriculture and to several uncertainties in the responses of crop production to climate change. The impacts of climate change on crop water requirements (CWR), irrigation water requirements (IWR), yields and crop water productivity (CWP) of rainfed maize in Ogun-Osun River Basin, Nigeria were evaluated for a baseline period (1986–2015) and future projection period (2021–2099) under Representative Concentration Pathway (RCP) 4.5 and RCP 8.5 scenarios. For the baseline period, there is no significant trend within the variables studied. However, IWR is projected to increase significantly by up to 140% in the future period, while yield might likely decline under both scenarios up to −12%. This study shows that in the future periods, supplemental irrigation has little impact in improving yields, but an increase in soil fertility can improve yields and CWP by up to 80% in 2099. This paper offers useful information on suitable adaptation measures which could be implemented by stakeholders and policymakers to counterbalance the effects of climate change on crop production.
1. Introduction
1.1. Background
Nigeria is a West African country which lies between longitudes 2°49′ E–14°37′ E and latitudes 4°16′ N-13°52′ N with a population of about 196 million as of 2018 estimates, agricultural land of 708,000 km2 and over 70% of the population engaged in agriculture [1]. Nigeria is experiencing frequent food shortages, hunger and water scarcity due to the rapid population growth, the decline in income, climate change (long term) and climate variability (interannual) [2,3]. It is predicted that agriculture will be greatly affected by climate change and agriculture will contribute to climate change. According to [4], a 60% increase above the 2006 global food demand levels is expected in 2050 driven by the rapid population growth, an increase in urbanization, as well as income growth. In Nigeria, the withdrawal of water for agriculture can rise up to 95% in 2050 compared to 2016 [5].
Promoting sustainable agriculture and improving crop productivity as well as the efficient management of finite water resources are indispensable towards increasing global food production. In sub-Saharan Africa, rainfed agriculture is mostly practiced, covering about 96% of agricultural lands which makes crop production heavily dependent on rainfall. Nigerian farmers depend largely on rainfall for crop production, post-harvest processes, animal husbandry, and aquaculture [6,7].
The main biophysical processes involved in agricultural crop production such as evaporation from soils, transpiration from plants, nutrient cycles and growth of plants are affected by climate change [8]. The interaction between water, food and climate change shows that it is important to examine the impacts of climate change on crop productivity. Several studies in Nigeria [9,10,11,12] have shown that the increase in temperature, droughts and floods will affect agricultural production. In addition, some crops will likely be affected negatively due to excessive heat as a result of temperature rise which might also cause some crops to need more water than before and affect yields.
Crop water requirement (CWR) and irrigation water requirement (IWR) are expected to change [13,14]. CWR is the total amount of water that a crop needs for growth throughout its lifecycle while IWR is the amount of water needed to complement rainfall to meet up with CWR. In addition, there are uncertainties about future crops’ yield, the harvestable quantity of a crop, and crop water productivity, crop yield per evapotranspiration in a growing season, (CWP) [15,16]. In this article, CWP is defined the ratio of crop yield to the quantity of water consumed by the crop during a growing period.
1.2. Crop Production in Nigeria under the Changing Climate
Climate change will impact crop production in Nigeria in different ways. While some crops will suffer under high temperature, other crops may perform better [12,17]. Another study that was carried out in Southwest Nigeria to examine the level of adaptation by crop farmers using principal component analysis reported that the principal crops grown in this area such as soybean, yam, cocoyam, cassava and maize are sensitive to climate variability and climate change [18], which stresses the fact that climate change will have impacts on crop production, and it is important to know how crops will be affected. It has been reported that climate-smart irrigation will have a positive impact on agricultural production in Nigeria and has the capacity to improve food security [12].
In all the reviewed climate change studies on crop production in Nigeria [6,9,10,11,12,17,18,19,20,21,22], only one has used a biophysical model to project the growth of crops with consideration of climate projections and CO2 concentration. However, a biophysical model and water balance model have not been used to estimate water requirements and water productivity, and identify adaptation strategies. For instance, [11] examined the impacts of climate change on food production using econometric tools such as Vector Error Correction (VEC) and Augmented Dickey Fuller (ADF) test, and [20] examined the impacts of climate change based on a statistical analysis of historical weather data and crop yield without prediction of the future yields in a changing climate.
1.3. Maize Production in Nigeria and Future Scenarios
Maize is one of the common annual crops grown in Nigeria. In fact, it is grown in all parts of the country. Maize is grown in all the seven agro-ecological zones of the country and it is a staple food in Nigeria. Apart from that, it is extensively used as animal feed which is highly nutritious. However, many challenges such as low yield, pests and diseases problems are associated with maize production which is making scientists and agronomists embark on hybrid projects of maize varieties which are making tremendous progress [21]. Planting date is another crucial factor in the production of maize. Planting is usually done at the onset of rainfall which varies across the agro-ecological zones of the country. Accurate planting date is highly significant to the amount of yield that will be harvested at the end of the planting season. Earlier planting usually results in low quality yields of grains while late planting also results in a poor quantity of yields. The growing period of maize in Nigeria and within Ogun-Osun River Basin is approximately 90 days. Optimal timing of planting maize has been identified according to [2], which depends on the agro-ecological zones of the country. The study area falls within the Rain Forest zone which implies that maize planting is usually done from mid-March–mid-April depending on when rain was established in the year. The water requirements vary depending on the agro-ecological zones. Generally, maize performs optimally in regions that receive an annual rainfall of 600–1000 mm.
Maize requires deep, medium-textured, well-drained, fertile soils with high water holding capacity and a pH range of 5.5–8.0. Generally, the soils within the study area are deep, medium-textured, well-drained, and have a pH range of 5.5–8.0 but with low to moderate soil fertility. Studies have shown that in order to retain a high level of soil fertility under continuous maize cultivation, no-till and minimum tillage practices are possible methods that can be employed [12,21]. During land clearing and preparation, in order to maintain the topsoil structure and organic matter, minimum disturbance should be done from farm machinery.
Currently, maize production is mainly done under rainfed agriculture, which is causing low yield and little profits from farmers. On regional and national scales, the rate of production is under optimum and expected values. The problems associated with maize production are similar to other crops within the study area and in Nigeria at large. These problems include poor post-harvest processing and storage, crop diseases and pests, poor extension services, lack of insurance for farmers, inadequate access to inputs such as seeds, agro-chemicals and fertilizers, soil infertility, climate variability, and planting dates.
Additionally, irregularities in the onset of rainfall, frequencies and intensities are some of the challenges that are ravaging maize production in the country since most of the farmers practice rainfed agriculture. It is becoming extremely difficult to grow maize due to uncertainties in crop yields-climate behaviour. Low yields of maize have huge consequences on food security and income for smallholder farmers in the country and within the study area.
1.4. Crop Modelling and Climate Change
Crop modelling and crop model applications have gained more interest to examine the impacts of climate change on crop productivity. Due to the threats of climate change on agricultural water use and other demanding uses, simulation models have been found to be significant tools in evaluating the water needs of crops [6,22,23,24,25,26,27,28,29]. These models were developed to estimate crop growth, development, yield, water use efficiency, water consumption and irrigation schedules under different climatic conditions, soil textures, field management, conservation practices and soil fertility. The outputs by these models can be used to inform farmers, scientists and decision-makers on water allocation, planting dates and field management. Examples include but are not limited to:
- -
- The Leading Software Framework for Agricultural Systems Modelling and Simulation (APSIM): https://www.apsim.info
- -
- AgrometShell, which is a software for crop yield forecasting initiated by the Food and Agriculture Organization of the United Nations (FAO): http://www.hoefsloot.com/agrometshell.htm
- -
- CERES-wheat, https://nowlin.css.msu.edu/wheat_book/
- -
- -
- WaPOR - FAO, which is a portal to monitor Water Productivity through open access of remotely sensed derived data: http://www.fao.org/land-water/databases-and-software/wapor/en/
- -
- AquaCrop, which is a crop growth model developed by FAO’s Land and Water Division, http://www.fao.org/aquacrop/en/, to simulate crop growth, yield and water need based on crop, climate and soil data as well as management practices.
Many studies have been done in various regions focusing on the impacts of climate change on CWR, IWR, yields and CWP separately [8,22,23,24,25,26,27,28] with only few focusing on the combination of any of the variables. For instance, [27] projected an increase in IWR and CWR in the three types of rice grown in the Yangtze River Basin, China. Similarly, [28] simulated an increase in CWR and decrease in CWP of winter wheat under increase in temperature and CO2 fertilization.
Statistical modelling and process-based crop modelling are the two main methods that can be employed to describe likely agricultural yields as well as crop productivity under different scenarios [28]. Statistical and process-based crop models can be used for larger scales (regional and national scales) and longer temporal (20–40-year studies) and it is also possible for them to be coupled with other models to estimate both historical and future crop yields and water requirements on different scenarios [29]. However, despite the good features and capabilities of statistical models, they are still limited on certain features required for adequately simulating crop growth. The first limitation is that the output from these models depends on the availability of extensive historical data on water variables, climate and crop yields to adequately predict crop yields and water needs. Also, these models cannot effectively capture crop growth yields and water requirements under extensive changes in temperature and increased concentration of atmospheric carbon dioxide (CO2) [26]. On the other hand, process-based crop modelling describes the biophysical processes of crop growth and development which include nutrients cycles and water cycles. Due to the fact that the process-based model employs detailed non-linear effects of climate on crop and the inter-seasonal attributes of crops, most recent works in this research area use process-based models [6,29]. Process-based crop models overcome the limitations of statistical crop models.
This paper aims at modelling the responses of maize yields and water requirements to climate change in Ogun-Osun River Basin, Nigeria, through the following specific objectives:
- -
- to simulate seasonal CWR, IWR, yield and CWP in the past decades;
- -
- to simulate the responses of CWR, IWR, yield and CWP under different climate change scenarios;
- -
- to investigate the possible adaptation measures that can improve yield and CWP under different climate change scenarios
2. Materials and Methods
2.1. Study Area
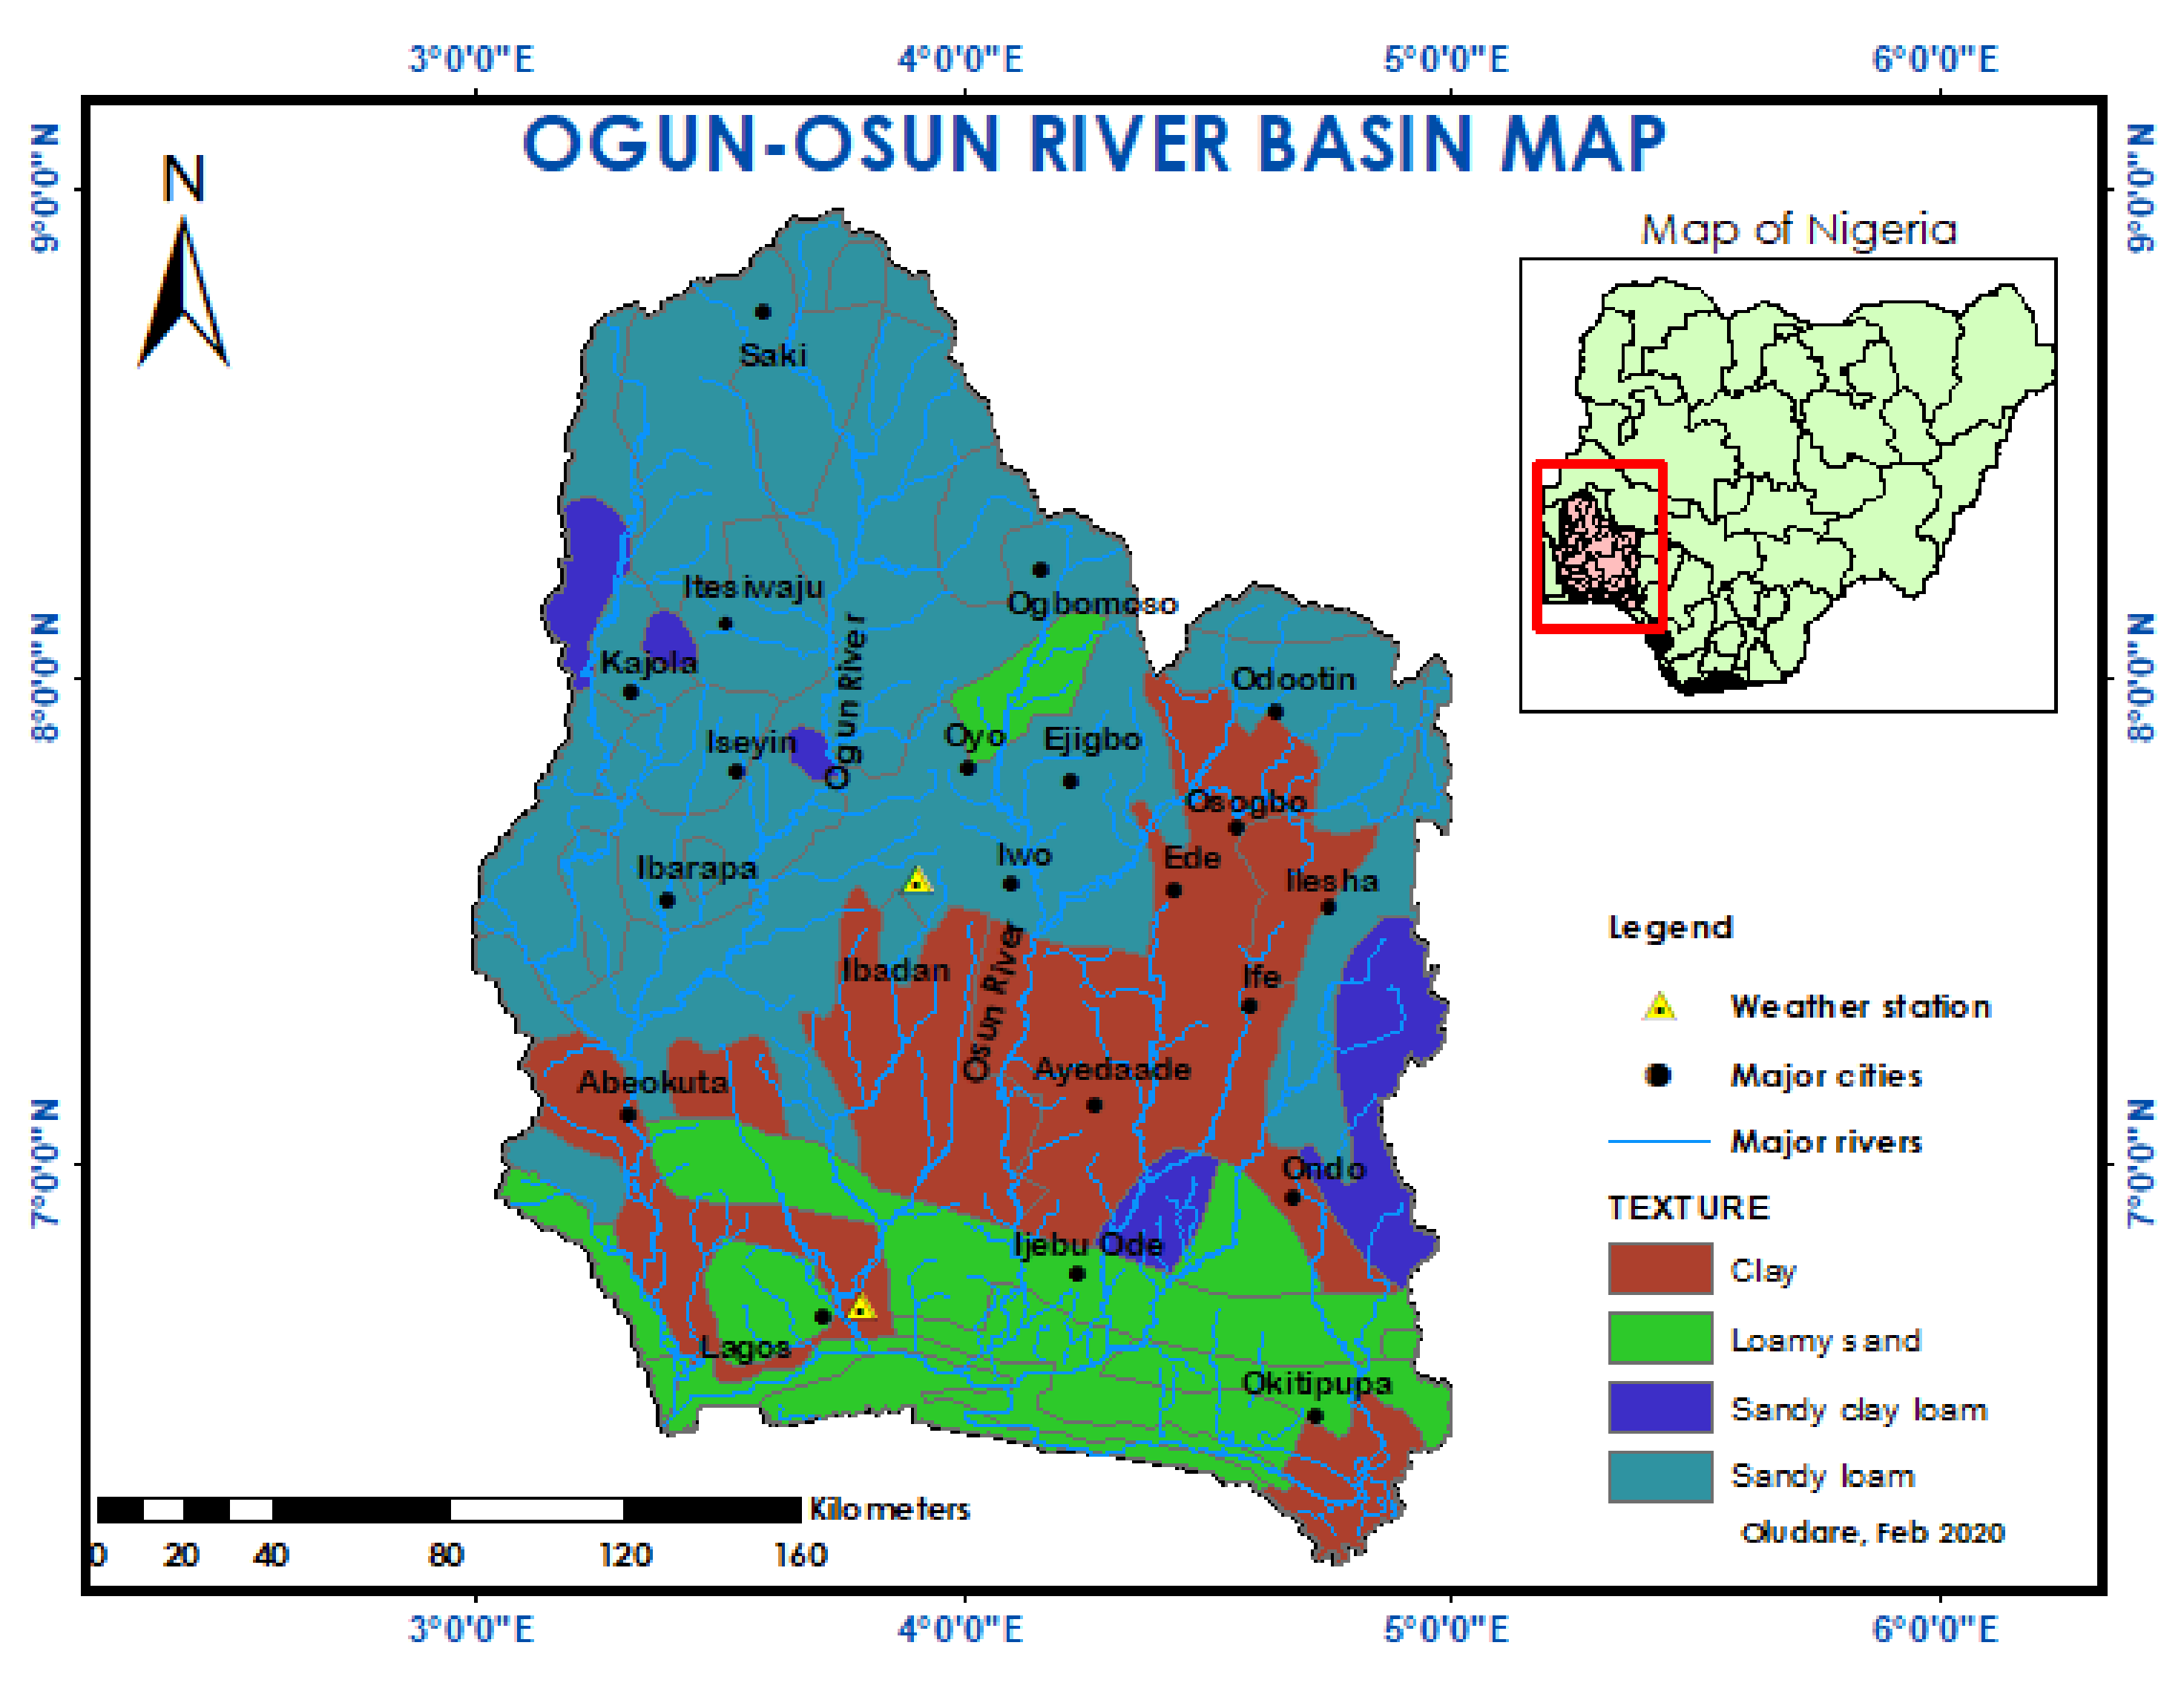
The Ogun-Osun River Basin is located in the southwestern region of Nigeria, Figure 1, between latitude 6°33’–9°00’ N and longitude 2°40’–5°05’ E with a total area of 49,580 km2. The area is characterized by a tropical climate as well as wet and dry seasons. The temperature of the region ranges from 21 °C to 34 °C and average rainfall ranges from 1000 to 1300 mm which occurs from March to September. This region is largely agrarian, and the population heavily depends on agriculture as the source of income [6]. Several studies [9,10,11,12,17,18,19,20] have shown that climate change will certainly affect the agricultural productivity. In addition, currently, there are variations in rainfall pattern within the basin, which is causing growing concern for scientists, farmers and policymakers. Also, farmers are worried about their incomes and crop yield since rainfed agriculture is mainly practiced. The soil textures within the area are clay, loamy sand, sandy clay loam and sandy loam. However, clay soil is not an agricultural land within the area, so it was not considered in the analysis of this paper.
2.2. Data Source
2.2.1. Climate, Crop and Soil Data
The climate data of the basin from 1976 to 2015 (40 years) were collected from the Nigerian Meteorological Agency (NIMET) from two main weather stations, Figure 1. The datasets of 1976–1985 (10 years) were only daily rainfall, maximum and minimum temperatures used for climate model evaluation, while the datasets of 1986–2015 (30 years) were daily rainfall, maximum and minimum temperature, relative humidity, wind speed and solar radiation used for historical (1986–2015) simulations. Meanwhile, daily rainfall and maximum and minimum temperature were used for future (2021–2099) simulations as described in later sections.
Four years of crop data (2012–2015) were obtained from the Agricultural Development Programme (ADP). The data contain crop parameters aggregated from 15 large farms across the basin. The data for 2012 and 2013 growing seasons were used for calibration while validation was done using data for 2014 and 2015 growing seasons.
Soil physical and chemical properties of the basin were obtained from the Harmonised World Soil Database (HWSD) which has a resolution of 1 km (30 arcs seconds). The data was downloaded from the FAO website (http://www.fao.org/soils-portal/soil-survey/soil-maps-and-databases) The soil in the basin is dominantly Ferric Luvisols and Lithosols. The textures of the topsoil (0–100 cm) are predominantly sandy loam, loamy sand and clay. The soil map was validated with data obtained from the Ogun-Osun River Basin Authority and field experiments.
2.2.2. Climate Projection Data
The future climate data employed in this study were obtained from the Coordinated Regional Downscaling Experiment (CORDEX) project, which were the only available data and were downloaded from the Earth System Grid Federation server (https://esgf-index1.ceda.ac.uk/search/cordex-ceda/). The CORDEX is a project funded to provide assessment of model performance, climate change impact assessments and adaptation researches as well as high-resolution of historical and future climate data on a shared platform which will be easily accessible. In the CORDEX project, multiple global climate models (GCMs) have been downscaled using different regional climate models (RCMs) to regional levels including Africa. Based on extensive literature review, Rossby Centre Regional Climate Model (RCA4) which is one of the RCMs developed by the Swedish Meteorological and Hydrological Institute (SMHI) under nine GCMs in CORDEX- Africa was selected for this study. RCA4 has been assessed with highly satisfactory results in many studies [30,31,32].
The CORDEX–Africa datasets are available in daily, 10-day and monthly timescales at a spatial resolution of 0.44° × 0.44° which is approximately 50 km × 50 km for the period of 1951–2005 (historical) and 2006–2099 (future). However, due to the scope of this study, only one GCM under RCA4 was selected. In order to finally select the GCM, three GCMs which are CCCma-CanESM2, ICHEC-EC-EARTH and MOHC-HadGEM2-ES shown in Table 1 were evaluated with the historical data set. The selection of these three GCMs is based on the study that they can effectively capture the future climate of West Africa [32].
In order to access the performance and ability of the climate models to capture the observed data, four statistical indicators which are coefficient of determination (R2), root mean square error (RMSE), mean absolute error (MAE) and Nash-Sutcliffe modelling efficiency (NSE) were employed. NSE is a unitless coefficient that ranges from −∞ to 1 which measures the general deviation between simulated and observed values. An efficiency of 1.0 reveals a perfect match between simulated and observed values. The closer the efficiency is to 1.0, the better the performance of the model. When NSE is less than zero, it means that the observed mean is a better predictor. The daily observed and simulated climatic data for historical period of 1976–2005 were used for the evaluation. The results of the evaluation as given in Table 2 reveals that among the three GCMs evaluated, HadGEM2-ES downscaled by RCA4 performed satisfactorily and has the highest NSE value of −0.11, 0.74 and 0.75 in rainfall, and minimum and maximum temperatures, respectively. The negative value of NSE for rainfall demonstrates that the observed mean is the better predictor than the model.
2.3. AquaCrop
AquaCrop is a crop model used with decision support systems. It was developed by the Land and Water Division of the Food and Agriculture Organization (FAO). This model has been widely used due to its user-friendliness, simplicity and few parameters’ requirements. Process-based crop models such as AquaCrop are superior to the statistical crop models, especially in the assessment of the impact of climate change on crop growth, yields, and water requirements [29]. In addition, it simulates crop growth based on water-driven mechanisms which are most suitable for climate change studies and has been widely validated in various climatic conditions for the assessment of climate change impacts on crop growth, development and water requirements with reliable outputs [33]. Specifically, the model has been validated in Nigeria and other parts of Africa with a similar climate with reliable outputs [6,34]. More importantly, AquaCrop normalizes water productivity for evaporation and CO2 concentration which makes it suitable for future climate studies [33].
AquaCrop has two main limitations: (1) it is designed to predict crop yields at the single field scale without spatial differences in crop development, transpiration, soil characteristics or management; and (2) it considers only vertical incoming (rainfall, irrigation and capillary rise) and outcoming (evaporation, transpiration and deep percolation) water fluxes.
Water Requirements, Crop Yield and Water Productivity in Aquacrop
Crop water requirement is equal to crop evapotranspiration, ETc, which can be calculated by multiplying the reference evapotranspiration (ET0) with the crop coefficient Kc, Equation (1) [14].
ETc= Kc × ET0
- Kc = Crop coefficient (fraction) which describes the impacts of crop height, crop cover, canopy resistance, and soil evaporation. This is not the same throughout the growing period.
- ETc = Crop evapotranspiration (mm/day)
The yield is obtained from the multiplication of biomass and harvest index which is different from other crop models as given in Equation (2) [15].
where;
Y = HI × B
- Y = Crop yield (t/ha)
- HI = Harvest index (fraction or percent)
- B = Biomass (t/ha)
Unlike other crop models, AquaCrop differentiates biomass from harvest index (HI), thus automatically adjusts the harvest index to respond to temperature changes and water stress conditions which is crucial for this study. The daily biomass production in the model is calculated as given by [15] in Equation (3):
where;
- B = daily aboveground biomass (t/ha)
- Tr = daily crop transpiration (mm/day)
- ET0 = daily reference evapotranspiration (mm/day)
- WP* = water productivity of the crop variety normalized for atmospheric CO2 concentration levels and evaporation (kg/m3).
- Ksb = Cold temperature stress coefficient for biomass (fraction)
In this model, daily transpiration is estimated by multiplying the crop coefficient with ET0 and soil coefficient as given by [33] in Equation (4).
where;
- Tr = Crop transpiration (mm/day)
- Ks = stress factor (Kssto or Ksaer) (fraction)
- CC* = adjusted green canopy cover (fraction)
- = crop coefficient
In the model, the modification coefficient for CO2 is estimated by using Equation (5) [15]. This is done to normalize CO2 concentration which is important for climate change studies.
where;
- = Modification coefficient for CO2 (dimensionless)
- = Atmospheric CO2 (µL/L)
- = Baseline CO2 recorded in 2000 at Mauna Loa Observatory Centre, Hawaii which is 369.47 µL/L.
CWP is the ratio of crop yield to the quantity of water consumed by the crop during a growing period, Equation (6).
CWP = crop water productivity in kg/m3, yield in t/ha and ETc in mm/season. The unit conversion factor is 100.
Furthermore, when it rains, not all rainwater is available for crops. Some water losses occur through runoff and percolation. The amount of water from rainfall available for crops within the crop root zone after losses is known as effective rainfall. In AquaCrop, the United States Department for Agriculture (USDA) Soil Conservation method is used to estimate the effective rainfall so as to consider water removal through runoff and deep percolation which are components of water balance. The formulas are given in Equations (7) and (8).
where = Effective rainfall (mm/day), and = 10-day rainfall (mm/decadal).
In order to estimate the decadal and seasonal IWR, the difference between crop evapotranspiration () and effective rainfall () is used as given in Equation (9).
In AquaCrop, fertility is set as a parameter for simulations. There are different levels of soil fertility which are poor, moderate, near optimal and non-limiting. Soil fertility stress is expressed as its expected effect on biomass production using a ratio known as in Equation (10) [33,34].
where
- ranges from 0% (complete crop failure due to infertility) to 100% (no fertility stress)(fraction).
- = Biomass due to soil fertility stress (kg/ha)
- = Biomass at the end of the season with no fertility stress (kg/ha)
Thus, the levels of soil fertility need to be validated for each location to have reliable output. For this study location and crop (maze), the validation has already been done by [34].
2.4. Data Processing
2.4.1. Bias Correction of Projected Rainfall
In order to correct this and to improve the performance of the model, the rainfall dataset for HadGEM2-ES was bias-corrected. Bias correction is the process of scaling climate model outputs to account for their systematic errors, in order to improve their fitting to observations [35]. The evaluation of other climatic parameters shows satisfactory results as the biases are close to zero and NSE is greater than 0.7, so they were not bias corrected. Thus, future daily rainfall, and minimum and maximum temperatures of the basin obtained from HadGEM2-ES (GCM) and RCA4 (RCM) for the period of 2021–2099 under RCP 4.5 and RCP 8.5 scenarios under the CORDEX- Africa project were used for the study.
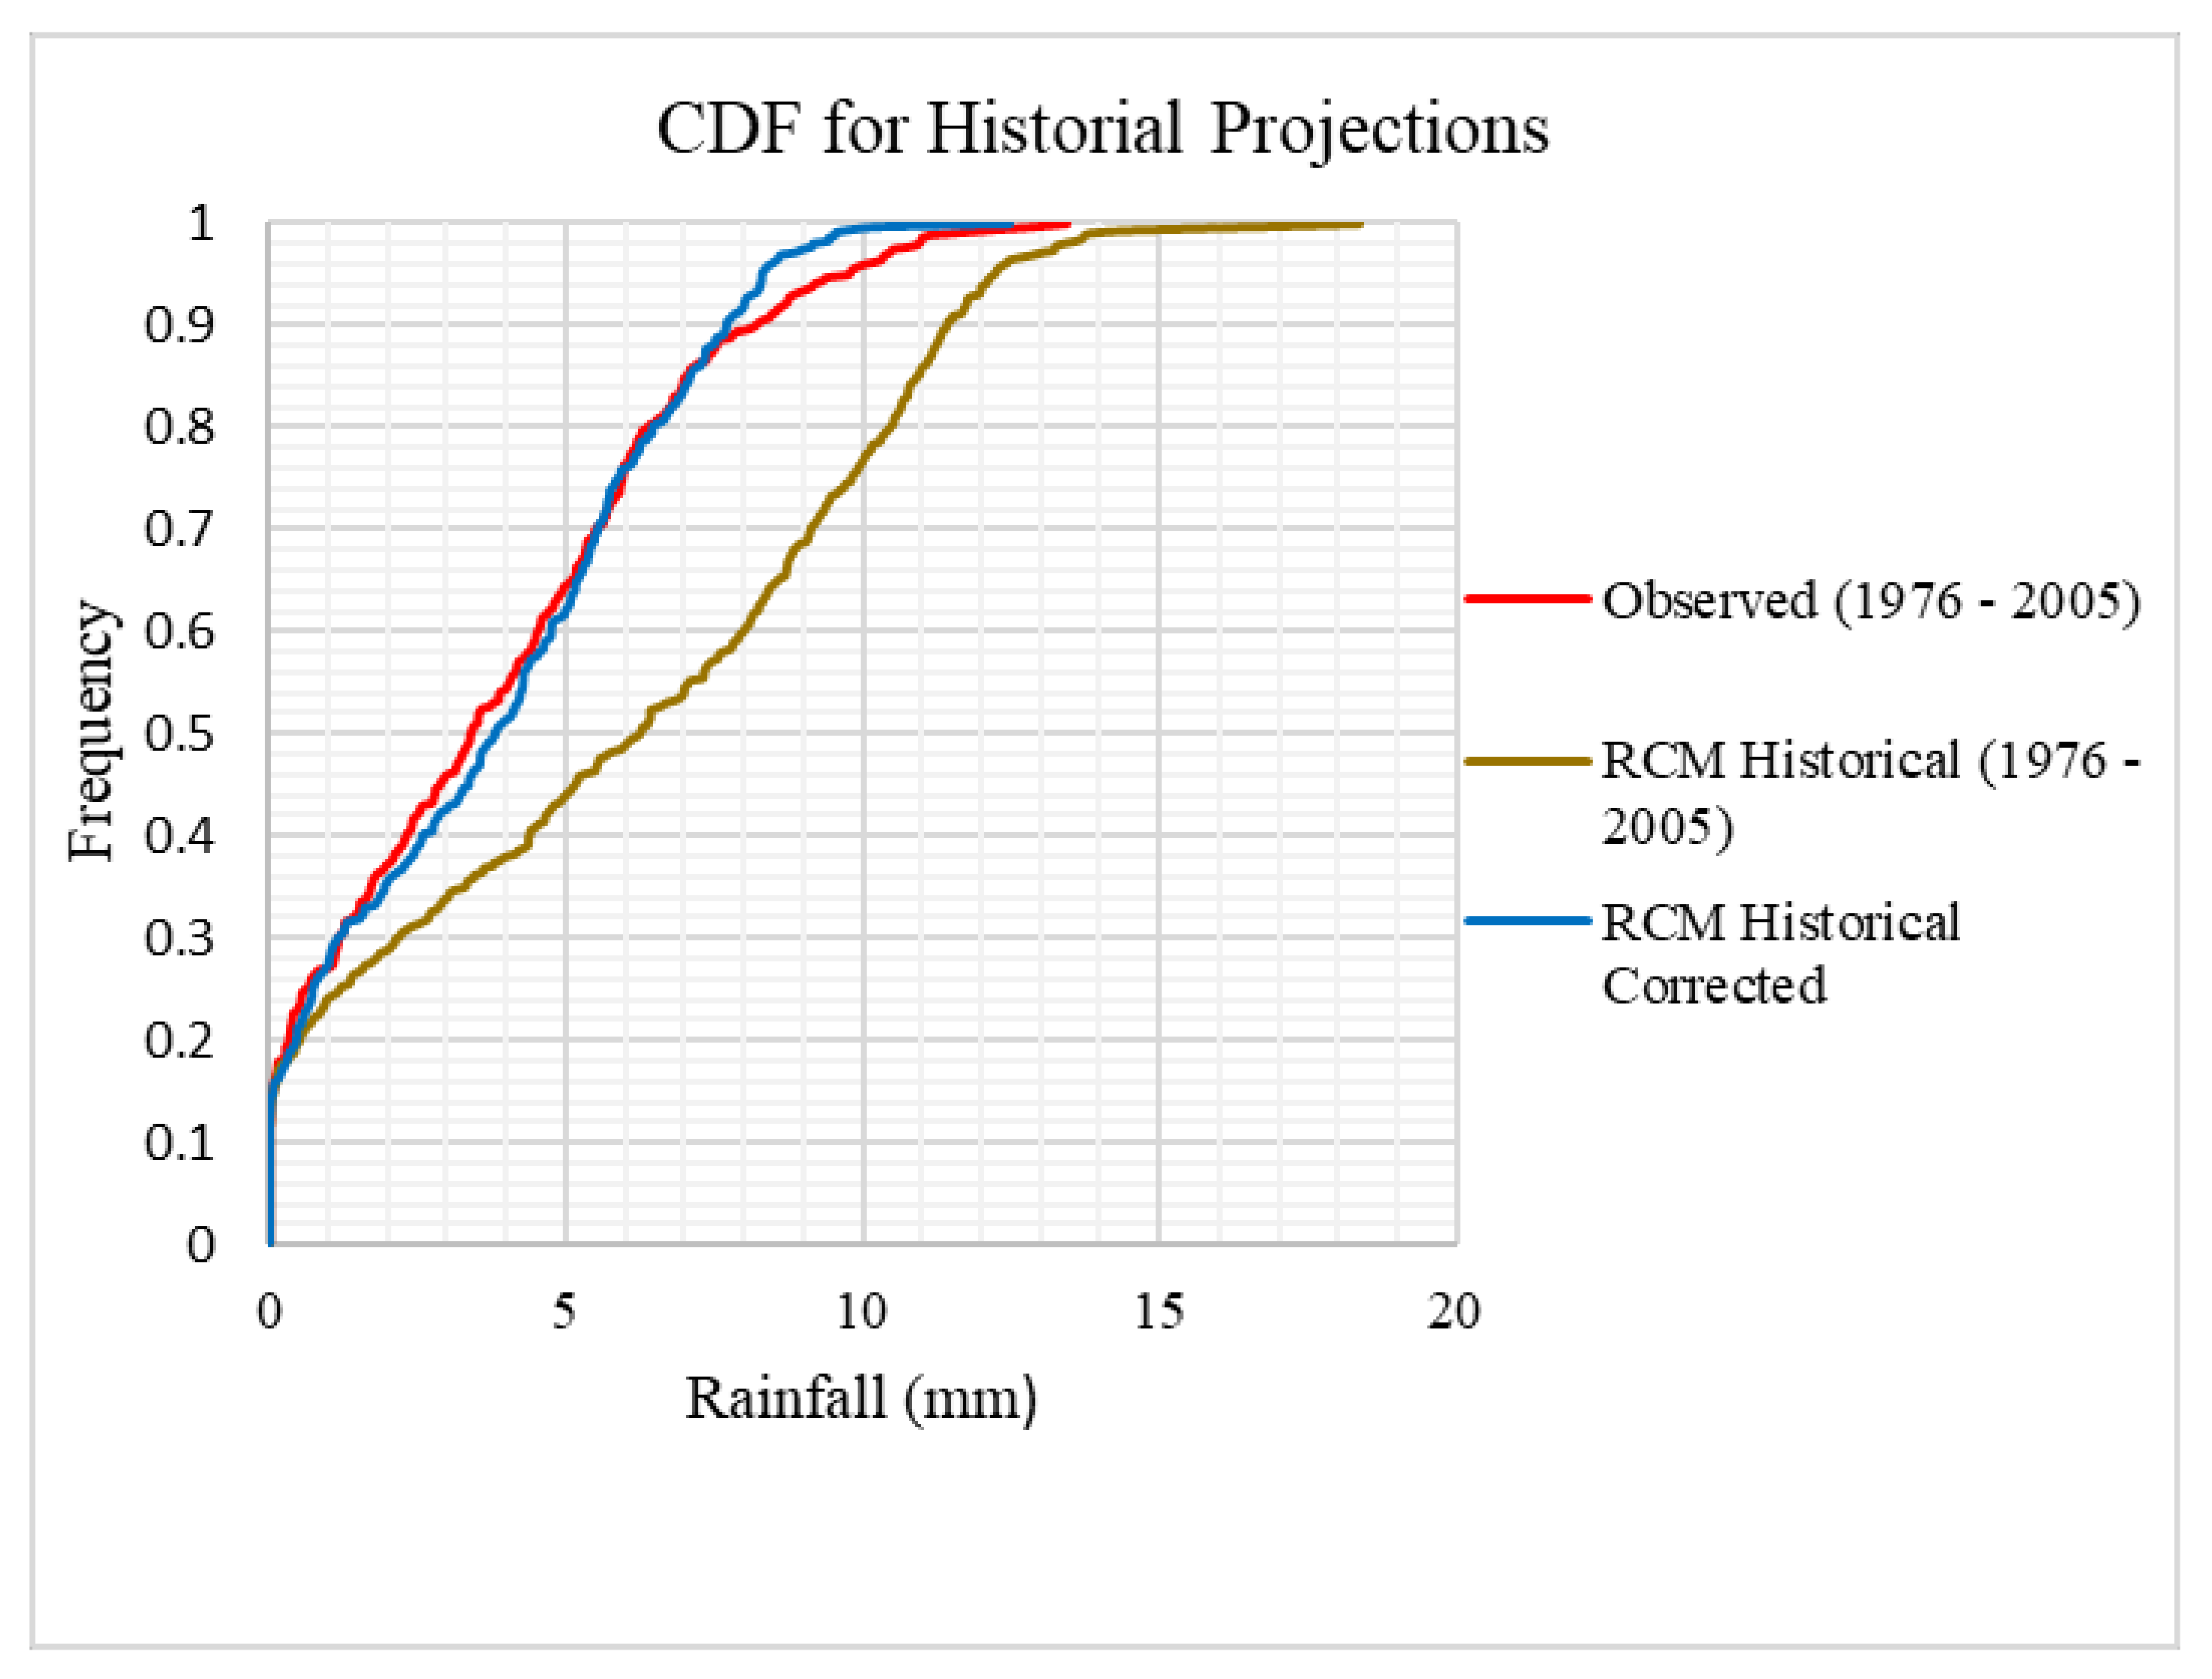
The bias correction technique applied is Quantile Mapping (QM). The principle of QM technique relies on adjusting the cumulative distribution functions (CDF) of the simulated historical GCM/RCM data based on observed historical data as given in Equation (11). It has been proved that the quality of RCM data and shape of CDF is improved through QM. Daily historical observed and simulated rainfall data from 1976–2005 (30 years) were used to bias correct the future simulated data (2021–2099).
where,
y = Fobs−1 (FRCM(x))
- y: bias corrected future rainfall values
- Fobs−1: inverse of the CDF of the observed values
- FRCM: CDF of the historical RCM data
- x: RCM values to be corrected
2.4.2. Calibration and Validation of AquaCrop
Calibration and validation are integral processes in modelling. Calibration is the technique of adjusting the input parameters of a model to appropriately simulate outputs while validation is the process of checking the ability of the model to accurately represent the real world. During validation, the simulated outputs are compared with observed outputs for consistencies. AquaCrop version 6.1 was employed in this study.
For the historical simulations, observed daily rainfall, maximum and minimum temperatures, relative humidity, wind speed and solar radiation of the basin from 1986–2015 (30 years) were inputted into AquaCrop. Since this study is about climate change, the atmospheric concentration of carbon dioxide (CO2) of previous years was taken into keen consideration.
Future daily rainfall, and minimum and maximum temperatures of the basin obtained from HadGEM2-ES (GCM) and RCA4 (RCM) for the period of 2021–2099 under RCP 4.5 and RCP 8.5 scenarios already processed were inputted into AquaCrop. The climate datasets were divided into the near future (2021–2040), mid-century (2041–2070) and late-century (2071–2099). The climate change representative pathways of RCP 4.5 and RCP 8.5 scenarios were selected in AquaCrop to reflect the increase in CO2 concentration. The CO2 concentration used was measured at Mauna Loa Observatory Centre, Hawaii, United States.
The four years of crop data (2012–2015) obtained from Agricultural Development Programme (ADP) were employed in the calibration and validation of the model. The data for the 2012 and 2013 growing seasons were used for calibration while validation was done using data for the 2014 and 2015 growing seasons. The data obtained was used in the calibration and validation of the models as required. Some of the non-conservative crop parameters, which were not obtainable from government agencies were obtained from the literature [6,21,36].
The soil data obtained were validated through field experiments where the soil textures were sampled and tested in a soil science laboratory. Mechanical soil analysis was done using a mechanical shaker to determine the percentages of sand, silt and clay particles. The percentages of sand, silt and clay particles were used to confirm the soil texture on the soil textural triangle. Thereafter, the percentages of sand, silt and clay particles were used to obtain the hydrological properties of, for example, permanent wilting point (PWP), field capacity (FC), saturation (SAT), total available water (TAW) and hydraulic conductivity (Ksat) using SPAW model (version 6.02) (https://hrsl.ba.ars.usda.gov/soilwater/index.htm) which is a soil water properties model previously employed by [27,37]. The soil properties used for calibration and modelling are given in Table 4.
2.4.3. Management Practices
Historical simulations: The calibration of the management practices employed in the models is discussed in the following sections:
- (a)
- Planting date: In AquaCrop model, the planting date window was calibrated between 1 April and 15 April for planting. The model was calibrated to automatically select a planting date based on the establishment of rainfall (cumulative rainfall at least 40 mm) within each year according to the inputted rainfall data and starts simulation on that date. This was done to emulate the planting styles of farmers within the study area who plant after the onset of rainfall within that planting period (1–15 April). The planting date window was calibrated for both historical and future simulations.
- (b)
- Initial soil conditions: The initial soil conditions were set at field capacity since rainfed agriculture is simulated. Groundwater intrusion has not been established on agricultural fields within the basin, thus, groundwater was not considered similar to [6].
- (c)
- Soil infertility and weed management. Soil infertility and weak weed management are common within the study area as shown from field observations and experiments. Hence, the soil fertility and weed management functions were both calibrated as moderate. In the model, soil fertility is moderate when it has 60% of the potential biomass production which corresponds to fertilization level with nitrogen value of 60 kg/ha within the study area. Weed management is moderate when there is 25% relative coverage of weeds. These values are coherent with field observations and experiments within the study area.
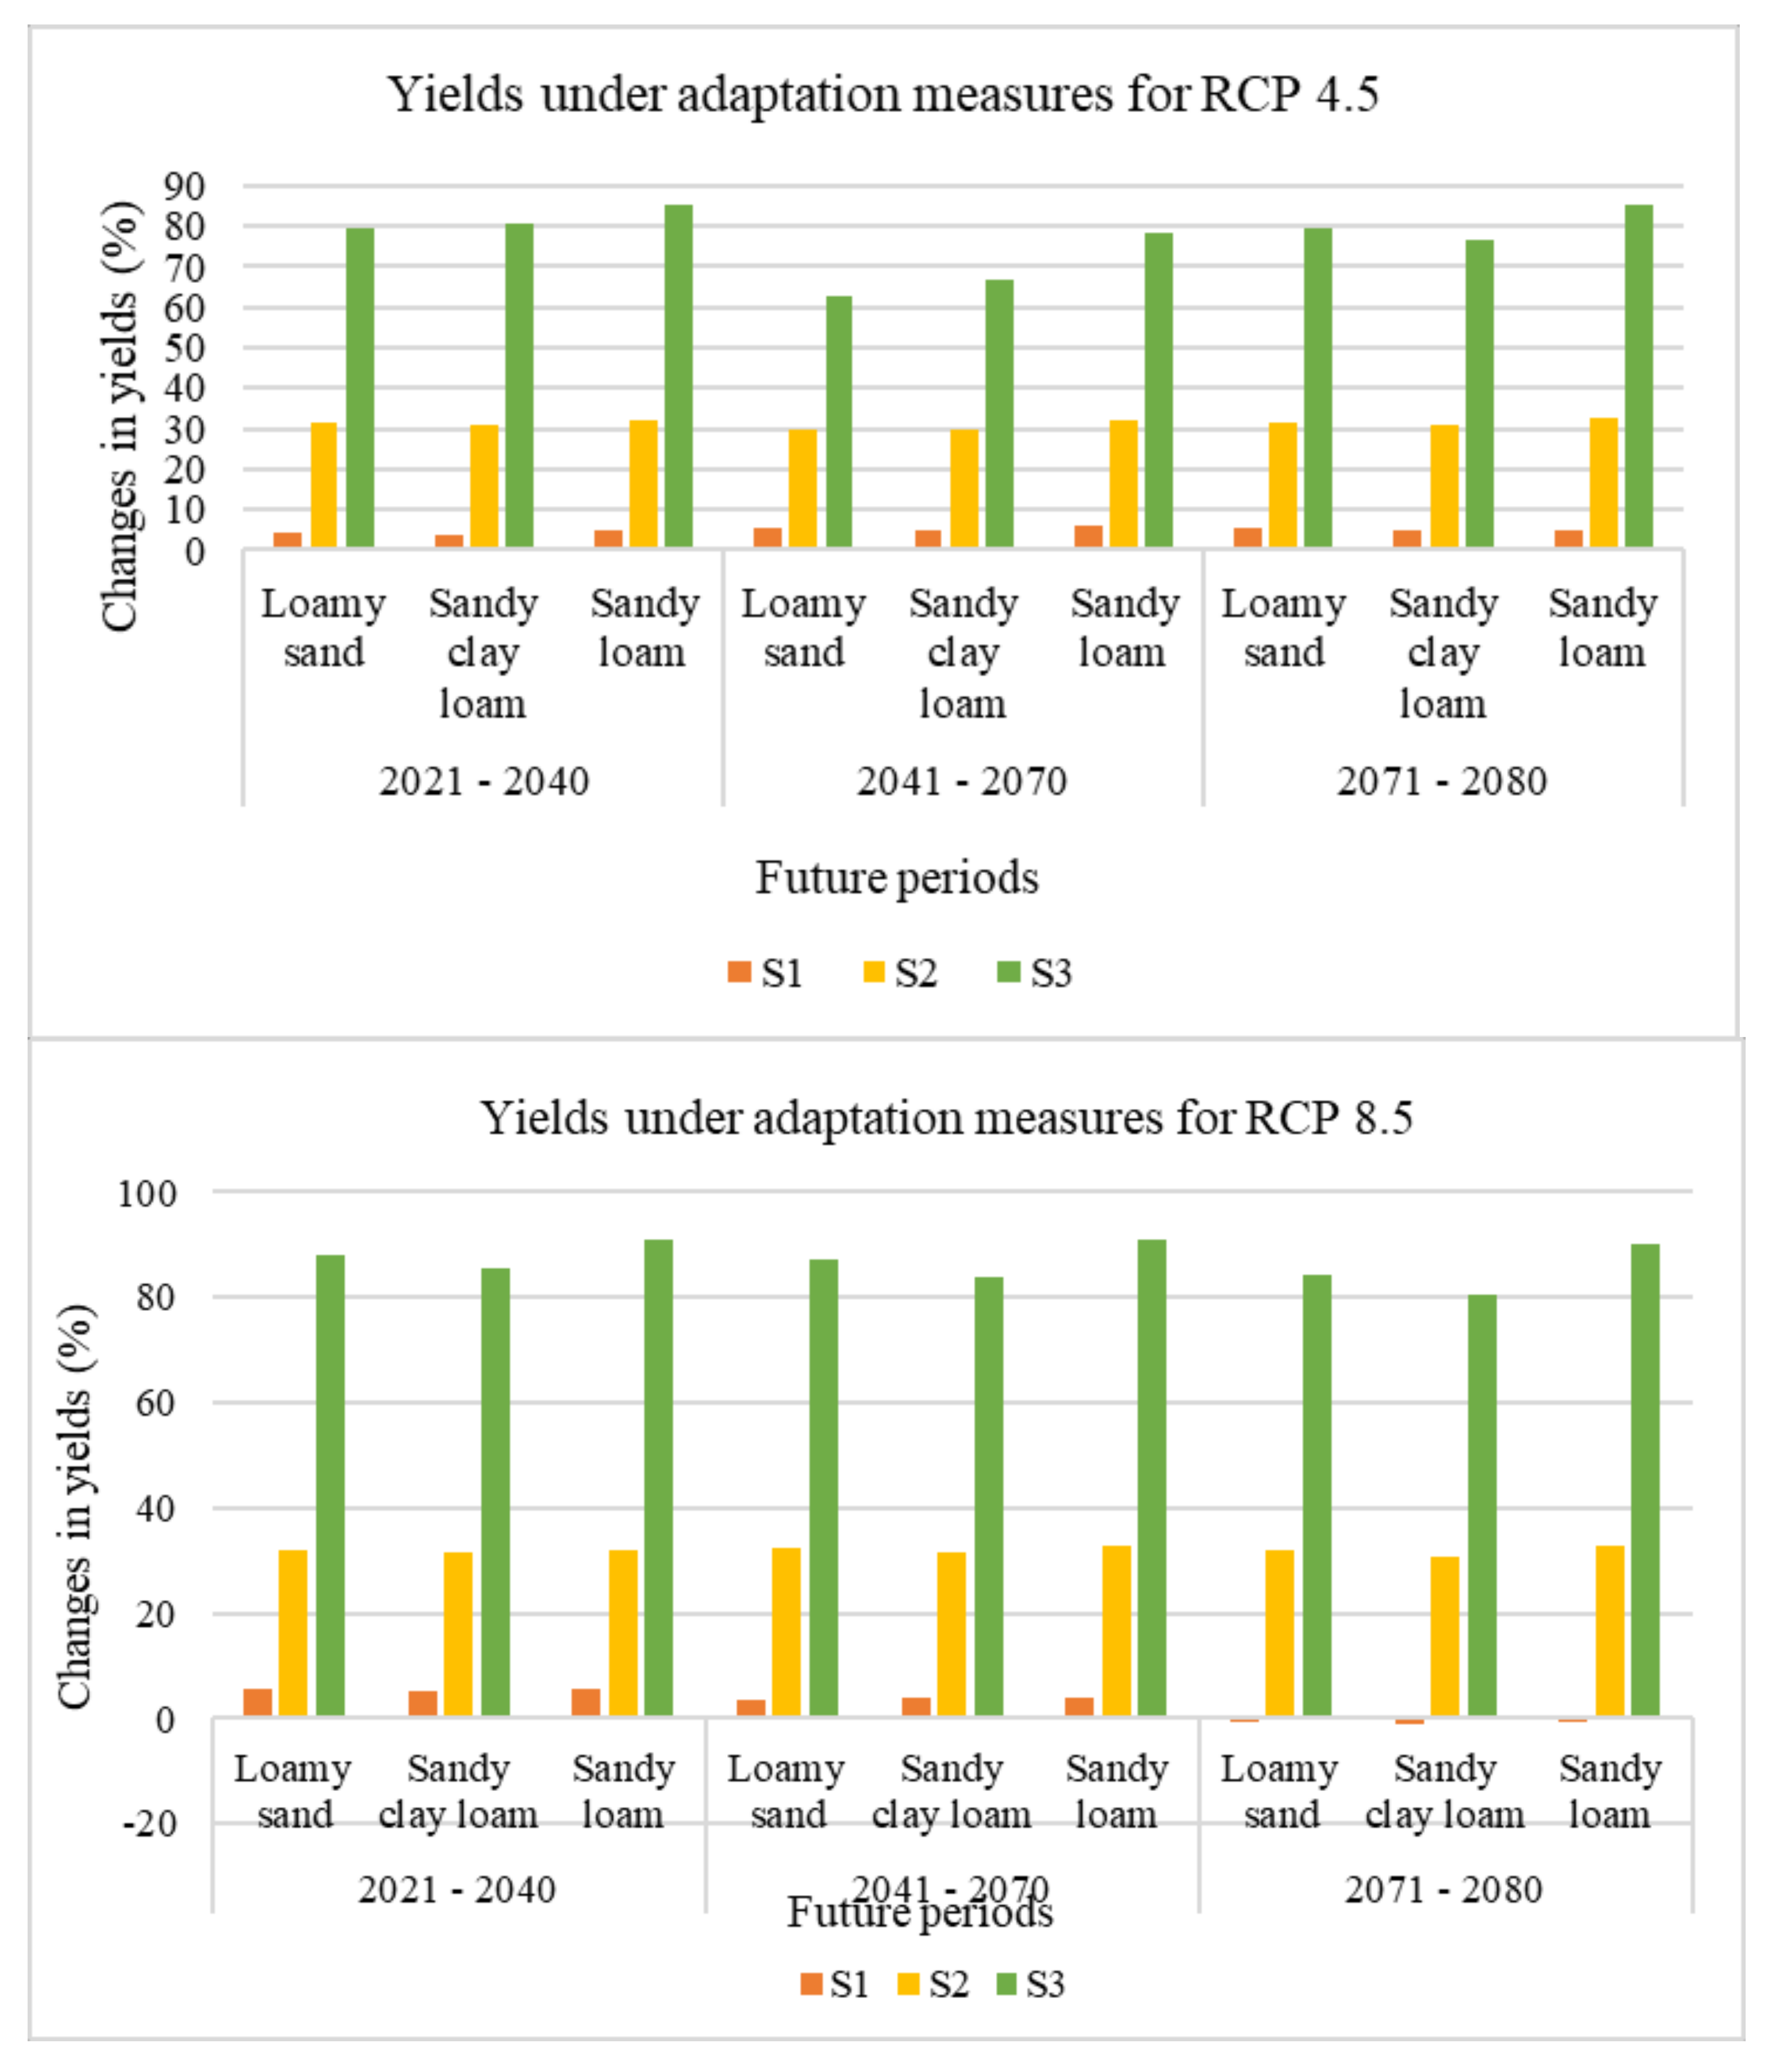
Future simulations and adaptation measures: In order to examine possible adaptation measures that can improve rainfed yields and CWP in the future, three strategies were considered. They are: Supplemental irrigation (Strategy 1 = S1), soil fertility at nitrogen value of 90 kg/ha (Strategy 2 = S2) and soil fertility at nitrogen value of 120 kg/ha (Strategy 3 = S3). The nitrogen value of 90 kg/ha and 120 kg/ha corresponds to near optimal and non-limiting levels of soil fertility in AquaCrop. These values were obtained in field experiments as well as previous studies within the study area [37].
Supplemental irrigation: When the model was run under supplemental irrigation, the allowable depletion, which is the percentage of available soil water that is depleted before irrigation is scheduled [38], was set at 50% of readily available water (RAW), which is the water in the soil that is easily extracted by the plant [39]. This value was obtained after calibration in the model. A total of 50% is the soil water threshold for leaf growth which subsequently affects yield.
2.4.4. Statistical Evaluation of AquaCrop Performance
In order to assess the performance of AquaCrop, four years of data obtained from various locations within the basin were evaluated through R2, RMSE, MAE and NSE. The results show that the simulated yields match well with the observed yields. The average simulated and average observed maize yields were 2.14 t/ha and 2.13 t/ha, respectively. Table 5 shows that the R2, RMSE and MAE of simulated maize yields range from 0.95 to 0.99, 0.008 ton/ha to 0.017 t/ha and 0.007 ton/ha to 0.017 t/ha respectively, while the NSE was 0.90.
2.4.5. Statistical Analysis Methods
Statistical significance tests were done to examine the long-term trends of the parameters during the baseline period (1986–2015); and then compare the future periods (2021–2099) with the baseline period. First of all, elimination of the effects of autocorrelation and serial correction in the time series was performed through the trend free pre-whitening procedure (TFPW) [40,41]. Then, the nonparametric Mann-Kendall (MK) test [42,43] and Sen’s method for long term trend were applied to test if the time series of the parameters was significant at 0.01, 0.05 and 0.1 levels of significance. MK test and Sen’s method have been widely used and well described in previous studies [27,44,45]. These tests were only done for the rainfed simulations.
2.4.6. Extrapolation of AquaCrop Simulations to the Basin Scale’
AquaCrop is a crop model that simulates at farm levels. Simulations were done through a loose coupling of AquaCrop and ArcGIS to obtain CWR, IWR, yield and CWP at a basin scale. The spatial variability of soil textures, crop type and management practices were formed into units to form “projects” under historical simulations. Project is the term used in AquaCrop for multiple simulations. For the future periods, the spatial variability of soil textures, crop type, management practices and different climate scenarios were grouped into small units to form projects. The pre-processing and arrangements of input data for each unit and project were done in ArcGIS software through the union function. The input data pre-processed in ArcGIS was transferred to AquaCrop. Subsequently, the output files from AquaCrop were transferred to ArcGIS through the join function. Therefore, ArcGIS was used for post-processing to display the spatial distribution of CWR, IWR yield and CWP for each project.
3. Results
3.1. CWR, IWR, Yield and CWP in the Past Decades
The seasonal CWR, IWR, yield and CWP of rainfed maize within the study area were estimated based on the climate data of 1986–2015. Since changes in CWR, IWR, yield and CWP during the baseline period were insignificant, no trend analyses were carried out.
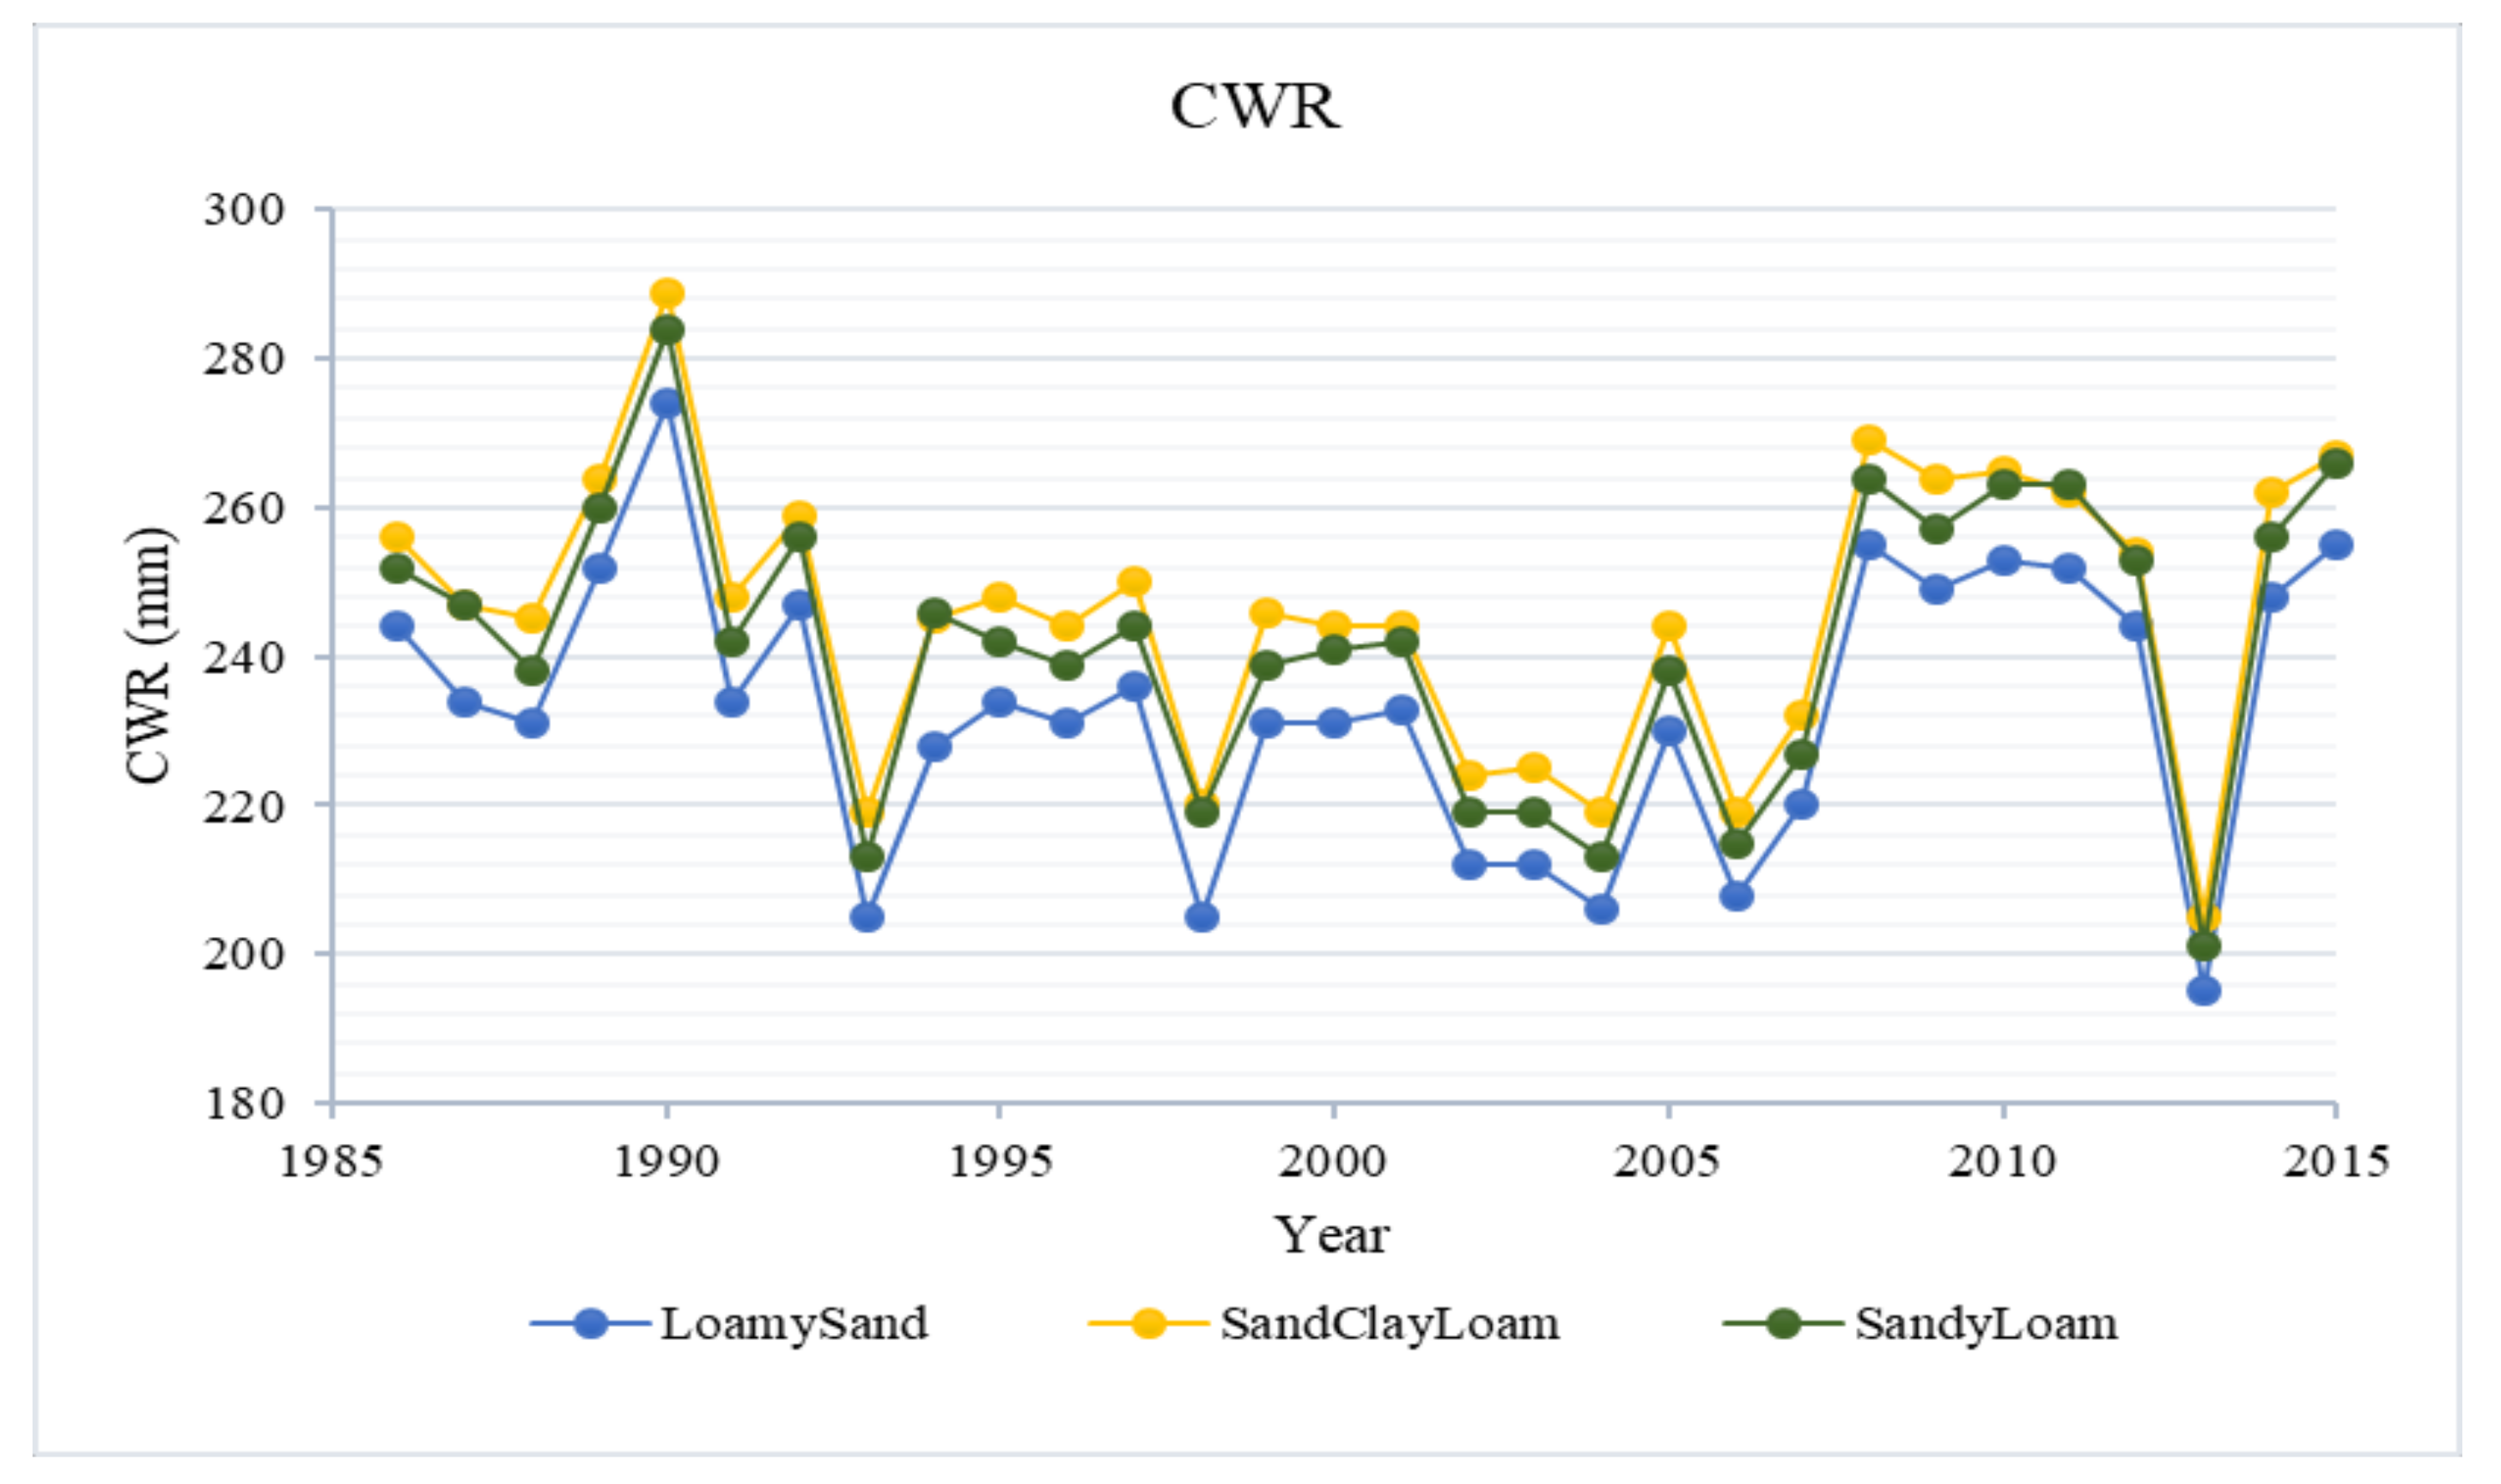
3.1.1. Crop Water Requirement
From the simulations, the CWR ranges from 190 to 289 mm depending on the soil texture and the growing period. The average values of CWR were found to be 233, 246 and 242 mm in loamy sand, sandy clay loam and sandy loam, respectively, Figure 5.
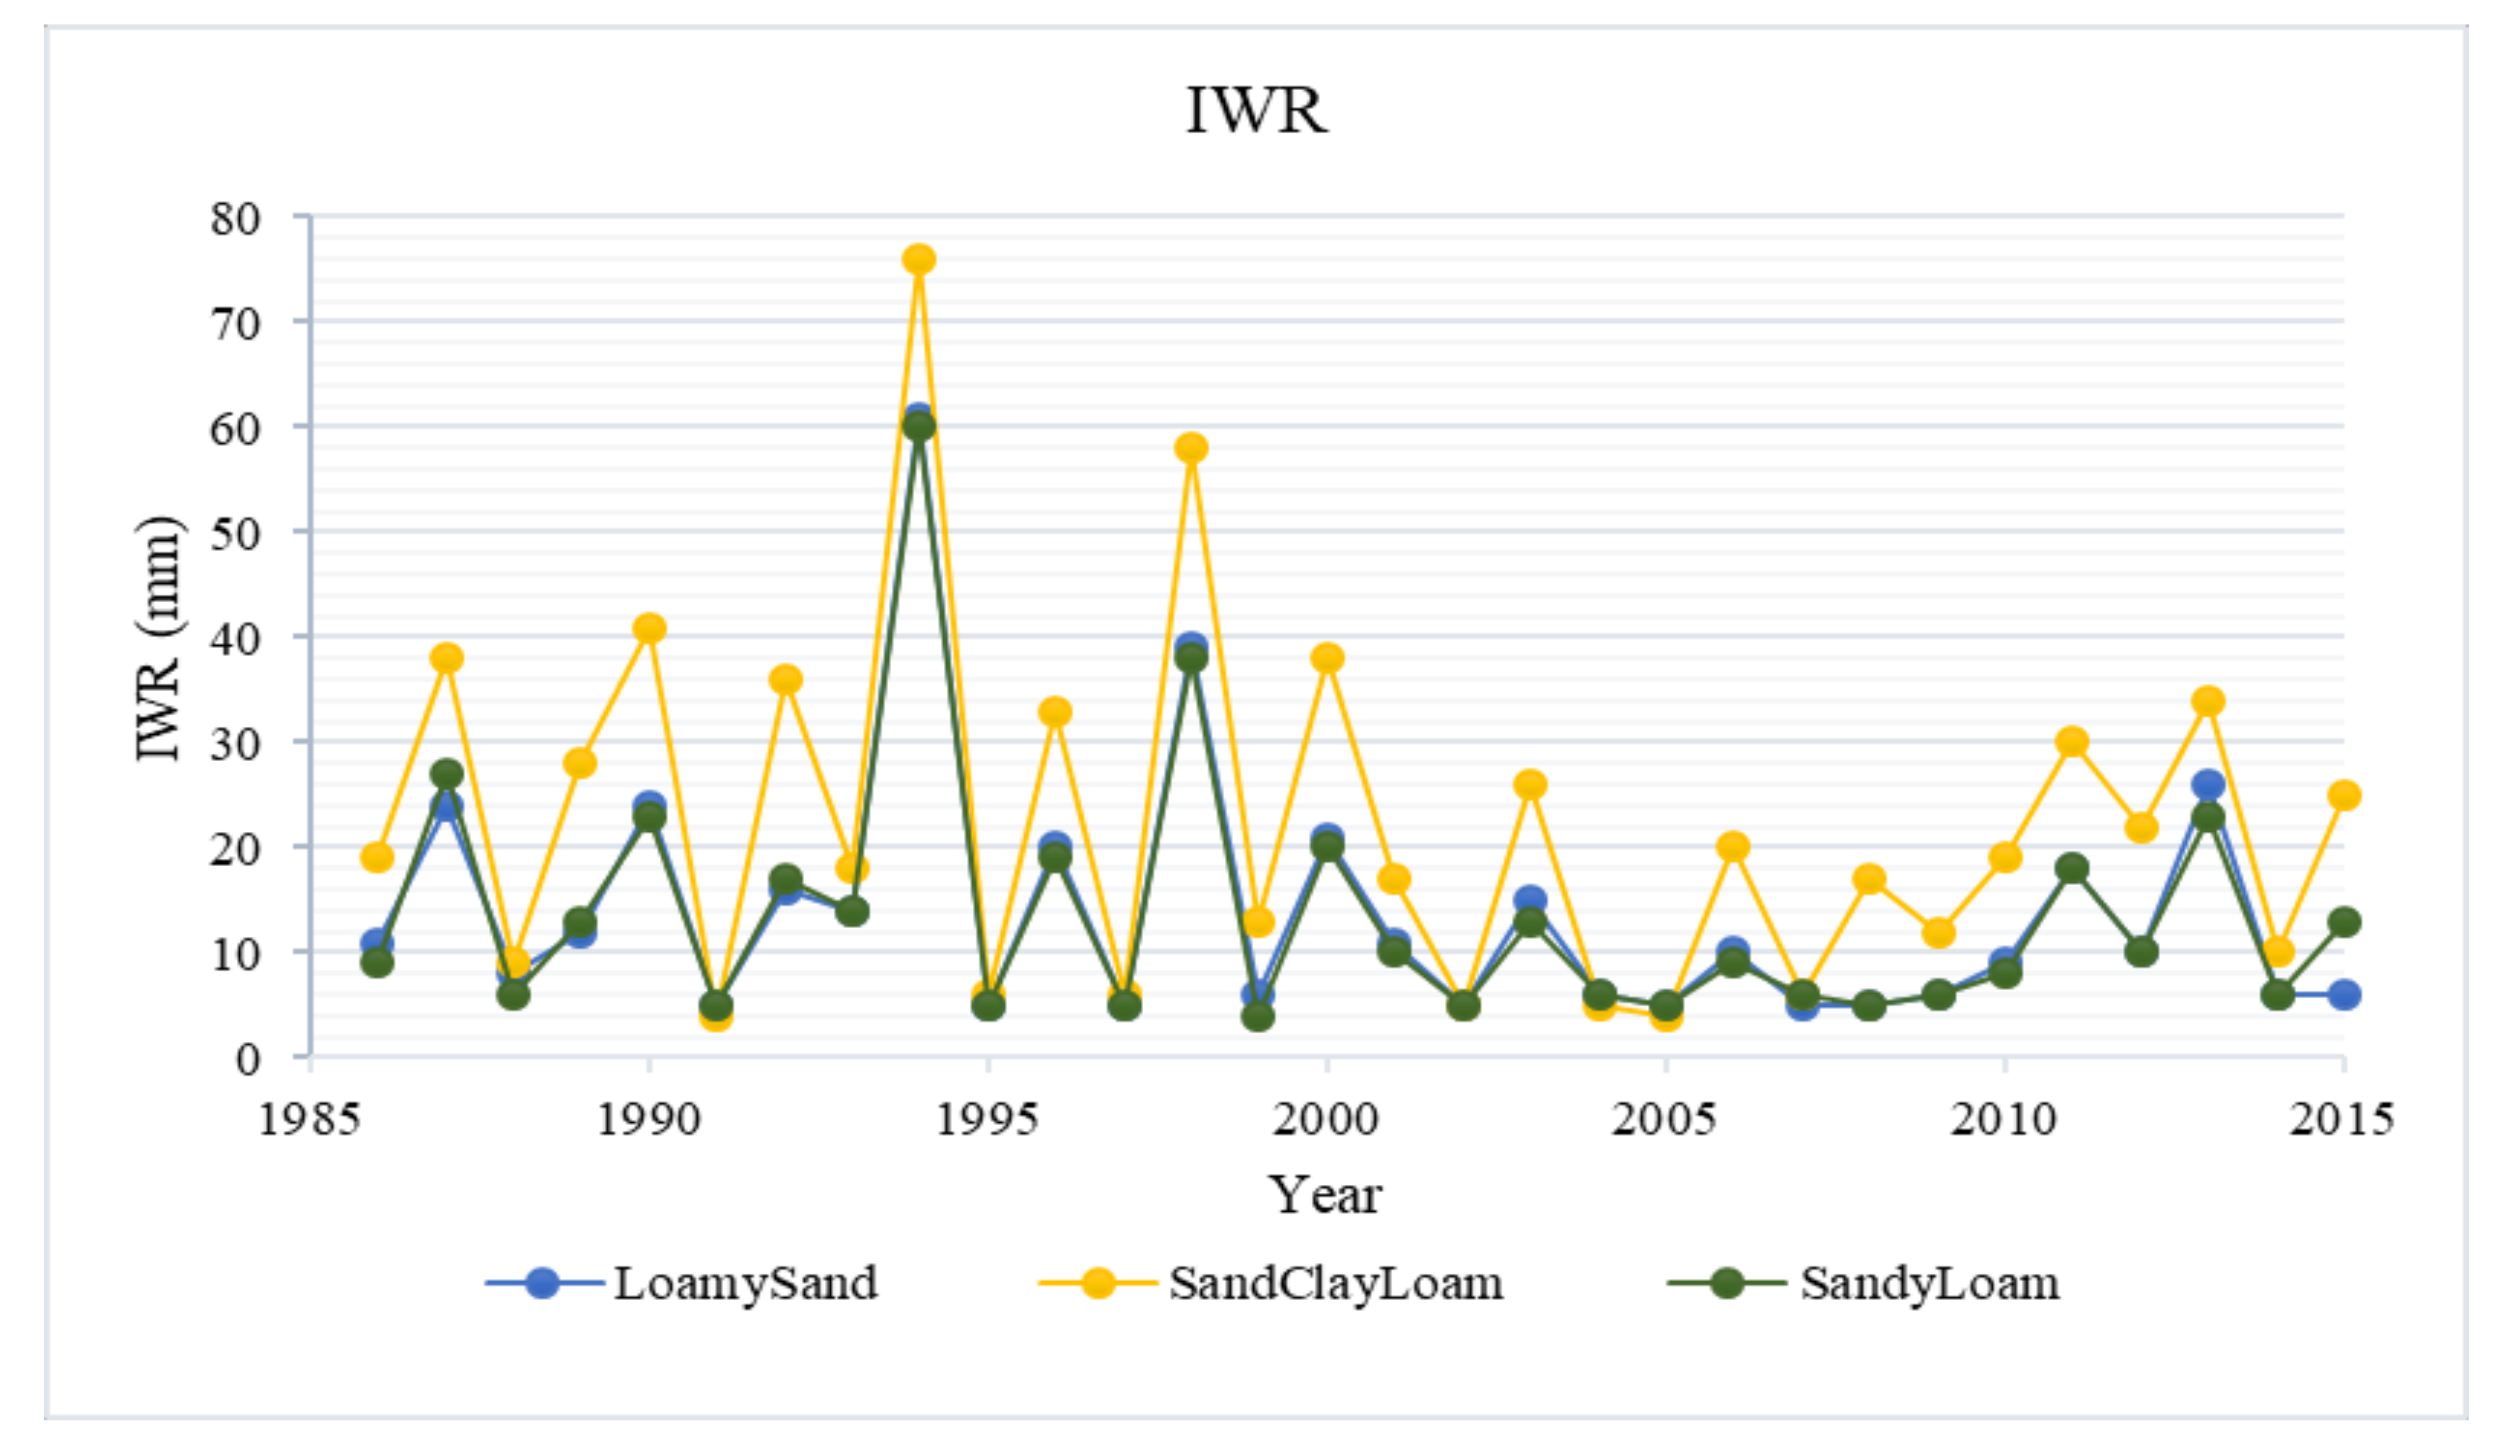
3.1.2. Irrigation Water Requirement
IWR ranges from 5 to 76 mm depending on the soil texture and the growing season. Rainfall variability leads to fluctuations in IWR, where irrigation was not required for optimum growth during some growing periods, which had sufficient rainfall while high irrigation water was required during the drier years, Figure 6.
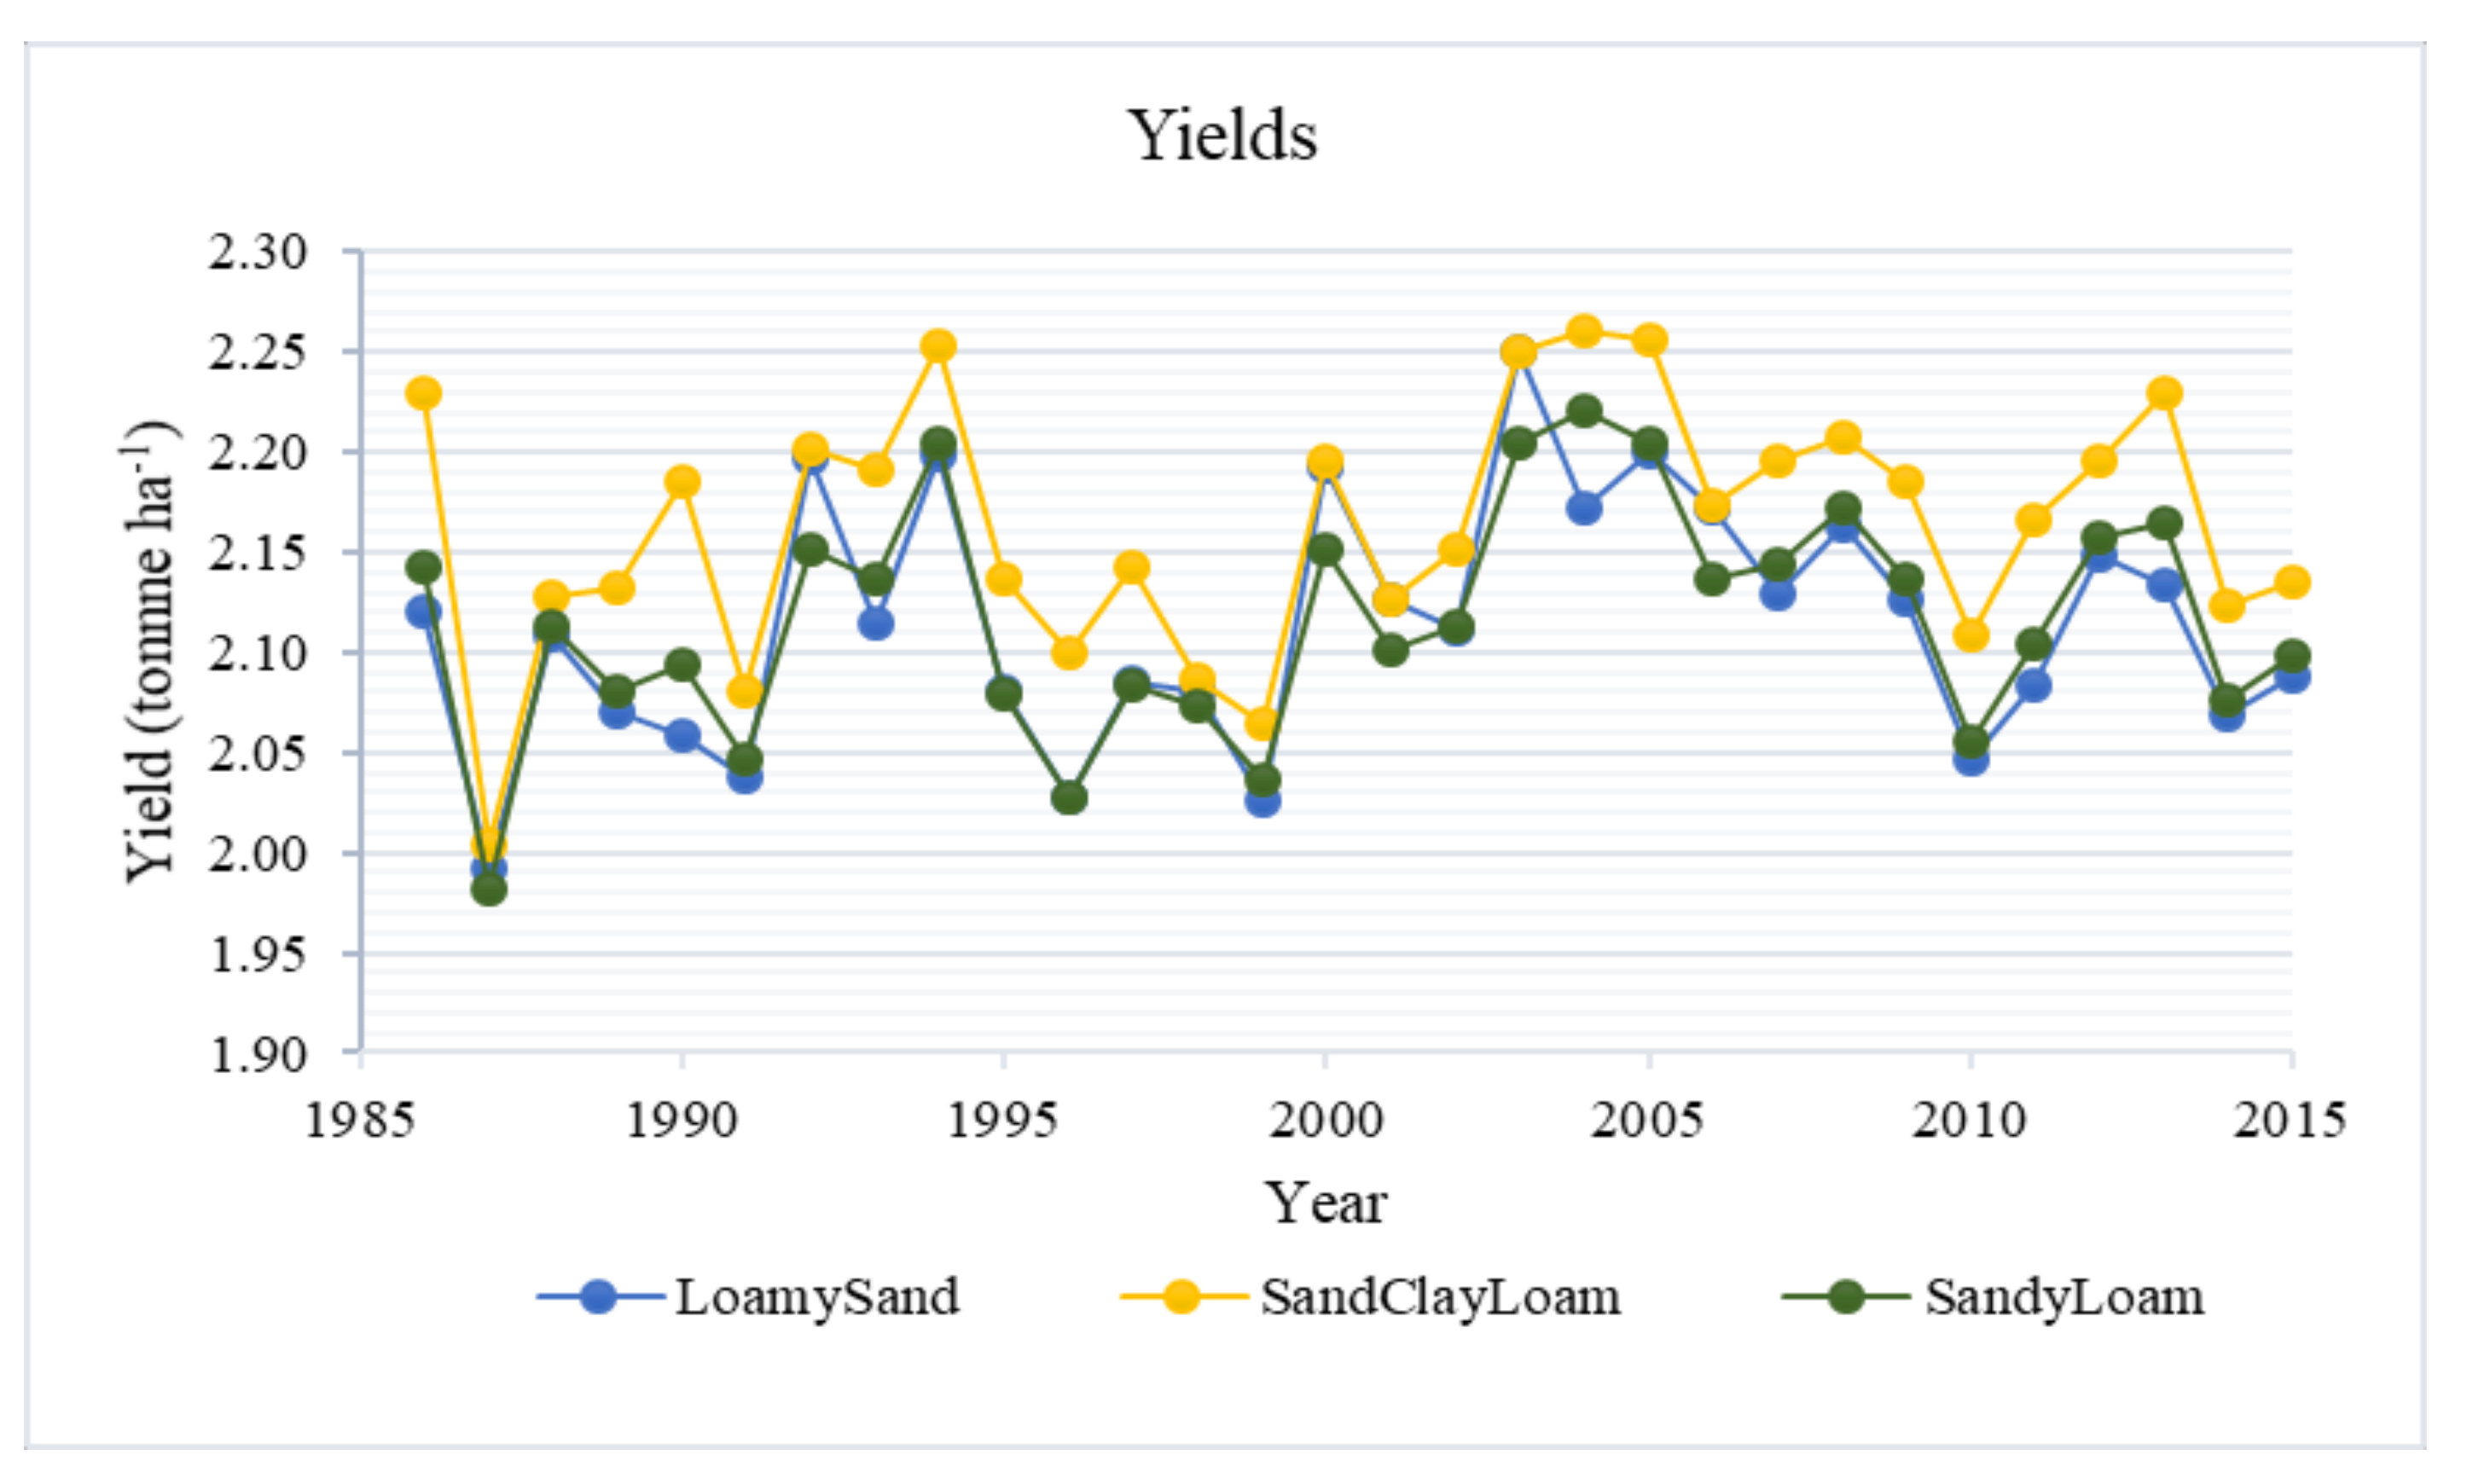
3.1.3. Yield
The yield ranges from 0.61 to 2.26 t/ha. In addition, the average yields obtained on loamy sand, sandy clay loam and sandy loam soils were 2.11, 2.16 and 2.12 ton/ha, respectively, as shown in Figure 7. The lowest and highest simulated yields were 1.98 and 2.26 t/ha, respectively.
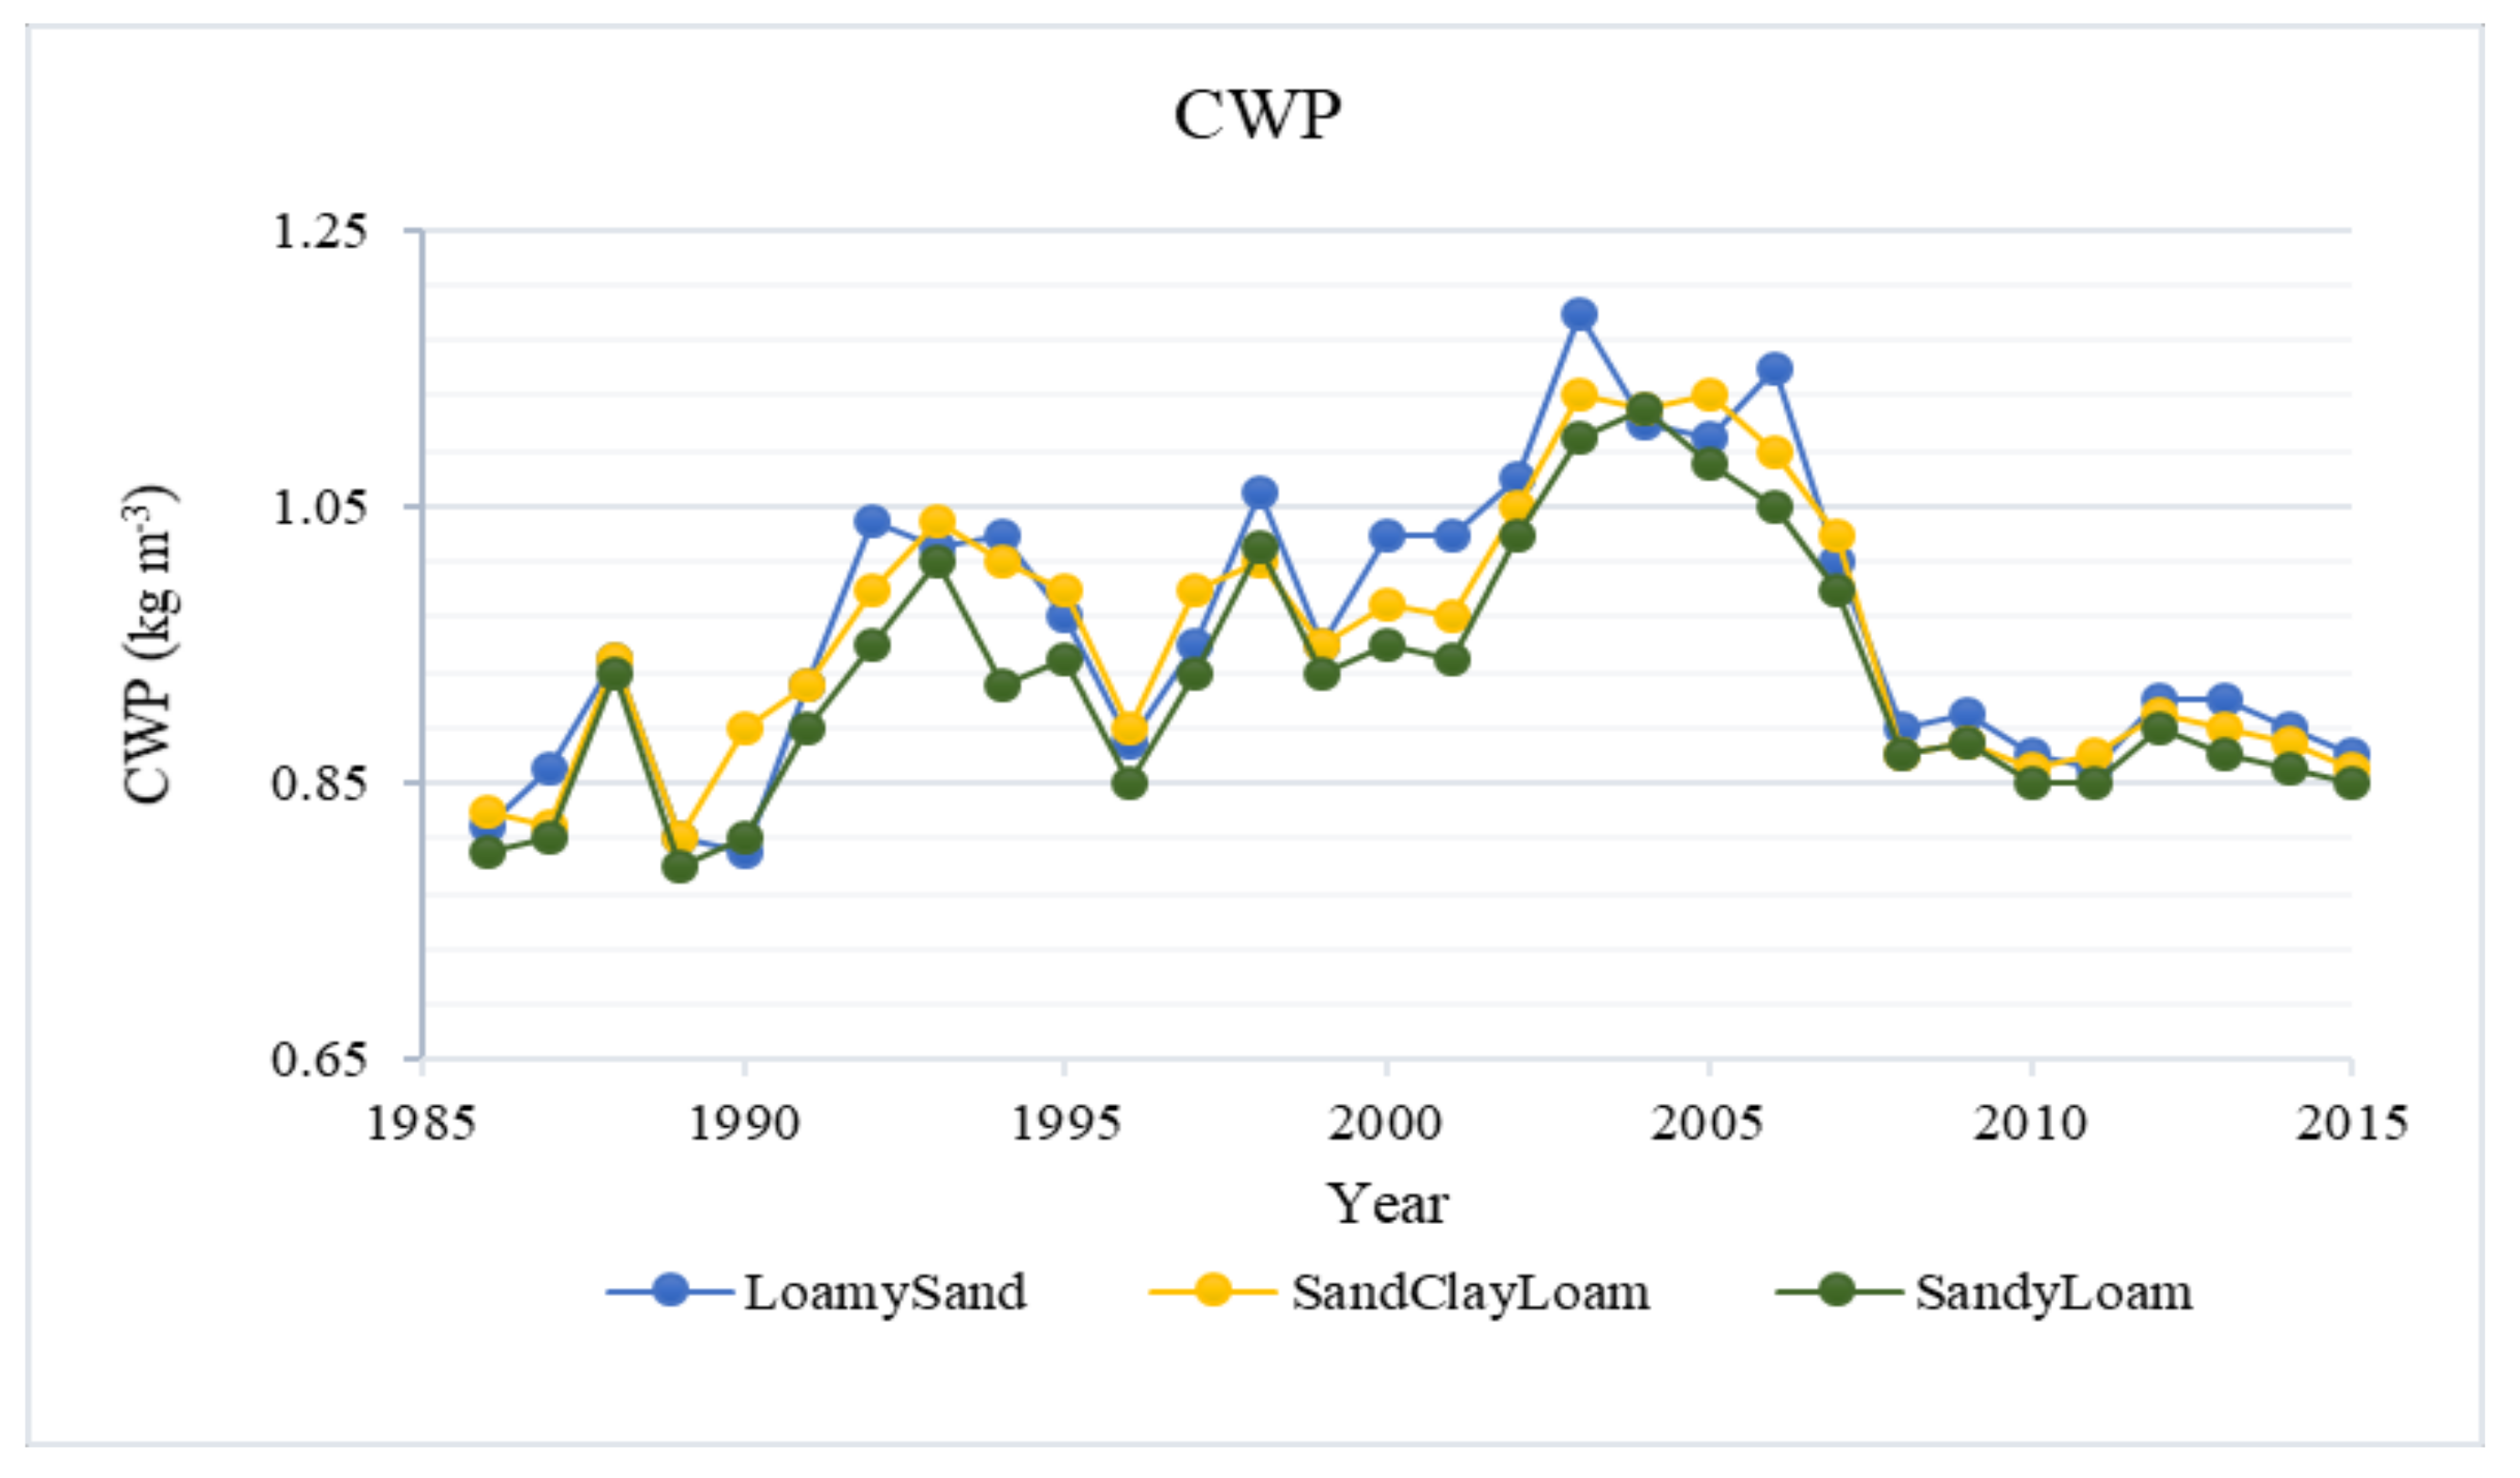
3.1.4. Crop Water Productivity
CWP ranges from 0.40 kg/m3 to 1.13 kg/m3 depending on the soil texture, Figure 8. It is worthy to note that there was an increase in CWP from 1986 till 2007 before declining from 2008 till 2015.
3.2. Future Changes in Climatic Parameters under Different Climate Change Scenarios
Under RCP 4.5 and RCP 8.5 scenarios, Table 6, rainfall will decrease in the basin except in the period of 2041–2070, while both minimum and maximum temperatures will increase gradually.
RCP 8.5 is expected to be generally hotter than RCP 4.5 since RCP 8.5 is referred to as the worst-case scenario of elevated CO2 concentrations and temperature.
3.3. Temporal Changes in Future Seasonal CWR, IWR, Yield and CWP
The future CWR, IWR, yield and CWP of rainfed maize were simulated for future periods of near future (2021–2040), mid-century (2041–2070) and late-century (2071–2099) under RCP 4.5 and RCP 8.5 scenarios based on the projections of HadGEM2-ES model. The period of 1986–2015 was used as a baseline period to estimate the temporal changes in CWR, IWR, yield and CWP of maize across the basin in the three future periods.
3.3.1. Changes in Future Seasonal CWR
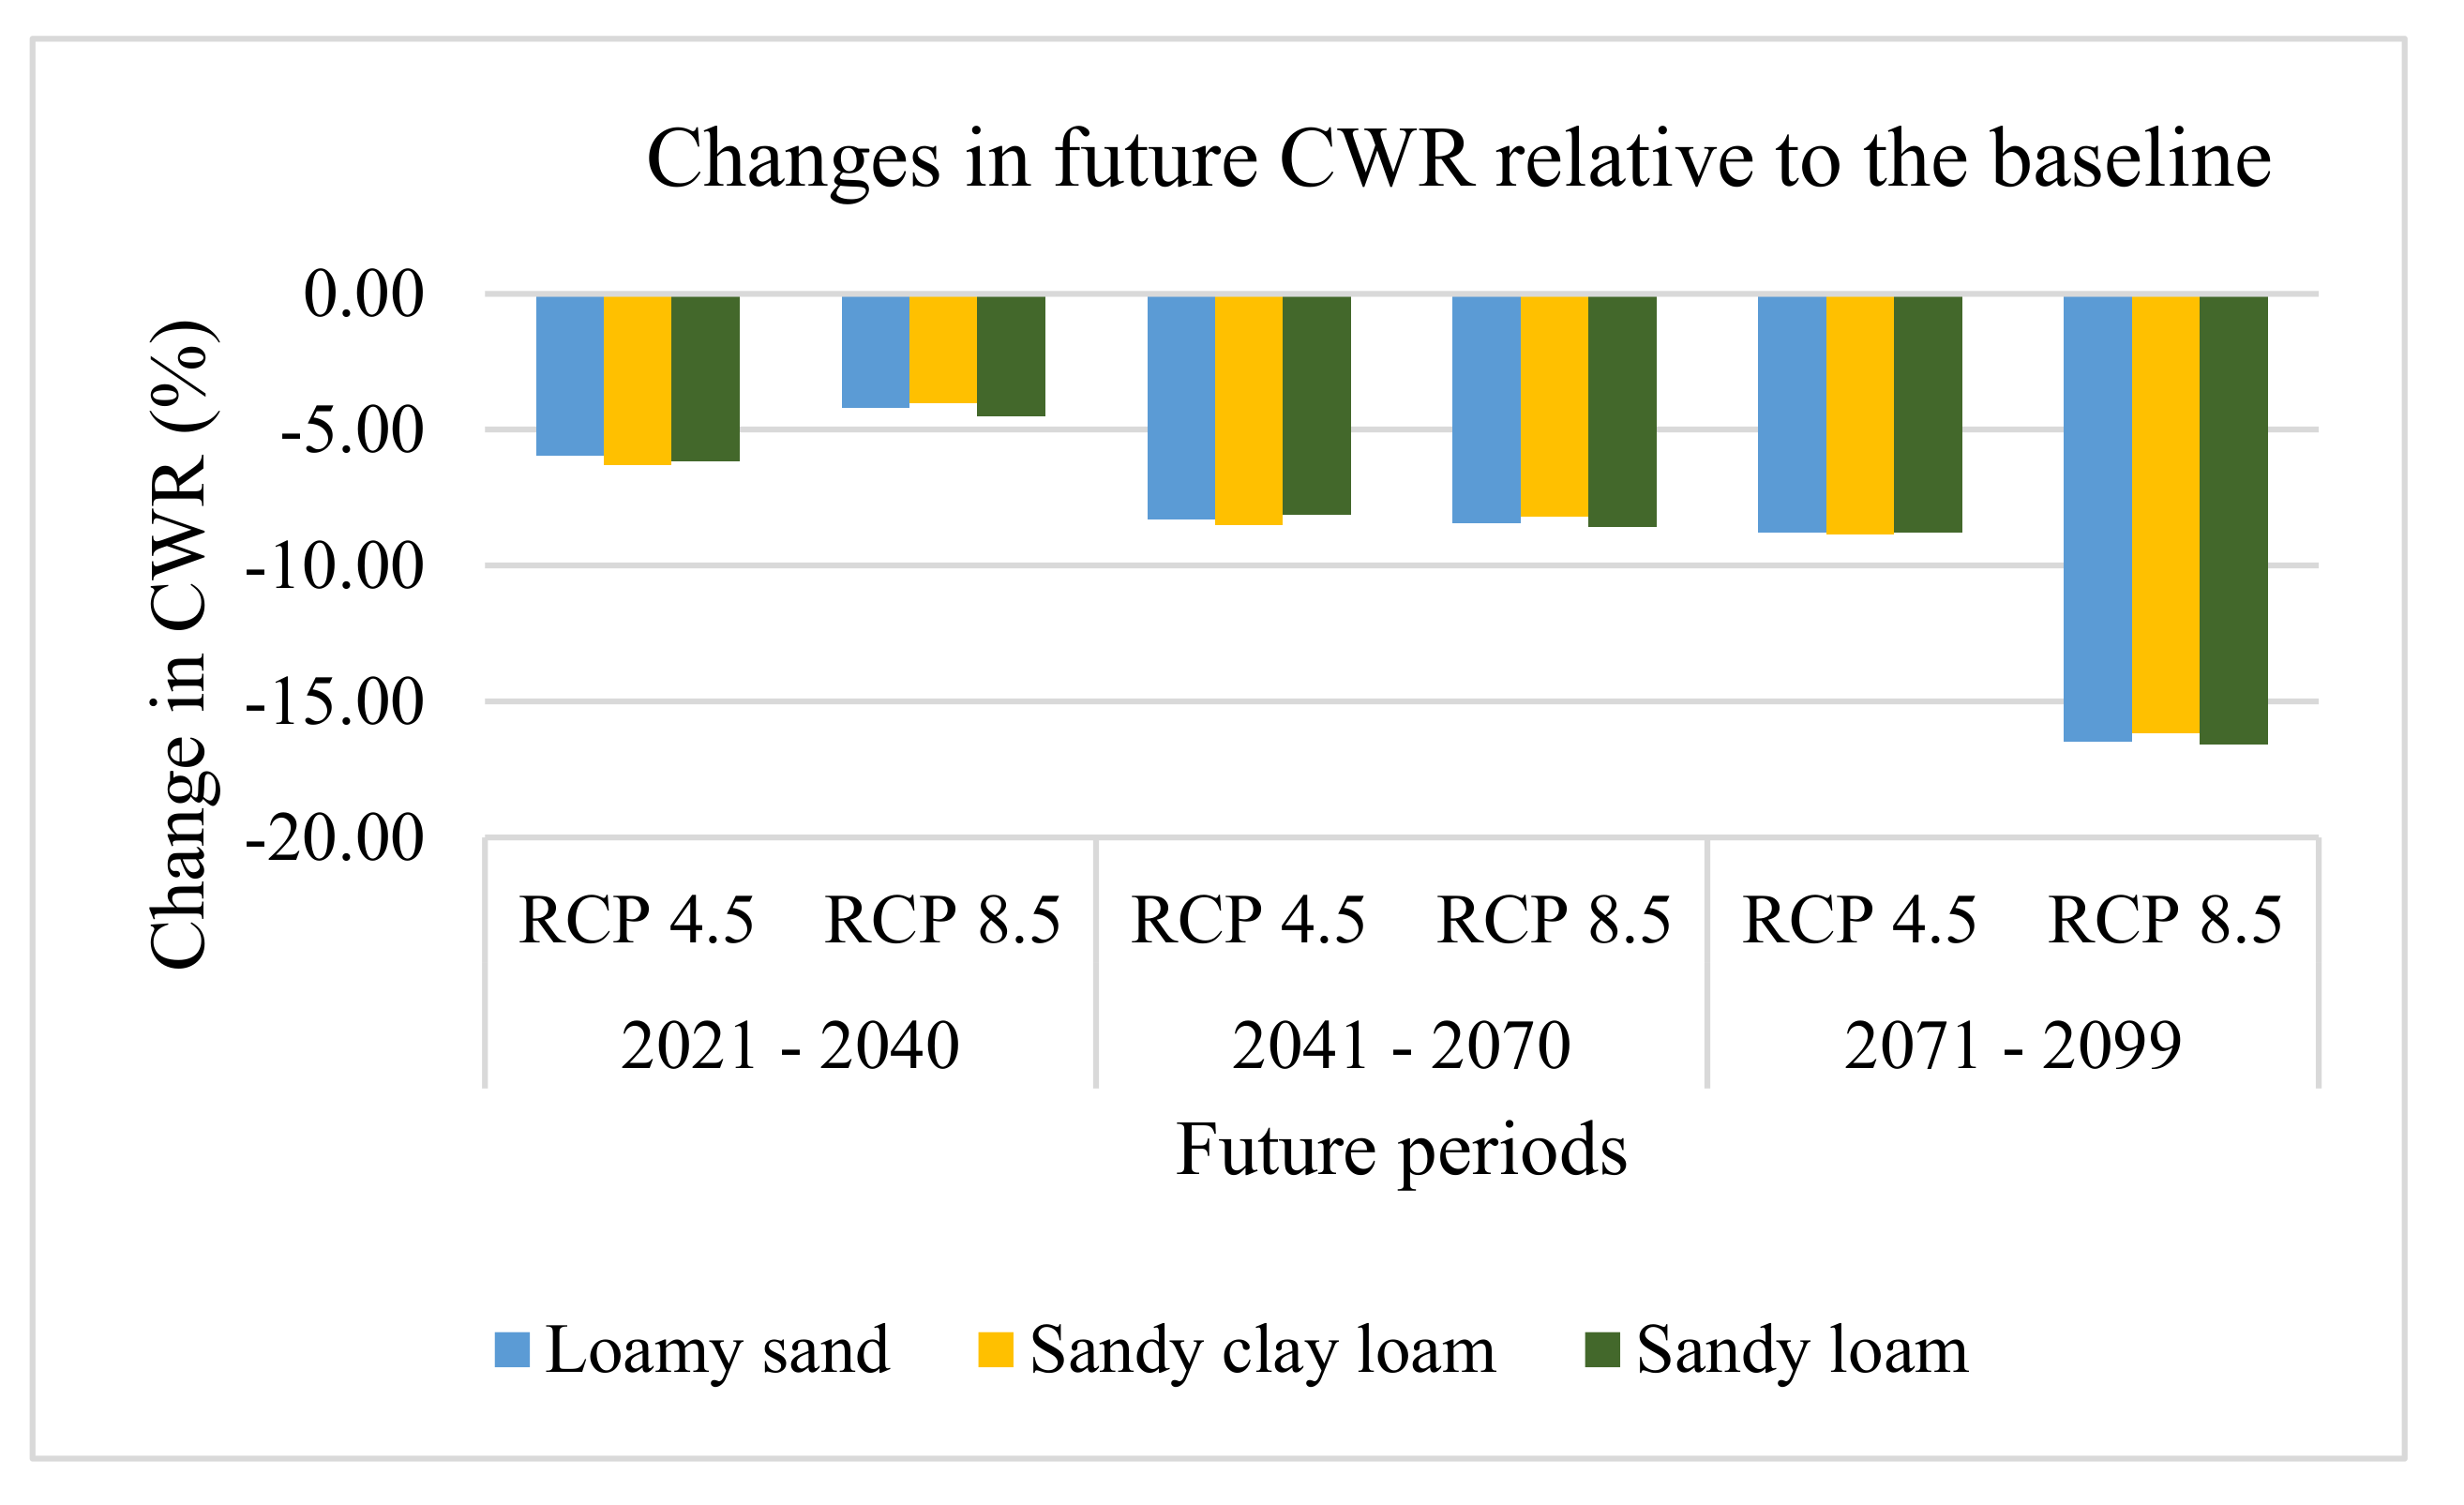
The simulations show that climate change will have a significant effect on CWR under RCP 4.5 and RCP 8.5 scenarios. The analyses show that the range of decrease in CWR is from 4.5 to 18.0%, Figure 9.
3.3.2. Changes in Future Seasonal IWR
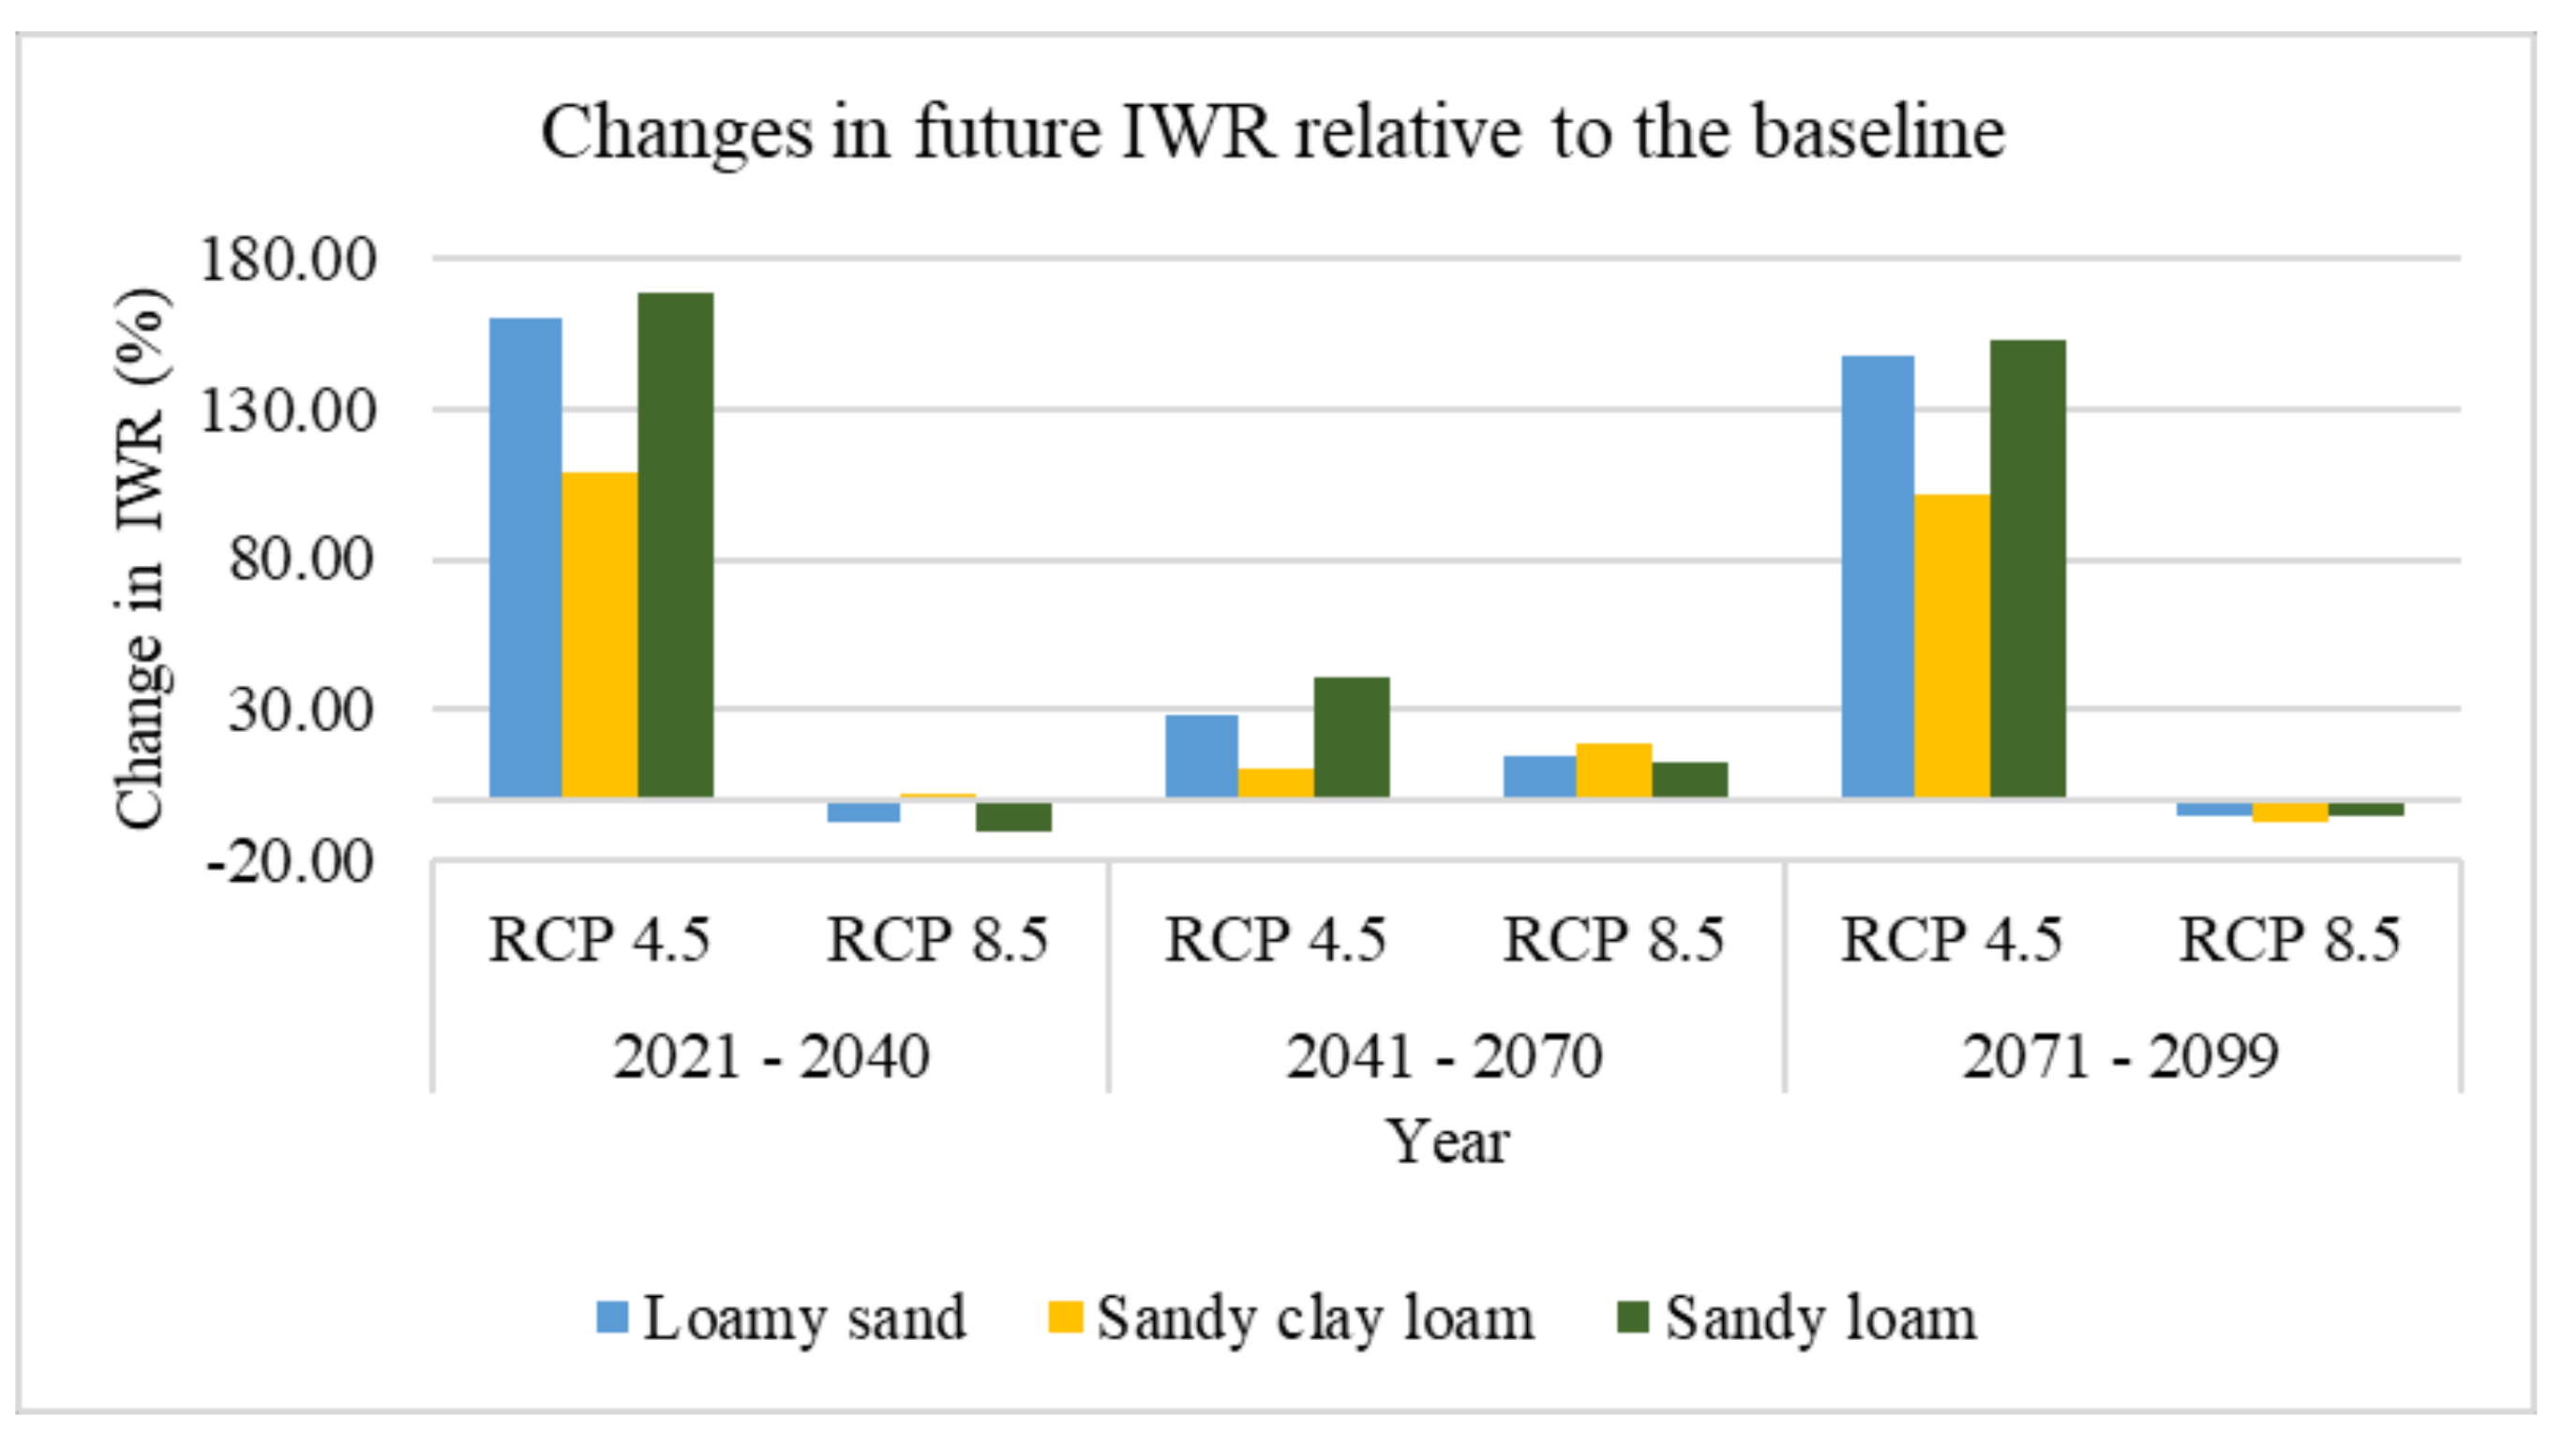
IWR values are projected to have huge variations, Figure 10. The simulations show that climate change will not significantly affect IWR under RCP 4.5 but will be significant under RCP 8.5. Under RCP 4.5 scenario, irrigation requirement is projected to be higher in the period 2021–2040 and the period of 2071–2099.
3.3.3. Changes in Future Crop Yields
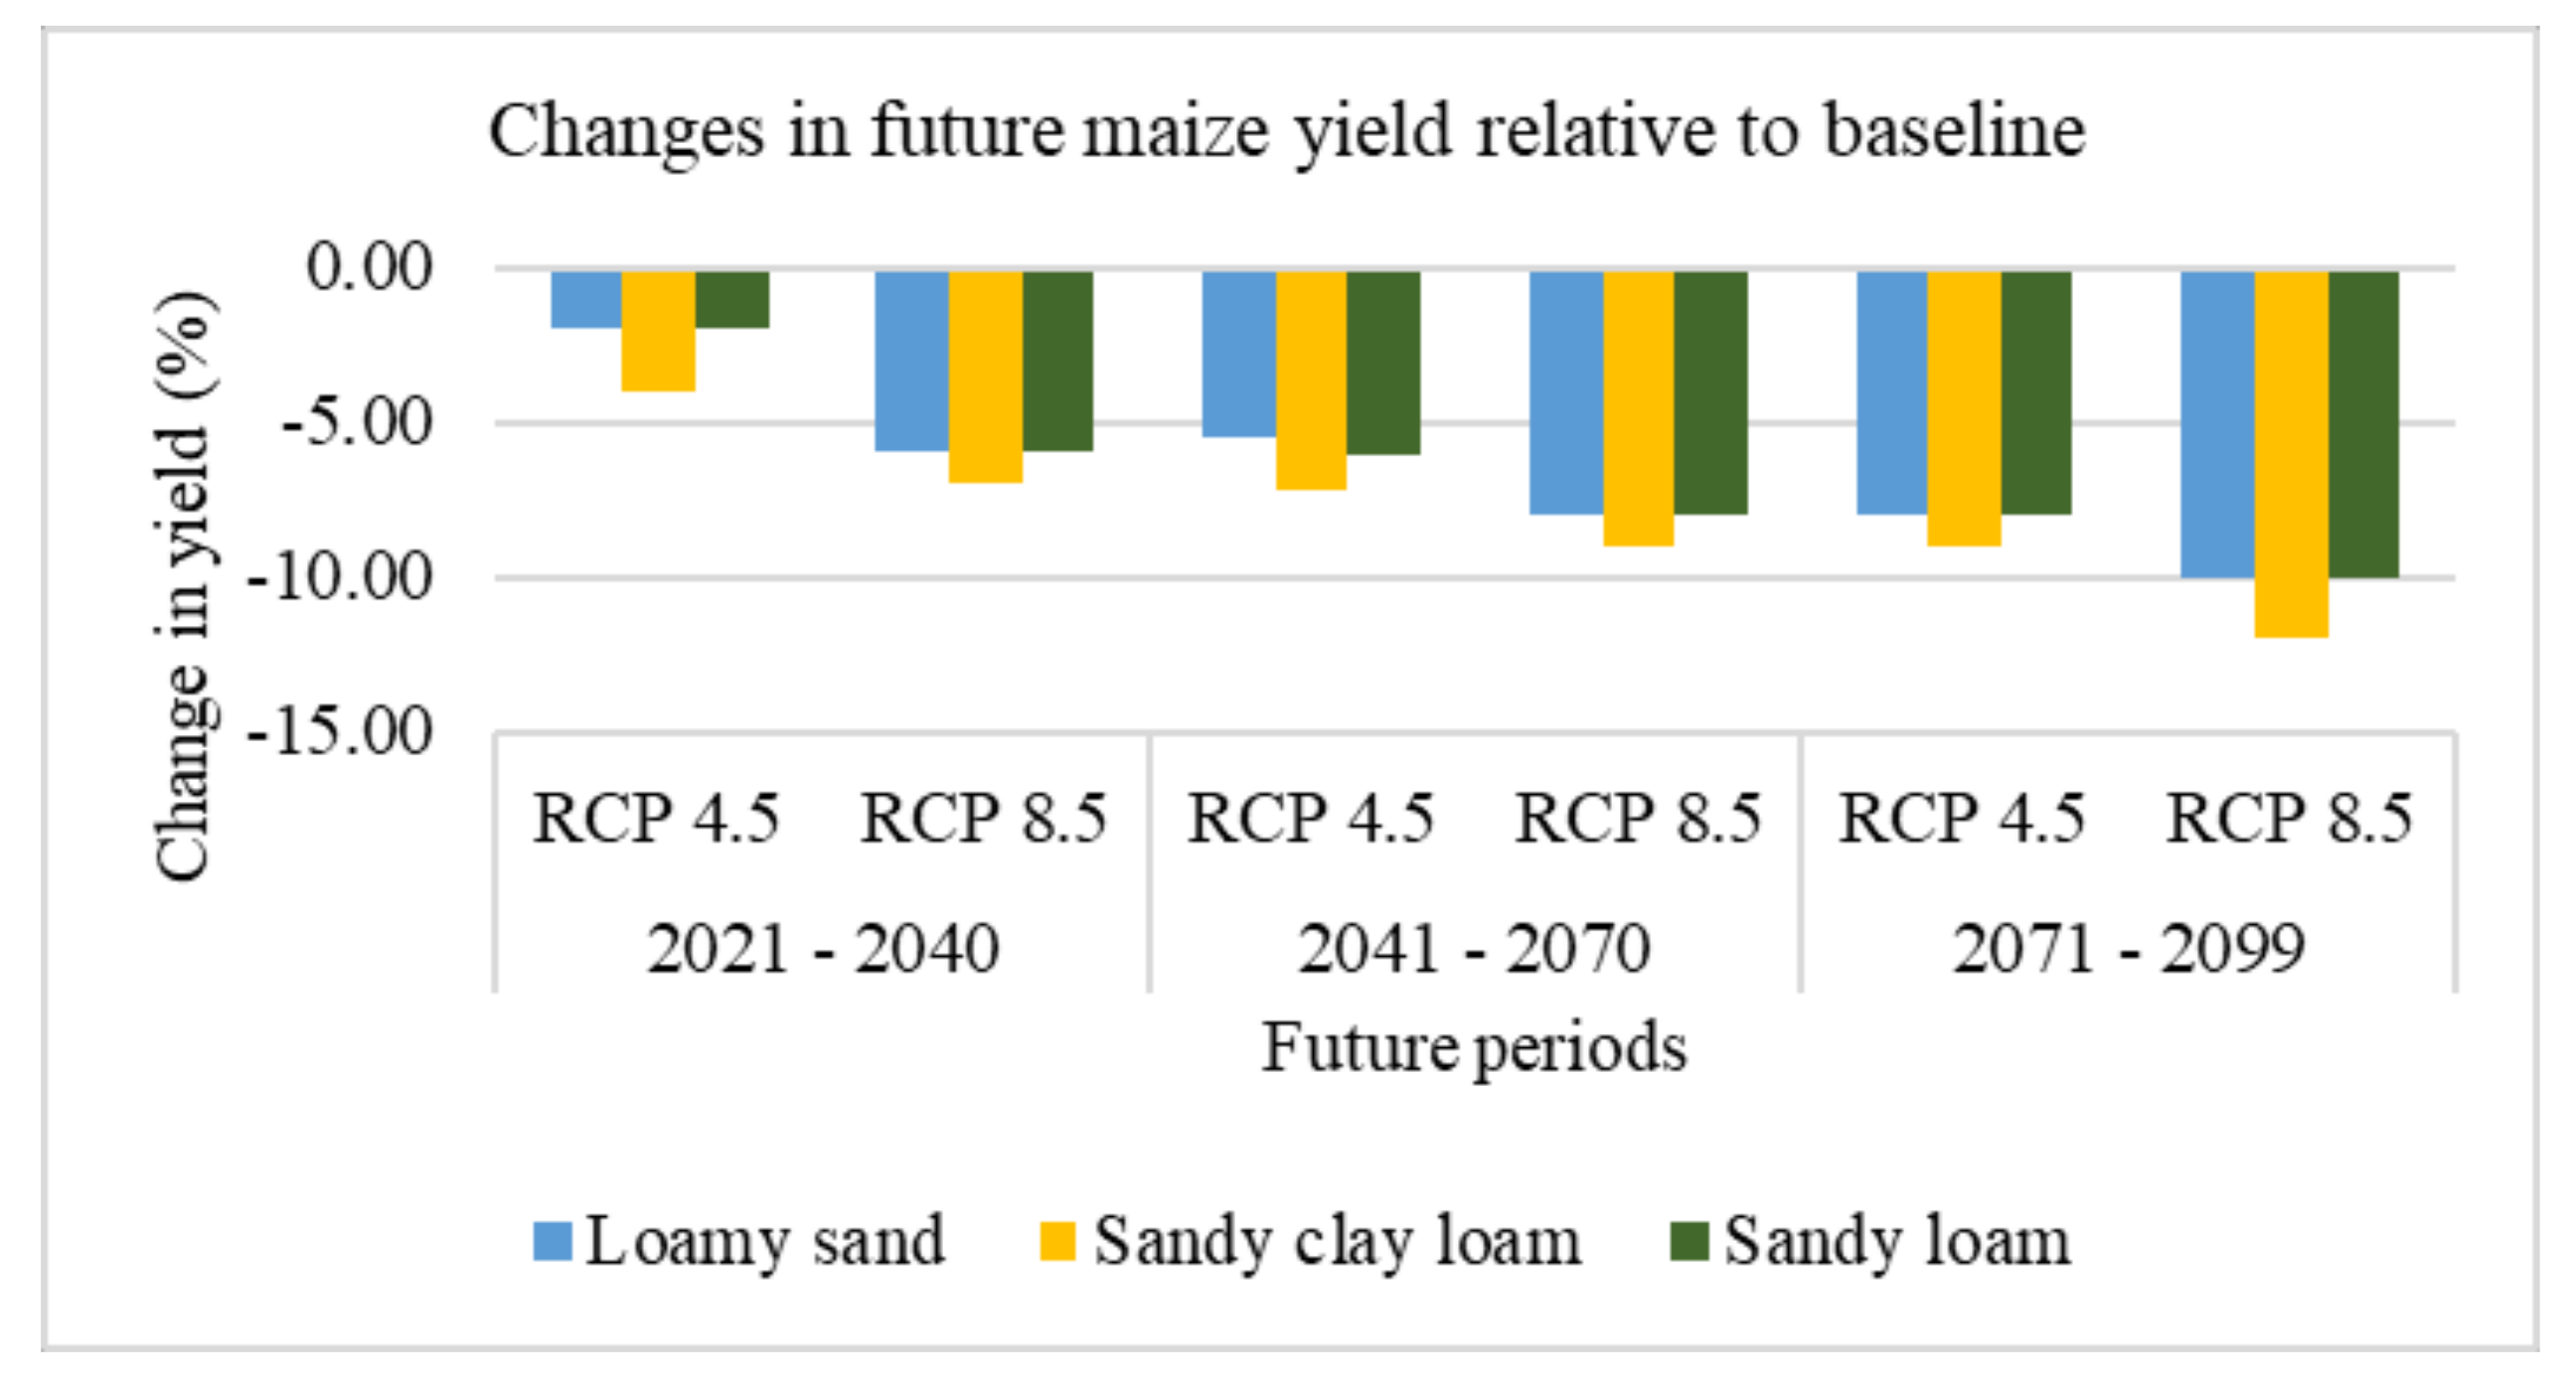
Under RCP 4.5, the average maize yield is projected to be 2.07, 2.00 and 1.96 t/ha in the near future, mid-century and late century, respectively. Similarly, under RCP 8.5, the average maize yields are projected to be 1.95, 1.95 and 1.90 in the near future, mid-century and late century, respectively.
The future yield will significantly decrease under all scenarios. According to Figure 11, maize yields will generally decrease gradually until the late century under both RCP 4.5 and RCP 8.5 scenarios. Therefore, adaptation measures will be inevitable within this region.
3.3.4. Changes in Future CWP
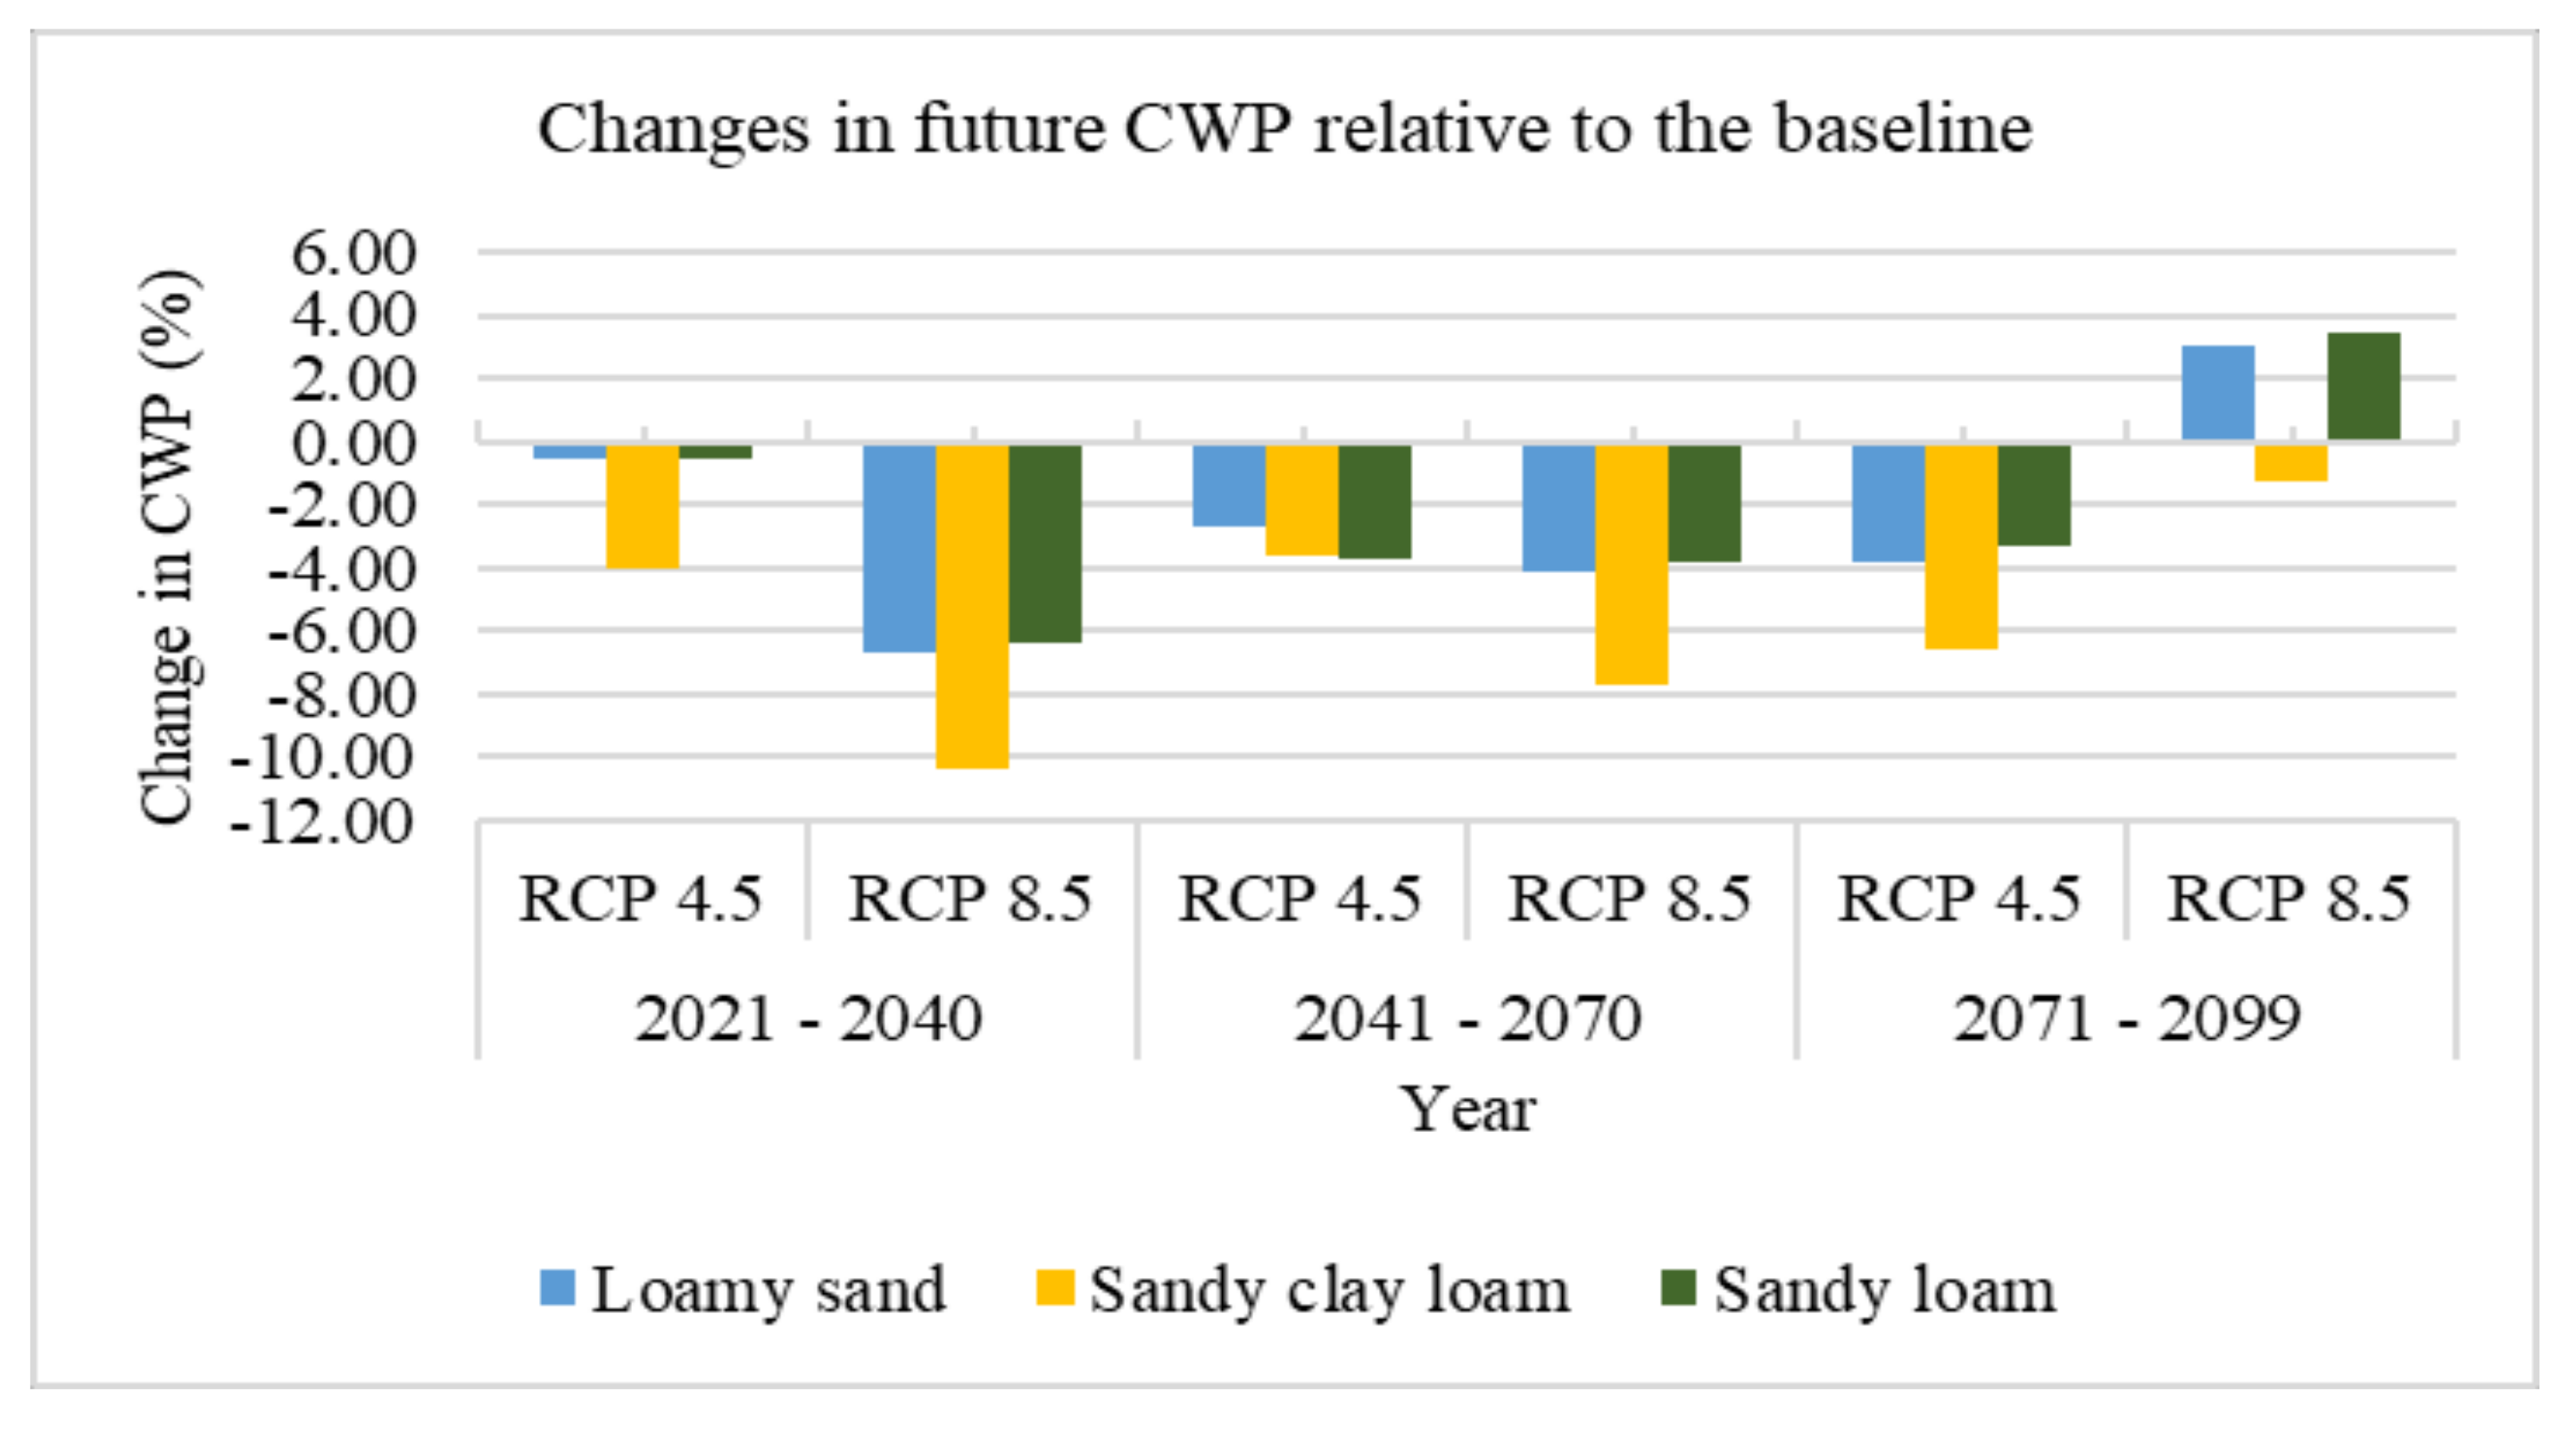
The simulated future CWP of maize within the basin shows different variations for the future periods under different climate change scenarios. The results show that some years will have a high CWP up to 1.08 kg/m3 while some will have a low CWP up to 0.66 kg/m3. The results show that generally, CWP will decrease compared to the baseline except in the late century under RCP 8.5 when a small increase is expected, Figure 12.
From the simulations, the range of the growing period of maize is projected to be 64 to 70 days. When compared with the baseline, the reduction in maize growing period will vary from 8 to 10 days.
3.4. Significance Tests for Future Scenarios.
In order to test the significance and examine the long-term trend in the future simulations compared with the baseline, the values were subjected to KK and Sen slope tests. The results shown in Table 7 demonstrate that the declining trend of CWR is significant for both RCP 4.5 and RCP 8.5 at different levels. Furthermore, the declining trend will likely be more pronounced under RCP 8.5 for all the simulated variables except CWP which will likely increase. Of paramount importance in this paper is the significant decline in maize yields. The significance test shows that yield will likely decline across all years and climate change scenarios.
3.5. Possible Adaptation Measures that Can Improve Yield and CWP under Different Climate Change Scenarios
Furthermore, some climate risk adaption measures (S1, S2 and S3) were examined on rainfed maize to see if they could be capable of improving yields and CWP under RCPs 4.5 and 8.5 based on different soil textures. Currently, in the basin, supplemental irrigation (S1) is alien to the farmers and most times, fertilizers are not usually available to farmers.
The results shown in Figure 13 and Figure 14 show that supplemental irrigation has little effect on improving yields and CWP compared with the other measures examined within the basin. S1 is projected to increase rainfed maize yield by 4.3, 5.5, and 4.1% in the near future, mid-century and late century respectively under RCPs 4.5 and 8.5 On the other hand, S2 can greatly increase yield by 31.3, 30.7, and 31.7% in the near future, mid-century and late century respectively under RCPs 4.5 and 8.5. Among the three strategies, S3 has the highest impact as it can improve yields by 81.1, 78.0, and 82.2% in the near future, mid-century and late century respectively under RCPs 4.5 and 8.5.
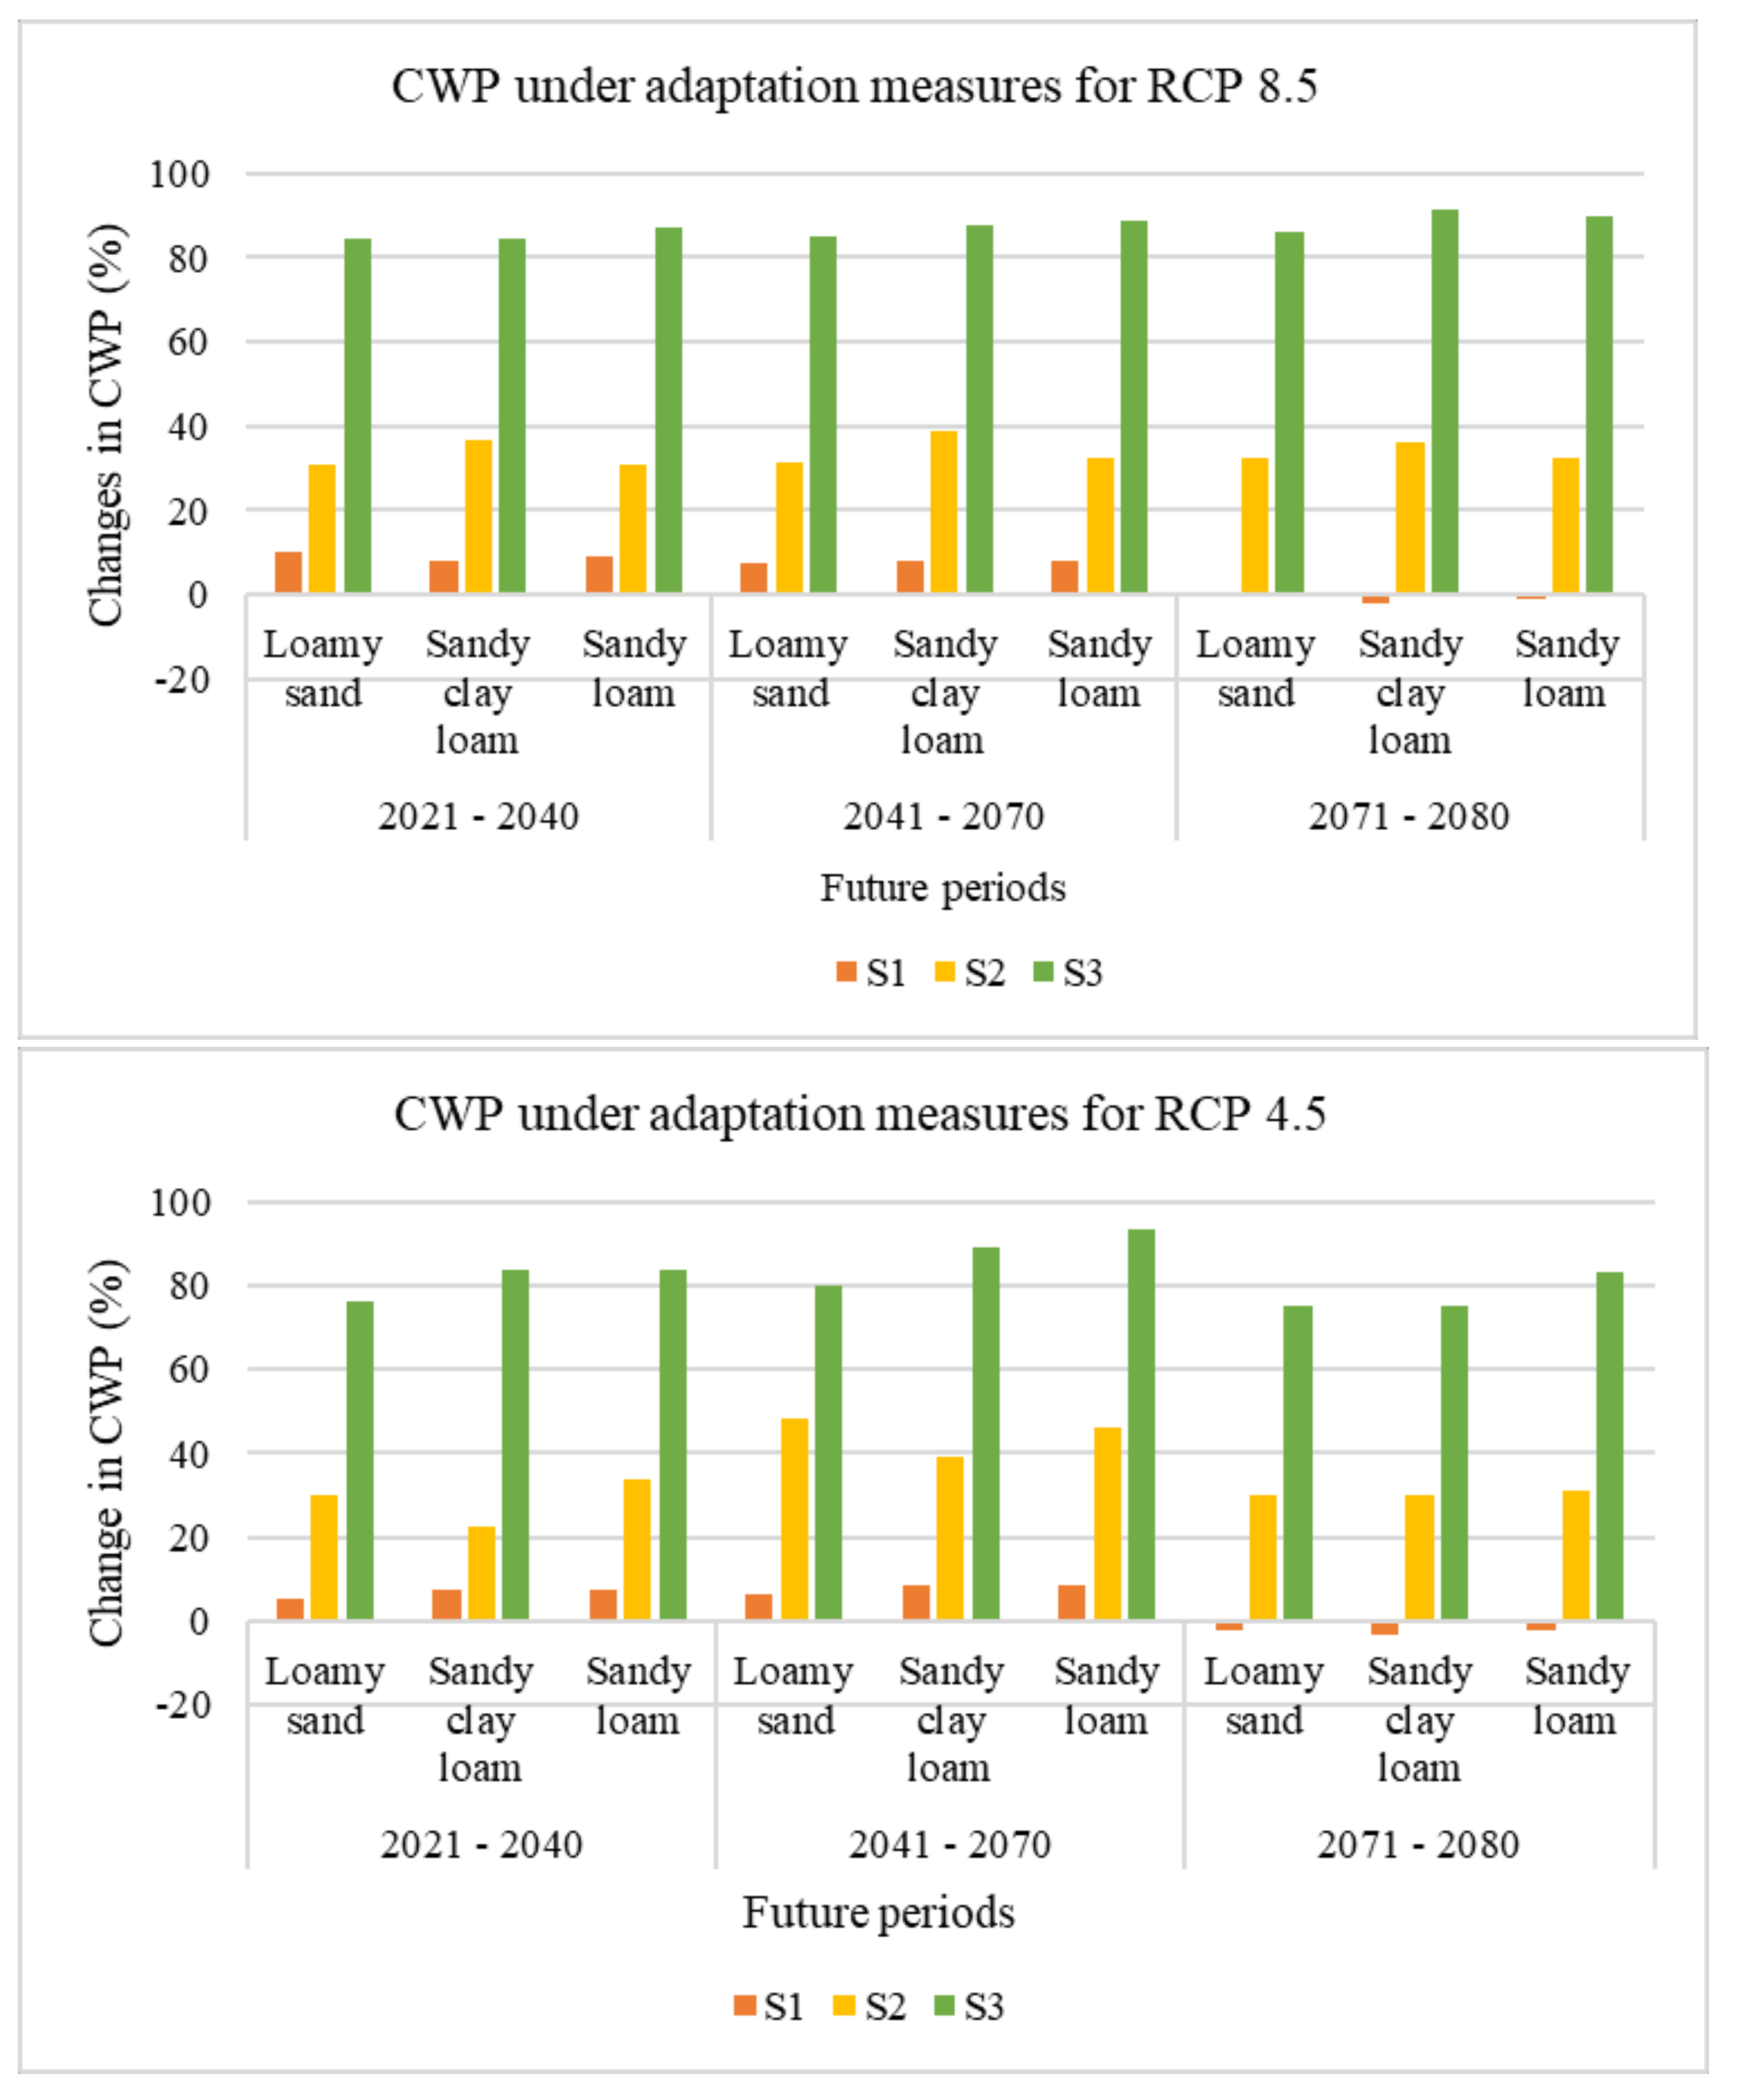
Similarly, the effects of S1, S2 and S3 were examined on CWP to see the most effective strategy. S1 is projected to increase rainfed maize yield by 7.9, 7.8, and 2.5% in the near future, mid-century and late century, respectively, under RCPs 4.5 and 8.5. On the other hand, S2 can greatly increase yield by 30.5, 30.7, and 31.2% in the near future, mid-century and late century, respectively, under RCPs 4.5 and 8.5. Among the three strategies, S3 has the highest impact as it can improve yields by 83.3, 87.2, and 79.5% in the near future, mid-century and late century, respectively, under RCPs 4.5 and 8.5.
4. Discussion
4.1. Comparing Results with Existing Literature
The simulations show that the farms within the basin with sandy loams, sandy clay loams and loamy sand soils have almost the same yields. This is in accordance with the assertion that maize performs best, but not similarly well, on loamy and sandy soils [2,21,36]. The low yield of maize is one of the major setbacks of maize production in Africa [6] when compared with other countries such as China, France and the United States of America where an average yield of 10–11 t/ha is usually obtained [23]. Such low maize yields of about 2 t/ha have been reported in Tanzania [37], which shows that Africa needs to improve maize production and management to achieve higher yields.
The low CWP observed is not unconnected with the low yields observed. Additionally, the simulated CWP is extremely low in comparison with maize CWP in China, where CWP is usually above 2.0 kg/m3 [23]. It depicts that the crop is failing to maximize the water supplied and not converting it to enough crop yields. In addition, it shows that there is a need to encourage climate-smart practices that can adapt to climate change and improve CWP [6] and plant crops with higher yields and lower CWR [46].
The reduction in CWR is attributable increased temperature which subsequently reduces growing days just as simulated for rice in Bangladesh and China [27]. The fact that the reduction occurred across all soil textures shows that increase in temperature and variability in rainfall is projected to reduce CWR.
Furthermore, the decrease in IWR could be attributed to the decline in the growing days of maize as well as the increase in rainfall frequencies and intensities within the growing period. Furthermore, this highlights the fact that rainfall variability and patterns have huge impacts on maize growth and productivity. According to the projections of RCM, there is a likelihood of rainfall shortages within the basin in the near period and then an increase in the mid-century and finally a shortage in the late century when compared to the baseline. The results show that there is a likelihood of delay in the onset of rainfall compared to the baseline coupled with higher transpiration, and this means that maize production will require more irrigation water compared to the baseline for optimum production.
For RCP 8.5, the little or no changes can be attributed to early stomatal closure as a result of a high concentration of CO2 and elevated temperature. The results of this study show that IWR simulations directly depend on rainfall and temperature projections while higher CO2 concentration shortens growing periods and indirectly influences IWR within the basin.
Similar to the results of this paper are the results of [37] in Tanzania which stated that the decline in maize yield will range from 3.1 to 5.3% under RCP 4.5 and RCP 8.5 while the peak decline is projected up to 9.6% in the late century under RCP 8.5 when simulated using an ensemble of climate models, even though increased CO2 concentration was not considered. Likewise, a declining trend in future maize yield was simulated in southern Africa when a process-based model (ASPIM) coupled with 17 GCMs were employed [25]. In addition, [25] argued that there are variations in maize yields based on the global climate model that was used despite a general decline trend. In the United States of America, using SALUS (System Approach to Land Use Sustainability) which is a process-based crop model coupled with an ensemble of GCMs, maize yields have also been projected to decline gradually until the late century [26].
Similarly, in Cameroon, a reduction of up to 14.6% in maize yield is projected in the future periods without any adaptation measures when simulated under GCMs based on the global climate models that were used [24]. According to [22], future yields of maize in West Africa is simulated to decline by up to 5% based on simulations under climate change projections that considered an induced increase in CO2. This further confirms that maize yields in Sub-Saharan Africa will decline under an increased CO2 concentration and elevated temperature under both RCP 4.5 and RCP 8.5 scenarios across all future periods.
However, some studies have reported an increase in maize yields under elevated temperature and increased CO2 concentration. A study in China, [23], that employed AquaCrop reported that maize yield is projected to increase by up to 5.8% when simulated under different climate change scenarios and increased CO2 concentration without using any GCM. The contradictions in the findings of [23] and this study could be attributed to the influence of GCM projections employed in this study just as suggested by [25] that GCM projections are highly influential on the effects of climate change on maize yields.
In terms of planting dates, the simulated planting dates are similar to the usual planting dates of the crops within the basin [21,47]. This further consolidates the fact that planting date is a huge factor that contributes to crop productivity. Delay in the onset of rainfall could be challenging for farmers, thus delay or early planting dates could lead to low yields and productivity. The simulations show a gradual reduction in growing days occasioned by increased temperature and huge variability in growing days as a result of climate variability.
The results of this study are also similar to the results of [23], which projected an increase in maize CWP between 1.4% and 6.3% as a result of the increase in yields in the future years due to increased temperature of 2.8 °C. In addition, the results show that the effect of elevated CO2 concentration is not significant on maize yield and CWP since CO2 fertilization effects on stimulating photosynthesis in C4 crops such as maize are mild [25].
For the future periods, it is also worthy to note that under both climate change scenarios, elevated temperature and increased CO2 concentration is projected to affect CWR significantly and might result in a decrease in maize CWR. Similarly, a reduction in maize CWR under elevated temperature and increased CO2 concentration has been predicted in China using AquaCrop model [23]. Even though the increase in temperature is expected to increase evapotranspiration [48], due to the reduction in growing period occasioned by the early stomatal closure as a result of triggered fertilization through high CO2 concentration and elevated temperature, the seasonal CWR is projected to decrease compared to the baseline [37]. In the late century under the combined effects of highest CO2 concentration (RCP 8.5) and highest temperature, the reduction in maize CWR is projected to be the extreme. In contrast, the CWR of rice has been predicted to increase [27]. These contradictions further stress the fact that the effects of climate change will be spatially and temporally distributed as well as crop dependent. Evidently, the late century under RCP 8.5 is projected to have the extreme conditions on the simulated variables.
The results of future scenarios show that the IWR under RCP 4.5 is projected to follow the same trend of rainfall within the basin. However, under RCP 8.5, due to elevated temperature, a shortage of rainfall is projected not to cause an increase in IWR due to early maturity occasioned by a reduction in the growing period. While maize might require little irrigation water in the mid and late centuries, the quality of maize grains is likely to reduce because with increased CO2, the protein content of maize grains will reduce, and it will increase the weakness of grains to pests and diseases under this condition [22]. However, it is worthy to note that the simulations show that there will be many years that will require supplemental irrigation for optimum production, especially when compared with the baseline.
The results showed that GCMs projections will largely influence the projections of maize yield while higher CO2 concentration has slight effects. In addition, it is obvious that the decline in maize yields is expected in Ogun-Osun river basin as well as in sub-Saharan Africa at large. Currently, African countries are suffering from low maize yields, and lower yields in the future are projected which is tantamount to food insecurity. Consequently, to limit the decline in maize yields, sustainable adaptation measures are inevitable.
The low maize CWP under RCP 4.5 showed that higher crop consumptive water use is not projected to certainly lead to higher maize yield. The results show that under RCP 8.5 as the temperature increases in the future years, maize has the tendency of converting lesser crop consumptive water use into higher yields which are contrary to the results of the RCP 4.5 scenario.
The results further show that under RCP 4.5, the optimum planting dates for maize within the region based on the RCM projection will be around mid to late April while under RCP 8.5, the planting can be still done in early April. Moreover, since RCP 4.5 has been described as a medium stabilization scenario [27], therefore, a shift in planting date of maize from early to mid/late April is projected to be inevitable for optimum production. Likewise, shifting planting dates of maize has been recommended as an adaptation measure for climate change effects on maize production in Cameroon and the United States of America [25,26].
Simulations show a reduction in the growing period of the crop. It is worthy to note that the highest reduction in the growing period of the crop is projected in the late century (2071–2099) under the worst-case scenario of climate change, that is, RCP 8.5. This is a result of higher temperature and CO2 fertilization will trigger early stomatal closure. However, there are still uncertainties about the effects of triggered fertilization and early stomatal closure on the quality of crops and the nutritional composition of crops.
4.2. Sustainable Agriculture and Adaptation Measures
Based on the simulated IWR, in some years little supplemental irrigation was required, while many other growing periods were highly different. This means that during drier years, the crop requires more water. The results show that for rainfed agriculture, the irrigation requirements vary and heavily dependent on rainfall amounts.
In addition, among the adaptation strategies studied, supplemental irrigation has little effect on crop yields and water productivity when compared with the other strategies. The small increase obtained is in accordance with [12], which indicated that climate-smart agricultural practices such as supplemental irrigation on 1% of the current arable land are capable of increasing crop production by 5.99%. In other studies, the crop is shown to perform better under supplemental irrigation [26,49]. Interestingly, this study shows that increasing fertilizer application can greatly increase yields and CWP even under elevated temperature and increased CO2 concentration. With the fertilizer application of nitrogen value of 90 kg/ha, yields could increase up to 30% and with the fertilizer application of nitrogen value of 120 kg/ha, yields could increase up to 80%. This result is similar to the findings of previous studies, [50,51], that increasing fertilizer application is capable of increasing yields under climate change in West Africa. These studies were carried out on a large scale (West Africa), thus this study has shown that increasing fertilizer application is projected to improve yields under climate change.
Globally, there is increasing food demand, thus, if fertilizer application can be increased, it shows potential for increased food production even sufficient for more export and might increase farmers’ profits. However, the big question is what is the economic implication of these fertilizer management levels? Will farmers be able to afford them? Will it be profitable for them? On the other hand, farmers that could afford supplemental irrigation can also practice irrigated agriculture during dry seasons to enjoy double benefits. Thus, they will benefit from the facilities of supplemental irrigation both under rainfed and irrigated productions. Also, most farmers practice multi-cropping so they will benefit from increased yields on crops planted at the same time. Rainwater harvesting is a common water storage system within the basin and in Africa that can be adapted for agricultural production [52]. Further research could investigate the economic implications of these strategies and come up with appropriate recommendations. In addition, the effects of climate-smart agricultural practices such as soil conservation practices can be investigated [53]. Also, the effects of floods on yields needs to be studied as well [54].
On the other hand, most African countries including Nigeria have few meteorological stations compared to their land mass. Although, a lot of improvements have recently been done, especially in providing automated weather stations (AWS), but there are still a lot of gaps. Therefore, there is a need for more funding and monitoring of meteorological stations in Nigeria. This will drastically improve climate data availability and reliability. Also, there should be training and retraining of climate experts in the use of automated weather stations. However, what will happen if all these recommended actions are taken without farmers’ adoption? Farmers play critical roles in achieving sustainable agriculture in Nigeria. Farmers usually find it difficult to adopt new practices. Hence, farmers need to be encouraged by all other actors to embrace recommended and modern practices. It is also expected that farmers will provide timely feedback to other stakeholders for necessary actions. For instance, based on the results of this study, a shift in the planting date of maize could help minimize the impacts of climate change and increasing fertilizer application can greatly increase yields and CWP. Therefore, stakeholders need to be connected and work together to achieve sustainable agriculture within the country.
4.3. Future Actions and Research
Crop production under the threat of climate change is a big challenge that faces many African countries including Nigeria. Therefore, stakeholder should be involved to set action plans and goals for food security. Moreover, women are smallholder famers in Nigeria, they make up approximately half of Nigeria’s agricultural workers and are a central factor in food security should have support from different stakeholders and NGOs.
The government as the major stakeholder has a lot of roles to play in achieving sustainable agriculture and food security. First of all, government across all levels needs to show the “political will” and recognize climate change as an urgent issue that needs to be addressed. The government needs to know that this is not “business as usual”, thus needs to formulate and adopt appropriate policies and frameworks. Increasing budgetary allocation to agricultural and climate research, providing organic fertilizers at affordable prices for farmers as well as enhancing climate early warning systems should be the priorities of government actions. Investments in irrigation (micro and macro) schemes and infrastructures by government need to be implemented. These schemes and infrastructures can be coordinated by the existing River Basin Development Authorities in Nigeria [12].
The universities and research institutes in Nigeria are already saddled with the responsibility of conducting timely research on climate smart agriculture. However, limited funding and resources are major constraints to this responsibility. Hence, there is an urgent need for funding from both the public and the private sectors to catalyze research on adaption measures of climate change in the agricultural sector. Investments in research from both public and private sectors will drastically improve farmers’ access to modern water and soil management technologies [7]. Many studies [7,23,36,45] have recommended the breeding of new crop varieties that are resistant to high temperature. It is therefore necessary for agronomist and crop scientists to take up this responsibility and come up with new crop varieties that can adapt to climate change. Additionally, farmers need to be adequately trained in soil fertility and health implications and in the emerging soil and water management practices. In this case, the provision of incentives such as free fertilizers, seedlings and consultation services will go a long way in encouraging farmers to adopt new technologies.
The outcome of this paper can be the base for future research works such as: optimizing irrigation impacts under different climate change scenarios; health and climatic implications of soil fertility; effects of higher rates of fertilization on groundwater quality; crop rotation for soil fertility and climate change adaptation; and women’s role in climate change adaptation measures. In addition, it is worthy to state that this study was done with limited data such that validation of water fluxes could not be done.
5. Conclusions
The seasonal crop water requirements (CWR), irrigation water requirements (IWR), crop yield and crop water productivity (CWP) of rainfed maize in Ogun-Osun River Basin in Nigeria based on the climate data on 1986–2015 (historical) and 2021–2099 (future) were simulated. This study shows that the average of CWR, IWR, yield and CWP of rainfed maize are 237 mm, 25 mm, 1.98 ton/ha and 0.90 kg/m3, respectively. Trendline analyses show that there are no significant changes in these simulated variables in the baseline period. In this study, HadGEM2-ES (GCM) downscaled by RCA4 (RCM) is capable of simulating the future climate of the region satisfactorily while quantile mapping bias correction method performed satisfactorily by removing the biases in the projected rainfall, thus making it a reliable bias correction method. Based on the climate projections, this basin is projected to be drier and hotter in the future, especially during the growing season of maize.
Also, the future scenarios show that CWR will continually decline by up to −20% while IWR will increase up to 140% in the near future and late century under RCP 4.5. Moreover, maize yield is projected to significantly decline under both scenarios by up to −12%. Thus, it can be concluded that maize will be negatively affected by climate change within this basin. Additionally, this study shows that maize (C4 crop) yield is significantly influenced by changes in rainfall, temperature rise and increased CO2 concentration. To adapt to climate change, supplemental irrigation is projected to have little impact in improving yields but increase in soil fertility can improve yields and CWP up to 80%. Last but not least, climate change should not just be seen as a threat alone, but rather as a wakeup call to stakeholders and policy makers to explore the possible adaptation strategies suitable for each location based on climatic, management and economic situations.
Author Contributions
Methodology, O.S.D. and K.A.M.; analysis, modelling, validation and field visits, O.S.D.; resources, K.A.M. and O.S.D.; data, O.S.D. and K.A.M.; writing (original draft preparation), O.S.D.; writing (review, editing, and submission), K.A.M.; supervision, K.A.M.; open access publication, K.A.M. All authors have read and agreed to the published version of the manuscript.
Funding
This research was funded by the African Union Commission Research Grant provided through the Pan African University Institute of Water and Energy Sciences- PAUWES, Algeria.
Acknowledgments
The authors thank the African Union Commission for funding this research and the support given from the Centre for Sustainable Visions (C4SV) and Lund University. Last but not least, the authors appreciate the four anonymous reviewers that reviewed the manuscript of this paper.
Conflicts of Interest
The authors declare no conflict of interest, the funders had no role in the design of the study; in the collection, analyses, or interpretation of data; in the writing of the manuscript; or in the decision to publish the results.
References
- World Bank. World Bank Group Database 2019. Available online: https://data.worldbank.org/country/nigeria (accessed on 8 November 2019).
- Olomola, A.S.; Nwafor, M. Nigeria Agriculture Sector Performance Review; International Institute of Tropical Agriculture (IITA): Ibadan, Nigeria, 2018. [Google Scholar]
- Otekunrin, O.A.; Otekunrin, O.A.; Momoh, S.; Ayinde, I.A. How far has Africa gone in achieving the zero hunger target? Evidence from Nigeria. Glob. Food Secur. 2019, 22, 1–12. [Google Scholar] [CrossRef]
- FAO. The state of the world’s land and water resources for food and agriculture: Managing systems at risk. In The State of the World’s Land and Water Resources for Food and Agriculture: Managing Systems at Risk; FAO: Rome, Italy, 2016. [Google Scholar] [CrossRef]
- FAO. Water for Sustainable Food and Agriculture. In A Report Produced for the G20 Presidency of Germany; FAO: Rome, Italy, 2017. [Google Scholar]
- Adeboye, O.B.; Schultz, B.; Adekalu, K.O.; Prasad, K.C. Performance evaluation of AquaCrop in simulating soil water storage, yield, and water productivity of rainfed soybeans (Glycine max L. merr) in Ile-Ife, Nigeria. Agric. Water Manag. 2019, 213, 1130–1146. [Google Scholar] [CrossRef]
- Partey, S.T.; Zougmoré, R.B.; Ouédraogo, M.; Campbell, B.M. Developing climate-smart agriculture to face climate variability in West Africa: Challenges and lessons learnt. J. Clean. Prod. 2018, 187, 285–295. [Google Scholar] [CrossRef]
- Raza, A.; Razzaq, A.; Mehmood, S.S.; Zou, X.; Zhang, X.; Lv, Y.; Xu, J. Impact of Climate Change on Crops Adaptation and Strategies to Tackle Its Outcome: A Review. Plants 2019, 8, 34. [Google Scholar] [CrossRef] [PubMed] [Green Version]
- Hula, M.A.; Udoh, J.C. An assessment of the impact of flood events in Makurdi, Nigeria. Civil Environ. Res. 2015, 7, 53–60. [Google Scholar]
- Idowu, A.A.; Ayoola, S.O.; Opele, A.I.; Ikenweiwe, N.B. Impact of Climate Change in Nigeria. Iranica J. Energy Environ. 2011, 2, 145–152. [Google Scholar]
- Idumah, F.O.; Mangodo, C.; Ighodaro, U.B.; Owombo, P.T. Climate Change and Food Production in Nigeria: Implication for Food Security in Nigeria. J. Agric. Sci. 2016, 8, 74. [Google Scholar] [CrossRef] [Green Version]
- Olayide, O.E.; Tetteh, I.K.; Popoola, L. Differential impacts of rainfall and irrigation on agricultural production in Nigeria: Any lessons for climate-smart agriculture? Agric. Water Manag. 2016, 178, 30–36. [Google Scholar] [CrossRef] [Green Version]
- Mourad, K.A.; Gaese, H.; Jabarin, S.A. Economic value of tree fruit production in Jordan Valley from a virtual water perspective. Water Resour. Manag. 2010, 24, 2021–2034. [Google Scholar] [CrossRef]
- Ewaid, S.H.; Abed, S.A.; Al-Ansari, N. Crop water requirements and irrigation schedules for some major crops in southern Iraq. Water 2019, 11, 756. [Google Scholar] [CrossRef] [Green Version]
- Raes, D.; Steduto, P.; Hsiao, T.C.; Fereres, E. AquaCrop-The FAO crop model to simulate yield response to water: II. main algorithms and software description. Agron. J. 2009, 101, 438–447. [Google Scholar] [CrossRef] [Green Version]
- Igbadun, H.E.; Mahoo, H.F.; Tarimo, A.K.P.R.; Salim, B.A. Crop water productivity of an irrigated maize crop in Mkoji sub-catchment of the Great Ruaha River Basin, Tanzania. Agric. Water Manag. 2006, 85, 141–150. [Google Scholar] [CrossRef]
- Mereu, V.; Carboni, G.; Gallo, A.; Cervigni, R.; Spano, D. Impact of climate change on staple food crop production in Nigeria. Clim. Chang. 2015, 132, 321–336. [Google Scholar] [CrossRef]
- Otitoju, M.A.; Enete, A.A. Climate change adaptation: Uncovering constraints to the use of adaptation strategies among food crop farmers in South-west, Nigeria using principal component analysis (PCA). Cogent Food Agric. 2016, 2, 1–11. [Google Scholar] [CrossRef]
- Eregha, P.B.; Babatolu, J.S.; Akinnubi, R.T. Climate Change and Crop Production in Nigeria: An Error Correction Modelling Approach. Int. J. Energy Econ. Policy Econj. 2014, 4, 297–311. [Google Scholar]
- Enete, I. Impacts of Climate Change on Agricultural Production in Enugu State, Nigeria. J. Earth Sci. Clim. Chang. 2004, 5, 9–11. [Google Scholar] [CrossRef] [Green Version]
- Iken, J.E.; Amusa, N.A. Maize research and production in Nigeria. Afr. J. Biotechnol. 2004, 3, 302–307. [Google Scholar] [CrossRef]
- Roudier, P.; Sultan, B.; Quirion, P.; Berg, A. The impact of future climate change on West African crop yields: What does the recent literature say? Glob. Environ. Chang. 2011, 21, 1073–1083. [Google Scholar] [CrossRef] [Green Version]
- Li, J.; Zhu, T.; Mao, X.; Adeloye, A.J. Modeling crop water consumption and water productivity in the middle reaches of Heihe River Basin. Comput. Electron. Agric. 2016, 123, 242–255. [Google Scholar] [CrossRef]
- Tingem, M.; Rivington, M. Adaptation for crop agriculture to climate change in Cameroon: Turning on the heat. Mitig. Adapt. Strat. Glob. Chang. 2009, 14, 153–168. [Google Scholar] [CrossRef]
- Corbeels, M.; Berre, D.; Rusinamhodzi, L.; Lopez-Ridaura, S. Can we use crop modelling for identifying climate change adaptation options? Agric. For. Meteorol. 2018, 256–257, 46–52. [Google Scholar] [CrossRef]
- Basso, B.; Hyndman, D.W.; Kendall, A.D.; Grace, P.R.; Robertson, G.P. Can impacts of climate change and agricultural adaptation strategies be accurately quantified if crop models are annually re-initialized? PLoS ONE 2015, 10, e0127333. [Google Scholar] [CrossRef] [Green Version]
- Ding, Y.; Wang, W.; Song, R.; Shao, Q.; Jiao, X.; Xing, W. Modeling spatial and temporal variability of the impact of climate change on rice irrigation water requirements in the middle and lower reaches of the Yangtze River, China. Agric. Water Manag. 2017, 193, 89–101. [Google Scholar] [CrossRef]
- Wang, J.; Liu, X.; Cheng, K.; Zhang, X.; Li, L.; Pan, G. Winter wheat water requirement and utilization efficiency under simulated climate change conditions: A Penman-Monteith model evaluation. Agric. Water Manag. 2018, 197, 100–109. [Google Scholar] [CrossRef]
- Ammar, M.E.; Davies, E.G.R. On the accuracy of crop production and water requirement calculations: Process-based crop modeling at daily, semi-weekly, and weekly time steps for integrated assessments. J. Environ. Manag. 2019, 238, 460–472. [Google Scholar] [CrossRef] [PubMed]
- Ayugi, B.; Tan, G.; Gnitou, G.T.; Ojara, M.; Ongoma, V. Historical evaluations and simulations of precipitation over East Africa from Rossby centre regional climate model. Atmos. Res. 2020, 232, 104705. [Google Scholar] [CrossRef]
- Nikulin, G.; Lennard, C.; Dosio, A.; Kjellström, E.; Chen, Y.; Hansler, A.; Somot, S. The effects of 1.5 and 2 degrees of global warming on Africa in the CORDEX ensemble. Environ. Res. Lett. 2018, 13, 065003. [Google Scholar] [CrossRef]
- Akinsanola, A.A.; Ajayi, V.O.; Adejare, A.T.; Adeyeri, O.E.; Gbode, I.E.; Ogunjobi, K.O.; Abolude, A.T. Evaluation of rainfall simulations over West Africa in dynamically downscaled CMIP5 global circulation models. Theor. Appl. Climatol. 2018, 132, 437–450. [Google Scholar] [CrossRef]
- Vanuytrecht, E.; Raes, D.; Steduto, P.; Hsiao, T.C.; Fereres, E.; Heng, L.K.; Mejias Moreno, P. AquaCrop: FAO’s crop water productivity and yield response model. Environ. Model. Softw. 2014, 62, 351–360. [Google Scholar] [CrossRef]
- Akumaga, U.; Tarhule, A.; Yusuf, A.A. Validation and testing of the FAO AquaCrop model under different levels of nitrogen fertilizer on rainfed maize in Nigeria, West Africa. Agric. For. Meteorol. 2017, 232, 225–234. [Google Scholar] [CrossRef]
- Soriano, E.; Mediero, L.; Garijo, C. Selection of Bias Correction Methods to Assess the Impact of Climate Change on Flood Frequency Curves. Water 2019, 11, 2266. [Google Scholar] [CrossRef] [Green Version]
- Greaves, G.E.; Wang, Y. Assessment of FAO AquaCrop Model for Simulating Maize Growth and Productivity under Deficit Irrigation in a Tropical Environment. Water 2016, 8, 557. [Google Scholar] [CrossRef]
- Luhunga, P.M. Assessment of the Impacts of Climate Change on Maize Production in the Southern and Western Highlands Sub-agro Ecological Zones of Tanzania. Front. Environ. Sci. 2017, 5, 51. [Google Scholar] [CrossRef] [Green Version]
- Wheaton, A.T.; Parsons, L.R. Simulating Annual Irrigation Requirement for Citrus on Excessively Drained Soils. HortScience 2006, 41, 1487–1492. [Google Scholar] [CrossRef] [Green Version]
- Lacey, K. Calculating Readily Available Water. Department of Primary Industries and Regional Development’s Agriculture and Food. Available online: https://www.agric.wa.gov.au/citrus/calculating-readily-available-water (accessed on 21 October 2020).
- Yue, S.; Pilon, P.; Phinney, B.; Cavadias, G. The influence of autocorrelation on the ability to detect trend in hydrological series. Hydrol. Process. 2002, 16, 1807–1829. [Google Scholar] [CrossRef]
- Yue, S.; Wang, C. Applicability of pre-whitening to eliminate the influence of serial correlation on the Mann-Kendall test. Water Resour. Res. 2002, 38, 1–4. [Google Scholar] [CrossRef]
- Mann, H.B. Nonparametric tests against trend. Econometrica 1945, 13, 245–259. [Google Scholar] [CrossRef]
- Kendall, M.G. Rank Correlation Methods; Griffi: London, UK, 1975. [Google Scholar]
- Gocic, M.; Trajkovic, S. Analysis of changes in meteorological variables using Mann-Kendall and Sen’s slope estimator statistical tests in Serbia. Glob. Planet. Chang. 2013, 100, 172–182. [Google Scholar] [CrossRef]
- Zhang, Q.; Li, J.; Chen, Y.; Chen, X. Observed changes of temperature extremes during 1960–2005 in China: Natural or human induced variations? Theor. Appl. Climatol. 2011, 106, 417–431. [Google Scholar] [CrossRef]
- Mourad, K.A.; Berndtsson, R. Grapes as an alternative crop for water saving. In Grapes: Cultivation, Varieties and Nutritional Uses; Murphy, R.P., Steifler, C.K., Eds.; Nova Science Publishers Inc.: Hauppauge, NY, USA, 2012; pp. 183–192. [Google Scholar]
- Dugje, I.Y.; Omoigui, L.O.; Ekeleme, F.; Bandyopadhyay, R.; Lava Kumar, P.; Kamara, A.Y. Farmers’ Guide to Soybean Production in Northern Nigeria; International Institute of Tropical Agriculture: Ibadan, Nigeria, 2009. [Google Scholar]
- Boonwichai, S.; Shrestha, S.; Babel, M.S.; Weesakul, S.; Datta, A. Climate change impacts on irrigation water requirement, crop water productivity and rice yield in the Songkhram River Basin, Thailand. J. Clean. Prod. 2018, 198, 1157–1164. [Google Scholar] [CrossRef]
- Liben, F.M.; Wortmann, C.S.; Yang, H.; Lindquist, J.L.; Tadesse, T.; Wegary, D. Crop model and weather data generation evaluation for conservation agriculture in Ethiopia. Field Crops Res. 2018, 228, 122–134. [Google Scholar] [CrossRef]
- Sultan, B.; Gaetani, M. Agriculture in West Africa in the Twenty-First Century: Climate Change and Impacts Scenarios, and Potential for Adaptation. Front. Plant Sci. 2016, 7, 1262. [Google Scholar] [CrossRef] [PubMed] [Green Version]
- Akumaga, U.; Tarhule, A.; Piani, C.; Traore, B.; Yusuf, A. Utilizing Process-Based Modelling to Assess the Impact of Climate Change on Crop Yields and Adaptation Options in the Niger River Basin, West Africa. Agronomy 2018, 8, 11. [Google Scholar] [CrossRef] [Green Version]
- Durodola, O.S.; Bwambale, J.; Nabunya, V. Using every drop: Rainwater harvesting for food security in Mbale, Uganda. Water Pract. Technol. 2020, 15, 295–310. [Google Scholar] [CrossRef]
- Adeboye, O.B.; Schultz, B.; Adekalu, K.O.; Prasad, K. Soil water storage, yield, water productivity and transpiration efficiency of soybeans (Glyxine max L. Merr) as affected by soil surface management in Ile-Ife, Nigeria. Int. Soil Water Conserv. Res. 2017, 5, 141–150. [Google Scholar] [CrossRef]
- Durodola, O.S. The Impact of Climate Change Induced Extreme Events on Agriculture and Food Security: A Review on Nigeria. Agric. Sci. 2019, 10, 487–498. [Google Scholar] [CrossRef] [Green Version]
Figure 1.
The geographic location of the study area, its major rivers and soil texture.

Figure 2.
The cumulative distribution functions (CDFs) of projected historical daily rainfall before and after bias correction.
Figure 2.
The cumulative distribution functions (CDFs) of projected historical daily rainfall before and after bias correction.

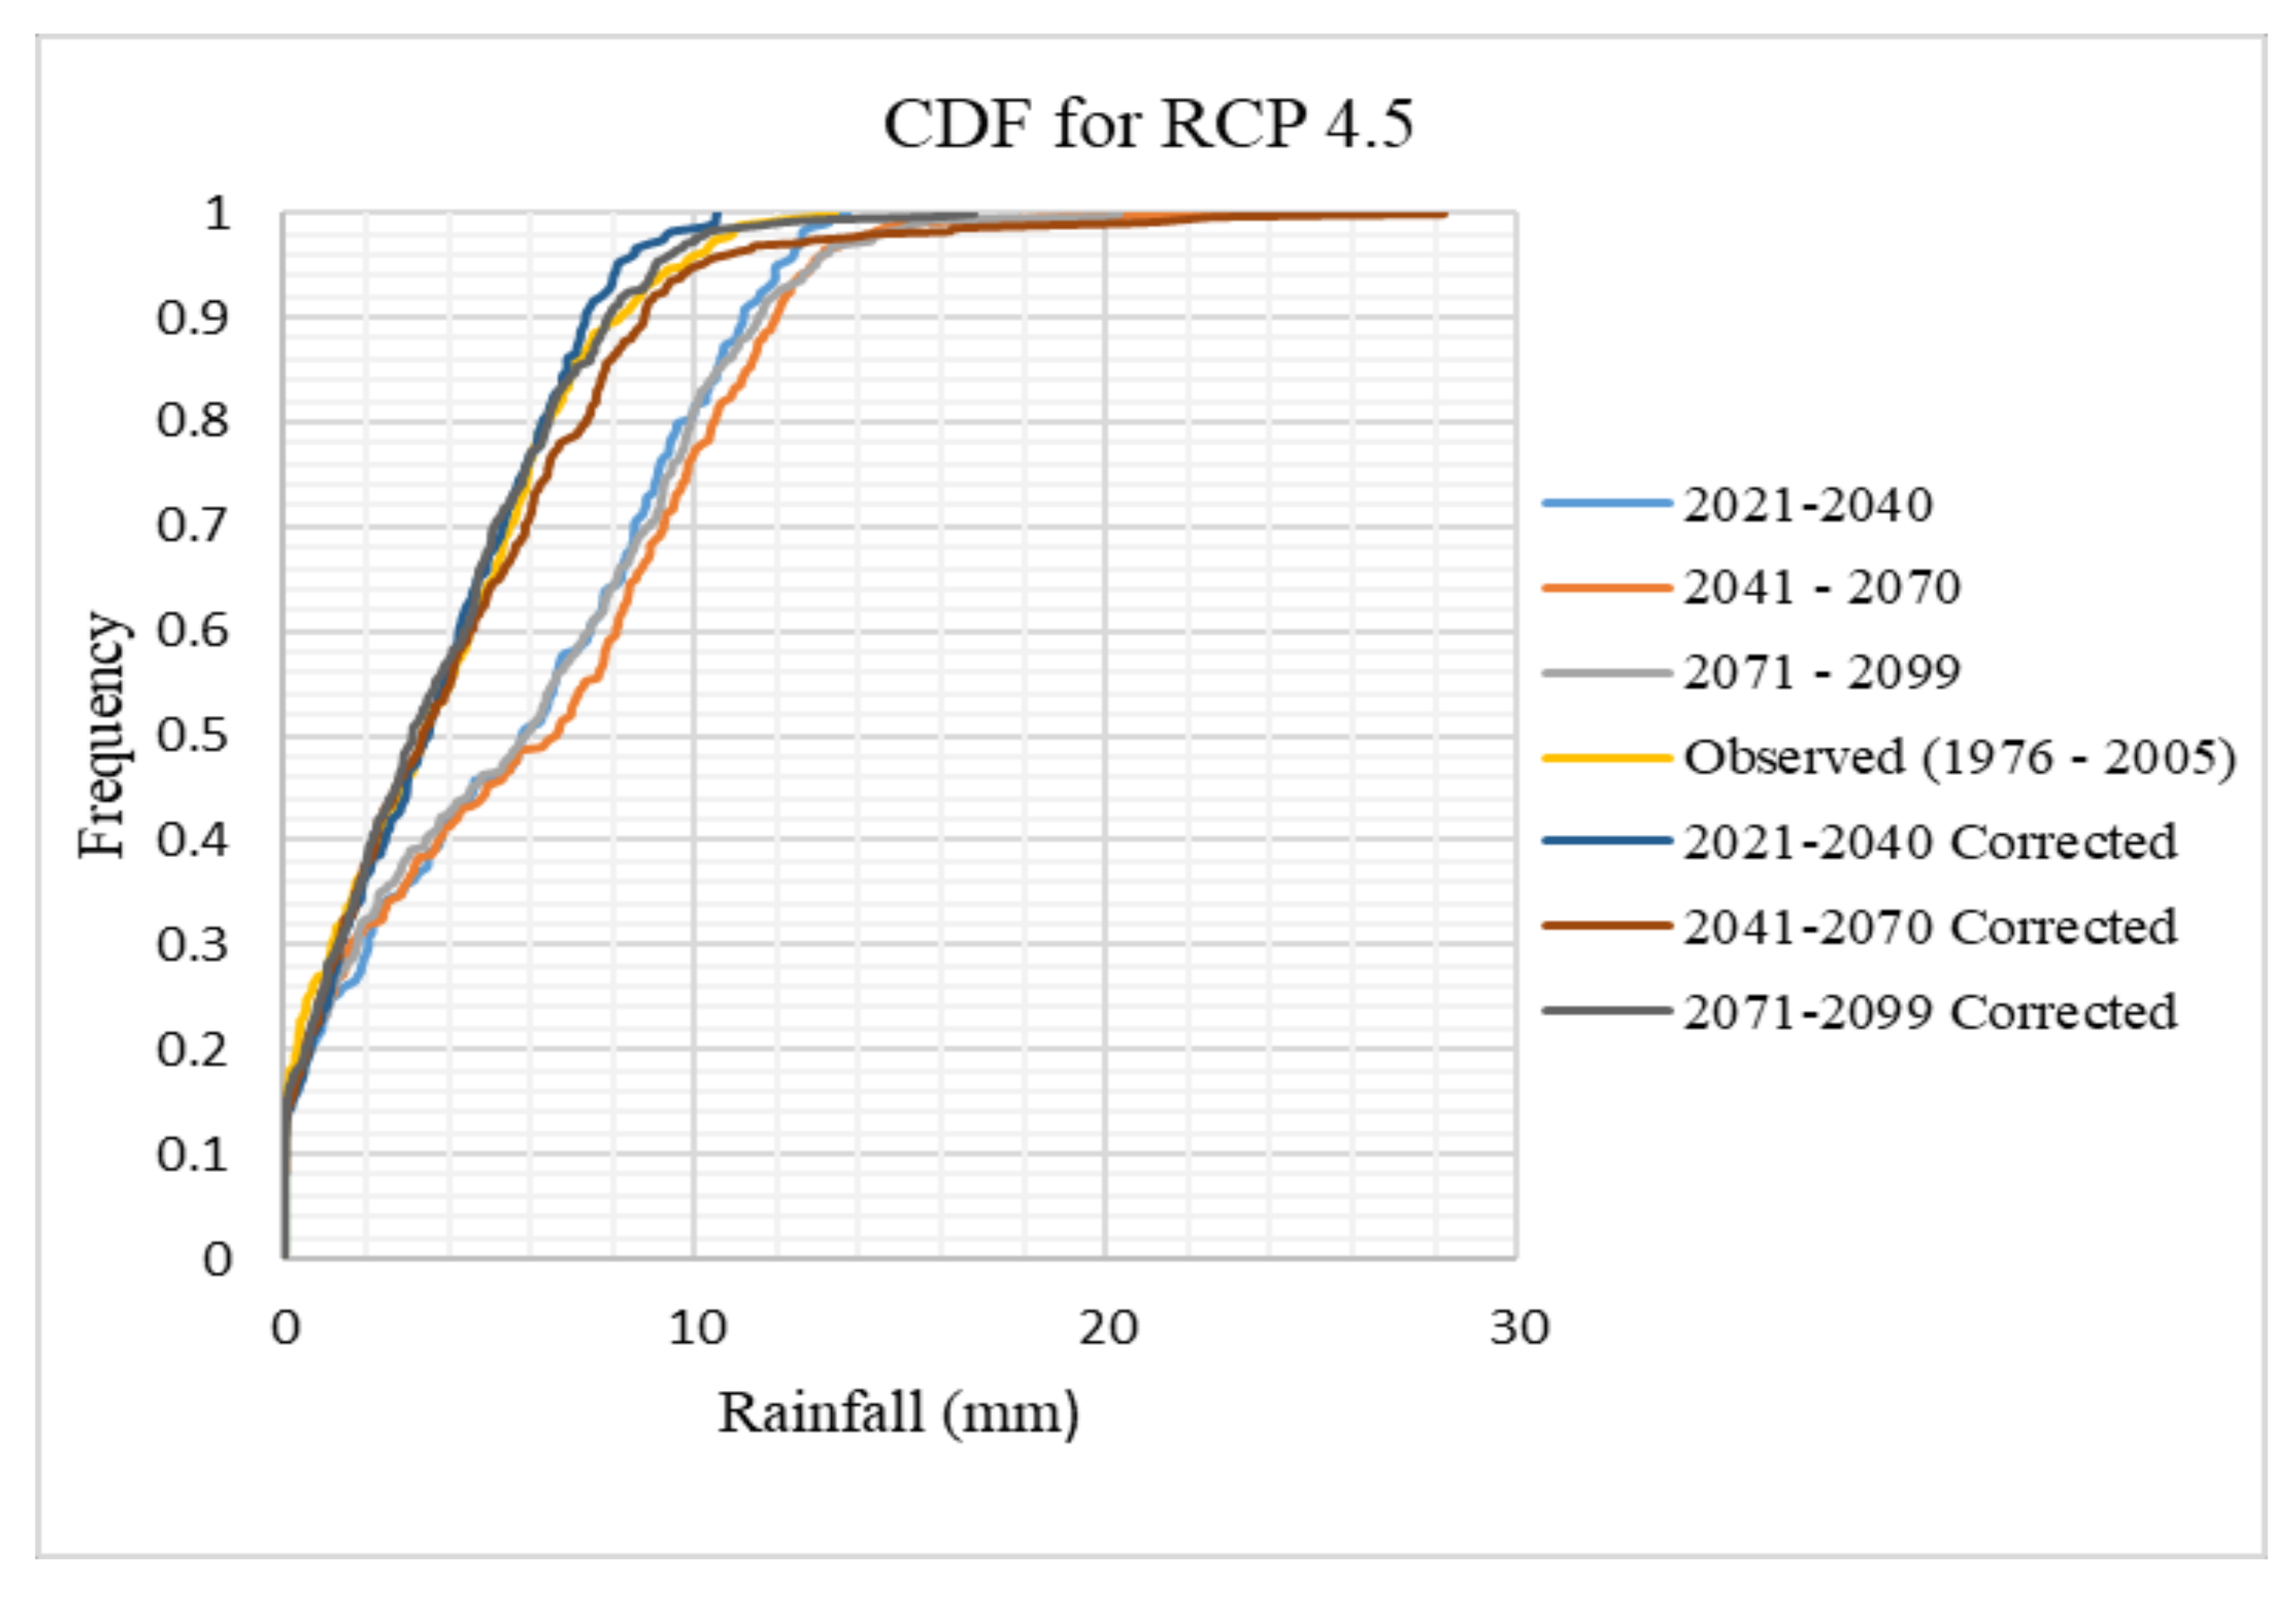
Figure 3.
The CDFs of projected daily rainfall under Representative Concentration Pathway (RCP) 4.5 before and after bias correction.
Figure 3.
The CDFs of projected daily rainfall under Representative Concentration Pathway (RCP) 4.5 before and after bias correction.

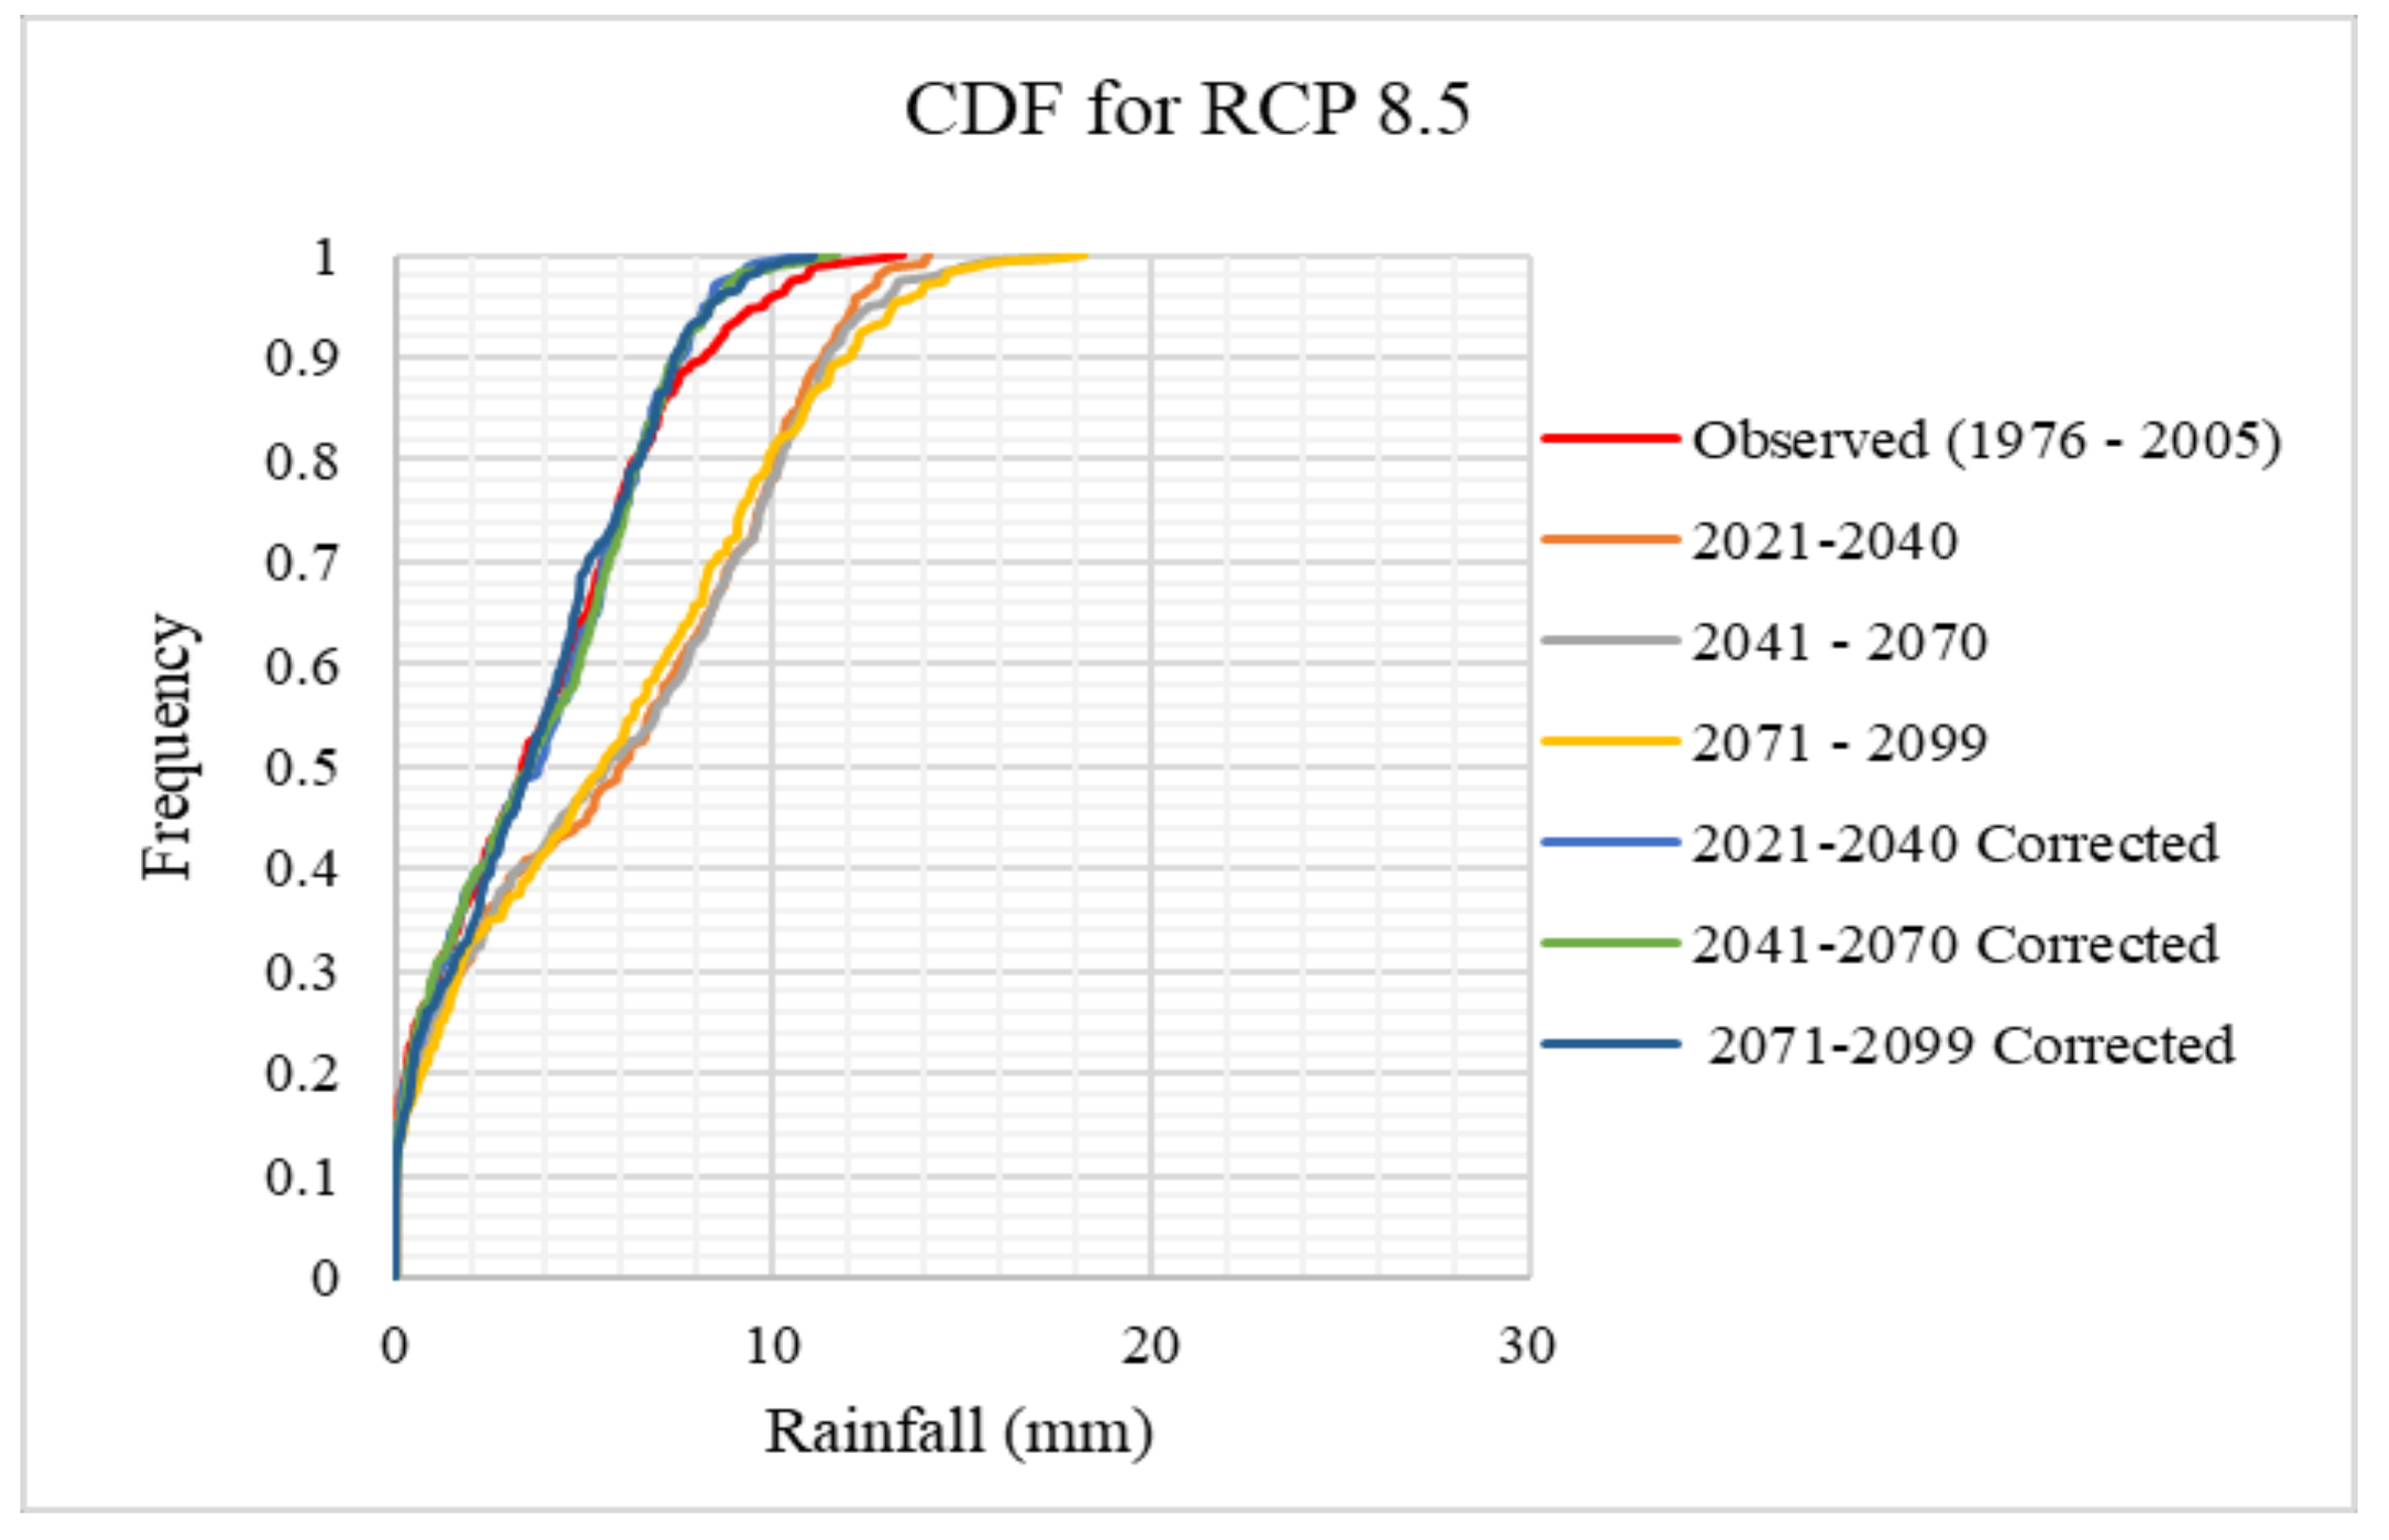
Figure 4.
The CDFs of projected daily rainfall under RCP 8.5 before and after bias correction.

Figure 5.
Temporal course of crop water requirement.

Figure 6.
Temporal course of irrigation water requirement (IWR)

Figure 7.
The change in maize yield.

Figure 8.
Temporal courses of crop water productivity (CWP).

Figure 9.
Temporal changes in future crop water requirement (CWR) under RCPs 4.5 and 8.5 (2021–2099) relative to the baseline (1986–2015).
Figure 9.
Temporal changes in future crop water requirement (CWR) under RCPs 4.5 and 8.5 (2021–2099) relative to the baseline (1986–2015).

Figure 10.
Temporal changes in future IWR under RCPs 4.5 and 8.5 (2021–2099) relative to the baseline (1986–2015).
Figure 10.
Temporal changes in future IWR under RCPs 4.5 and 8.5 (2021–2099) relative to the baseline (1986–2015).

Figure 11.
Temporal changes in future maize yields under RCPs 4.5 and 8.5 (2021–2099) relative to the baseline (1986–2015).
Figure 11.
Temporal changes in future maize yields under RCPs 4.5 and 8.5 (2021–2099) relative to the baseline (1986–2015).

Figure 12.
Temporal changes in future maize CWP under RCPs 4.5 and 8.5 (2021–2099) relative to the baseline (1986–2015).
Figure 12.
Temporal changes in future maize CWP under RCPs 4.5 and 8.5 (2021–2099) relative to the baseline (1986–2015).

Figure 13.
Effects of supplemental irrigation (S1), soil fertility at nitrogen value of 90 kg/ha (S2) and soil fertility at nitrogen value of 120 kg/ha (S3) on rainfed yields under RCP 4.5 and RCP 8.5.
Figure 13.
Effects of supplemental irrigation (S1), soil fertility at nitrogen value of 90 kg/ha (S2) and soil fertility at nitrogen value of 120 kg/ha (S3) on rainfed yields under RCP 4.5 and RCP 8.5.

Figure 14.
Effects of supplemental irrigation (S1), soil fertility at nitrogen rate of 90 kg/ha (S2) and soil fertility at nitrogen rate of 120 kg/ha (S3) on rainfed CWP under RCP 4.5 and RCP 8.5.
Figure 14.
Effects of supplemental irrigation (S1), soil fertility at nitrogen rate of 90 kg/ha (S2) and soil fertility at nitrogen rate of 120 kg/ha (S3) on rainfed CWP under RCP 4.5 and RCP 8.5.


Table 1.
List of Global Climate Models (GCMs) and Regional Climate Model (RCMs) employed.
| Model Institute | GCM Name | RCM | RCM Resolution |
|---|---|---|---|
| Canadian Centre of Climate Modelling and Analysis, Canada | CCCma-CanESM2 | RCA4 | 0.44° × 0.44° |
| Swedish Meteorological and Hydrological Institute, Sweden | ICHEC-EC-EARTH | RCA4 | 0.44° × 0.44° |
| Met Office Hadley Centre, UK | MOHC-HadGEM2-ES | RCA4 | 0.44° × 0.44° |
Table 2.
Statistical evaluation of climate models on historical data (1976–2005).
| Statistical Parameters | Rainfall | Minimum Temperature | ||||||
|---|---|---|---|---|---|---|---|---|
| R2 | RMSE (mm) | MAE (mm) | NSE | R2 | RMSE (°C) | MAE (°C) | NSE | |
| CanESM2 | 0.32 | 3.61 | 2.60 | −0.46 | 0.82 | 1.62 | 1.24 | 0.30 |
| EC-EARTH | 0.44 | 3.87 | 2.77 | −0.49 | 0.72 | 1.74 | 1.35 | 0.44 |
| HadGEM2-ES | 0.54 | 3.27 | 2.25 | −0.11 | 0.84 | 0.92 | 0.72 | 0.74 |
| Statistical Parameters | Maximum Temperature | |||||||
| R2 | RMSE (°C) | MAE (°C) | NSE | |||||
| CanESM2 | 0.84 | 1.82 | 1.43 | 0.31 | ||||
| EC-EARTH | 0.71 | 1.93 | 1.62 | 0.41 | ||||
| HadGEM2-ES | 0.85 | 0.89 | 0.68 | 0.75 | ||||
Table 3.
Statistical evaluation of bias corrected rainfall data (1976–2005).
| Statistical Parameters | Rainfall | |||
|---|---|---|---|---|
| R2 | RMSE (mm) | MAE (mm) | NSE | |
| HadGEM2-ES | 0.75 | 0.52 | 0.43 | 0.76 |
Table 4.
Calibrated soil properties and descriptions in models.
| Soil Textures (0–100 cm) | PWP | FC | SAT | TAW | Ksat |
|---|---|---|---|---|---|
| (vol.%) | (vol.%) | (vol.%) | (mm/m) | (mm/day) | |
| Loamy sand | 8.0 | 14.0 | 46.0 | 60.0 | 1560.0 |
| Sandy clay loam | 17.7 | 27.5 | 43.0 | 98.0 | 214.0 |
| Sandy loam | 11.5 | 19.0 | 43.3 | 75.0 | 804.4 |
Table 5.
Model evaluation of simulated maize yield in various soil textures for four growing seasons.
Table 5.
Model evaluation of simulated maize yield in various soil textures for four growing seasons.
| Year | Soil Texture | Observation (t/ha) | Simulation (t/ha) | R2 | RMSE (t/ha) | MAE (t/ha) | NSE |
|---|---|---|---|---|---|---|---|
| 2015 | Loamy sand | 2.08 | 2.09 | 0.90 | |||
| Sandy clay loam | 2.12 | 2.14 | 0.99 | 0.014 | 0.013 | ||
| Sandy loam | 2.09 | 2.10 | |||||
| 2014 | Loamy sand | 2.07 | 2.07 | ||||
| Sandy clay loam | 2.11 | 2.12 | 0.96 | 0.008 | 0.007 | ||
| Sandy loam | 2.07 | 2.08 | |||||
| 2013 | Loamy sand | 2.11 | 2.13 | ||||
| Sandy clay loam | 2.21 | 2.23 | 0.95 | 0.016 | 0.013 | ||
| Sandy loam | 2.17 | 2.17 | |||||
| 2012 | Loamy sand | 2.13 | 2.15 | ||||
| Sandy clay loam | 2.18 | 2.2 | 0.95 | 0.017 | 0.017 | ||
| Sandy loam | 2.15 | 2.16 |
Table 6.
Changes in rainfall, minimum and maximum temeperature for future periods relative to mean of 1986–2015 under RCP 4.5 and RCP 8.5 scenarios.
Table 6.
Changes in rainfall, minimum and maximum temeperature for future periods relative to mean of 1986–2015 under RCP 4.5 and RCP 8.5 scenarios.
| Climatic Parameters | Baseline (1986–2015) | Relative Changes | |||||
|---|---|---|---|---|---|---|---|
| RCP 4. 5 | RCP 8. 5 | ||||||
| 2021–2040 | 2041–2070 | 2071–2099 | 2020–2040 | 2041–2070 | 2071–2099 | ||
| Rainfall (mm) | 1200 | −120 (−10.0%) | 40 (3.3%) | −110 (−9.2%) | −120 (−10.0%) | −110 (−9.2%) | −120 (−10.0%) |
| Min. T (℃) | 22.1 | 0.9 (4.1%) | 1.5 (6.8%) | 2.4 (10.9%) | 1.3 (5.9%) | 2.4 (10.9%) | 4.2 (19.0%) |
| Max. T (℃) | 31.4 | 1.2 (3.8%) | 1.9 (6.1%) | 2.6 (8.3%) | 1.5 (4.8%) | 2.7 (8.6%) | 4.4 (14.0%) |
Table 7.
Results of significance tests for the future simulations.
| Simulated Variables | Soil Texture | RCP 4.5 | RCP 8.5 | ||
|---|---|---|---|---|---|
| Mann−Kendall Test | Sen’s Slope | Mann−Kendall Test | Sen’s Slope | ||
| CWR | Loamy sand | −2.102 * | −0.113 * | −8.847 ** | −0.465 ** |
| Sandy clay loam | −1.916 + | −0.105 + | −9.085 ** | −0.485 ** | |
| Sandy loam | −1.886 + | −0.107 + | −8.623 ** | −0.483 ** | |
| IWR | Loamy sand | 0.803 | 0.063 | −1.423 * | −0.132 * |
| Sandy clay loam | 0.923 | 0.091 | −1.979 * | −0.121 * | |
| Sandy loam | 0.695 | 0.067 | −1.779 + | −0.032 + | |
| Yield | Loamy sand | −7.011 ** | −0.0018 ** | −7.503 ** | −0.0016 ** |
| Sandy clay loam | −6.948 ** | −0.0015 ** | −7.558 ** | −0.0016 ** | |
| Sandy loam | −7.168 ** | −0.0016 ** | −7.875 ** | −0.0014 ** | |
| CWP | Loamy sand | −1.269 | −0.00032 | 5.573 ** | 0.00143 ** |
| Sandy clay loam | −1.418 | −0.00037 | 6.008 ** | 0.00138 ** | |
| Sandy loam | −1.304 | −0.00032 | 5.731 ** | 0.00143 ** | |
Note: + Sign indicates significance at 0.10 level of significance. * Sign indicates significance at 0.05 level of significance. ** Sign indicates significance at 0.01 level of significance (significant values are in bold).
Publisher’s Note: MDPI stays neutral with regard to jurisdictional claims in published maps and institutional affiliations. |
© 2020 by the authors. Licensee MDPI, Basel, Switzerland. This article is an open access article distributed under the terms and conditions of the Creative Commons Attribution (CC BY) license (http://creativecommons.org/licenses/by/4.0/).
Share and Cite
MDPI and ACS Style
Durodola, O.S.; Mourad, K.A. Modelling Maize Yield and Water Requirements under Different Climate Change Scenarios. Climate 2020, 8, 127. https://0-doi-org.brum.beds.ac.uk/10.3390/cli8110127
AMA Style
Durodola OS, Mourad KA. Modelling Maize Yield and Water Requirements under Different Climate Change Scenarios. Climate. 2020; 8(11):127. https://0-doi-org.brum.beds.ac.uk/10.3390/cli8110127
Chicago/Turabian StyleDurodola, Oludare Sunday, and Khaldoon A. Mourad. 2020. "Modelling Maize Yield and Water Requirements under Different Climate Change Scenarios" Climate 8, no. 11: 127. https://0-doi-org.brum.beds.ac.uk/10.3390/cli8110127
Note that from the first issue of 2016, this journal uses article numbers instead of page numbers. See further details here.