Article

Community-Level Impacts of Climate-Smart Agriculture Interventions on Food Security and Dietary Diversity in Climate-Smart Villages in Myanmar

1
Masters Program in Climate Change, Agriculture & Food Security (MScCCAFS), Ryan Institute and College of Science & Engineering, National University of Ireland Galway, University Road, H91 REW4 Galway, Ireland
2
Plant & AgriBiosciences Research Centre (PABC), Ryan Institute, National University of Ireland Galway, University Road, H91 REW4 Galway, Ireland
3
International Institute of Rural Reconstruction-Myanmar, Yangon 11052, Myanmar
4
International Institute of Rural Reconstruction Regional Center for Asia, Silang 4118, Philippines
*
Author to whom correspondence should be addressed.
Submission received: 25 September 2021 / Revised: 2 November 2021 / Accepted: 16 November 2021 / Published: 21 November 2021
(This article belongs to the Special Issue Climate Change and Food Insecurity)

Abstract

:
Diversification of production to strengthen resilience is a key tenet of climate-smart agriculture (CSA), which can help to address the complex vulnerabilities of agriculture-dependent rural communities. In this study, we investigated the relationship between the promotion of different CSA practices across four climate-smart villages (CSVs) in Myanmar. To determine the impact of the CSA practices on livelihoods and health, survey data were collected from agricultural households (n = 527) over three years. Within the time period studied, the results indicate that some the CSA practices and technologies adopted were significantly associated with changes in household dietary diversity scores (HDDS), but, in the short-term, these were not associated with improvements in the households’ food insecurity scores (HFIAS). Based on the survey responses, we examined how pathways of CSA practice adoption tailored to different contexts of Myanmar’s four agroecologies could contribute to the observed changes, including possible resulting trade-offs. We highlight that understanding the impacts of CSA adoption on household food security in CSVs will require longer-term monitoring, as most CSA options are medium- to long-cycle interventions. Our further analysis of knowledge, attitudes and practices (KAPs) amongst the households indicated a poor understanding of the household knowledge, attitudes and practices in relation to nutrition, food choices, food preparation, sanitation and hygiene. Our KAP findings indicate that current nutrition education interventions in the Myanmar CSVs are inadequate and will need further improvement for health and nutrition outcomes from the portfolio of CSA interventions.

1. Introduction

Climate change is now recognized as a major threat to food security and adequate nutrition in the twenty-first century [1,2,3]. Extreme weather events that threaten food security, such as droughts, heat waves, floods, wildfires and storms, will also become more frequent and severe [4] Adverse climate change is already having direct effects on agricultural production, impacting food supply and food security [5]. The quantity and nutritional quality of products generated by agricultural systems is influenced by a range of factors, including, inter alia, soil quality, nutrient availability, temperature, water availability, CO2 concentrations and the prevalence of pollinators [2,6,7]), many of which are undergoing changes due to climate change.
Changes in temperature and water availability are factors influenced by changing climates, particularly in vulnerable regions. The yields of most crop species are sensitive to alterations in temperature [8,9]. Indeed, when air temperatures exceed 30 °C, even for short periods, reductions in yields are expected in rainfed crops, regardless of the crop species [10,11]. Higher temperatures are also coupled with decreases in water availability due to increased evaporation and evapotranspiration, leading to crop yield reductions [9,12].
From a broader perspective, climate change can have a negative impact on the four pillars of food security, namely availability, access, utilization and stability (FAO et al. 2018). Food security is related to nutrition, and, consequently, malnutrition is an indicator of food insecurity. Dietary diversity is typically measured by the number of food groups eaten in the diet over a given time period. Overall, dietary diversity is often (although not always) a good indicator of micronutrient intake and associated malnutrition [13,14].
Dietary diversity outcomes are rarely considered when relating agricultural outputs to food security [15]. However, more ill health and mortality can be attributed to poor diet than to any other risk factor [16]. There are direct links between climate change, reduced access to food and diverse diets and increases in childhood stunting, wasting and low birth weights [14] as well as through direct temperature impacts on fetal health [17,18]. Stunting (height-for-age z-score < −2) occurs in children 5 years of age and below and can lead to shorter adult height, limited cognitive function and reduced adult income [19]. Childhood wasting (weight-for-height z-score < −2) is estimated to affect 10% of children globally and is associated with reduced lean mass and weaker immune systems, leaving children more susceptible to infections, which can result in death [20]. Low birth weights (<2500 g) are also associated with mothers and households who are food-insecure.
Food insecurity and micronutrient deficiencies associated with poor dietary diversity are major issues across Myanmar. Such challenges are attributed to diverse factors, such as conflict, poverty and vulnerability to natural disasters, which are becoming more frequent due to climate change [21]. According to the Myanmar Micronutrient and Food Consumption Survey 2017–2018, significant progress is needed to achieve the goals set by the World Health Organization for reducing wasting and stunting by 2025 [22]. The MMFC survey highlighted that nearly one in three children (26.7%) under the age of five are stunted in Myanmar, while 6.7% of children under the age of five are wasted and 19.1% of children in the same age bracket are underweight. Only 16% of babies aged 6–23 months receive the minimum acceptable diet for development at their age, while nearly 20% of adult men and 15% of adult women are underweight [23].
Over 23% of total anthropogenic greenhouse gas emissions are derived from agriculture, forestry and other land uses (AFOLU sector) [24,25,26]. Excluding land use change, agriculture contributes to approximately 11% of total anthropogenic GHG emissions, and requires up to 70% of our global fresh water supply [27]. Climate-smart agriculture (CSA) is a term used to describe a portfolio of practices that can reduce emissions and strengthen the adaptation of agricultural systems to climate change, while improving food security and livelihood outcomes [28]. The CSA approach anchors itself on three pillars that aim to jointly address food security and climate challenges, leading to systems that sustainably increase productivity and incomes while building resilience to climate variability, and seeking mitigation of GHG where possible [29,30].
Climate variability is experienced across most regions of Myanmar, with some regions receiving excessive rainfall, while other regions have insufficient rainfall, leading to drought periods during cropping cycles [31]. Access to safe and reliable water supplies, whether for irrigation, livestock or domestic use, is a key constraint to livelihoods and food production, with significant knock-on consequences for income [32]. Myanmar is also at increasing risk from a wide range of natural climate-influenced hazards, including cyclones, floods and droughts, that can have severe negative impacts on the livelihoods of the poor, contributing to seasonal food shortages. CSA programs in Myanmar to strengthen livelihood resilience will increasingly include diversification, including the increasing adoption of trees, livestock and off-farm incomes as risk aversion strategies for the rural poor.
Hence, the development, application and impact monitoring of climate-smart agriculture (CSA) strategies and programs is central to ensuring food system productivity to deliver key outcomes, including achieving food security, reducing malnutrition, reducing inequities and empowering the most vulnerable, while delivering resilience to climate change [33]. The impacts of climate change differ significantly across rural communities and agroecosystems. Hence, understanding, strategies and actions will need to take into account location-specific and community-based considerations [33,34].
The CGIAR Research Program on Climate Change, Agriculture and Food Security (CCAFS) developed and piloted the climate-smart village (CSV) approach in 2012 in Africa and South Asia, and later expanded CSV pilots to Latin America and Southeast Asia in 2014 [35]. The CSV approach was developed and promoted to address research gaps in climate-smart agriculture at the level of rural communities. This need arose as much of the knowledge on climate-smart agriculture technologies and practices has been initially developed in controlled environments of research farms and modeling. The CSV approach enables researchers to work in a participatory manner with local communities to test, demonstrate and generate evidence of which CSA practices can work for rural communities at the level of the CSV. The implementation of CSA in the CSVs includes testing and learning with farmers on a range of CSA interventions, including crop varieties, small livestock, small-scale aquaculture and improved farm management practices that consider climate change realities as experienced by the communities. CSA approaches place emphasis on the importance of soil, water and agro-biodiversity conservation within farms, as well as across larger landscape areas that determine the regional agroecology. The promotion of CSA practices in CSVs also includes a range of indirect agriculture interventions, including capacity development, and strengthening extension services (e.g., including agriculture finance and climate information services) that can enable farmers to transition towards climate-smart agriculture [36].
In Myanmar, the International Institute of Rural Reconstruction (IIRR), with support from CGIAR-CCAFS and the International Development Research Center in Canada, has taken a participatory action research (PAR) approach to establish four climate-smart villages in unique agroecologies around the country [33]. This PAR supports a process to establish CSVs in Myanmar, particularly to demonstrate the viability and impact of location-specific CSA in the four distinct agroecologies. The research further aimed to identify scaling pathways for CSA via CSVs, to enable the more widespread adoption CSA portfolio-based approaches by NGOs and government agencies in Myanmar.
This study investigates the relationship between the promotion of CSA practices implemented in four climate-smart villages (CSVs) across Myanmar and the changes in household food security and diet diversification during the time period of the CSA intervention. The key objectives of the study are to (1) monitor impacts on household food security and dietary diversity in CSVs, (2) identify routes to households becoming more food-secure with improved dietary diversity and (3) inform food security and nutrition programs on impacts and outcomes from the adoption of climate-smart agriculture practices and technologies in rural communities.

2. Methodology

2.1. Study Site: Myanmar Climate-Smart Villages

The implementation of the CSV approach was enhanced and adapted by IIRR by presenting it as not only a research for development approach that focused on CSA, but as a broader community development intervention package. The tailored CSV approach of IIRR followed the principles of participatory action research (PAR) and community-based adaptation, where community members are active participants in the process of understanding the challenges, finding and testing solutions and learning from doing.
The IIRR CSV approach in Myanmar follows a 3-step process that includes (1) understanding vulnerabilities and their drivers, (2) identifying and testing adaptation options and (3) social learning within the village and with other villages. For this process, IIRR developed a menu of “socio-technical” methods and tools to facilitate community processes along the 3-step process, consistent with the principles of PAR (Barbon et al. 2021). These socio-technical tools and methods include participatory climate vulnerability and risk assessments, community workshops to identify “no-regrets” options for climate change adaptation (vis a vis the experienced climate risks and vulnerabilities) as well as farmer field days and roving workshops to facilitate the cross-learning and cross-incubation of new ideas and new experiences of farmers working to adapt to climate change.
This study was undertaken across four climate-smart villages (CSVs) in Myanmar, each adopting a portfolio of climate-smart agriculture practices in the four agroecologies of the country. Table 1 provides an overview of the profile of the four Myanmar CSVs.
Table 1 highlights that the four CSVs span the major diversity of agroecologies and agriculture systems across Myanmar. For instance, the farming system in Chin State, a highland region of Myanmar, is significantly driven by household consumption, as expected considering their isolation. This differs from the farming systems of the delta and dry zones, where production is primarily driven by markets. Agricultural production in the CSV in Shan is intermediate, driven by both household use and market sale, as this village is close to trading centers. Each of these four CSVs also experiences climate change differently, which is a key driver of IIRR’s approach based on the importance of localized climate change adaptation in agriculture that is systems-oriented, rather than crop- or commodity-oriented. In systems-oriented approaches, broader consideration is made of the impact of soil, water, climate variability and extension services, all of which interact to determine the outcome, quality and livelihood impact of agriculture production.
As local communities experience climate change risks and vulnerabilities differently, adaptation approaches will also differ between communities. This is where the value of community-based approaches is significant, particularly by ensuring that CSA practices are tailored to the unique contexts of the participating communities. Consistent with this principle, IIRR has promoted a “portfolio” or “basket of options” approach” to CSA adoption by rural communities. The portfolio approach involves communities in considering a list of CSA adaptation options tailored to each of their specific vulnerabilities and risks. This menu of options can include, e.g., technological options, such as promoting stress-tolerant varieties of primary crops, or new platforms for agriculture production, such as integrating and improving small livestock production and vegetable production in homesteads (the patch of land around the household dwelling, which, in Southeast Asia, can sometimes comprise up to 200–400 square meters of land).
The portfolio of CSA practice options can also include practices such as the use of green manure to reduce the footprint of fertilizer use, integrating trees into the existing farming system to generate new sources of income, improving soil health and creating micro-climates around the farm to protect farms against strong winds during storms. The CSA practice portfolio approach also helps to ensure social inclusiveness (with the aim that no one member of the community is excluded) based on the identification of CSA options irrespective of the household context, e.g., for households with large land areas, households without farmland but with a homestead, women-headed households, households that are wealthier and households that are very poor.
In the process of developing the menu of CSA options, IIRR facilitators conducted consultations with farmers and other rural community researchers to produce portfolios of possible options as a response to their understanding of climate risks and vulnerabilities. The list of possible CSA options was further prioritized using the following criteria [33].
  • Criteria 1: Is it climate-smart (i.e., reduces GHGs, enhances soil, agro-biodiversity, conserves and reduces risk of losses of the farms)?
  • Criteria 2: Is it ecosystem friendly (environmentally friendly)?
  • Criteria 3: Is it nutrition-sensitive?
  • Criteria 4: Does it address food insecurity?
After each of the CSVs finalized their portfolio of options, IIRR provided a small grant facility (termed the CSV Adaptation Fund) to support the implementation and trials of the identified options. The implementation and trials were conducted for two annual production seasons during 2019 and 2020. Alongside the implementation of these CSA options in each of the CSVs, IIRR also supported capacity development and awareness building activities to maximize the potential of CSA to generate development outcomes. In relation to this, IIRR implemented community-based nutrition education activities.

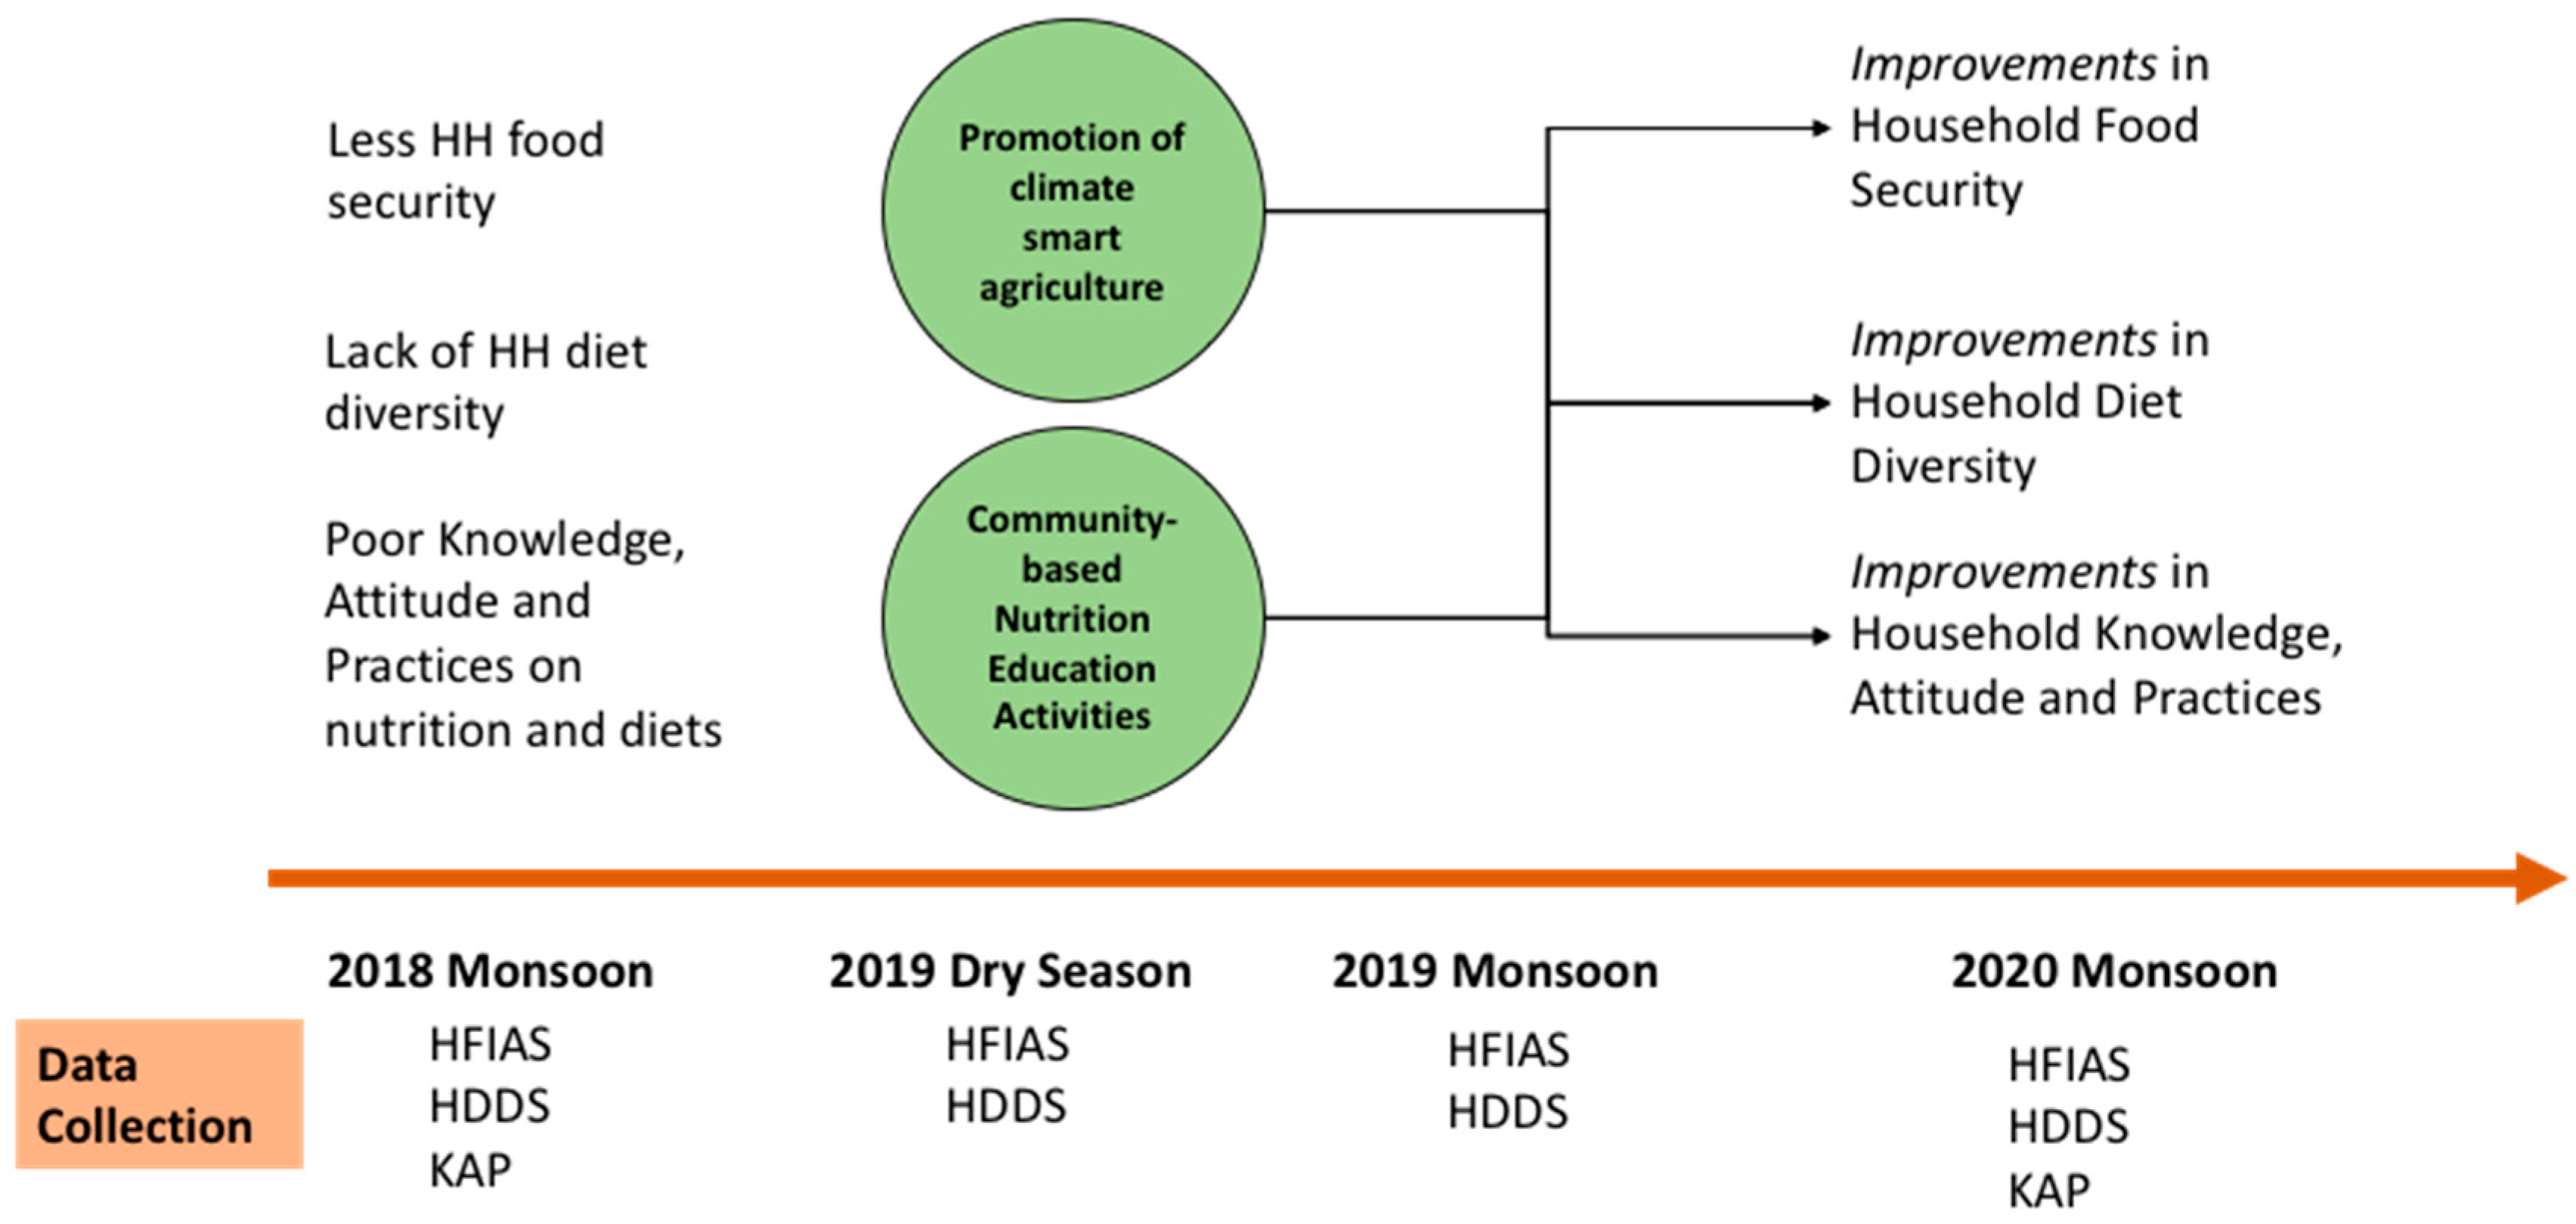
2.2. Conceptual Framework

The conceptual framework of this study sought to understand the linkages by which climate-smart agriculture coupled with nutrition education can be better leveraged to achieve well-being outcomes for agriculture-based communities, such as food security and nutrition (Figure 1). For nutrition, we used dietary diversity as a proxy indicator for improved nutritional outcomes.

2.3. Household Food Insecurity Access Scale (HFIAS) and Household Dietary Diversity Score (HDDS)

To measure food security and diet diversity, the Household Food Insecurity Access Scale (HFIAS) and Household Dietary Diversity Score (HDDS) were used. Data were collected from households in the four climate-smart villages (CSVs) in Myanmar. IIRR and its local NGO partners facilitated and provided support for households to implement climate-smart agriculture options in the villages from 2018. The CSA options deployed relied heavily on fruit tree crops and small livestock as core components of diversification, along with intercrops of annual crops such as corn, sorghum, upland rice and vegetables (depending on location). The CSA interventions were tracked annually to determine the number of CSA options adopted by HHs in a given season. The data sets from 2018 (monsoon), 2019 (dry season) and 2019 (monsoon) were analyzed for HFIAS and HDDS.
The Household Food Insecurity Access Scale (HFIAS) is an approach to measure food insecurity at the household level. This approach is founded on the idea that when households experience food insecurity, it results in reactions and responses that can be collected and quantified in a structured community survey. Household food insecurity access was measured using a methodology designed and developed by a partnership of USAID and the Food and Nutrition Technical Assistance Project (FANTA) [37].
The Household Dietary Diversity Score HDDS is a metric used to measure the diversity of a household’s diet. The HDDS is measured by the method developed by FAO Nutrition and Consumer Protection Division with support from EC/FAO and FANTA. Similar to the HFIAS questionnaire, HDDS uses a points-based system to calculate the diversity of a given diet. The recall period for HDDS surveys is 24 h, where respondents are asked to describe the foods (meals and snacks) that the household ate on the previous day, starting with the foods first eaten in the morning up until they went to sleep that night. A set of 12 food groups are used to guide the scoring as per the food items consumed (Table 2). Each food group is assigned a score of 1 if consumed or 0 if not consumed. The maximum score possible is hence 12, and the lowest is 1, meaning that the household only consumed one food type in that period. Food consumed outside of the home is not included [38].
In addition to the HFIAS and HDDS surveys, the knowledge, attitudes and practices (KAP) of households were also assessed in the four climate-smart villages on nutrition, the importance of nutrition, food choices, food preparation and hygiene by inclusion of KAP questions included in the HFIAS and HDDS questionnaire. The data for KAP were collected and analyzed for the years 2018 and 2020.

2.4. Knowledge, Attitudes and Practices (KAP)

To assess the respondent’s KAP, the respondents were asked whether they agreed or disagreed with each of the statements in the questionnaire. To assess KAP, there are a total of 45 statements, where 15 statements are each assigned as knowledge, attitudes and practices. The statements are also presented as either a positive or negative statement. This ensures that respondents will avoid giving responses that all agree to the statements. A positive statement ideally should be responded with an agreement and a negative statement a disagreement. The KAP results are presented as percentages (%) of the HHs agreeing to the statement. Data from both 2018 and 2020 were used. McNemar’s test was used to determine whether any KAP increase or decrease between 2018 and 2020 was statistically significant.

2.5. Household Surveys

In this study, we used household survey data collected by IIRR for the years 2018, 2019 and 2020. The household surveys were conducted in full enumeration, where all households in the CSVs were included in the surveys. The survey questionnaire was prepared in English, translated into the Myanmar language and then pre-tested with other non-CSV farmers on-site to check the translation of the questionnaire. The questionnaire included information on household demographics, livelihoods, poverty and on HFIAS, HDDS and KAP. A total of 527 household respondents were included in the overall sample.
The survey data were encoded in Microsoft Excel and data analysis conducted using the Statistical Package for Social Sciences (SPSS). The following statistical analyses were performed.
  • Analysis of Variance (ANOVA) to determine statistically significant differences in HDDS and HFIAS across the 4 CSVs.
  • Post-Hoc Tukey–Kramer test to determine statistical differences in HDDS and HFIAS in the pairwise combination among CSVs.
  • Likelihood Ratio Test to determine which factors influenced the HDDS and HFIAS. The factors used in this analysis are based on the other data collected from secondary sources, such as temperature, rainfall and, from the survey data, the level of adoption of the household of CSA options.
  • McNemar’s Test to determine statistical differences between 2018 and 2020 data is presented in percentages in the KAP. This test is used to analyze pre-test vs. post-test study designs, as well as being commonly employed in analyzing matched pairs and case–control studies.

3. Results and Discussion

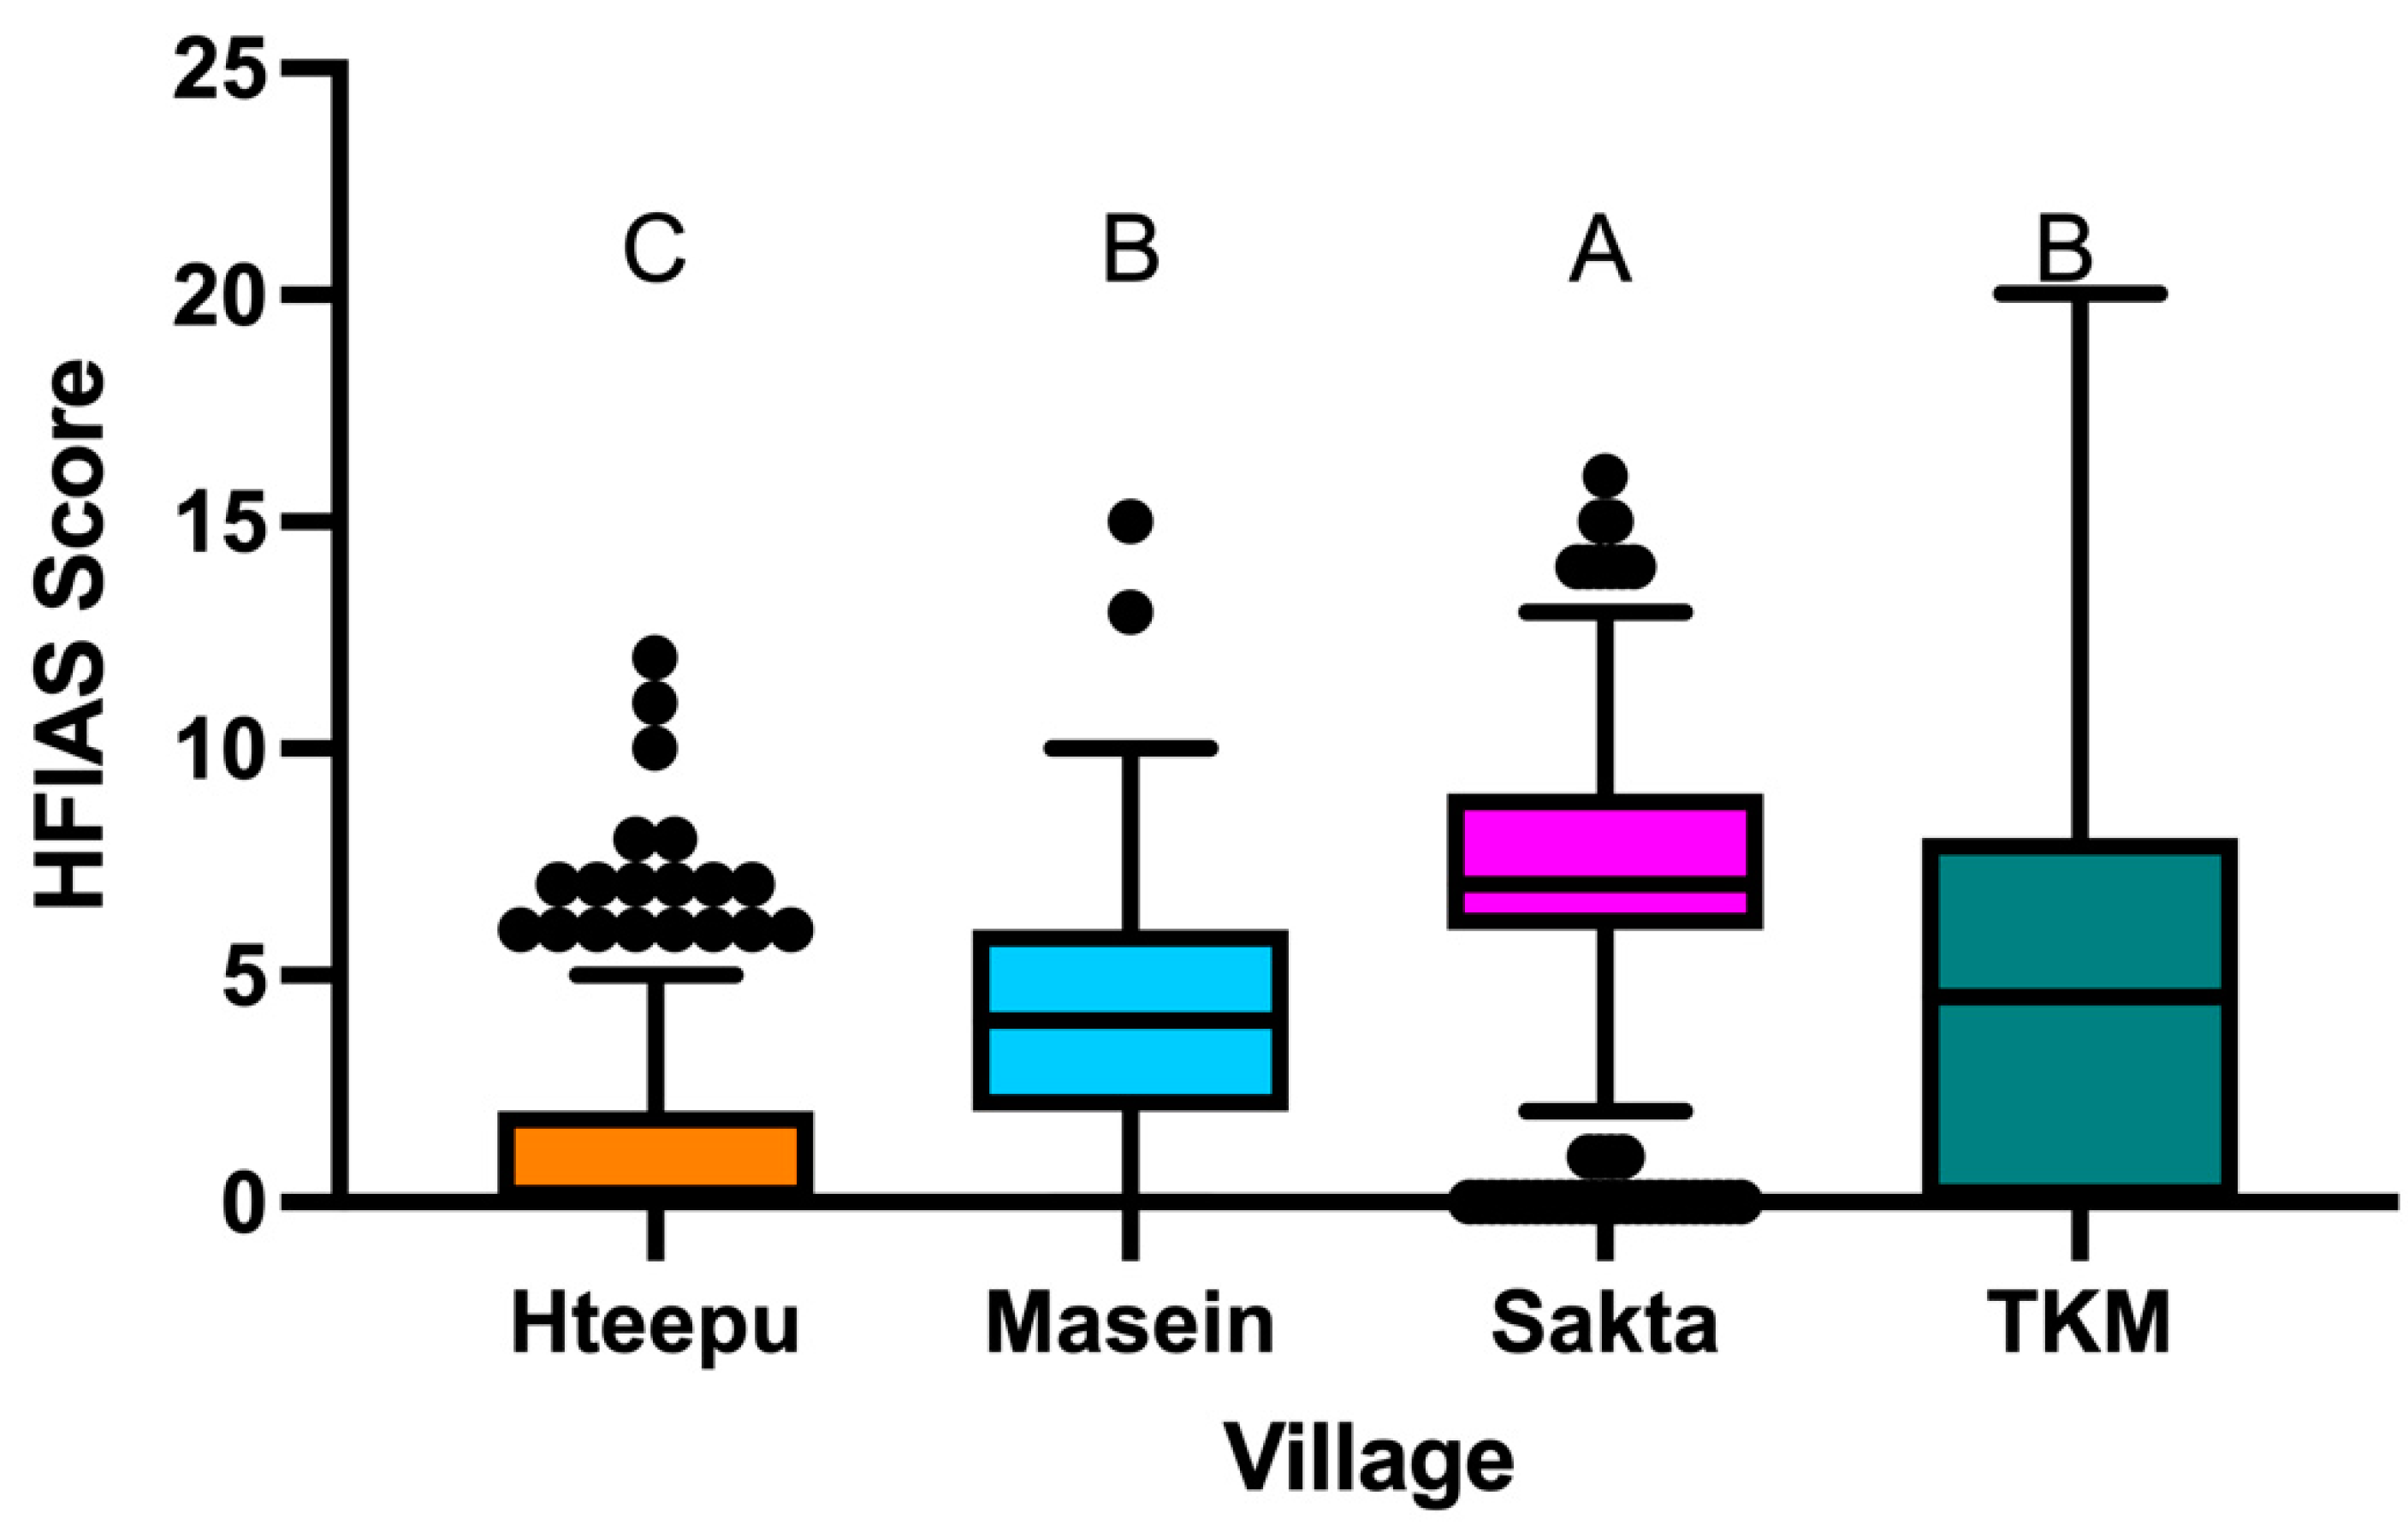
3.1. Significant Differences in Household Food Insecurity (HFIAS) between CSVs

The ANOVA results showed that significant differences were found between the CSVs Htee Pu (M = 1.29 ± 0.11), Ma Sein (M = 3.89 ± 0.22), Saktha (M = 7.01 ± 0.22) and TKM (M = 4.48 ± 0.32) (Figure 2). On average, individuals in Saktha had the highest HFIAS scores, indicating that they tended to be the most food-insecure. Conversely, Htee Pu CSV had the lowest HFIAS scores, indicating that this community is the most food-secure out of the four CSVs. There was no significant difference among the HFIAS scores of the villages of Taung Kamau and Ma Sein. These results indicate that, in Myanmar, food security varies between CSV locations, where, within this study, the Saktha CSV in Chin State is the most food-insecure compared to the other CSVs.

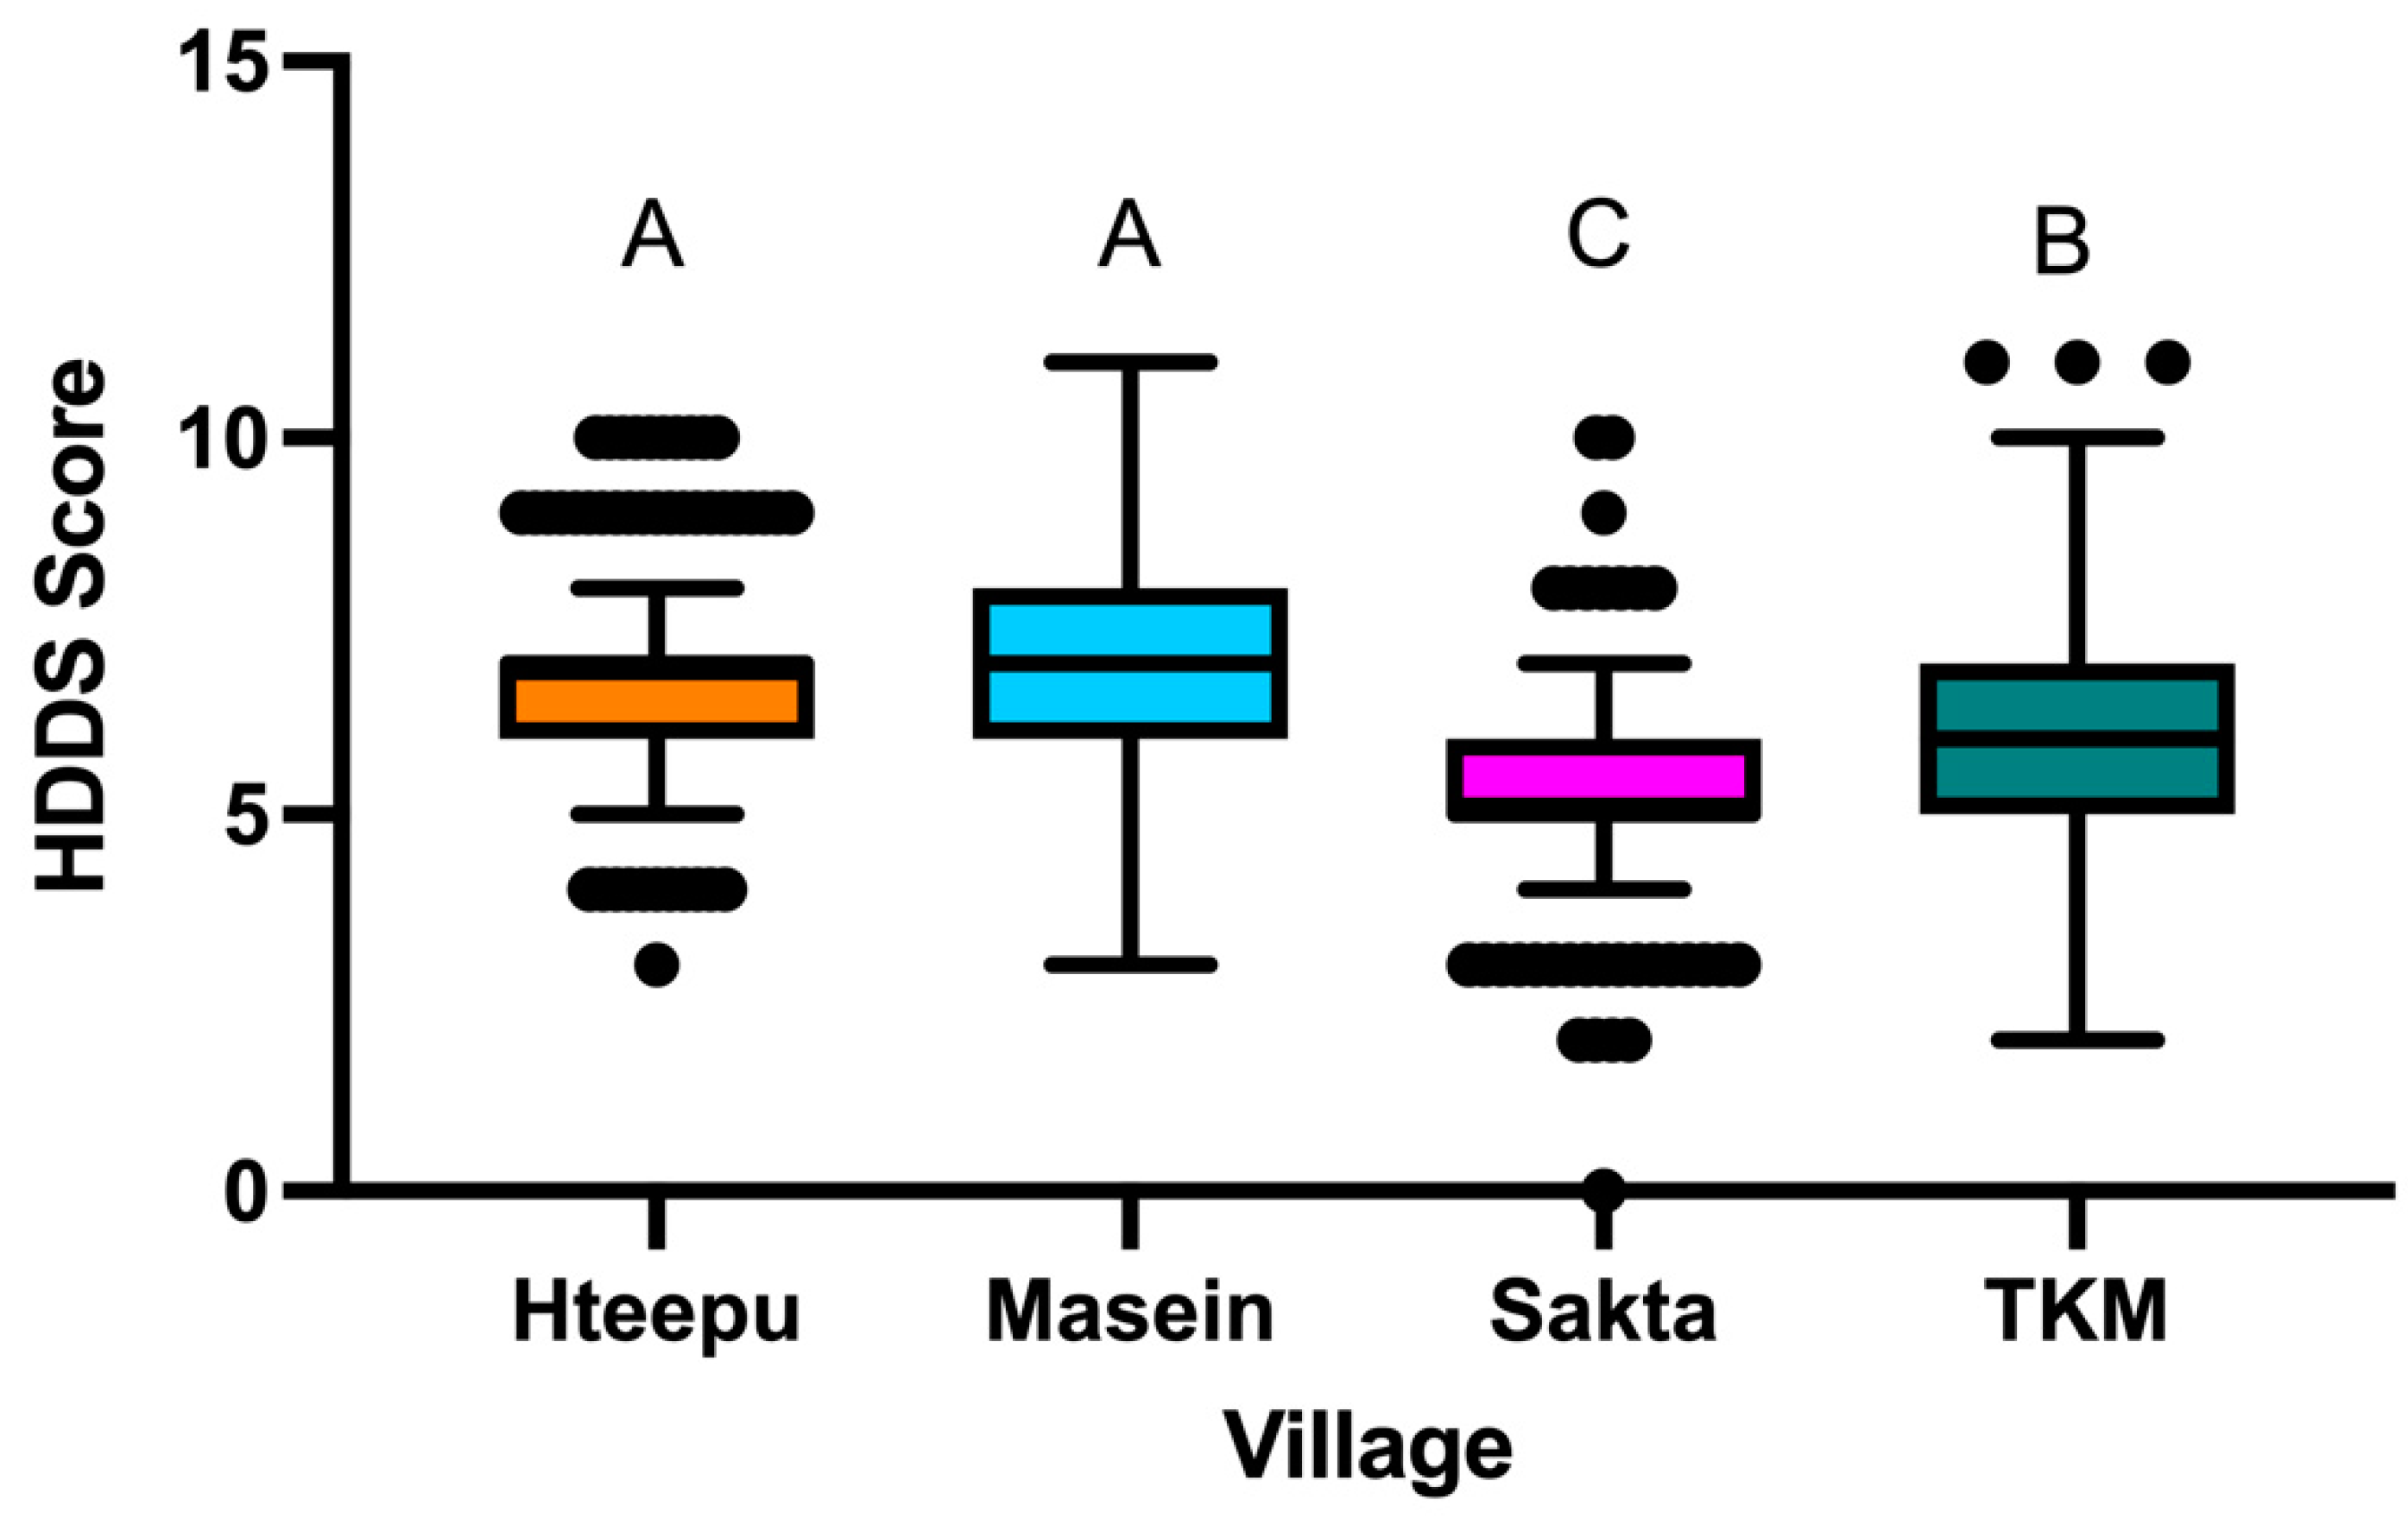
3.2. Significant Differences in Household Dietary Diversity (HDDS) among CSVs

To identify any differences in the dietary diversity of households (HH) in the four CSVs, mean HDDS scores were calculated for each village, where a HDDS of 7 or higher indicates that a HH has an adequately diverse diet (Figure 3). ANOVA results indicated that there was no significant difference between the villages of Htee Pu (M = 6.6 ± 0.07) and Ma Sein (M = 6.7 ± 0.12). However, TKM (M = 6.22 ± 0.13) and Saktha (M = 5.4 ± 0.09) were instead both statistically different from each other and the other two villages. Our results indicate that the Htee Pu and Ma Sein have the best mean dietary diversity scores, while Saktha has the worst average HDDS.

3.3. Number of CSA Options Adopted by the Households Correlates with HFIAS and HDDS

To investigate the impact of CSA introductions, the numbers of households that were considered to have diverse diets both before and after CSA introduction were considered. Across all four CSVs, 37% of households with no access to CSA obtained a score of 7 or higher, while, for households with access to at least one CSA intervention, this increased to 47%.
An effect likelihood ratio test (Table 3) confirmed that the location of each CSV had the most significant influence on the HFIAS scores, while the “numbers of CSA” were not significantly different. This suggests that the numbers of CSA interventions, carried out under these circumstances, had no influence on the HFIAS score that a household could achieve over the timescale of the intervention that was measured.
The impact of different variables on HDDS was also determined (Table 4) and the results indicated that both “location” and “number of CSA” options implemented had highly significant differences (p = 0.0002).

3.4. Contrasting Values of HFIAS and HDDS

Our study found no correlation between the number of CSA options adopted and food security, despite a strong correlation with dietary diversity. From the earlier 2010 Myanmar Census of Agriculture, rice is an important component of the Myanmar diet. Access to rice is often viewed as an indicator of food security. A reduction in access to rice will lead to an HFIAS response that food is inadequate for the household. Access to rice across much of Myanmar is achieved by purchasing this staple in markets, hence the importance of cash.
Many of the CSA options that have been promoted in the Myanmar CSVs are directed at diversifying accessible food at home and in the farm, relying on fruit trees, small livestock and vegetables, with relatively less reliance on rice as a CSA option (except in TKM, where upland rice is widely grown). The choice of commodities in the CSA project was focused on nutrient-dense products. Some CSA options with promised commercial returns (e.g., dryland horticulture in the dry zone Htee Pu CSV) will likely require more time (possibly years) for economic or nutritional benefits to be realized by the households. It should also be noted that there are other externalities beyond climate change and variabilities that affect the realization of economic benefits from the CSA options. For instance, there was a significant change in the markets for pulses in this period, which dry zone farmers (such as those in Htee Pu CSV) are heavily dependent on.
With regard to why the number of CSA options adopted contributes to changes in the HDDS, Table 5 highlights potential contributions to the dietary diversity of the household per CSA option.

3.5. Major Changes in Household Knowledge

The statistical significance of knowledge of the households in the four CSVs was assessed by McNemar’s test (Table 6). Statements 1 and 8 relate to the understanding of the basic idea of nutrition, and the role of nutritious food in achieving a healthy body and longer life. The analysis revealed that only TKM CSV exhibited a significant improvement in the respondents’ understanding of nutrition and nutritious food, while the other CSVs showed a poor understanding of these topics in 2020.
This suggests a need for more careful messaging and awareness building on what nutrition is, and why it is important.
Statements 2, 4, 10, 12 and 15 relate to the basic understanding of topics such as food groups, vitamins, minerals and anemia. Overall, there remains a lack of understanding of what anemia is (statement 2) and why it is important for ensuring nutrition in the households. While there was a lack of understanding of anemia, the Htee Pu and Ma Sein CSVs indicated some improvements in their understanding of the role of iron for a healthy body. However, overall, it is indicative that the concept of anemia and the role of iron are not well-understood across the four CSVs.
For the food groups (statements 4, 12 and 15), only Htee Pu and Ma Sein showed a significant improvement in their understanding of the three basic food groups. However, in the case of understanding carbohydrates and fats, there was no overall improvement in the respondents’ understanding of these food groups. Only the Htee Pu CSV showed a significant improvement in understanding the important role of green and leafy vegetables as sources of vitamins A and C and iron.
Statements 5 and 11 relate to the role of vegetables and fruits in preventing disease and infection, and their dietary importance. All four CSVs indicated significant improvements in statement 5 (that vegetables and fruits prevent disease and infection) but only Ma Sein CSV indicated a significant improvement in understanding that green and leafy vegetables are important parts of the diet.
Statements 6, 7 and 9 relate to the importance of hygiene and cleanliness in addressing malnutrition. TKM CSV showed a significant improvement in understanding the important role of personal hygiene and cleanliness. Saktha CSV showed significant improvements in understanding the link of parasitic worms to malnutrition.
Overall, the Htee Pu and Ma Sein CSVs demonstrated the greatest number of improvements in their understanding of the food groups, the important role of fruits and vegetables in the diet and knowledge about vitamins and minerals.

3.6. Major Changes in Household Attitudes

To determine how household attitudes towards nutrition, food choices, food preparation and hygiene had changed, we tabulated responses from across the CSVs and used McNemar’s test to assess statistical differences (Table 7). While we found various patterns of change, many CSVs displayed no or little improvement in understanding key aspects.
For example, Htee Pu CSV showed a significant improvement in considering beans and legumes as good substitutes for meat proteins (statement 1), while CSV and Ma Sein CSV showed significant improvements in their attitude towards consuming fruits and vegetables (statements 2, 12). Ma Sein CSV and Saktha CSV showed significant improvements in relation to food preparation for the family not being difficult to do (statement 5). All CSVs (except Saktha) showed significant improvements in believing that the way in which food is cooked is important for obtaining the best nutrients from it.
No significant improvement could be determined across the four CSVs with respect to the importance of feeding children the best foods, and the role of parents in being good role models to children about “eating right” (statements 9, 10). However, TKM and Saktha CSVs showed significant improvements in their attitude towards the importance of giving breast milk to babies and infants up to 2 years old.
Across all CSVs, there were significant improvements in the attitude towards having home gardens, and in appreciating that having smaller landholdings is not necessarily a hindrance to having a home garden (statement 14).
In terms of hygiene, all CSVs showed significant improvements in their attitude that it is not normal for children to have parasitic worms (statement 7). TKM CSV and Ma Sein CSV improved in their attitude that kitchens where food is prepared should be clean all the time. Htee Pu and Ma Sein CSVs showed improvements in their attitudes that unprocessed rainwater is not a good source of drinking water (statement 15).

3.7. Improvements in Household Practices

Having identified several areas of improvement in attitudes towards nutrition, food preparation and hygiene, we also investigated improvements in related household practices across the CSVs, again using McNemar’s test to evaluate the significance of any changes (Table 8).
Statements 1, 2, 5 and 9 relate to dietary diversification and to the consumption of clean drinking water. The Htee Pu CSV and Ma Sein CSVs exhibited significant improvements in the practice of giving children fruits, root crops and bananas as snacks. Htee PU CSV together with Saktha CSV also showed improvements in the practice of including vegetables in the diet more than three times a week, while Saktha CSV also showed a significant improvement in the practice of not only eating rice to ensure proper nutrition. All four CSVs showed significant improvements in the practice of consuming the recommended amount of drinking water per day.
In agreement with the improved awareness, all four CSVs showed improvements in the proportion of households having home vegetable gardens, which were statistically significant for Htee Pu and Saktha (statement 4).
In relation to hygiene practices, not all CSVs showed significant improvements. The TKM CSV showed improvements in the practice of using clean water to wash vegetables (statement 3). The Htee Pu and Ma Sein CSVs also showed significant improvements in the practice of boiling rain and pond water before drinking (statement 12). Rain and pond water are important sources of water in the dry zone and delta regions, where the Htee Pu and Ma Sein CSVs are located, while upland and hilly villages may have more access to spring water for drinking. The Ma Sein and Saktha CSVs showed significant improvements in the practice of deworming children.

4. Conclusions

In this study, we investigated the value of promoting climate-smart agriculture (CSA) practices, coupled with community-level nutrition education and awareness building, to address food insecurity and inadequate nutrition for the overall enhancement of rural livelihoods in Myanmar. Our findings indicated that (based on data collected for two years across four climate-smart villages in Myanmar), CSA can contribute to diversifying and improving the quality of food consumed by households. Both diversification and intensification are key strategies in CSA efforts to sustain small farms, ecologically and economically, while generating critically important nutrition and food security benefits.
Most of the introduced and implemented CSA options that produce nutrient-dense foods (e.g., fruits, vegetables and small livestock) have not generated immediate benefits to households. It is likely that rural communities in Myanmar equate food security with rice, a commodity that was not a focus of the CSA project. In future studies, further consideration of the local food system dimensions, particularly in terms of how households access food, is warranted. Our findings suggest that community education efforts could help communities to understand the benefits that farm diversification can confer in establishing resilience and for fostering local adaptation to climate change manifestation.
Our analysis of KAP indicated that while there is a mix of improvements, there is a poor understanding of households’ knowledge, attitudes and practices in relation to nutrition, food choices, food preparation and sanitation and hygiene.
We also observed that the improvements from the CSA interventions were different across the four CSVs. This may suggest that community-level nutrition education can be further improved, possibly by customizing it according to the particular food system and agro-ecosystem features of each CSV. Such education will likely be necessary to more effectively communicate the potential of leveraging climate-smart agriculture for nutrition.

Author Contributions

The field research conceptualization, methodological design and data collection was overseen and conducted by W.J.B., J.G., S.M.N., C.M. and P.S.T. The data collected were analyzed by A.H., G.B., W.J.B., P.C.M., J.G. and C.S. The initial figures and tables were generated by G.B. and A.H., and subsequently finalized by W.J.B. The paper was drafted by A.H. under supervision of C.S., P.C.M., W.J.B. and J.G., with final drafts generated by W.J.B. and finalized and edited by W.J.B., P.C.M. and C.S. Funding acquisition was by W.J.B. and J.G. All authors have read and agreed to the published version of the manuscript.

Funding

This research was funded by the International Development Research Center (IDRC) Canada, grant number 108748-001. The APC was funded by the same grant.

Institutional Review Board Statement

The studies involving human participants were reviewed and approved by International Development Research Center Canada. The patients/participants provided their written informed consent to participate in this study.

Informed Consent Statement

All subjects gave their informed consent for inclusion before they participated in the study. The study protocol was approved by the International Development Research Center-Canada and the International Institute of Rural Reconstruction.

Data Availability Statement

The data supporting the conclusions of this study are available upon reasonable request from the authors, with the exception for data that identifies the personal information of the research participants.

Acknowledgments

This research was funded by the International Development Research Center (IDRC) Canada and the Consultative Group of International Agricultural Research Centers—Climate Change, Agriculture and Food Security Program (CGIAR-CCAFS). The study was part of a project, Climate and Nutrition Smart Villages as Platforms to Address Food Insecurity in Myanmar, led by the International Institute of Rural Reconstruction (IIRR). The authors would like to acknowledge the work of the research teams in Myanmar for their contribution and support during the study.

Conflicts of Interest

The authors declare no conflict of interest.

Abbreviations

CSVclimate smart villages
CSAclimate smart agriculture
HFIAShouseholkd food insecurity and access score
HDDShousehold diet diversity score
KAPknowledge, attitudes and practices
TKMTaungkhamauk

References

  1. Seager, R.; Ting, M.; Held, I.; Kushnir, Y.; Lu, J.; Vecchi, G.; Huang, H.-P.; Harnik, N.; Leetmaa, A.; Lau, N.-C.; et al. Model projections of an imminent transition to a more arid climate in Southwestern North America. Science 2007, 316, 1181–1184. [Google Scholar] [CrossRef]
  2. Myers, S.S.; Smith, M.R.; Guth, S.; Golden, C.D.; Vaitla, B.; Mueller, N.D.; Dangour, A.D.; Huybers, P. Climate change and global food systems: Potential impacts on food security and undernutrition. Annu. Rev. Public Health 2017, 38, 259–277. [Google Scholar] [CrossRef]
  3. Fanzo, J.; Davis, C.; McLaren, R.; Choufani, J. The effect of climate change across food systems: Implications for nutrition outcomes. Glob. Food Secur. 2018, 18, 12–19. [Google Scholar] [CrossRef]
  4. Davis, K.F.; Downs, S.; Gephart, J.A. Towards food supply chain resilience to environmental shocks. Nat. Food 2021, 2, 54–65. [Google Scholar] [CrossRef]
  5. The State of Food Security and Nutrition in the World 2020; FAO; IFAD; UNICEF; WFP; WHO: Geneva, Switzerland, 2020. [CrossRef]
  6. Smith, M.R.; Myers, S.S. Impact of anthropogenic CO2 emissions on global human nutrition. Nat. Clim. Chang. 2018, 8, 834–839. [Google Scholar] [CrossRef]
  7. Marshman, J.; Blay-Palmer, A.; Landman, K. Anthropocene crisis: Climate change, pollinators, and food security. Environments 2019, 6, 22. [Google Scholar] [CrossRef] [Green Version]
  8. Sánchez, B.; Rasmussen, A.; Porter, J.R. Temperatures and the growth and development of maize and rice: A review. Glob. Chang. Biol. 2014, 20, 408–417. [Google Scholar] [CrossRef]
  9. Zhao, C.; Liu, B.; Piao, S.; Wang, X.; Lobell, D.B.; Huang, Y.; Huang, M.; Yao, Y.; Bassu, S.; Ciais, P.; et al. Temperature increase reduces global yields of major crops in four independent estimates. Proc. Natl. Acad. Sci. USA 2017, 114, 9326–9331. [Google Scholar] [CrossRef] [Green Version]
  10. Wang, J.; Vanga, S.; Saxena, R.; Orsat, V.; Raghavan, V. Effect of climate change on the yield of cereal crops: A review. Climate 2018, 6, 41. [Google Scholar] [CrossRef] [Green Version]
  11. Lamaoui, M.; Jemo, M.; Datla, R.; Bekkaoui, F. Heat and drought stresses in crops and approaches for their mitigation. Front. Chem. 2018, 6, 26. [Google Scholar] [CrossRef]
  12. Grossiord, C.; Buckley, T.N.; Cernusak, L.A.; Novick, K.A.; Poulter, B.; Siegwolf, R.T.W.; Sperry, J.S.; McDowell, N.G. Plant Responses to rising vapor pressure deficit. New Phytol. 2020, 226, 1550–1566. [Google Scholar] [CrossRef] [Green Version]
  13. Steyn, N.; Nel, J.; Nantel, G.; Kennedy, G.; Labadarios, D. Food variety and dietary diversity scores in children: Are they good indicators of dietary adequacy? Public Health Nutr. 2006, 9, 644–650. [Google Scholar] [CrossRef] [Green Version]
  14. Neufeld, L.M.; Beal, T.; Larson, L.M.; Cattaneo, F.D. Global landscape of malnutrition in infants and young children. In Nestlé Nutrition Institute Workshop Series; Michaelsen, K.F., Neufeld, L.M., Prentice, A.M., Eds.; Karger Publishers: Basel, Switzerland, 2020; Volume 93, pp. 1–14. [Google Scholar] [CrossRef]
  15. Nicholson, C.F.; Stephens, E.C.; Kopainsky, B.; Jones, A.D.; Parsons, D.; Garrett, J. Food security outcomes in agricultural systems models: Current status and recommended improvements. Agric. Syst. 2021, 188, 103028. [Google Scholar] [CrossRef]
  16. Hossain, M.S.; Ferdous, S.; Raheem, E.; Siddiqee, M.H. The Double burden of malnutrition—Further perspective. Lancet 2020, 396, 813–814. [Google Scholar] [CrossRef]
  17. Kuehn, L.; McCormick, S. Heat exposure and maternal health in the face of climate change. Int. J. Environ. Res. Public Health 2017, 14, 853. [Google Scholar] [CrossRef] [Green Version]
  18. Lappé, M.; Jeffries Hein, R.; Landecker, H. Environmental politics of reproduction. Annu. Rev. Anthropol. 2019, 48, 133–150. [Google Scholar] [CrossRef] [Green Version]
  19. Victora, C.G.; Adair, L.; Fall, C.; Hallal, P.C.; Martorell, R.; Richter, L.; Sachdev, H.S. Maternal and child undernutrition: Consequences for adult health and human capital. Lancet 2008, 371, 340–357. [Google Scholar] [CrossRef] [Green Version]
  20. Briend, A.; Khara, T.; Dolan, C. Wasting and stunting—Similarities and differences: Policy and programmatic implications. Food Nutr. Bull. 2015, 36 (Suppl. 1), S15–S23. [Google Scholar] [CrossRef]
  21. Ministry of Agriculture, Livestock and Irrigation (MOALI). Myanmar Agriculture Development and Investment Plan 2018/2019 –2022/2023. 2018. Available online: https://www.lift-fund.org/download/file/fid/3787 (accessed on 10 July 2020).
  22. WHO. Global Nutrition Targets 2025 Policy Brief Series, Geneva. 2014. Available online: https://www.who.int/publications/i/item/WHO-NMH-NHD-14.2 (accessed on 20 October 2021).
  23. National Nutrition Centre, Department of Public Health and Ministry of Health and Sport. Myanmar Micronutrient and Food Consumption Survey (MMFCS) (2017–2018) Interim Report, February 2019. Available online: https://www.mohs.gov.mm/page/7339 (accessed on 5 July 2020).
  24. Smith, P.; Clark, H.; Dong, H.; Elsiddig, E.A.; Haberl, H.; Harper, R.; House, J.; Jafari, M.; Masera, O.; Mbow, C.; et al. Chapter 11—Agriculture, forestry and other land use (AFOLU). In Climate Change 2014: Mitigation of Climate Change. IPCC Working Group III Contribution to AR5; Cambridge University Press: Cambridge, UK, 2014. [Google Scholar]
  25. Springmann, M.; Clark, M.; Mason-D’Croz, D.; Wiebe, K.; Bodirsky, B.L.; Lassaletta, L.; De Vries, W.; Vermeulen, S.J.; Herrero, M.; Carlson, K.M.; et al. Options for keeping the food system within environmental limits. Nature 2018, 562, 519–525. [Google Scholar] [CrossRef]
  26. IPCC. Global Warming of 1.5 °C. An IPCC Special Report on the Impacts of Global Warming of 1.5 °C above Pre-Industrial Levels and Related Global Greenhouse Gas Emission Pathways, in the Context of Strengthening the Global Response to the Threat of Climate Change, Sustainable Development, and Efforts to Eradicate Povearty; Masson-Delmotte, V., Zhai, P., Pörtner, H.-O., Roberts, D., Skea, J., Shukla, P.R., Pirani, A., Moufouma-Okia, W., Péan, C., Eds.; Intergovernmental Panel on Climate Change: Geneva, Switzerland, 2018.
  27. Lamb, W.F.; Wiedmann, T.; Pongratz, J.; Andrew, R.; Crippa, M.; Olivier, J.G.J.; Wiedenhofer, D.; Mattioli, G.; Khourdajie, A.A.; House, J.; et al. A review of trends and drivers of greenhouse gas emissions by sector from 1990 to 2018. Environ. Res. Lett. 2021, 16, 073005. [Google Scholar] [CrossRef]
  28. Lipper, L.; Thornton, P.; Campbell, B.M.; Baedeker, T.; Braimoh, A.; Bwalya, M.; Caron, P.; Cattaneo, A.; Garrity, D.; Henry, K.; et al. Climate-smart agriculture for food security. Nat. Clim. Chang. 2014, 4, 1068–1072. [Google Scholar] [CrossRef]
  29. FAO. Climate-Smart Agriculture Policies, Practices and Financing for Food Security, Adaptation and Mitigation; FAO: Rome, Italy, 2010; Available online: https://www.fao.org/3/i1881e/i1881e00.htm (accessed on 10 July 2020).
  30. De Pinto, A.; Cenacchi, N.; Kwon, H.-Y.; Koo, J.; Dunston, S. Climate smart agriculture and global food-crop production. PLoS ONE 2020, 15, e0231764. [Google Scholar] [CrossRef]
  31. Mie Sein, Z.M.; Ullah, I.; Syed, S.; Zhi, X.; Azam, K.; Rasool, G. Interannual variability of air temperature over Myanmar: The influence of ENSO and IOD. Climate 2021, 9, 35. [Google Scholar] [CrossRef]
  32. Lar, N.M.; Pumijumnong, N.; Roachanakanan, R.; Arunrat, N.; Tint, S. An assessment of climate variability on farmers’ livelihoods vulnerability in ayeyarwady delta of Myanmar. App. Environ. Res. 2018, 40, 1–12. [Google Scholar] [CrossRef]
  33. Barbon, W.J.; Myae, C.; Vidallo, R.; Thant, P.S.; Monville-Oro, E.; Gonsalves, J. Applying Participatory Action Research Methods in Community-Based Adaptation With Smallholders in Myanmar. Front. Clim. 2021, 3, 734053. [Google Scholar] [CrossRef]
  34. Htwe, N.M.; Htwe, N.M.; The, N.E.M.; Naing, N.N.Z.; Hein, Y. Documenting the application of the Myanmar Climate-Smart Agriculture Strategy. CCAFS Working Paper No. 292. Wageningen, the Netherlands: CGIAR Research Program on Climate Change, Agriculture and Food Security (CCAFS). 2019. Available online: www.ccafs.cgiar.org (accessed on 15 October 2021).
  35. CGIAR. Brochure. Climate-Smart Villages: An AR4D Approach to Scale up Climate-Smart Agriculture. 2017. Available online: https://hdl.handle.net/10568/79353 (accessed on 15 July 2021).
  36. CCAFS; UNFAO. Questions & Answers: Knowledge on Climate-Smart Agriculture; United Nations Food and Agriculture Organisation (UNFAO): Rome, Italy, 2014. [Google Scholar]
  37. Coates, J.; Swindale, A.; Bilinsky, P. Household Food Insecurity Access Scale (HFIAS) for Measurement of Household Food Access: Indicator Guide (v. 3); FANTA: Washington, DC, USA, 2007; FHI360/FANTA. Available online: https://www.fantaproject.org/sites/default/files/resources/HFIAS_ENG_v3_Aug07.pdf (accessed on 15 July 2020).
  38. Swindale, A.; Paula, B. Household Dietary Diversity Score (HDDS) for Measurement of Household Food Access: Indicator Guide (v.2); FANTA: Washington, DC, USA, 2006; FHI 360/FANTA. [Google Scholar]
Figure 1. Conceptual framework for study. HH: household; HFIAS: Household Food Insecurity Access Scale; HDDS: Household Dietary Diversity Score; KAP: knowledge, attitudes and practices.
Climate 09 00166 g001
Figure 2. HFIAS Scores recorded from four Myanmar CSVs. The central line of each column represents the mean HFIAS Score for each CSV ± the standard error, with the outermost lines representing standard deviation. One-way ANOVA was used to determine statistical differences; villages with different letters are significantly different at a 95% confidence interval.
Climate 09 00166 g002
Figure 3. HDDS Scores recorded from four Myanmar CSVs. The central line of each column represents the mean HDDS Score for each CSV ± the standard error, with the outermost lines representing standard deviation. One-way ANOVA was used to determine statistical differences; villages with different letters are significantly different at a 95% confidence interval.
Climate 09 00166 g003
Table 1. Profile of the four climate-smart villages (CSVs) in Myanmar.
Village NameSakthaHtee PuMa SeinTaung Kamauk (TKM)
AgroecologyHighlandsDry ZoneDeltaUpland
Major cropsRice, corn, vegetablesGroundnut, pigeon pea, green gramRice, betel leaves/nutsRice, millet, corn
TownshipHakhaNyaung-OoBogaleNyaung-Shwe
State/regionChinMandalayAyeyarwaddyShan
Total households20027510394
Total population 86511,180453405
No. of females 445603249215
No. of males420577214190
Distance from nearest township32 km35 km11 km20 km
Ethnic groupChin BurmeseBurmesePa-o
(Source: Barbon et al., 2021).
Table 2. Food groups used in this study.
No.Food GroupsNo.Food Groups
1Cereals 7Fish and seafood
2White roots and tubers 8Legumes, nuts and seeds
3Vitamin A-rich vegetables, dark green leafy vegetables, other vegetables9Milk and milk products
4Vitamin A-rich fruits, other fruits10Oils and fats
5Organ meats, flesh meats11Sweets
6Eggs12Spices, condiments and beverages
Table 3. Effect likelihood ratio test (ELRT) carried out to determine which factors influence the HFIAS scores of households across all four CSVs.
SourceNparmDFL-R ChiSquareProb > ChiSq
Location 23211.15496220.0038 *
Min. TEMP100-
Max. TEMP100-
Ave. Temp100-
Rainfall in inches100-
Rain days100-
Number of CSA543.276350490.5127
CSA (all) YN100-
Table 4. Effect likelihood ratio test carried out to determine which factors influence the HDDS of households across all four CSVs.
SourceNparmDFL-R ChiSquareProb > ChiSq
Location 23216.65494290.0002 *
Min. TEMP100-
Max. TEMP109.0949 × 10−13-
Ave. Temp100-
Rainfall in inches100-
Rain days100-
Number of CSA5523.80265910.0002 *
Table 5. Contributions of climate-smart agriculture options to diet diversification.
No.CSA Options Identified by the CSVsWhy Climate-Smart?Potential Contributions to HHDS
1Participatory Varietal Selection (PVS) of primary crops, i.e., rice, maize, pigeon pea, peanutEnable the farmers to identify which varieties work in a specific climate scenario
2Diversification of farm production with vegetables; legumes with crop trials for newly introduced cropsMinimizes the risk of losses in case climate variability reduces yields of main cropProvides food materials that are not necessarily for selling but end up consumed by the HH. For example, legumes as cover crops to protect soil (main purpose) can provide green beans for HH consumption. For producing several crops in the field—in TKM CSV—farms are planted with maize, peanuts and sunflower for selling and, if price is low, will end up being consumed by HH.
3Integration of fruit trees in farms (avocado, mango, banana, jackfruit, oranges)Minimize the risk of losses; trees are more tolerant to variability of rainfall and temperature; sequester more GHGsCan supply fruits for selling for HH consumption too but these results are expected only in another 3 to 5 years
4Planting of legume trees in farms and along boundaries (Alnus spp, Casia spp, Gliricidia spp)Manages the soil degradation and erosion; minimizes dependence on artificial inputs; sequester more GHGsNo contribution to diet diversity but aimed at improvement of soil health
5Homestead production of vegetables, fruits and cash cropsAddresses household food security and under nutrition in times of climate change stressesHomestead production provides vegetables to the HH aside from vegetables for selling
6Small livestock production in homesteadsServed as emergency assets in case of climate change shocks, provide opportunities for womenIn Ma Sein, HH keep ducks, which provide eggs for the HH. In the other CSVs, they raise chickens, goats and pigs, which, in times of need, all can provide income as well as food to the HH.
7Aquaculture (homestead and farm ponds)Diversify income sources, provide opportunities for womenSame as #6. This was undertaken in Ma Sein and Saktha CSVs only.
8Community-based animal propagation centers (pig, chicken, duck and fish)Provide sustainable sources of stocks for HH level livestock productionSame as #6
9School gardens (vegetables, fodder, fruit trees)Served as source of planting materials, education tool for students on CSANo contribution to HDDS
10Improving water storage facilitiesReduces the risk of water shortages in dry conditionsNo contribution to HDDS
Table 6. Proportion of respondents who agree on the knowledge statements related to household nutrition in four CSVs.
Statements aResearcher’s Note bHtee PuTKM (Shan)Ma SeinSaktha
20182020McNemar’s (p-Value) c20182020McNemar’s (p-Value) c20182020McNemar’s (p-Value) c20182020McNemar’s (p-Value) c
1Negative1733040280.1441560035650
2Negative16140.59632290.8682170.00221201
3Negative98960.30288950.1893980.28994890.607
4Positive7791060490.24384910.28687851
5Positive88950.00780950.00782940.01993980.07
6Positive100100186960.0359090195980.453
7Positive100100178850.327100970.2595770
8Positive999917999093990.06394990.07
9Positive98920.01564690.53293980.21967860.001
10Positive17590252611766077660.153
11Positive80860.1047980179930.01791840.23
12Negative76840.05156520.7556492077740.755
13Positive98970.5819896198930.28997961
14Positive98960.30273780.5719798195951
15Positive8670044480.64364830.01884880.345
(a) The statements used for HH knowledge were as follows.
1. Nutrition is about food preparation and malnourished children.2. Anemia or lack of iron makes the child intelligent.
3. Fish, meat and eggs give a person energy.4. Green and leafy vegetables are rich in Vitamins A, C and iron.
5. Vegetables and fruits help the person prevent diseases and infections.6. Personal hygiene and cleanliness helps prevent diseases and infections.
7. Flies and other insects that come into contact with food may cause diseases to humans and also spoil the food.8. Nutritious food is important for humans to be healthy and achieve longer life.
9. Parasitic worms contribute to malnutrition of children10. Iron is important to the body as it helps in delivering oxygen to all parts of the body.
11. Green and leafy vegetables as well as brightly colored vegetables such as squash are good sources of Vitamin A for good eye sight and for growth and development.12. Carbohydrates and fats are considered foods for growth.
13. Rice, corn, potatoes and peanut oil are important sources of energy for people.14. Beans, groundnuts and meats are sources of protein needed for the growth of humans.
15. A good meal must contain food from three groups—energy foods, growth foods and protective foods.
(b) A positive statement ideally shall have move agree responses and a negative statement shall have less agree responses
(c) McNemar’s test was conducted to determine whether there was a significant difference in the proportion (increase or decrease) over time.
If p-value < 0.05, then the proportion was statistically significant at 5%. If p-value < 0.01, then the proportion was statistically significant at 1%. Note: "No responses" were excluded from the analysis.
Table 7. Proportion of respondents who agree on the attitude statements in household nutrition in four CSVs.
Statements aResearcher’s Note bHtee PuTKM (Shan)Ma SeinSaktha
20182020McNemar’s (p-Value) c20182020McNemar’s (p-Value) c20182020McNemar’s (p-Value) c20182020McNemar’s (p-Value) c
1Negative68460383614474052490.677
2Positive92950.2818099099930.12585940.078
3Positive9884088800.1899368092760.009
4Negative5888045480.7743680.00275810.324
5Negative7493056740.01579600.01584690.018
6Positive7192054660.14483920.13490850.556
7Negative999309562098820.00194410
8Positive859606994082950.00487940.143
9Positive100980.03186940.11894980.45397971
10Positive99980.289100930.031100970.2599950.219
11Positive971000.077498076100095961
12Positive88920.14548520.775590075830.31
13Positive84750.02773910.00966690.73581910.041
14Negative9835072480.0059728093470
15Negative483108079171520.01557430.112
(a) The statements used for HH attitudes were as follows.
1. I believe that proteins from beans such as pigeon pea, butter beans and green gram are not substitutes for protein from meat.2. Eating vegetables and fruits is very important for good health.
3. I believe that eating the same food everyday is not enough to get good nutrition.4. I like to eat meat because it gives me Vitamin C.
5. Preparing nutritious food for the family is very hard to do.6. I believe that Vitamin A is very important to have very good eyesight.
7. It is normal children to have parasitic worms.8. It is important to learn the right way to cook food to get the best nutrients from food.
9. It is important to give the right food to my children for them to grow well.10. Parents should be role models to their children in eating the right and nutritious food.
11. It is important that the kitchen where food is prepared should be clean.12. It is important to eat fruits and vegetables of different colors to get vitamins and minerals.
13. I believe that the best source of nutrition for babies up to 2 years old is breast milk14. I believe that growing vegetables in the home is only doable in homes with big land.
15. It is alright to drink collected rain water as it is pure and clean already.
(b) A positive statement ideally shall have move agree responses and a negative statement shall have less agree responses
(c) McNemar’s test was conducted to determine whether there was a significant difference in the proportion (increase or decrease) over time.
If p-value < 0.05, then the proportion was statistically significant at 5%. If p-value < 0.01, then the proportion was statistically significant at 1%. Note: "No responses" were excluded from the analysis.
Table 8. Proportion of respondents who agree on the practice statements in household nutrition in four CSVs.
Statements aResearcher’s Note bHtee PuTKM (Shan)Ma SeinSaktha
20182020McNemar’s (p-Value) c20182020McNemar’s (p-Value) c20182020McNemar’s (p-Value) c20182020McNemar’s (p-Value) c
1Positive58910589105799075910.003
2Positive77870.0029191174910.00954610.263
3Negative123006120021300.21645370.337
4Positive668105455159640.55172930
5Negative24270.42831330.87416360.00744280.022
6Negative66730.13741540.13654480.53254590.401
7Negative7892046690.00449790.00148930
8Positive66540.01152380.11239360.74252500.885
9Negative39250.00146520.52249530.77564330
10Positive98990.68886950.07795980.68897961
11Positive10010019192199100197990.625
12Positive100970.03955440.2124487095920.581
13Positive9780069810.17172193590
14Positive100980.37593921100991100960.125
15Positive98930.01975810.441931000.03185930.041
(a) The statements used for HH practices were as follows:
1. Every person should drink at least 8 glasses of water every day in order to maintain good health.2. I gave my children fruits, root crops and banana as snacks.
3. It is ok to wash vegetables and meat with any kind of water.4. We have a vegetable garden at home.
5. Eating rice alone is enough to provide humans the proper nutrition for good health.6. I have difficulty convincing my children to eat vegetables.
7. I sliced my vegetables first before I wash them.8. I put oil into the food when cooking.
9. We only serve vegetables 3 times a week.10. We wash our hands after we use the toilet, before we prepare food and before we eat.
11. We make sure that flies do not come to our food.12. We boil our drinking water we got from rain and from the pond before we drink it.
13. My children are breast-fed for 2 years.14. Kitchen and eating utensils must be washed with clean water to prevent diseases.
15. Deworming is important to make children healthy.
(b) A positive statement ideally shall have move agree responses and a negative statement shall have less agree responses
(c) McNemar’s test was conducted to determine whether there was a significant difference in the proportion (increase or decrease) over time.
If p-value < 0.05, then the proportion was statistically significant at 5%. If p-value < 0.01, then the proportion was statistically significant at 1%. Note: "No responses" were excluded from the analysis.
Publisher’s Note: MDPI stays neutral with regard to jurisdictional claims in published maps and institutional affiliations.

