Changes in Frequency and Location of East Coast Low Pressure Systems Affecting Southeast Australia


School of Mathematical and Physical Sciences, University of Technology Sydney, Ultimo, NSW 2007, Australia
*
Author to whom correspondence should be addressed.
Climate 2021, 9(3), 44; https://0-doi-org.brum.beds.ac.uk/10.3390/cli9030044
Submission received: 12 February 2021
/
Revised: 1 March 2021
/
Accepted: 2 March 2021
/
Published: 5 March 2021
(This article belongs to the Special Issue Extreme Weather Events)
Abstract
:Low pressure systems off the southeast coast of Australia can generate intense rainfall and associated flooding, destructive winds, and coastal erosion, particularly during the cool season (April–September). Impacts depend on coastal proximity, strength and latitude. Therefore, it is important to investigate changes in frequency, duration, location, and intensity of these systems. First, an existing observation-based database of these low pressure systems, for 1970–2006, is extended to 2019, focusing on April–September and using archived Australian Bureau of Meteorology MSLP charts. Second, data consistency between 1970 and 2006 and 2007 and 2019 is confirmed. Third, permutation testing is performed on differences in means and variances between the two 25-year intervals 1970–1994 and 1995–2019. Additionally, trends in positions, durations and central pressures of the systems are investigated. p-values from permutation tests reveal statistically significant increases in mean low pressure system frequencies. Specifically, a greater frequency of both total days and initial development days only, occurred in the latter period. Statistically significant lower variance for both latitude and longitude in systems that developed in both subtropical easterly and mid-latitude westerly wind regimes indicate a shift south and east in the latter period. Furthermore, statistically significant differences in variance of development location of explosive low pressure systems that develop in a low level easterly wind regime indicate a shift further south and east. These changes are consistent with fewer systems projected to impact the east coast. Finally, important changes are suggested in the large scale atmospheric dynamics of the eastern Australian/Tasman Sea region.
1. Introduction
In recent decades, global warming (GW) has influenced numerous Australian weather and climate events, including an increased frequency and intensity of heatwaves, severe and extended droughts, and record rainfall rates and totals [1]. It is vital to investigate the impacts of GW, both regionally and locally, as any significant increases in frequency and intensity of low pressure systems of the southeast (SE) coast, hereafter referred to generically as east coast lows (ECLs), would pose an even greater threat. Specifically, over the SE coastal region of Australia, ECLs can produce severe impacts, such as intense rainfall, flooding, destructive winds, extreme tides, and coastal erosion [2]. However, ECLs also are responsible for heavy coastal and adjacent inland catchment rainfall events, providing much needed dam inflows. Most of these systems develop in the cool season from April to September [2,3,4,5]. An ECL is defined in this study, following [6], as a cyclone near SE Australia that can be caused by both mid-latitude and tropical influences over a range of levels in the atmosphere. It is not yet known how the GW trend in recent decades has influenced the spatial and temporal distribution of the ECLs. Most studies to date have found little change during the 20th Century and conclude that there is uncertainty concerning their future spatial and temporal distribution, as described in a recent review of Australian east coast low pressure systems [6]. Early studies focused on specific climatological features of the systems [2,7], modelling studies of extreme cyclogenesis [8], or ensemble forecasting techniques [9].
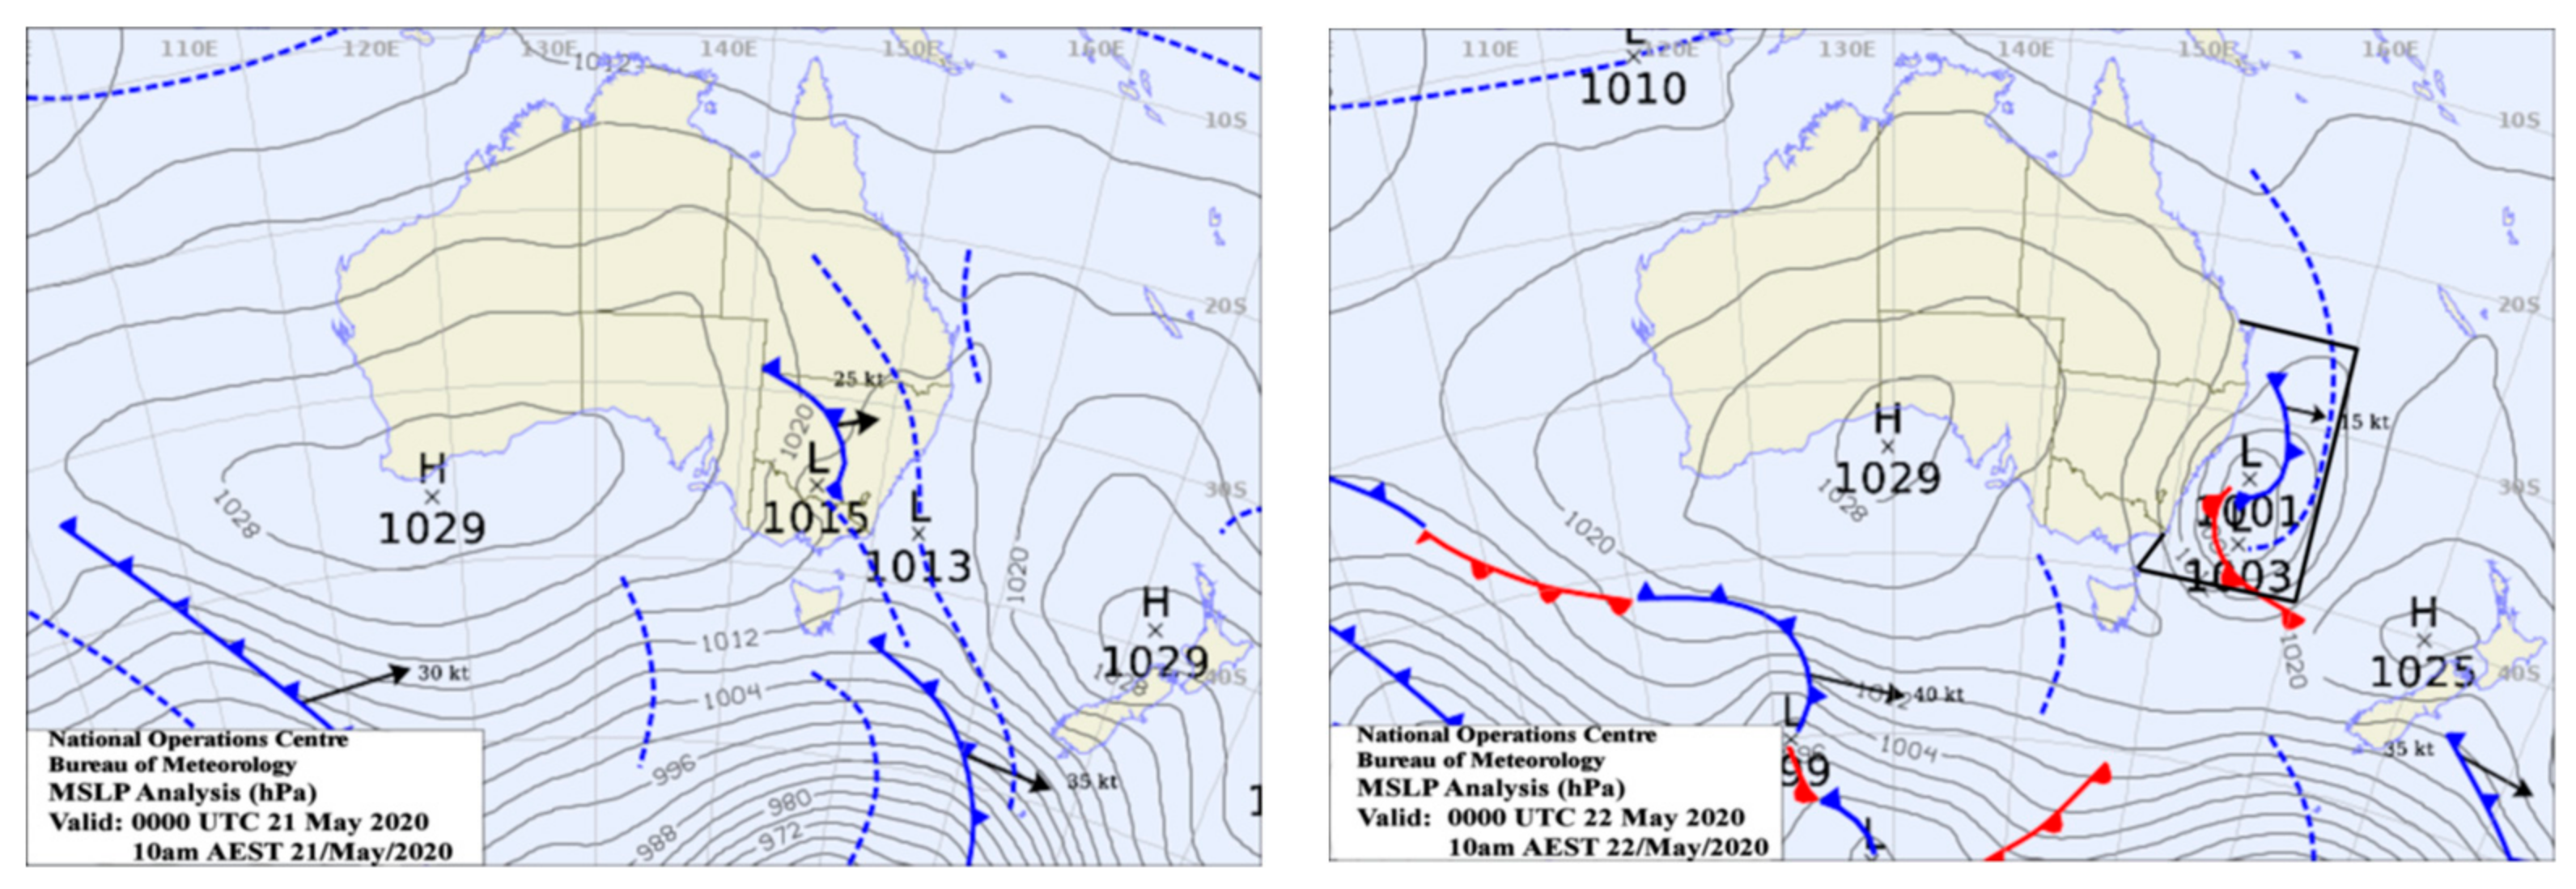
More recently, several studies have used automated tracking methods to define a climatology of ECLs adjacent to the Australian east coast, using climate model output [6], with comparisons to the comprehensive observational database developed by Speer [10]. Those subsequent historical climatologies have employed several identification/tracking methods by authors to generate the objective climatologies from a range of reanalyses [11,12,13,14,15,16] and then were compared with the database of Speer et al. [10]. The horizontal scale of ECL systems, which can be very small, are dependent on the gradient of surface pressure within the system and is one reason why different objective classifications can produce slightly different results. The scale problem is fully discussed in [10]. In terms of coastal impacts, ECLs can be well-defined synoptic systems, especially in the case of Explosive ECLs, grading to low pressure troughs with weak pressure gradients that also can produce heavy coastal rainfall. As noted by Dowdy et al. [6], different identification/tracking methods produce different results, so all approaches have limitations. The Speer et al. [10] database of Australian east coast ECL systems covers only the period 1970–2006 and urgently needs updating. It classified ECLs into subsets forming within six synoptic categories and defined explosive ECL formation as one with a 24 h pressure drop ≥10 hPa based on the 24 h deepening rate proposed by Sanders and Gyakum [17]. The highest research priority recommended by Dowdy et al. [6], was to update the database of Speer et al. [10]. While ECLs can impact the Australian southeast coast any time of year, for example, the Sydney-Hobart storm in December 1998 [18,19] and the March 2001 storm [20,21], the influence of ECLs on the Australian SE coast occurs mainly in the cool season (April–September), when both the polar and subtropical jet streams can dynamically and thermodynamically interact through the lower atmosphere to produce impacts from the resulting formation of surface low pressure systems. A recent example of an ECL which developed in the 24 h period 00 UTC 21 to 00 UTC 22 May 2020, and which also met the criterion of an Explosive ECL described above, is shown in Figure 1.
The main aims of this study are twofold. First is to extend the existing ECL database to cover the 13-year period April to September, 2007–2019, including observed characteristics of the ECLs such as date, latitude/longitude, central pressure when first observed, duration and strongest intensity of each event. As a result of the database update, it will be the first time that such a long (50 years) study of Australian ECLs, which are one of the most important weather systems affecting southeast Australia, has been carried out. In addition, Explosive ECL pressure systems defined above in [10], as a 24 h central pressure drop ≥10 hPa, are identified in the updated database. Second is to identify trends in the ECL frequency of occurrence, position, and central pressure characteristics over the 50-year period April–September 1970–2019. Permutation testing with replacement [22], is used to obtain p-values for differences in the means and variances, by dividing the 50-year dataset into two 25-year intervals, namely, 1970–1994 and 1995–2019. This choice of periods is intended to encompass the accelerated period of GW over the recent 25 years, relative to the previous 25 years because accelerated GW is most evident from the mid-1990s [23]. The Data and Methodology Section is next, which includes confirming the consistency in approach of the entire updated 1970–2019 database, followed by the Results and Discussion Sections. Finally, the Conclusions Section summarizes the results.
2. Data and Methodology
The updated climatology of ECLs is restricted to April–September 1970–2019 and covers the sub-tropical area between 25° S and 40° S (Figure 1). This area is identical to that of [10]. The updated database records the initial date that an ECL forms in the area, and its position and central pressure as shown on the Australian Bureau of Meteorology archived MSLP charts. Initially, the ECLs were classified as forming from one of the six synoptic-mesoscale categories as defined in [10], namely, lows in Easterly (coastal) troughs (ET); lows in Easterly (inland) troughs (IT); Ex-tropical cyclones (Ex-TC); lows developing from a wave on a front (WF); lows forming on a decaying front (DF); and lows forming in a westerly wind regime (LW). By definition, these systems cover a range of horizontal scales which might not be fine enough to detect some of the very small scale systems using automated tracking techniques on historical reanalyses. The scale problem is discussed in detail in [10]. Of the six synoptic categories, the first three form at MSLP in the subtropical easterlies and the last three form in a mid-latitude westerly wind regime. These two groupings were selected because it is important to investigate whether there have been latitudinal or longitudinal position changes of ECL development within those wind regimes. In addition, three subset groupings of Easterlies and Westerlies, consisting of Explosive ECLs (Explosive Easterlies + Explosive Westerlies), were identified. These three Explosive subset groups were formed to investigate possible trends due to GW as they are responsible for a range of severe coastal impacts, including heavy rain leading to flooding, coastal erosion from large wave and swell heights and infrastructure damage from extreme wind speeds. As in [10], an Explosive ECL is defined according to the criteria of Sanders and Gyakum [17] as a normalized 24 h central pressure deepening rate for explosive development at 60° latitude. To include the study area latitudes that deepening rate value is a 24 h pressure drop ≥10 hPa.
In summary, the statistical analyses described in Section 2.2 were performed on a total of seven groupings: Total ECL days, Total ECL development days, Easterlies, Westerlies, Explosive, Explosive Easterlies and Explosive Westerlies.
2.1. Data Consistency
The updated April–September ECL database 1970–2019 is available at: https://0-doi-org.brum.beds.ac.uk/10.5281/zenodo.4137957 (accessed on 10 February 2021).
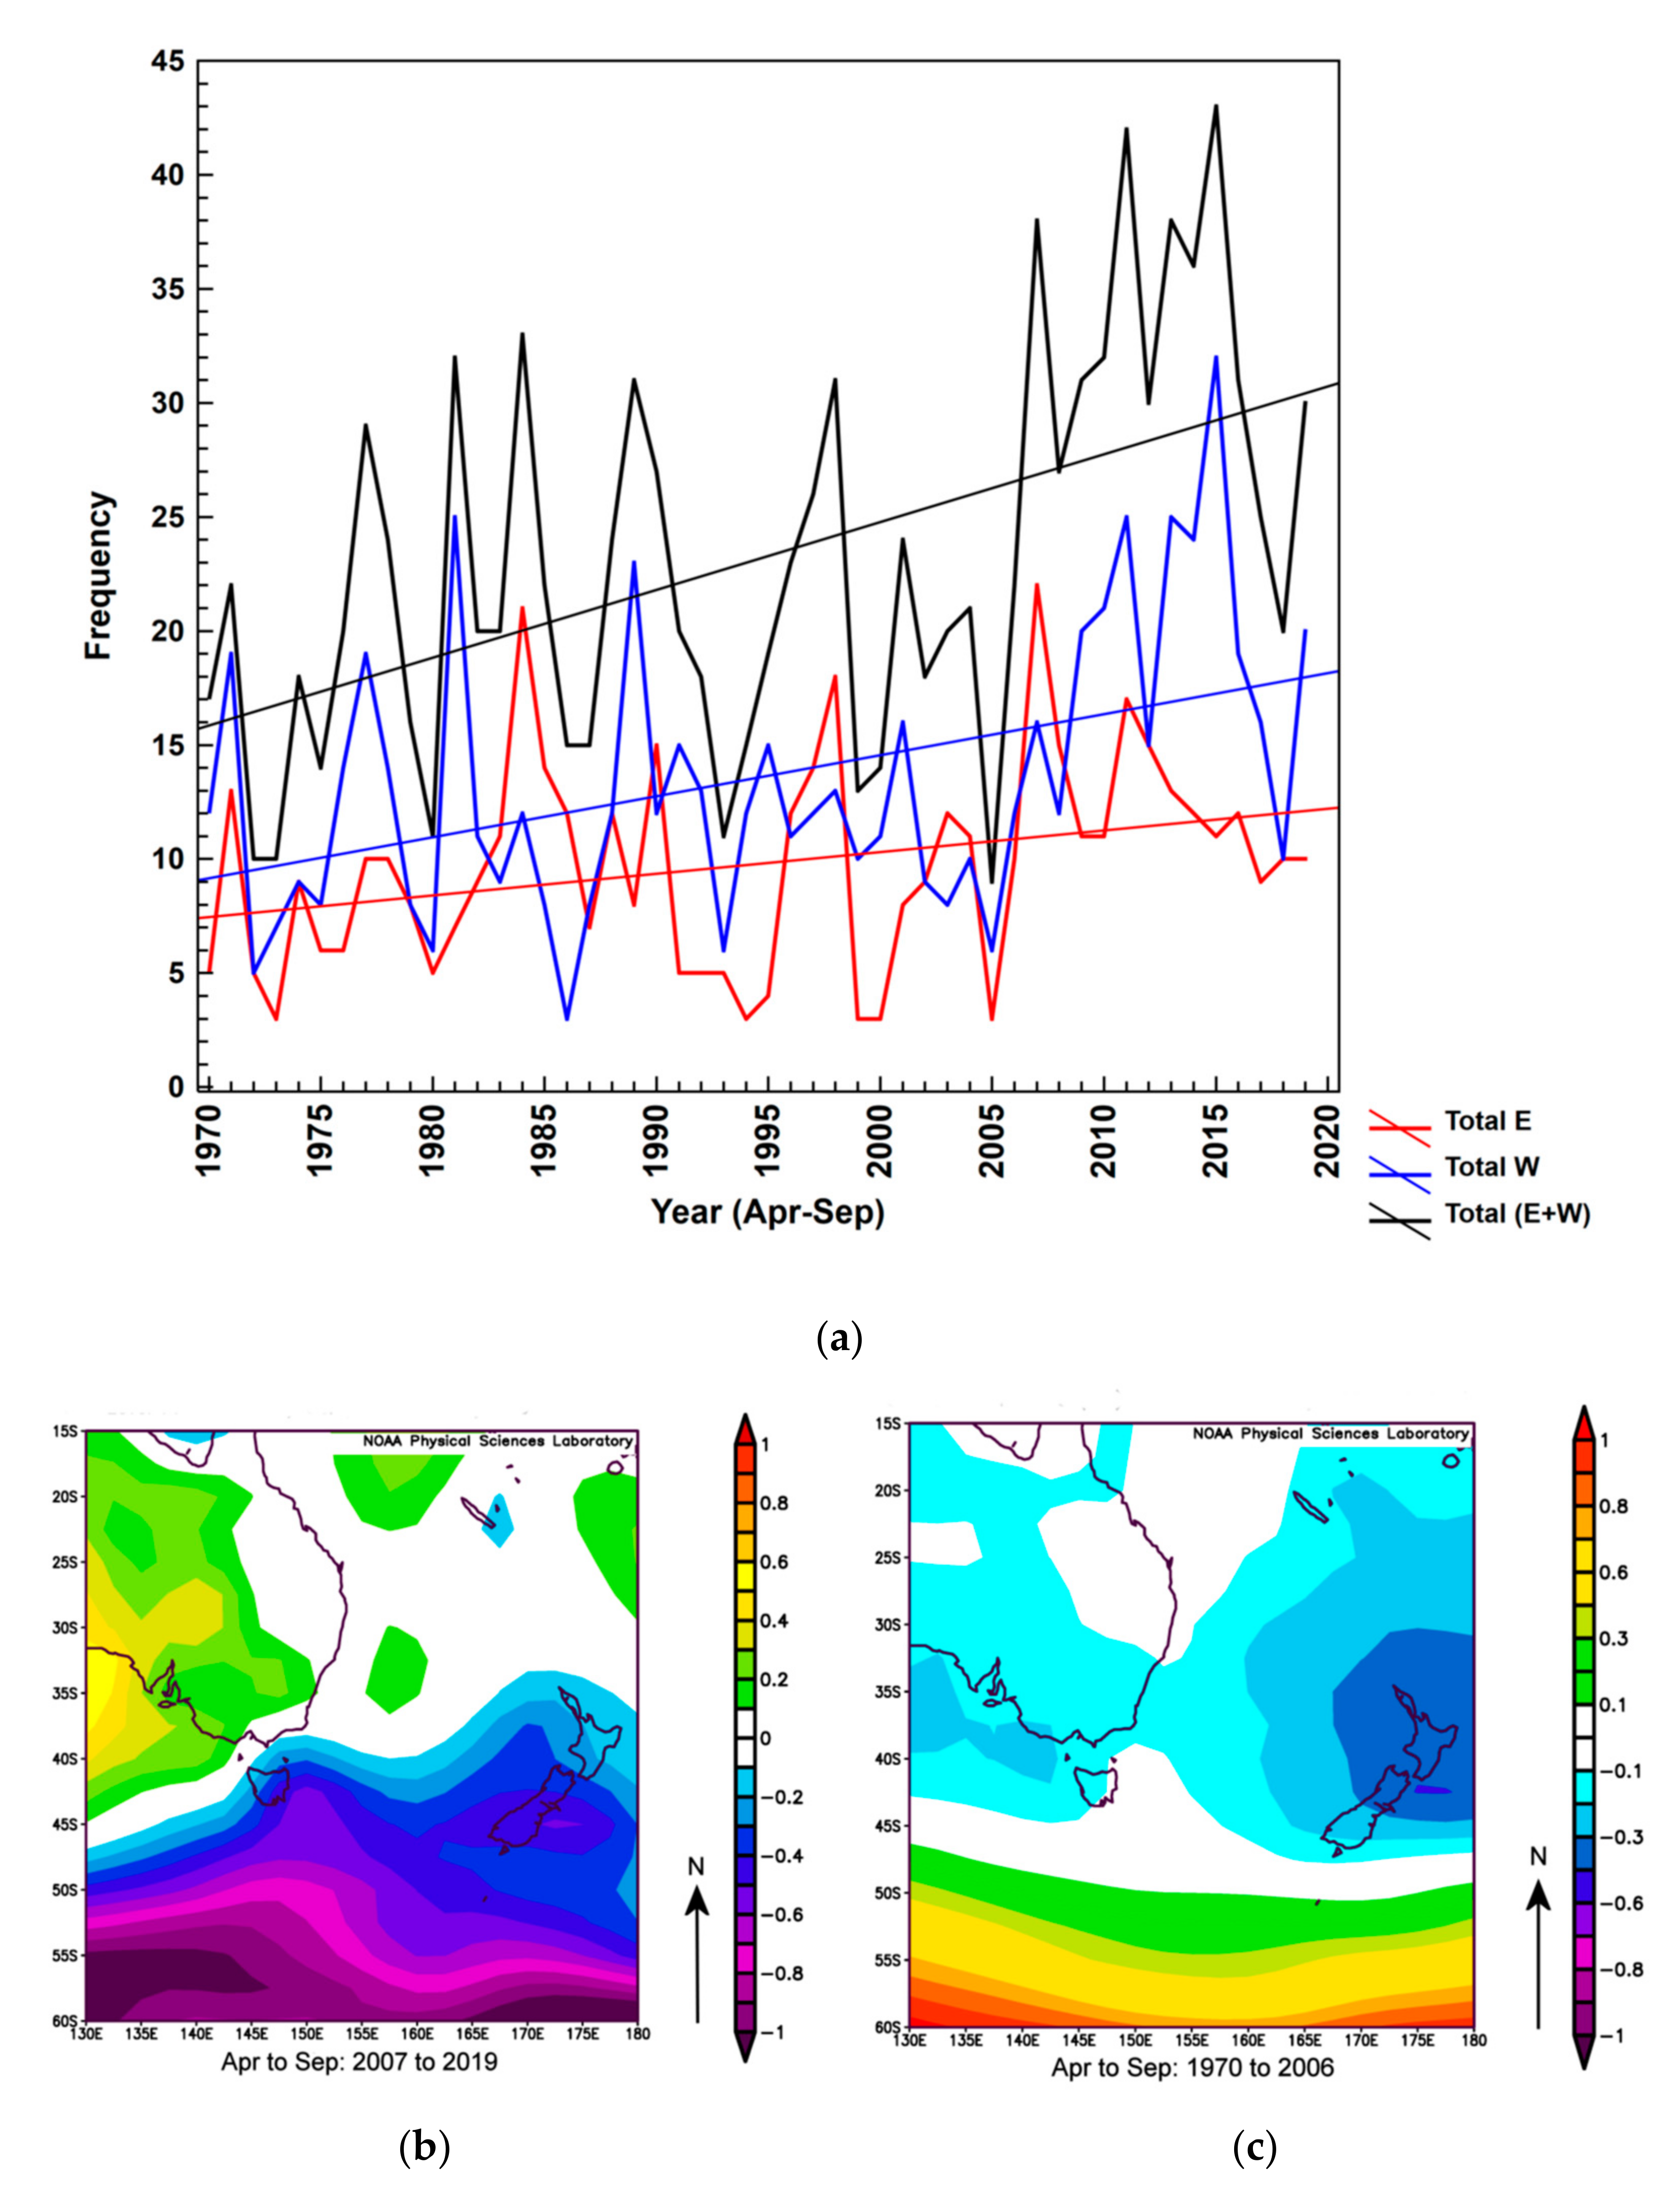
A consistent approach to that used for the 1970–2006 database was used to generate the database of MSLP frequencies from 2007–2019. The frequencies for Total ECLs (Total E+W), Total Easterlies (Total E) and Total Westerlies (Total W) for the updated database 1970–2019 are shown in Figure 2a. There appears to be an inconsistency of a large increase in Total ECLs (Total E+W) to 38 in 2007 (previous highest frequency 33 in 1984), owing to the large number (22) of Total E frequencies in 2007 (7 IT in April; 15 ET in June). The extremes in Total ECL frequencies in 2011 (42), 2013 (38) and 2015 (43) each resulted from an increase in the Westerly wind regime category (Total W) and arises from systems forming in the study region and persisting for several days, mostly with their central pressures located well east of the coast and in the south. This contrasts with the earlier period prior to 2007 when systems also formed further north and west towards the coast in the domain. This feature is supported by the NCEP/NCAR reanalysis which shows April–September MSLP anomalies 1970–2006 in the south of the region in comparison to much further north in the earlier period 1970–2006 (Figure 2b,c). The consistent approach in determining the frequencies for the whole database confirms that the MSLP anomalies do signify a change in atmospheric circulation characteristics from about 2007 rather than any change in methodology for the updated database from 2007. Changes in ECL development locations are discussed in Section 3.4. Next, the methodology for investigating the apparent increase in frequencies shown by the linear trends in Figure 2a is described in Section 2.2.
2.2. Methodology
The data generated were subject to the following assessments. First, the annual counts of the data were divided into the previously mentioned seven ECL categories: Total ECL days, Total ECL initial development days, Easterlies, Westerlies, Explosive ECLs, Explosive Easterlies and Explosive Westerlies. Each category was split into the two 25-year periods 1970–1994 and 1995–2019. Bootstrap resampling with 5000 resamples was applied to generate box and whisker plots of the resulting four pairs of time series, prior to performing permutation tests with replacement, on the means and variances of each pair, to obtain p-values for identifying statistically significant differences [22].
Second, the time series of mean duration an ECL event was present for: Total initial development days, Easterlies, Westerlies, Explosives, Explosive Easterlies and Explosives Westerlies, were similarly assessed for significance using the permutation test.
Third, the annual counts for mean development latitude and longitude for: -Total, Easterlies, Westerlies, Explosives, Explosive Easterlies and Explosive Westerlies were assessed for statistical significance using the permutation test.
Fourth, the mean development central pressure and lowest mean central pressure for Total days, Easterlies, Westerlies, Explosives, Explosive Easterlies and Explosive Westerlies were assessed for statistical significance using the permutation test.
Finally, the spatial data (latitudes and longitudes) of the seven ECL categories and two time periods were contour plotted using a point density estimate (PDE) technique available in the R statistical package [25]. This technique is similar to kernel density estimates (KDEs) and enables identification and statistical significance testing of the mean locations of the centers, and of changes in the formation locations of the ECLs.
3. Results
3.1. Frequency Trends of ECLs: April–September 1970–1994 to 1995–2019
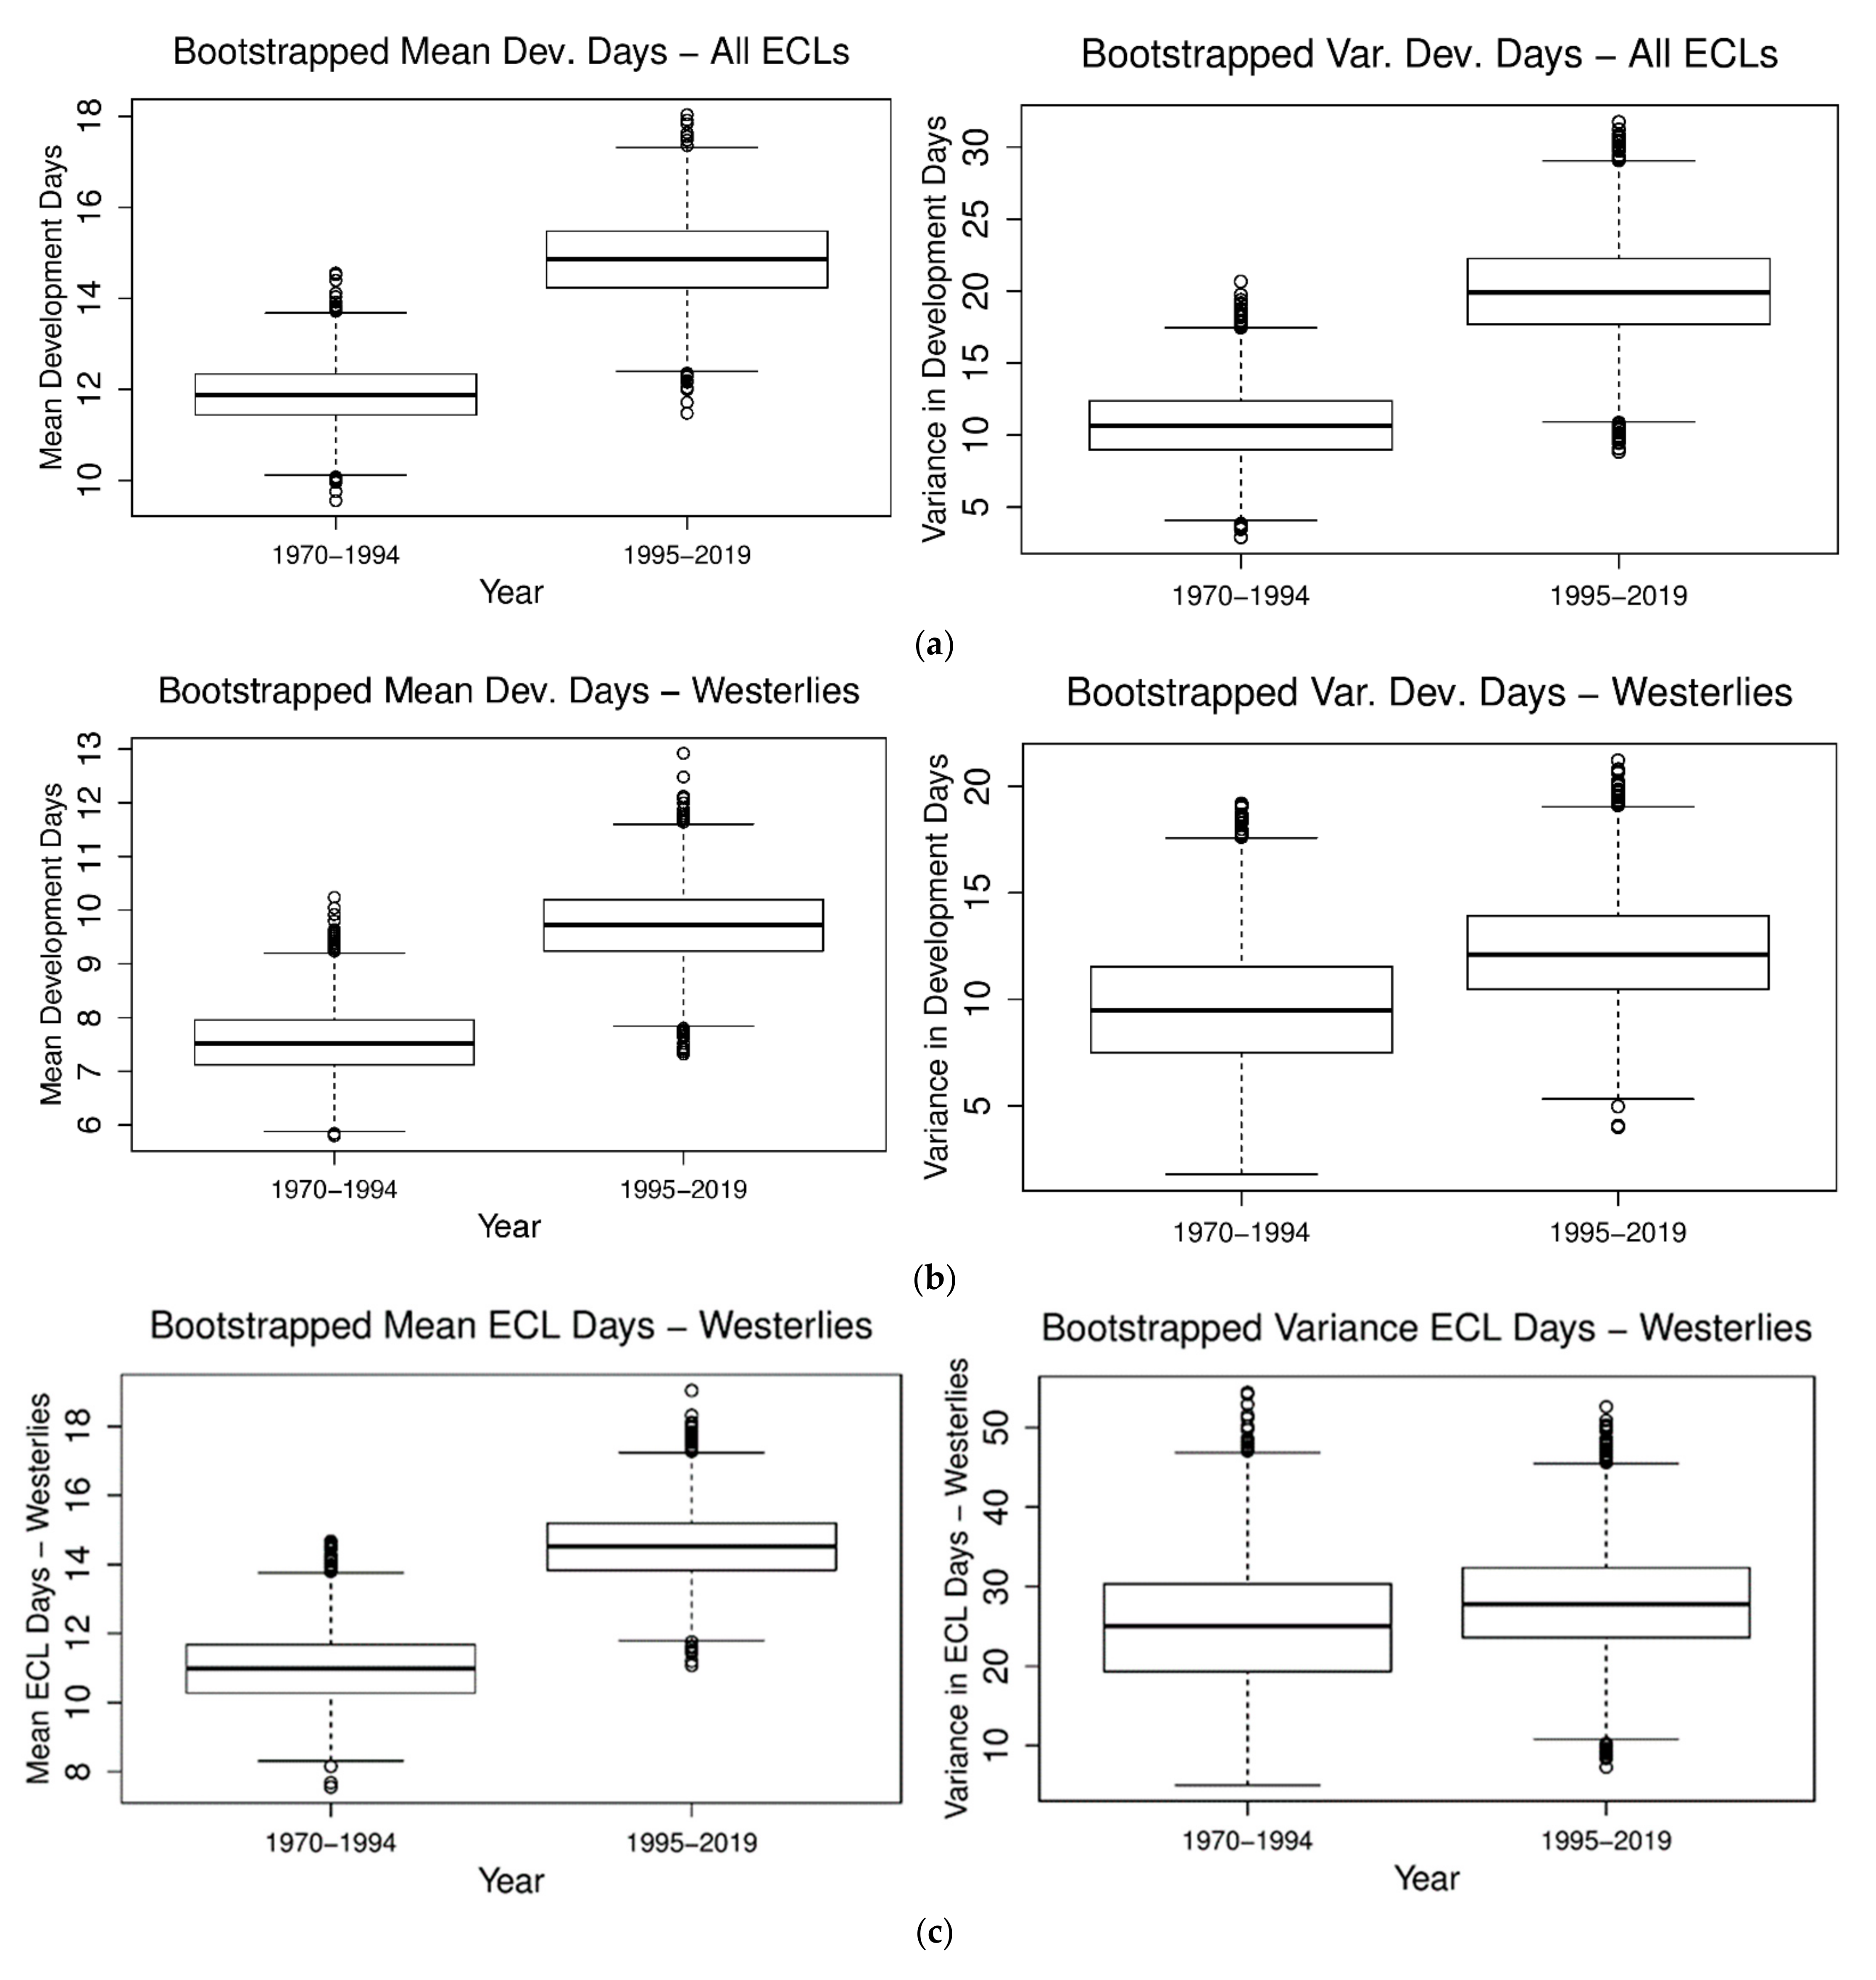
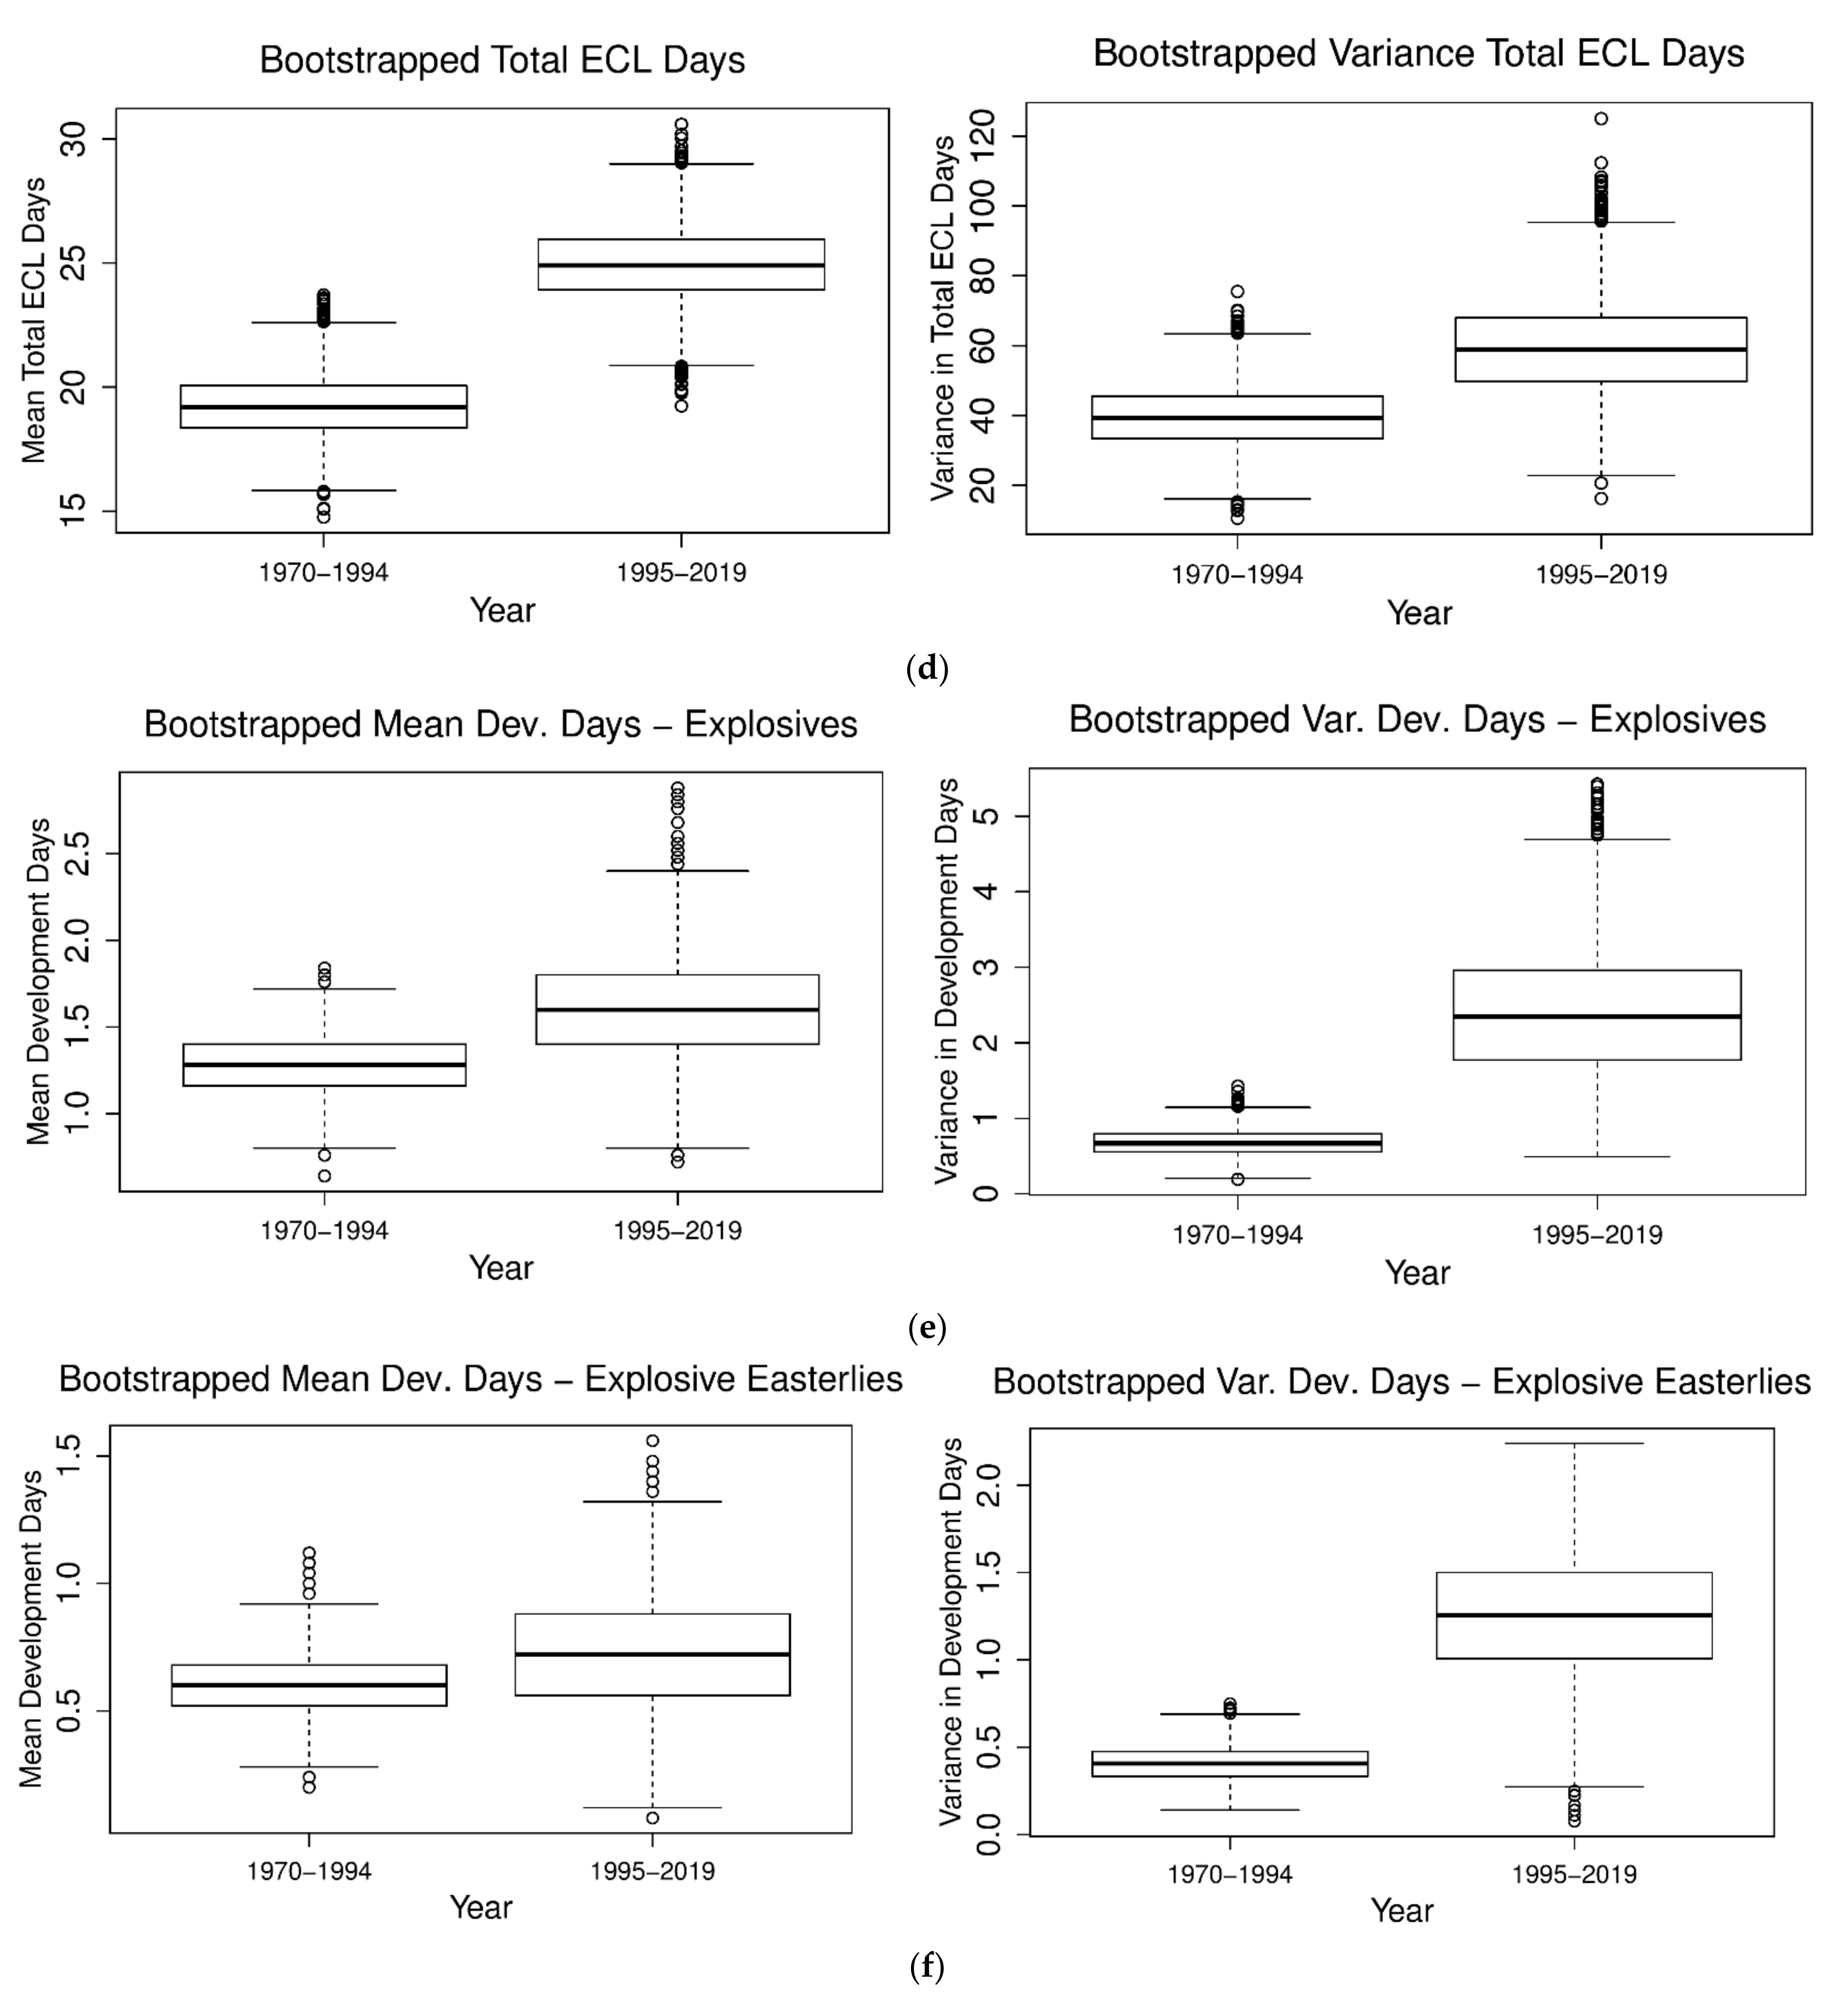
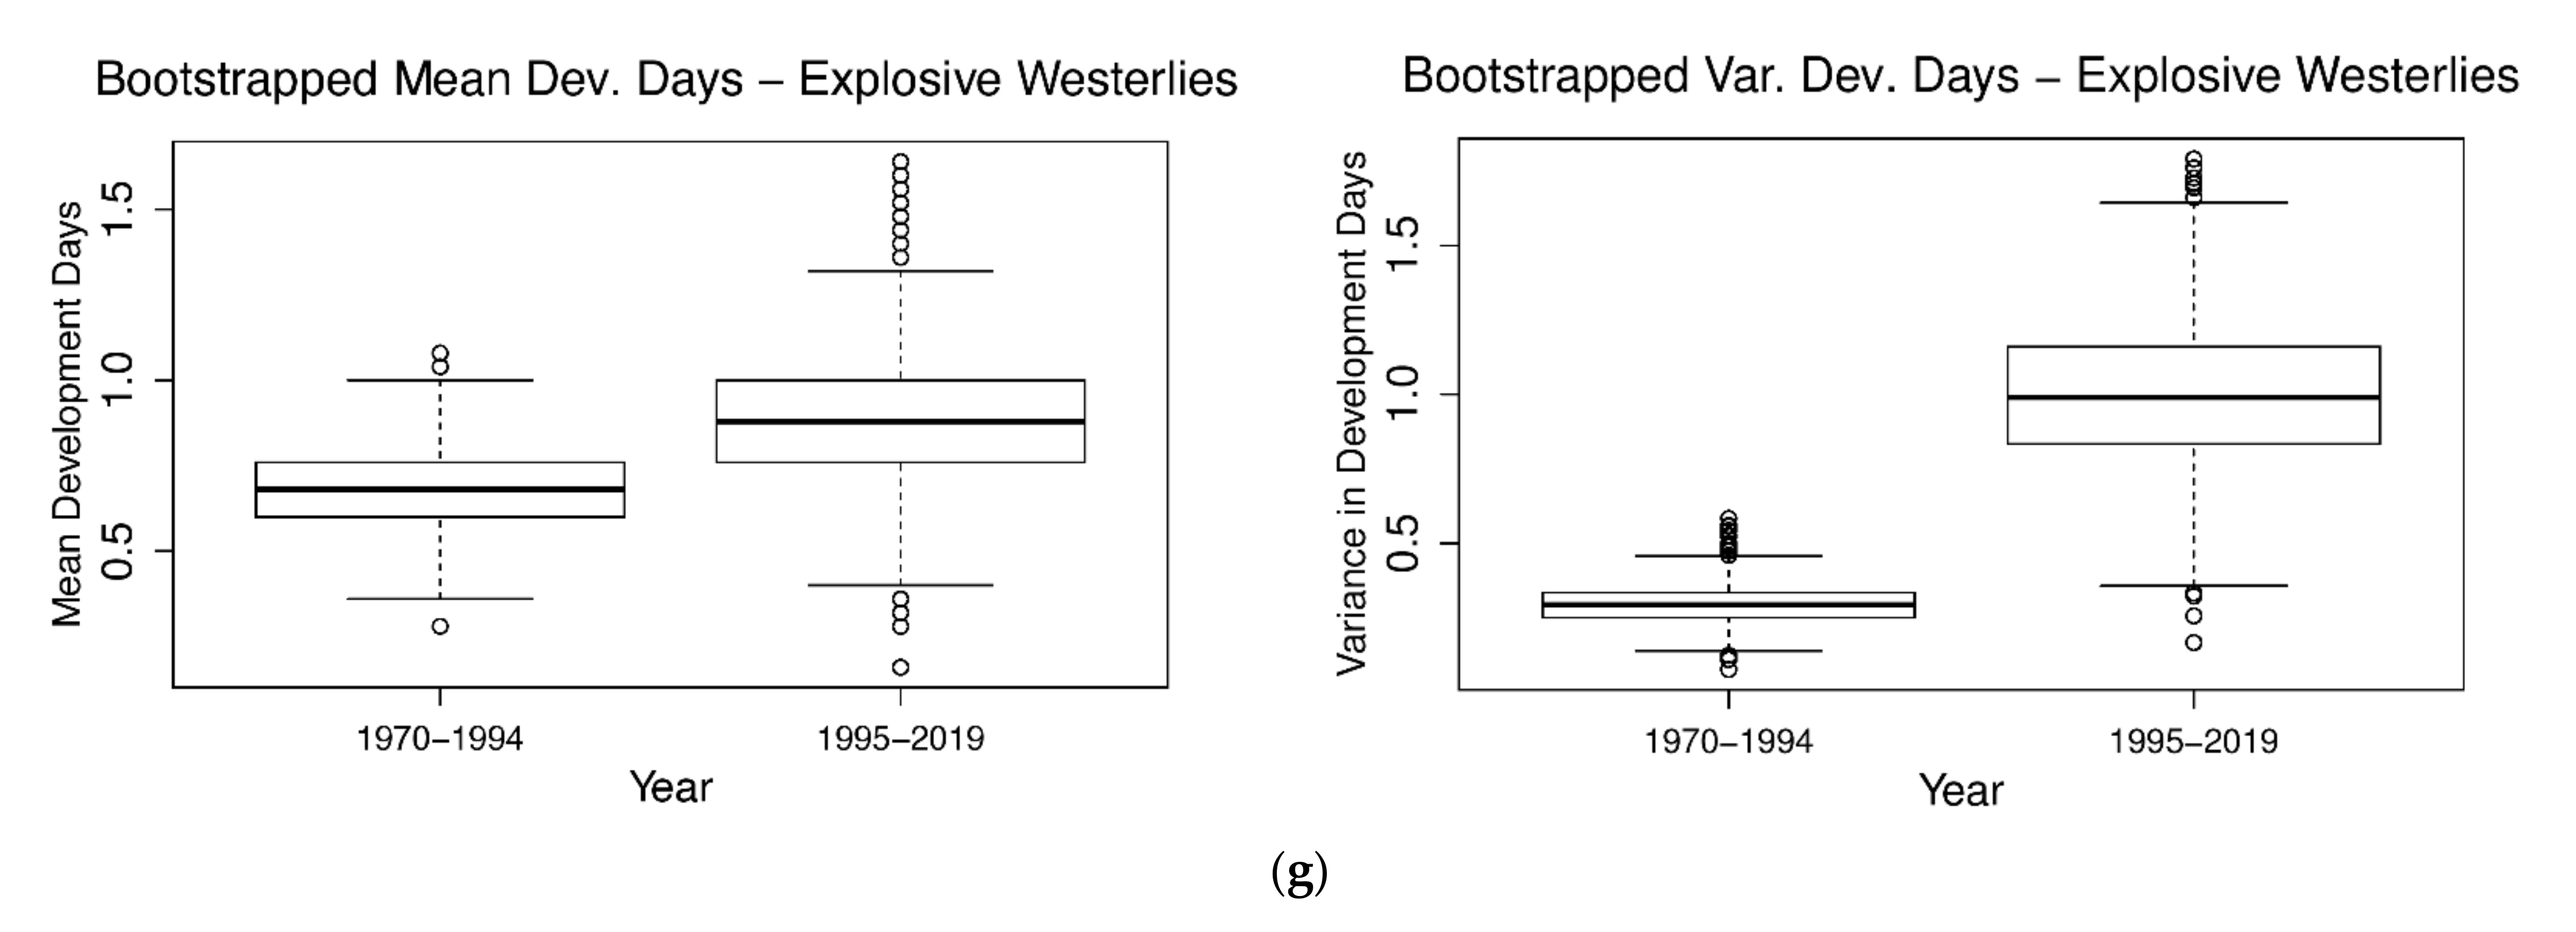
For the ECL total initial development days, total development westerlies, total westerlies and the total ECL days there has been a statistically significant increase in their means (p-values = 0.0142, 0.0344, 0.0218, 0.0054, respectively, Table 1; Figure 3a–d, respectively) between the periods 1970–1994 and 1995–2019, while the variance of total initial development days was significantly larger (p = 0.028, Table 1; Figure 3a). The mean frequency of the category of Total development Explosive ECLs did not change significantly between the two periods. However, its variance was significantly larger (p = 0.0092, Table 1; Figure 3e), as were the variances of Explosive Easterlies (p = 0.0278, Table 1; Figure 3f) and Explosive Westerlies (p = 0.0006, Table 1; Figure 3g). Turning to the duration of the event groups above, there were none that were significantly different in duration between the two periods. The box and whisker plots of non-significant means and variances in Table 1 are not shown.
3.2. Latitude and Longitude Trends of ECLs: April–September 1970–1994 to 1995–2019
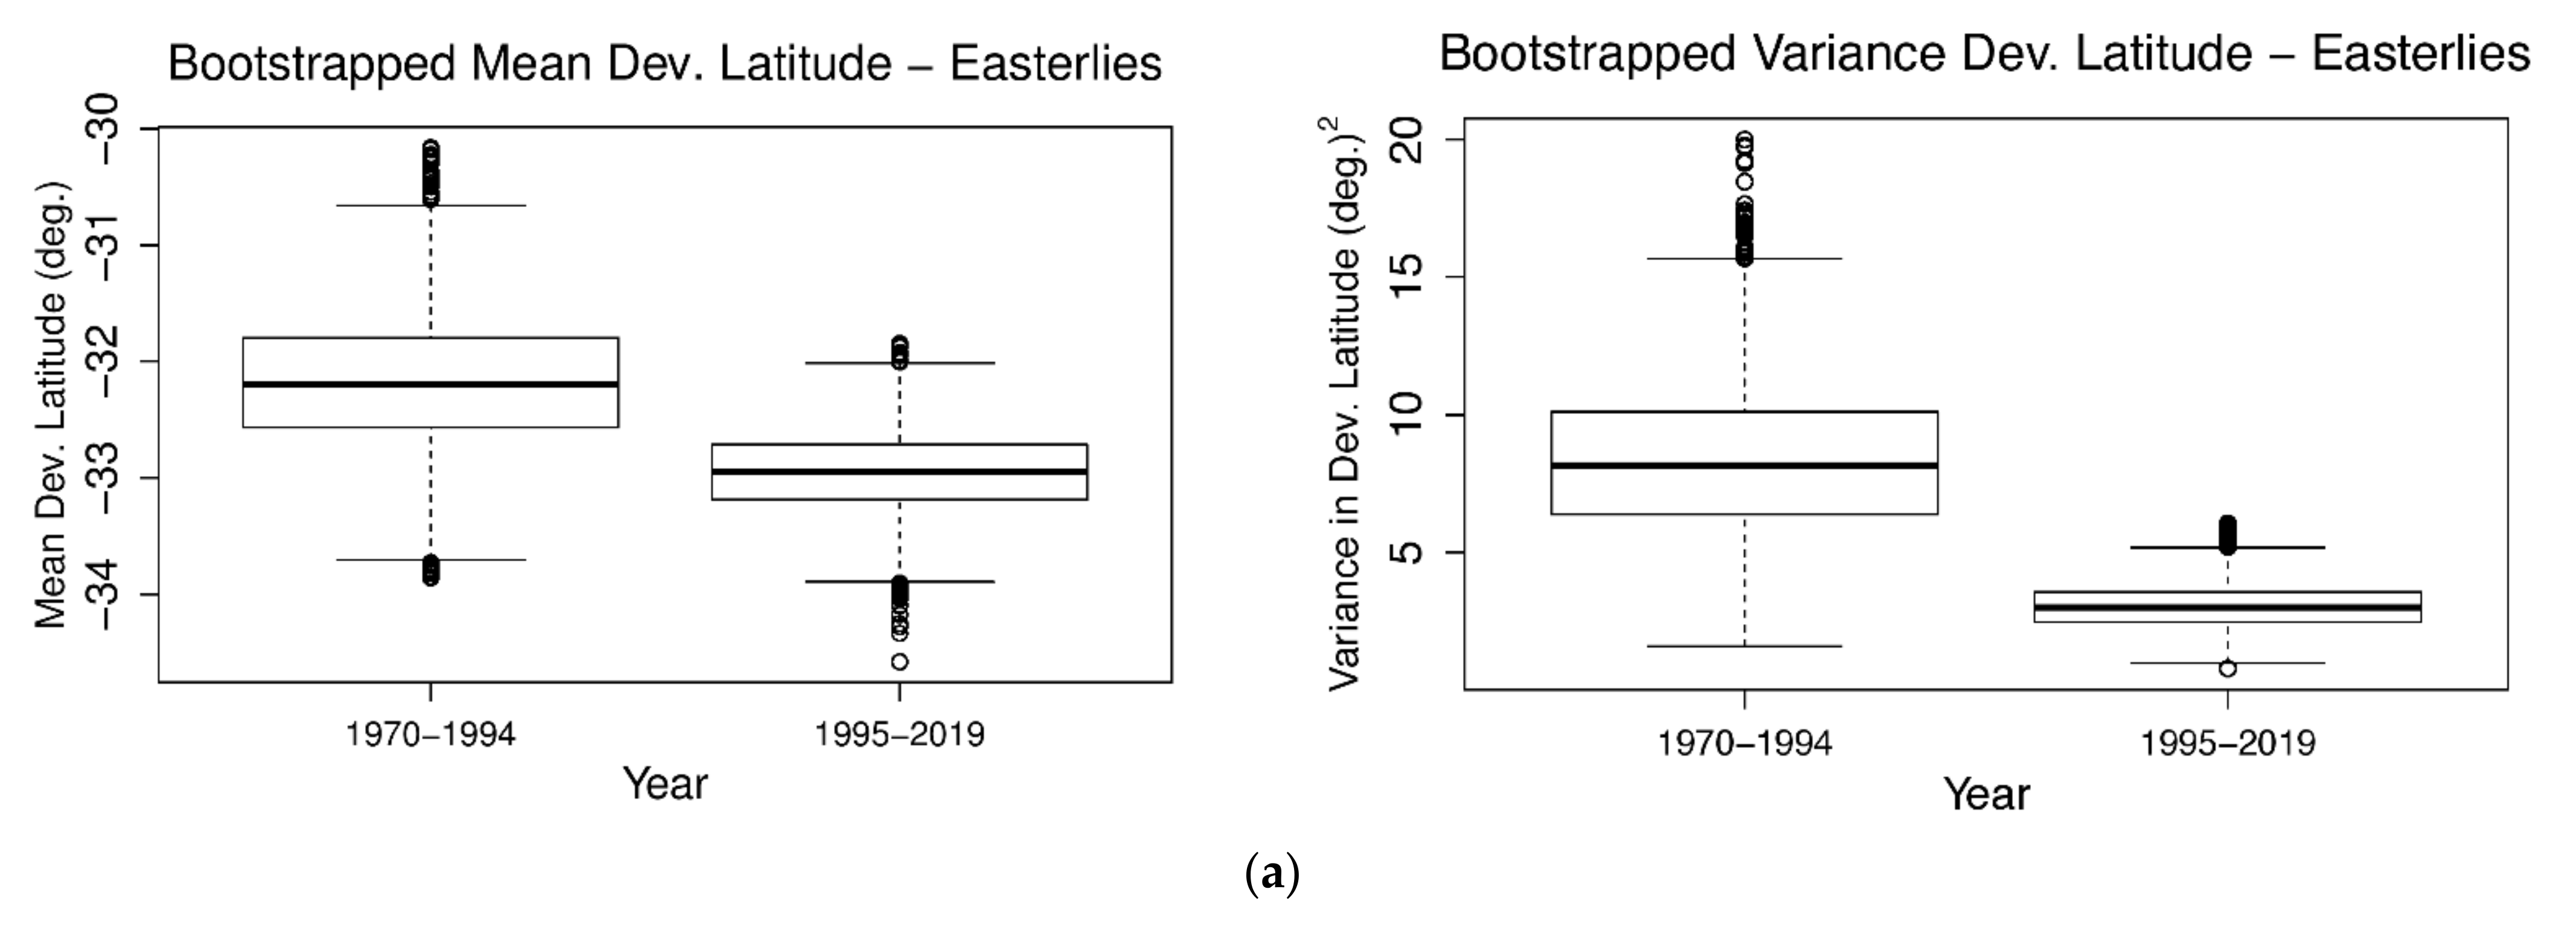
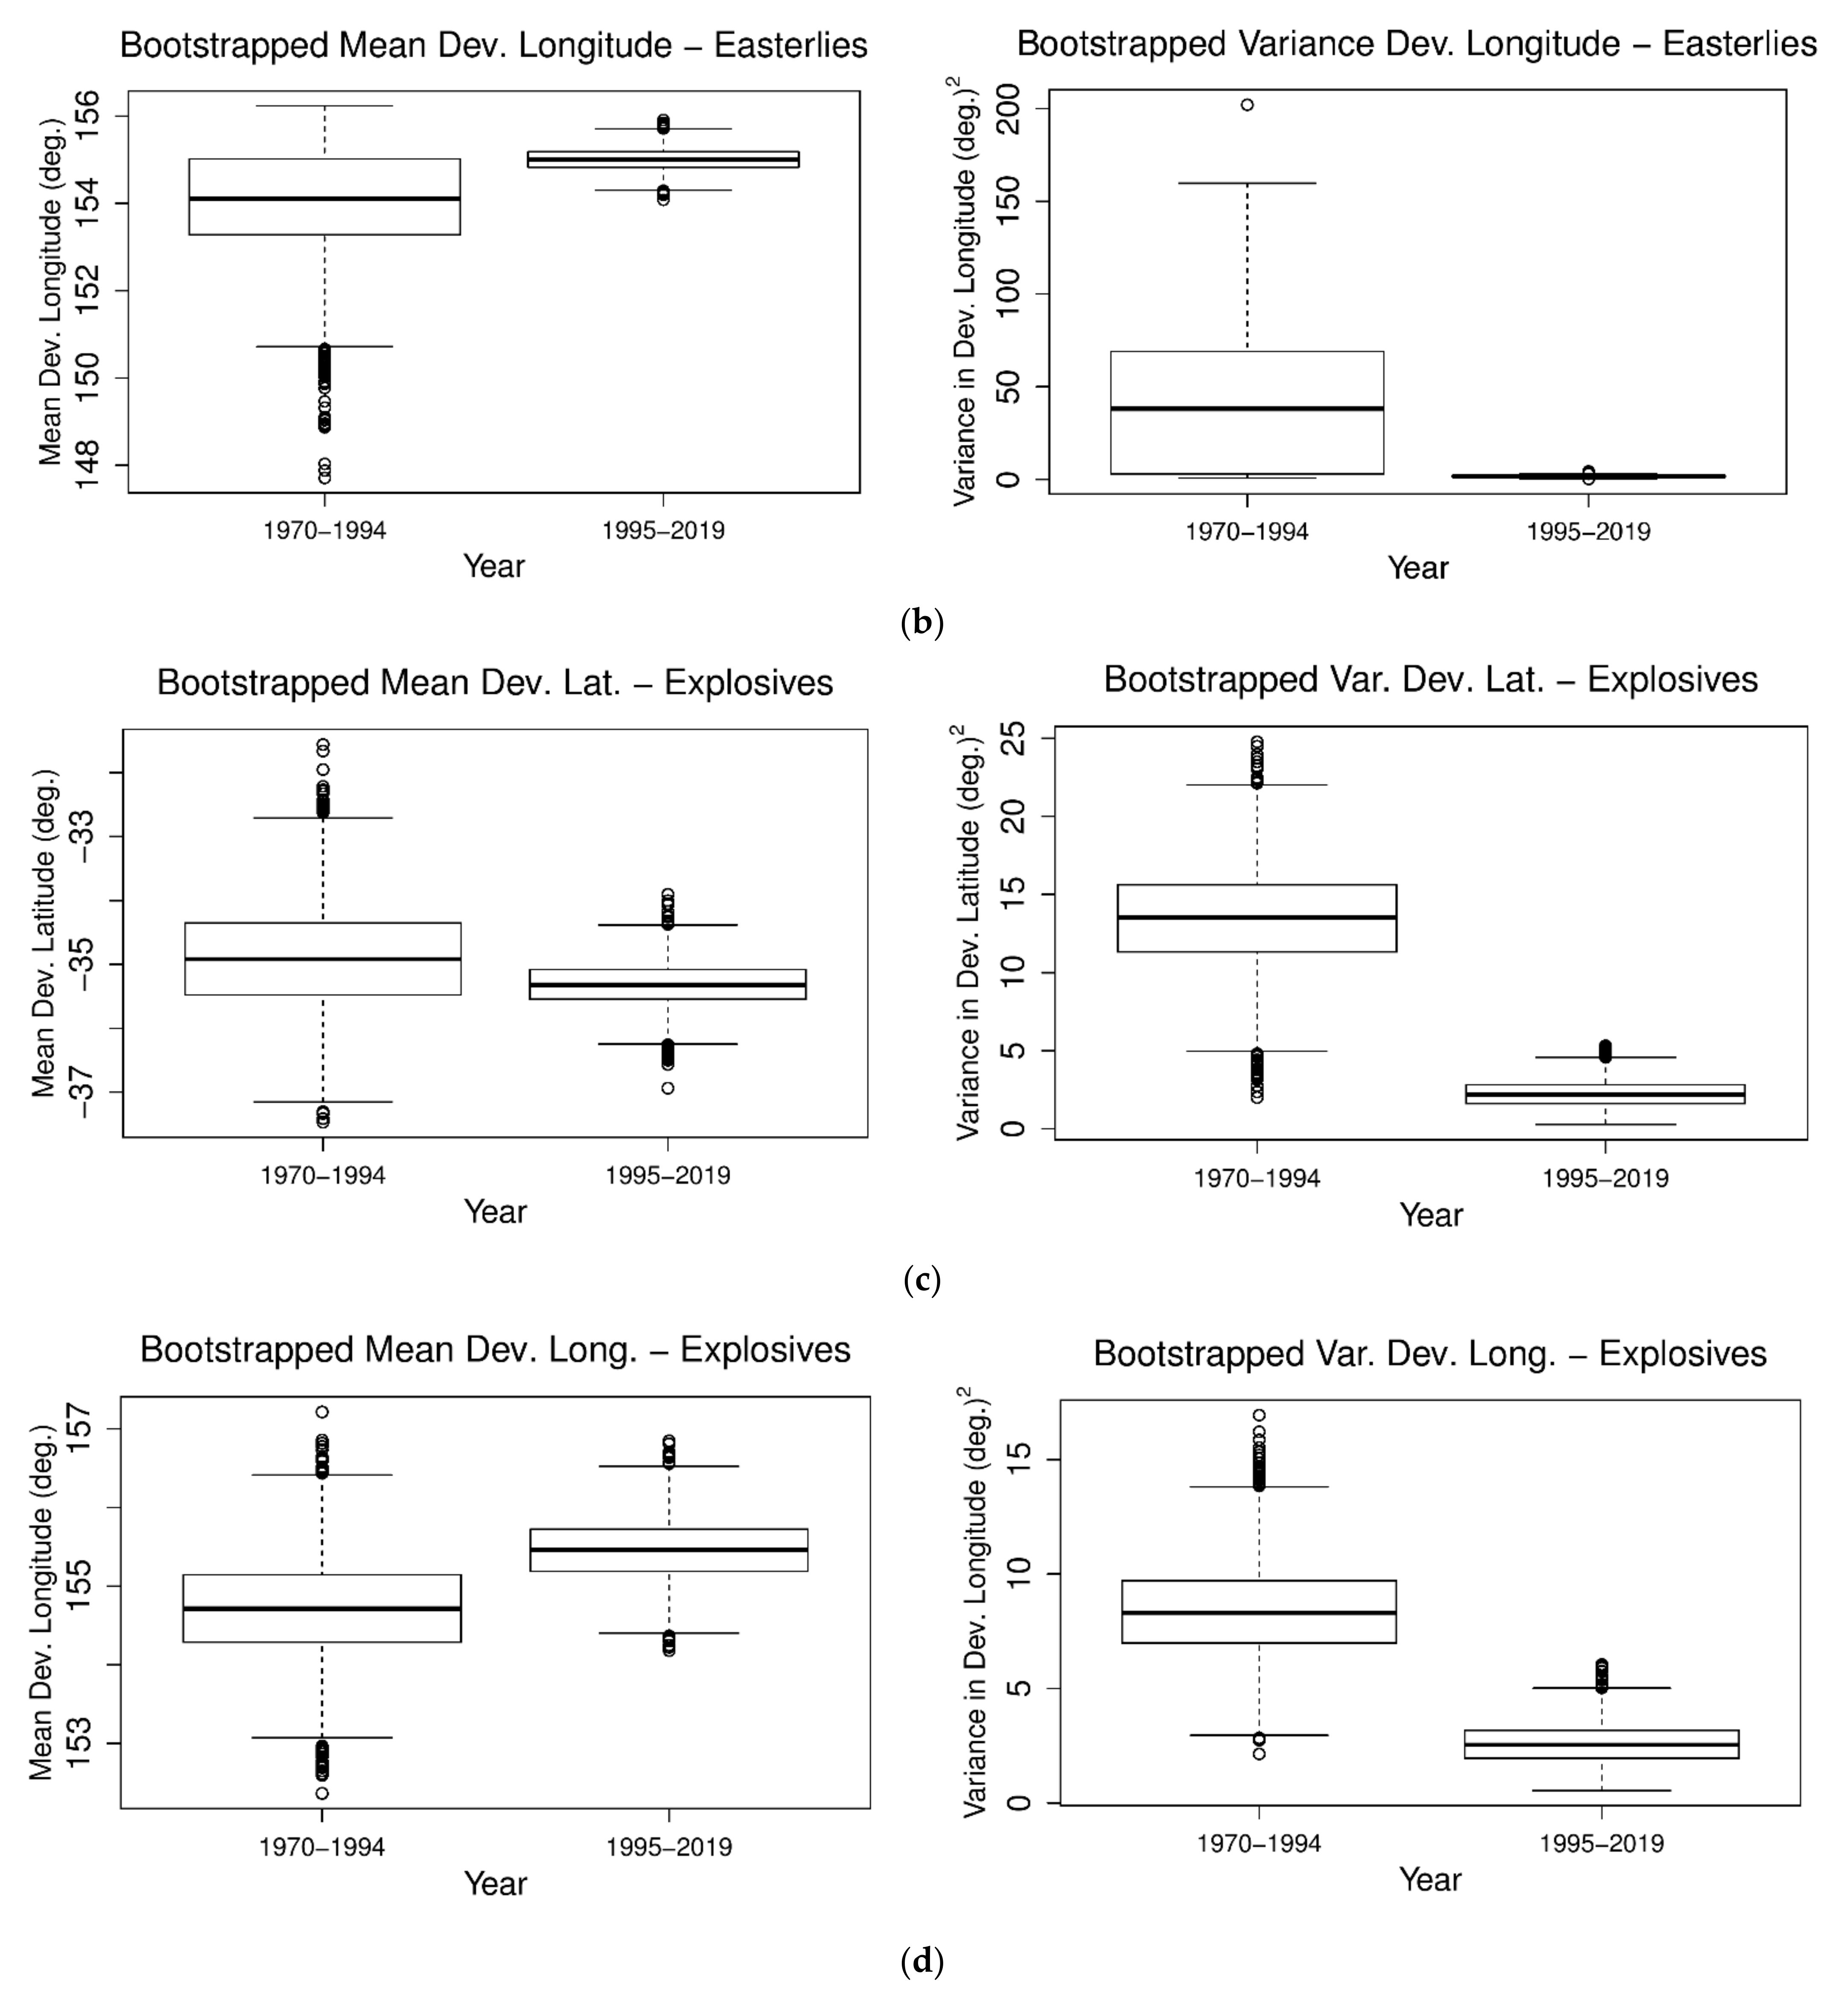
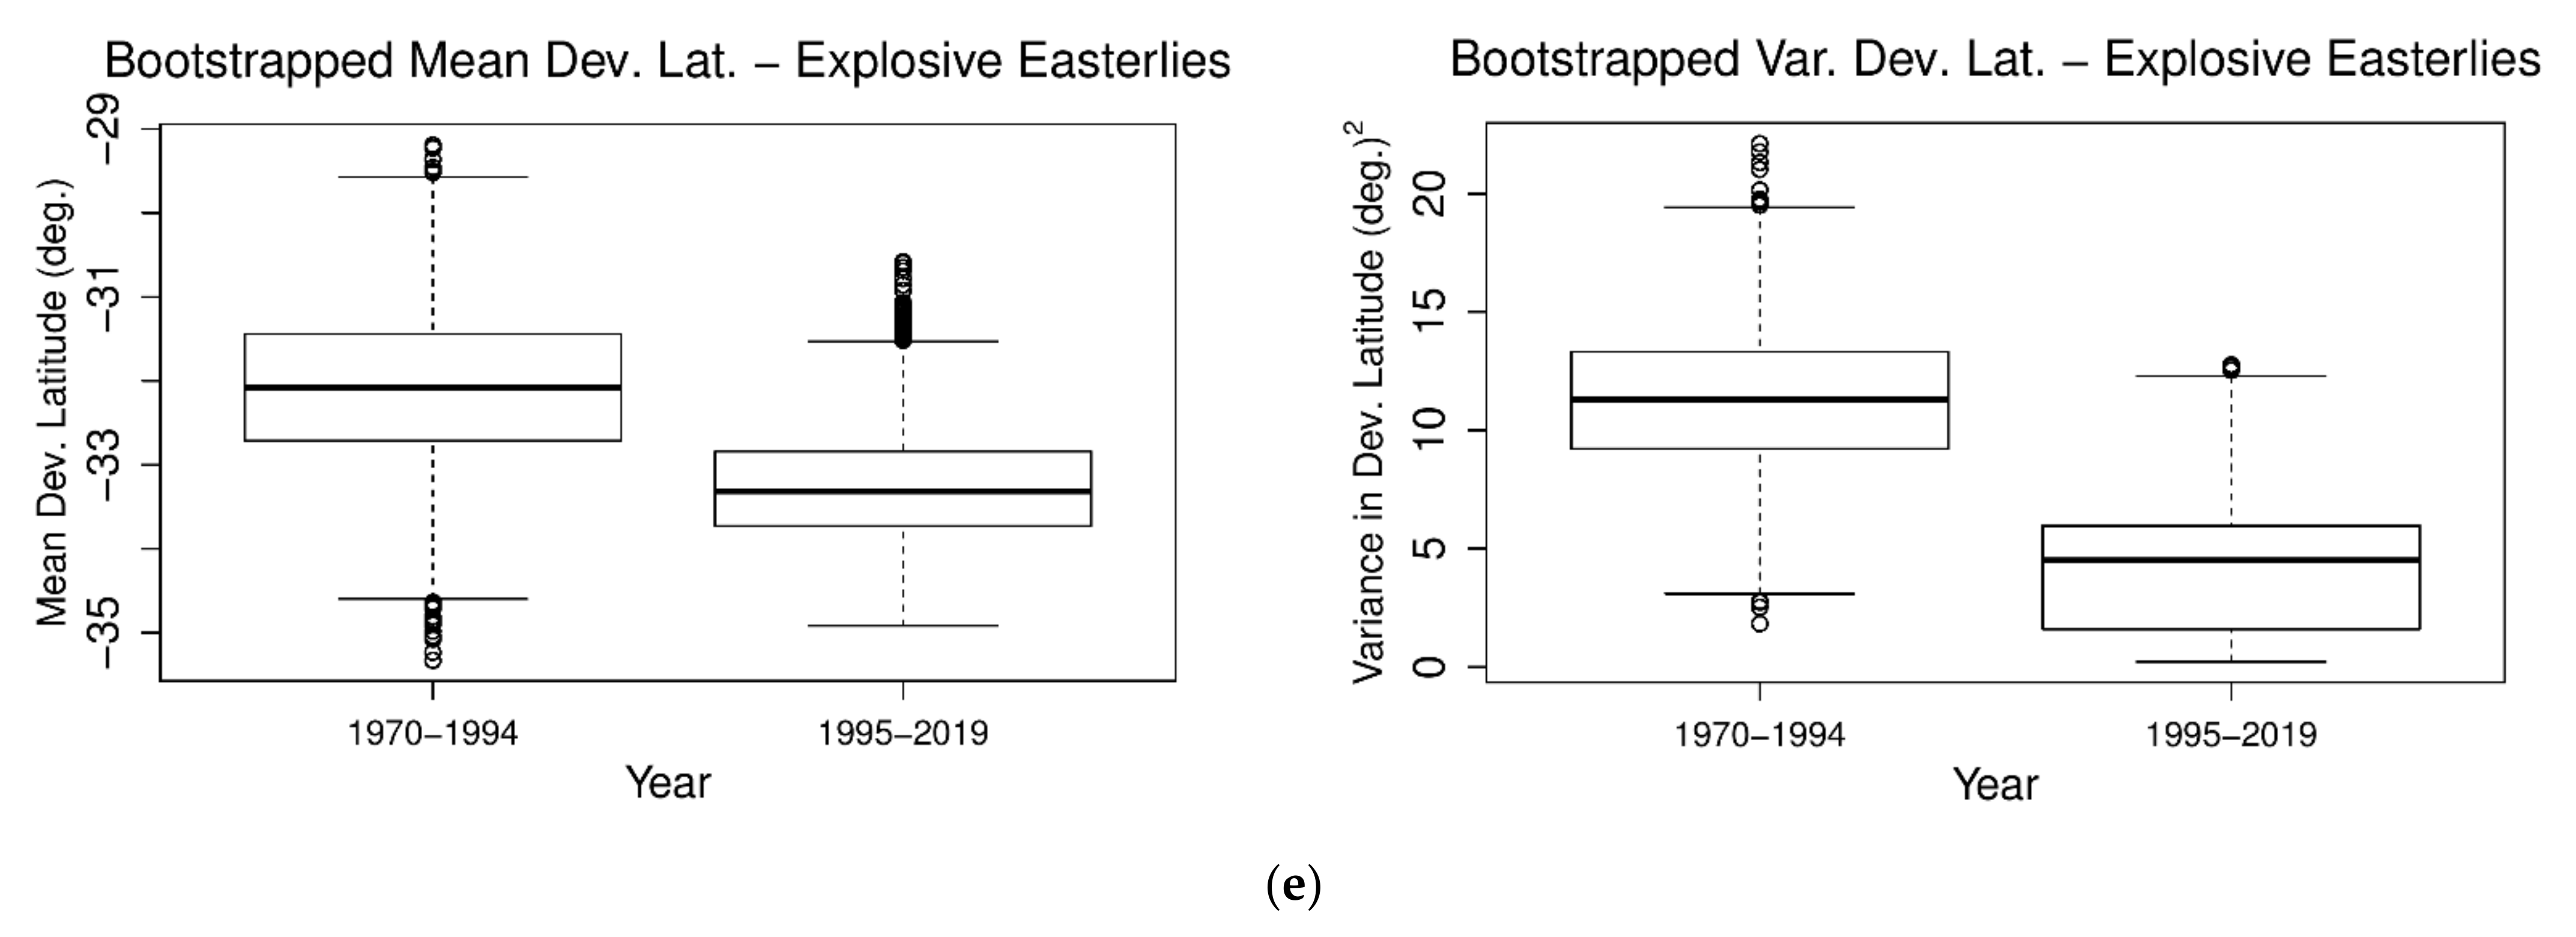
Most p-values for latitude and longitude of the mean and variance of the categories in Table 1 are not significant at either the 95th or 90th percentiles (p-values = 0.05 or 0.10), except that the mean development latitude and longitude values for Easterlies have significantly smaller variances (p = 0.0704 and 0.0462, respectively; Figure 4a,b, respectively) The variances for both latitude and longitude of Total Explosives are also significantly smaller (p = 0.0002 and 0.013, respectively; Figure 4c,d, respectively). The variance of mean development latitude of Ex-plosive Easterlies is also significant (p = 0.0966; Figure 4e). Discussion of the significance of the above position trends follows in Section 4. The box and whisker plots of non-significant means and/or variances of the latitude and longitude categories are not shown.
3.3. Central Pressure Trends of ECLs: April–September 1970–1994 to 1995–2019
3.3.1. Mean Development Pressure
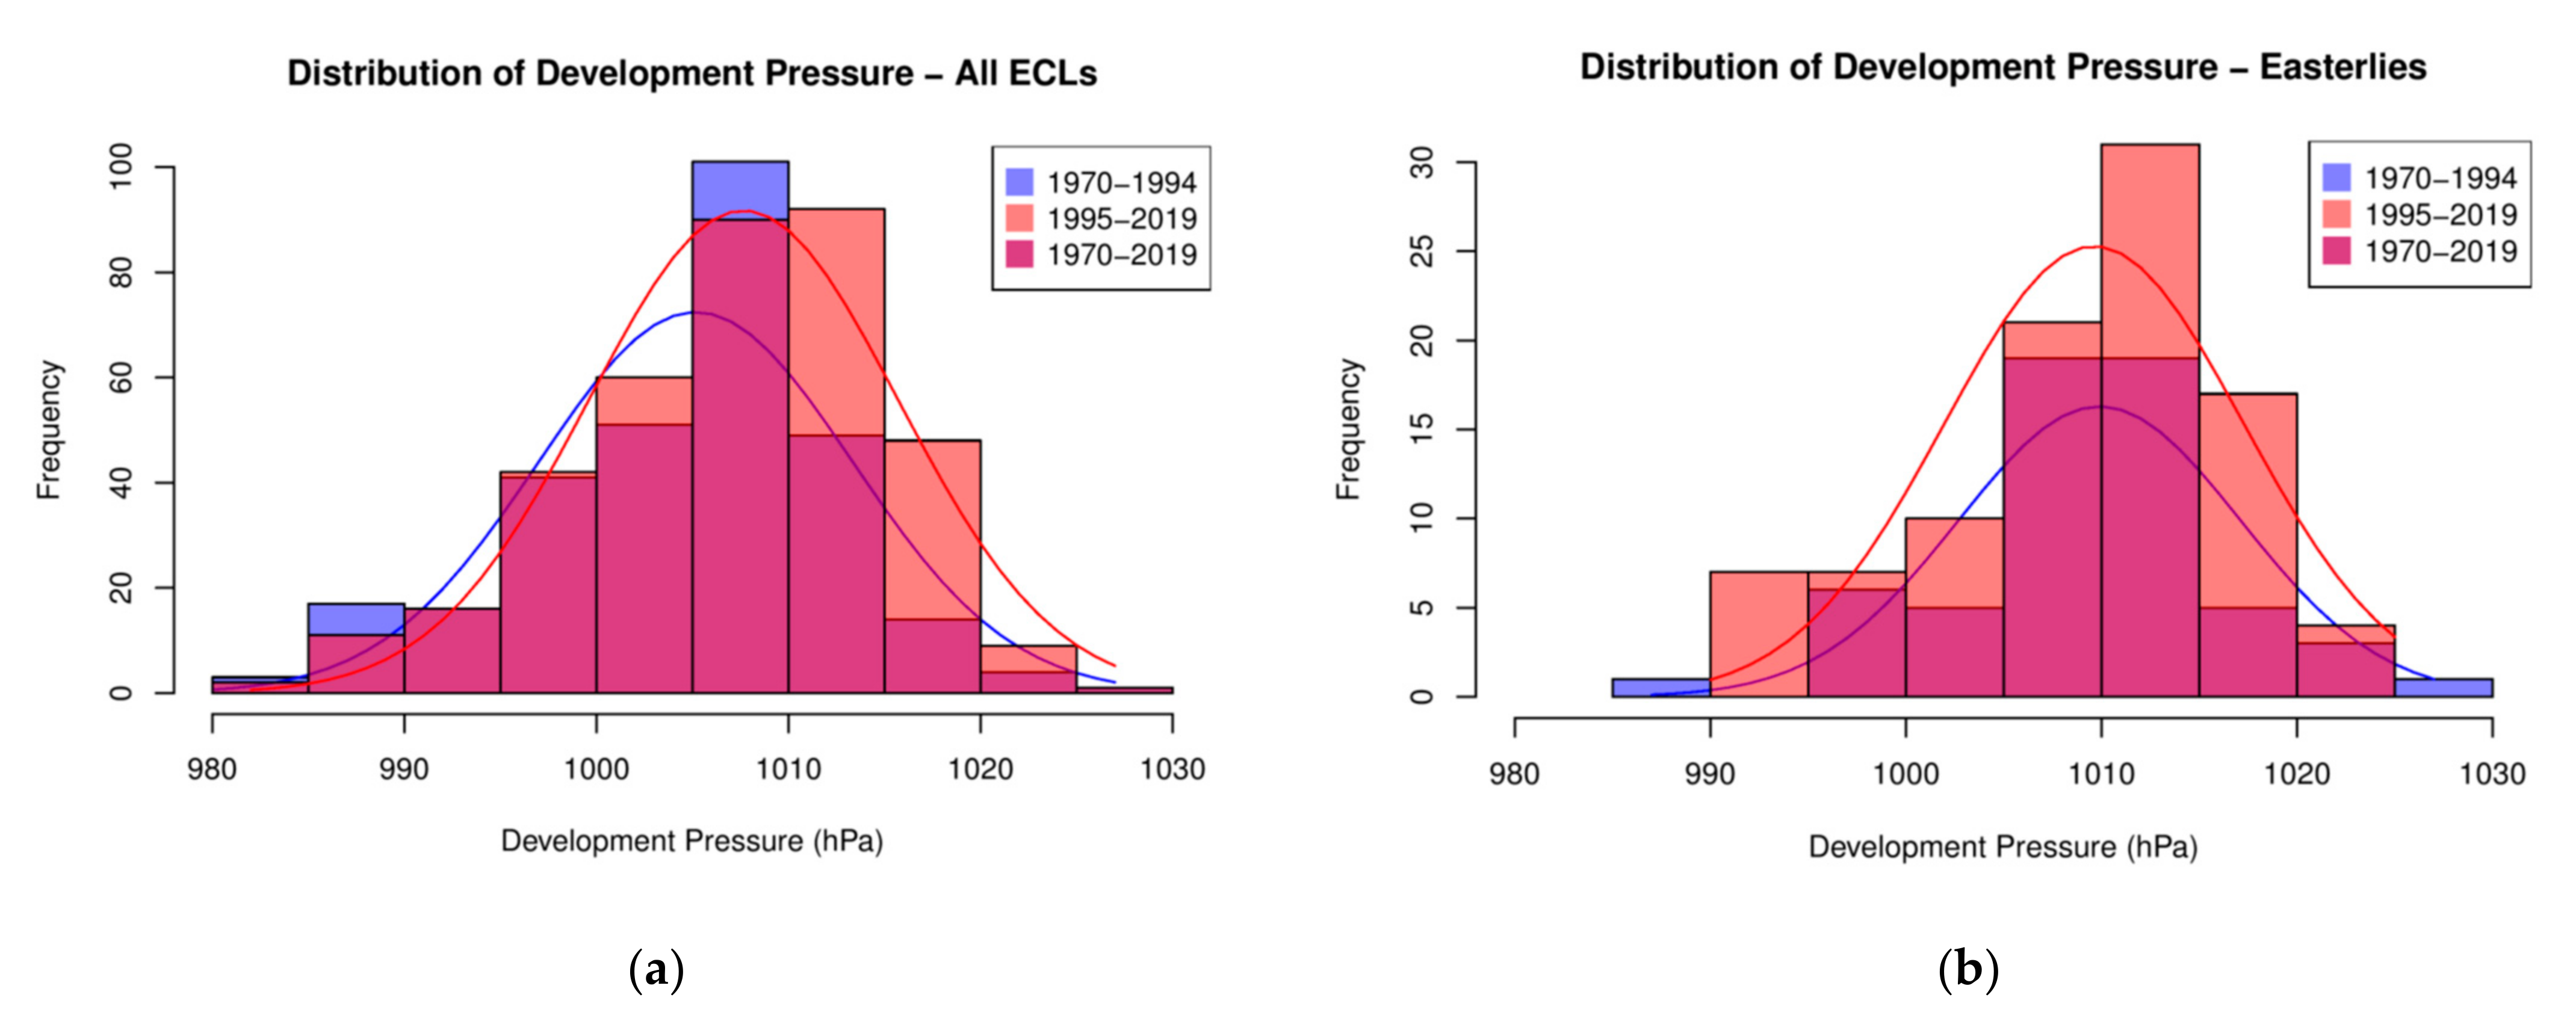
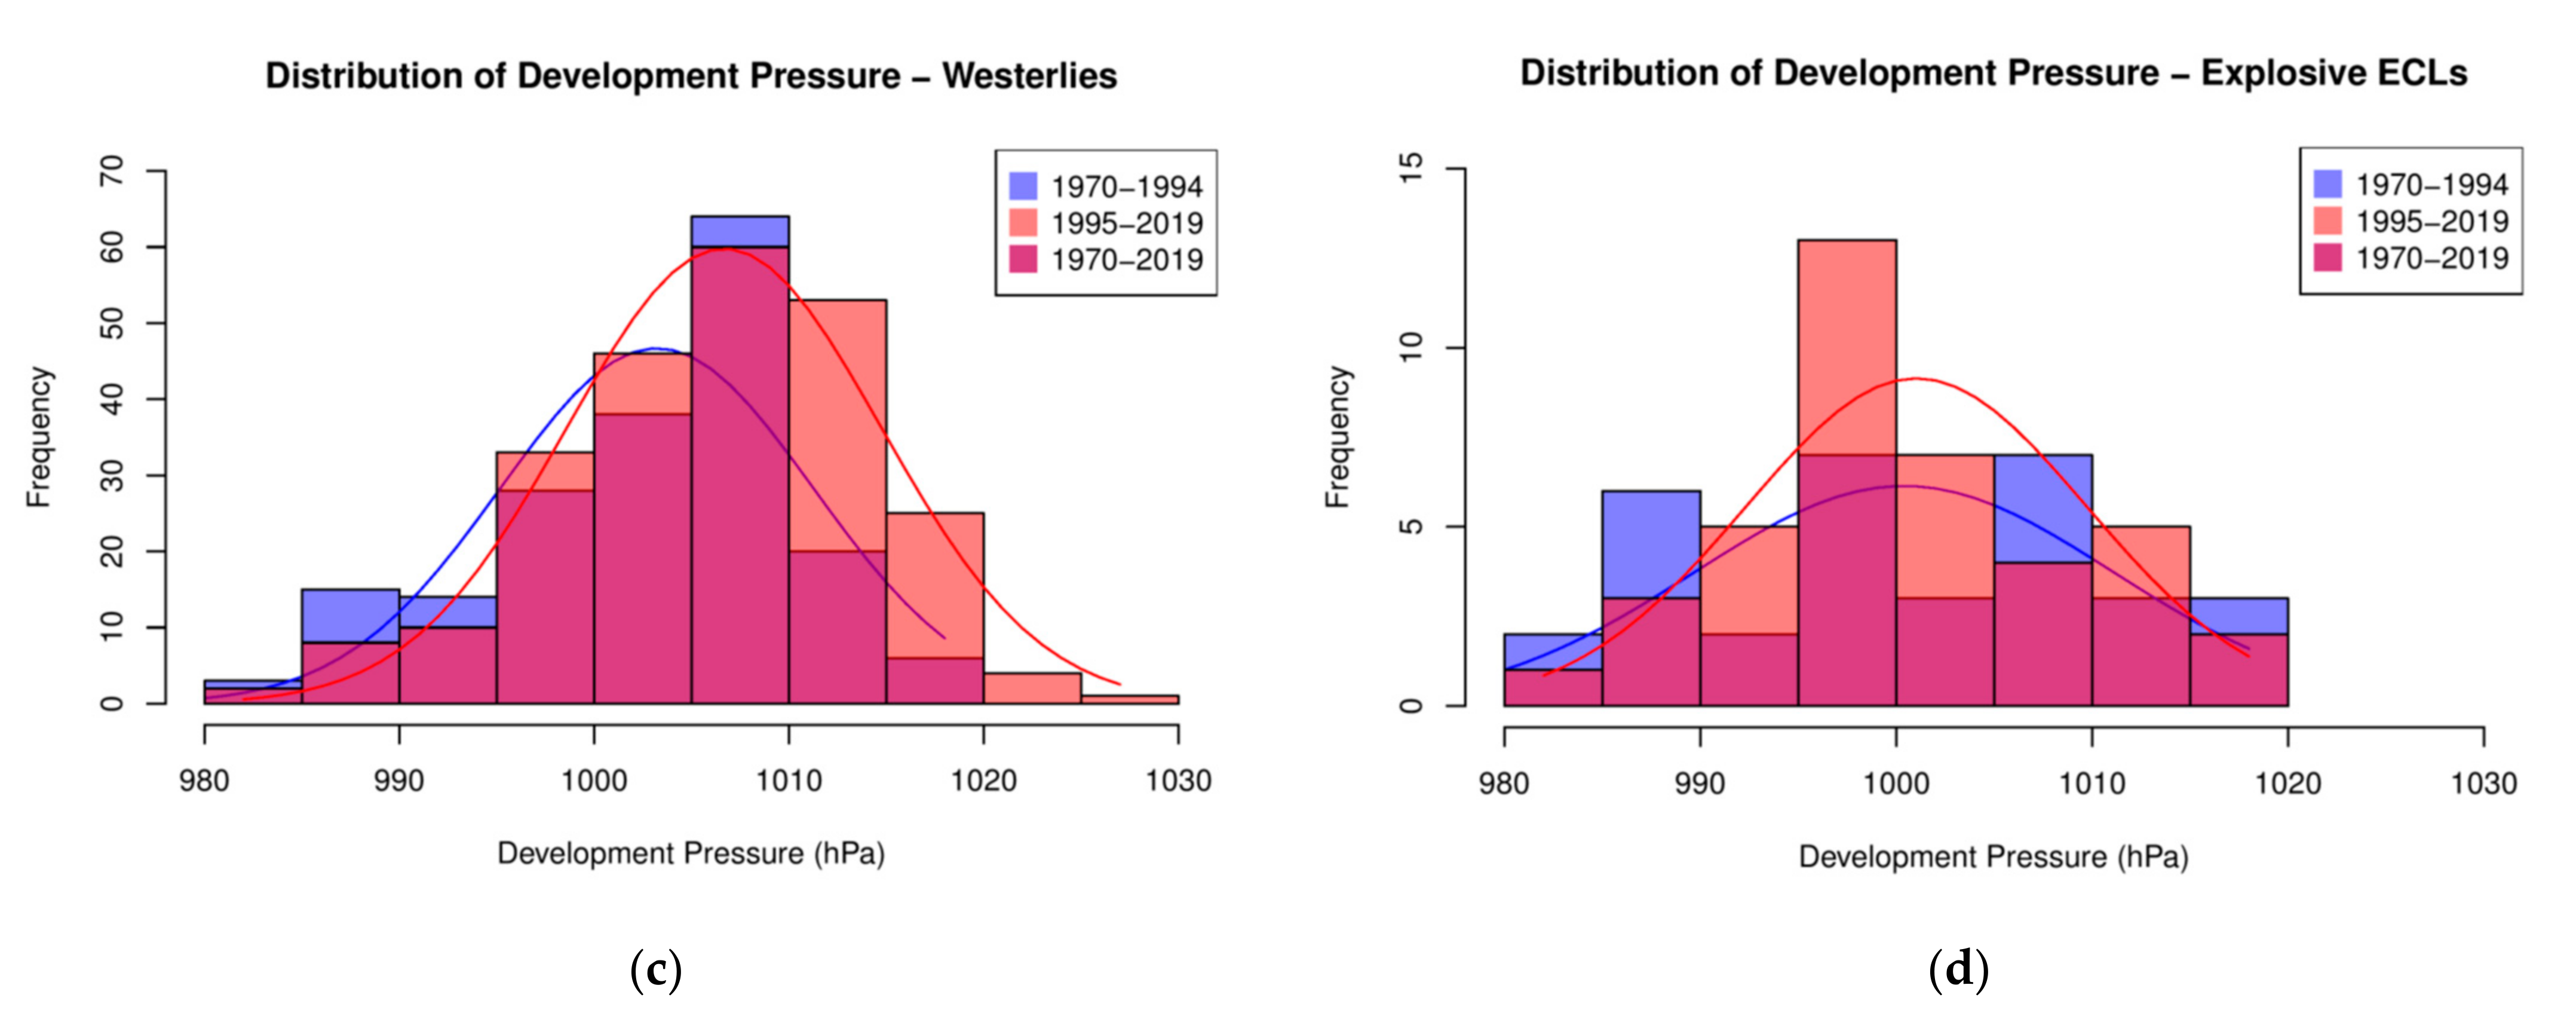
The histogram plots of the distributions of development mean central pressure for ECLs, Easterlies, Westerlies, and Explosives, are shown in Figure 5a–d. There is a significant increase in development mean central pressure of ECLs (p-value = 0.0016; Figure 5a) and Westerlies (p-value = 0.0002; Figure 5b). However, there is no statistical significance between the two periods (i.e., no p-values are ≤0.10; Table 1) for the other two categories, Easterlies (Figure 5b) or Explosives (Figure 5d).
3.3.2. Mean Lowest Pressure
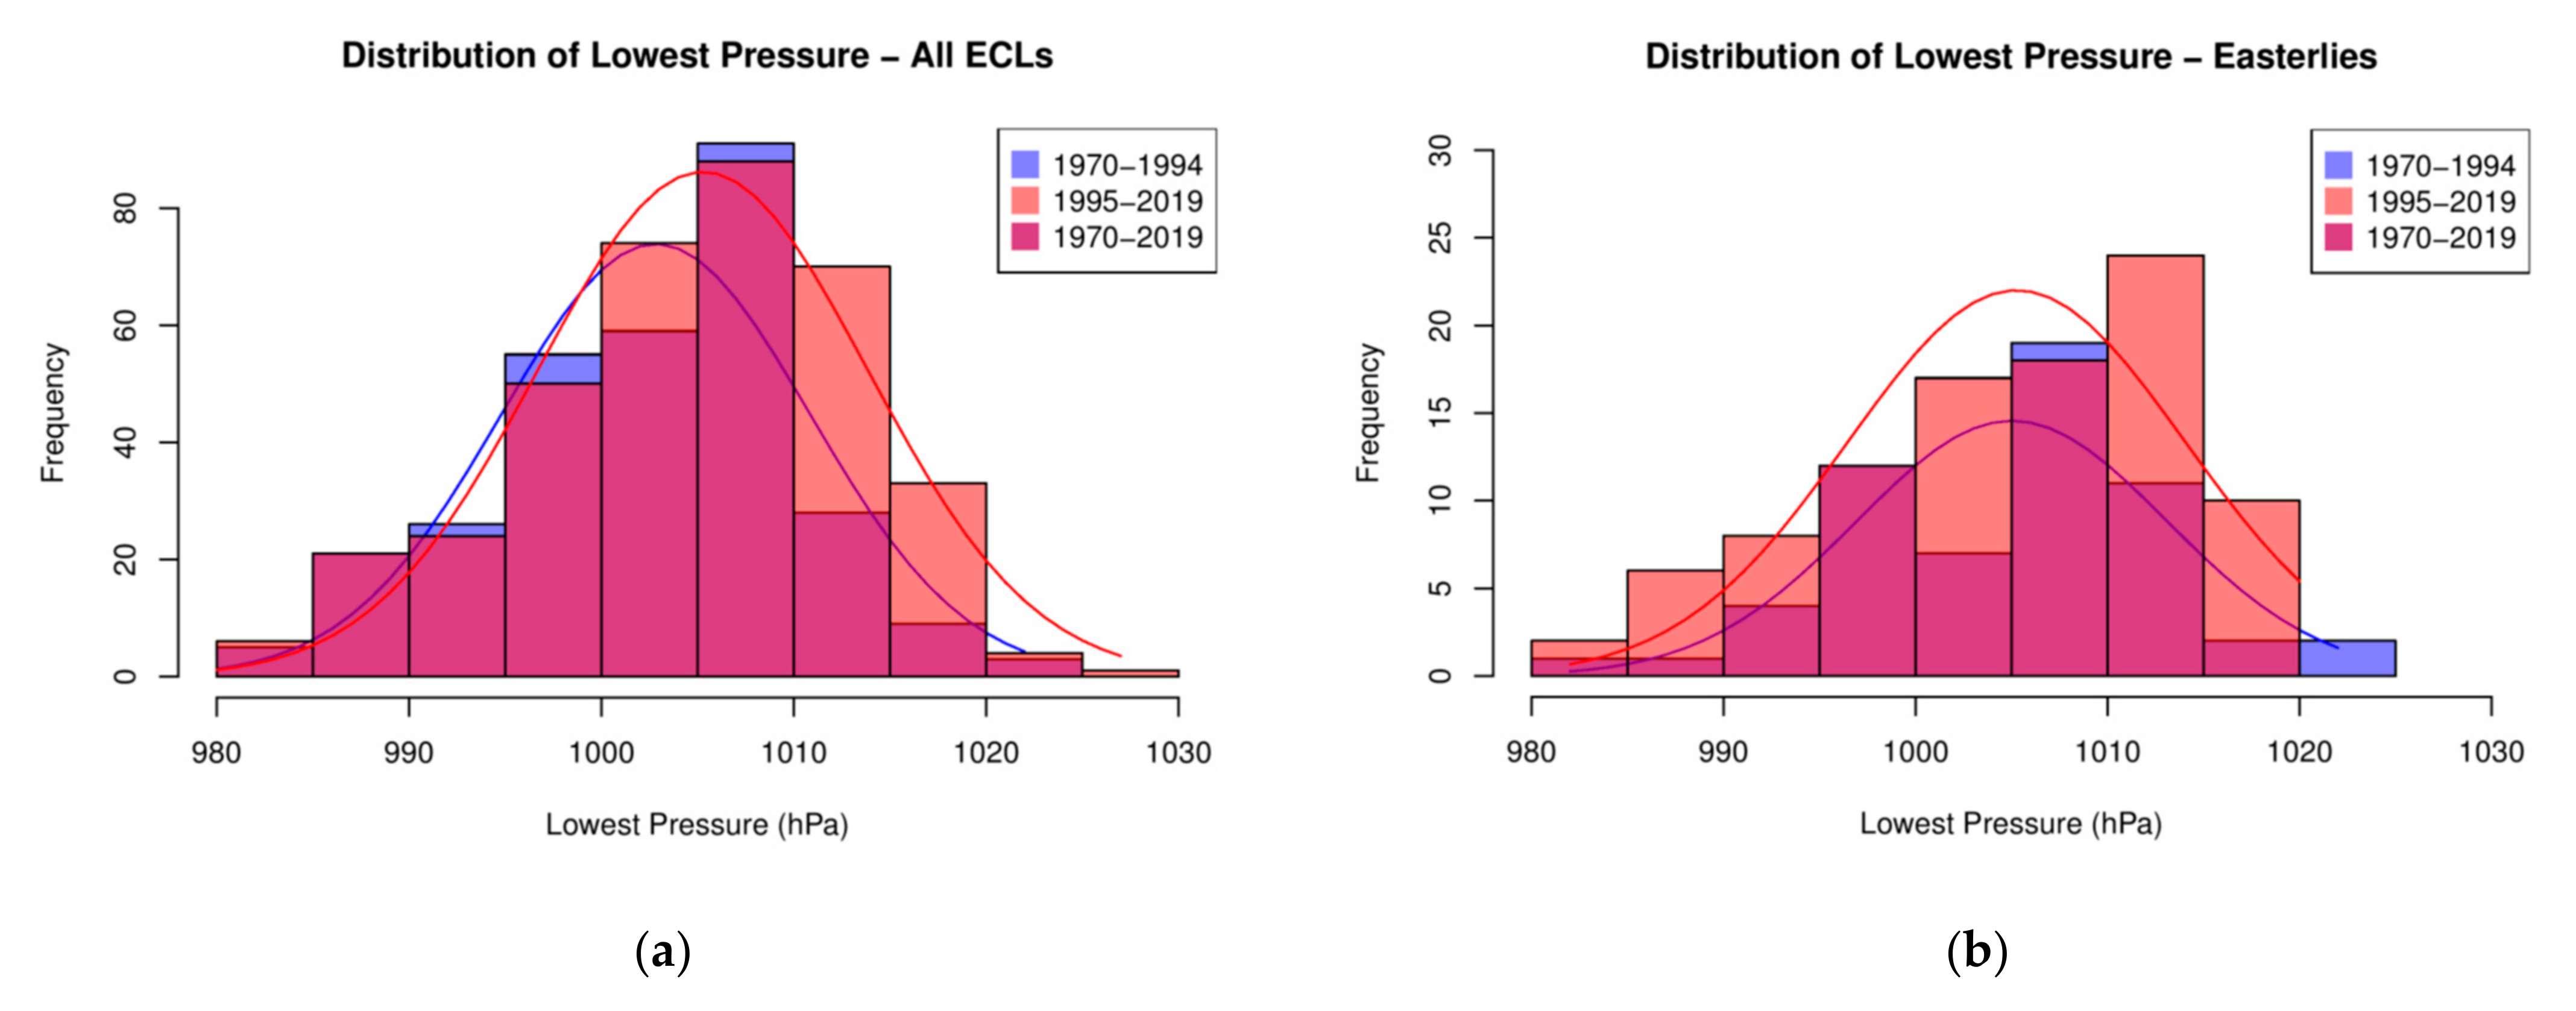
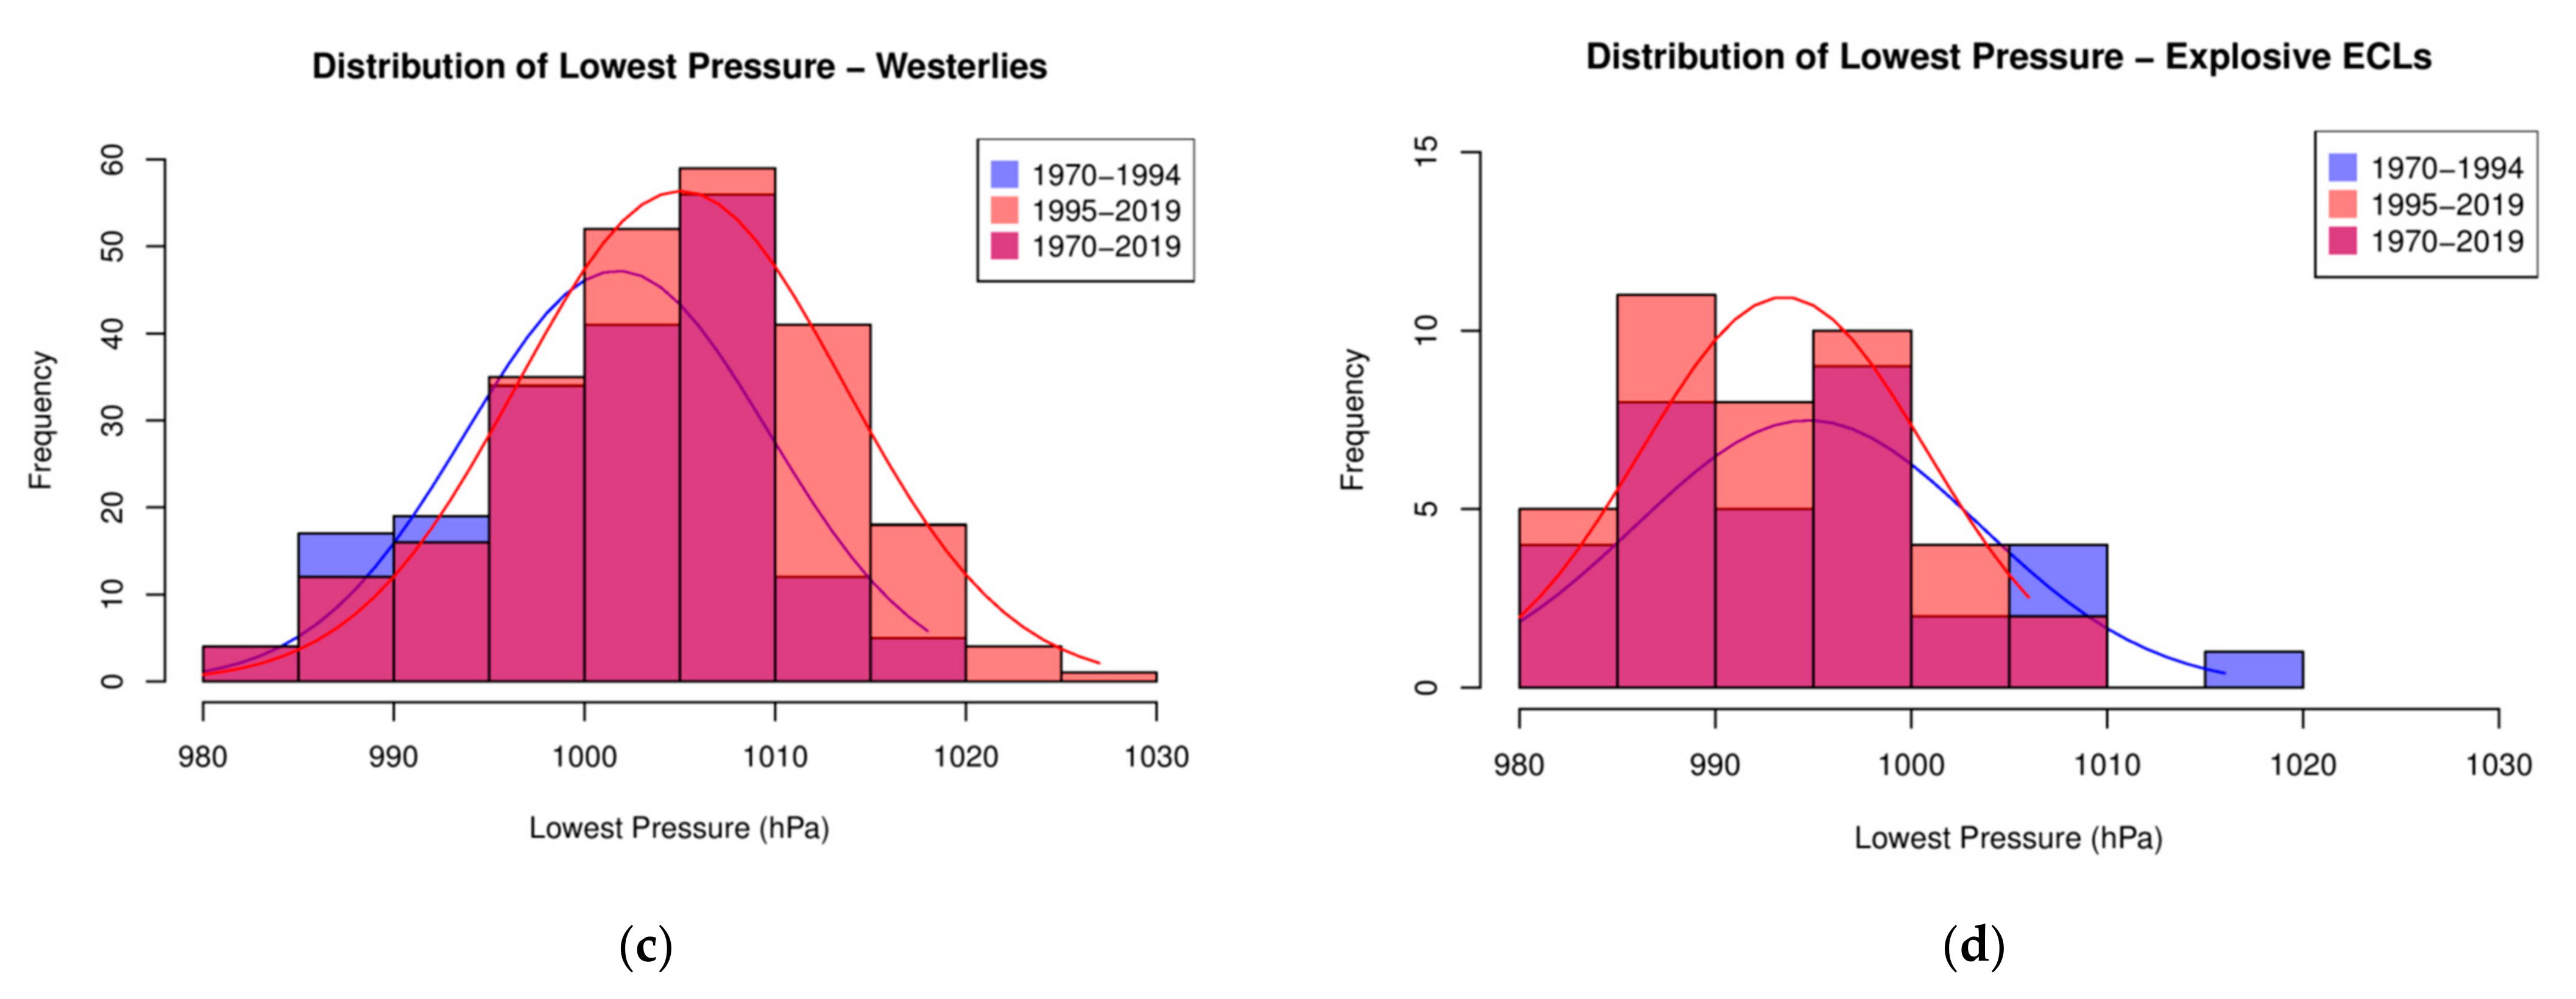
The histogram plots showing the distribution of mean lowest pressure for ECLs, Easterlies, Westerlies, and Explosives, are shown in Figure 6a-d. Similar to the development mean central pressures, there is a significant increase in mean lowest central pressure of ECLs (p-value = 0.0186; Figure 6a) and Westerlies (p-value = 0.004; Figure 6c). However, there is no statistical significance between the two periods (i.e., no p-values are ≤ 0.1; Table 1) of mean lowest pressure for the other two categories, Easterlies (Figure 6c) or Explosives (Figure 6d). The variance of the mean lowest pressure for Explosives is smaller although, while not significant, it has a noteworthy p-value of 0.108 (Table 1).
3.4. Point Density Estimates of ECL Locations for April–September 1970–1994 and 1995–2019
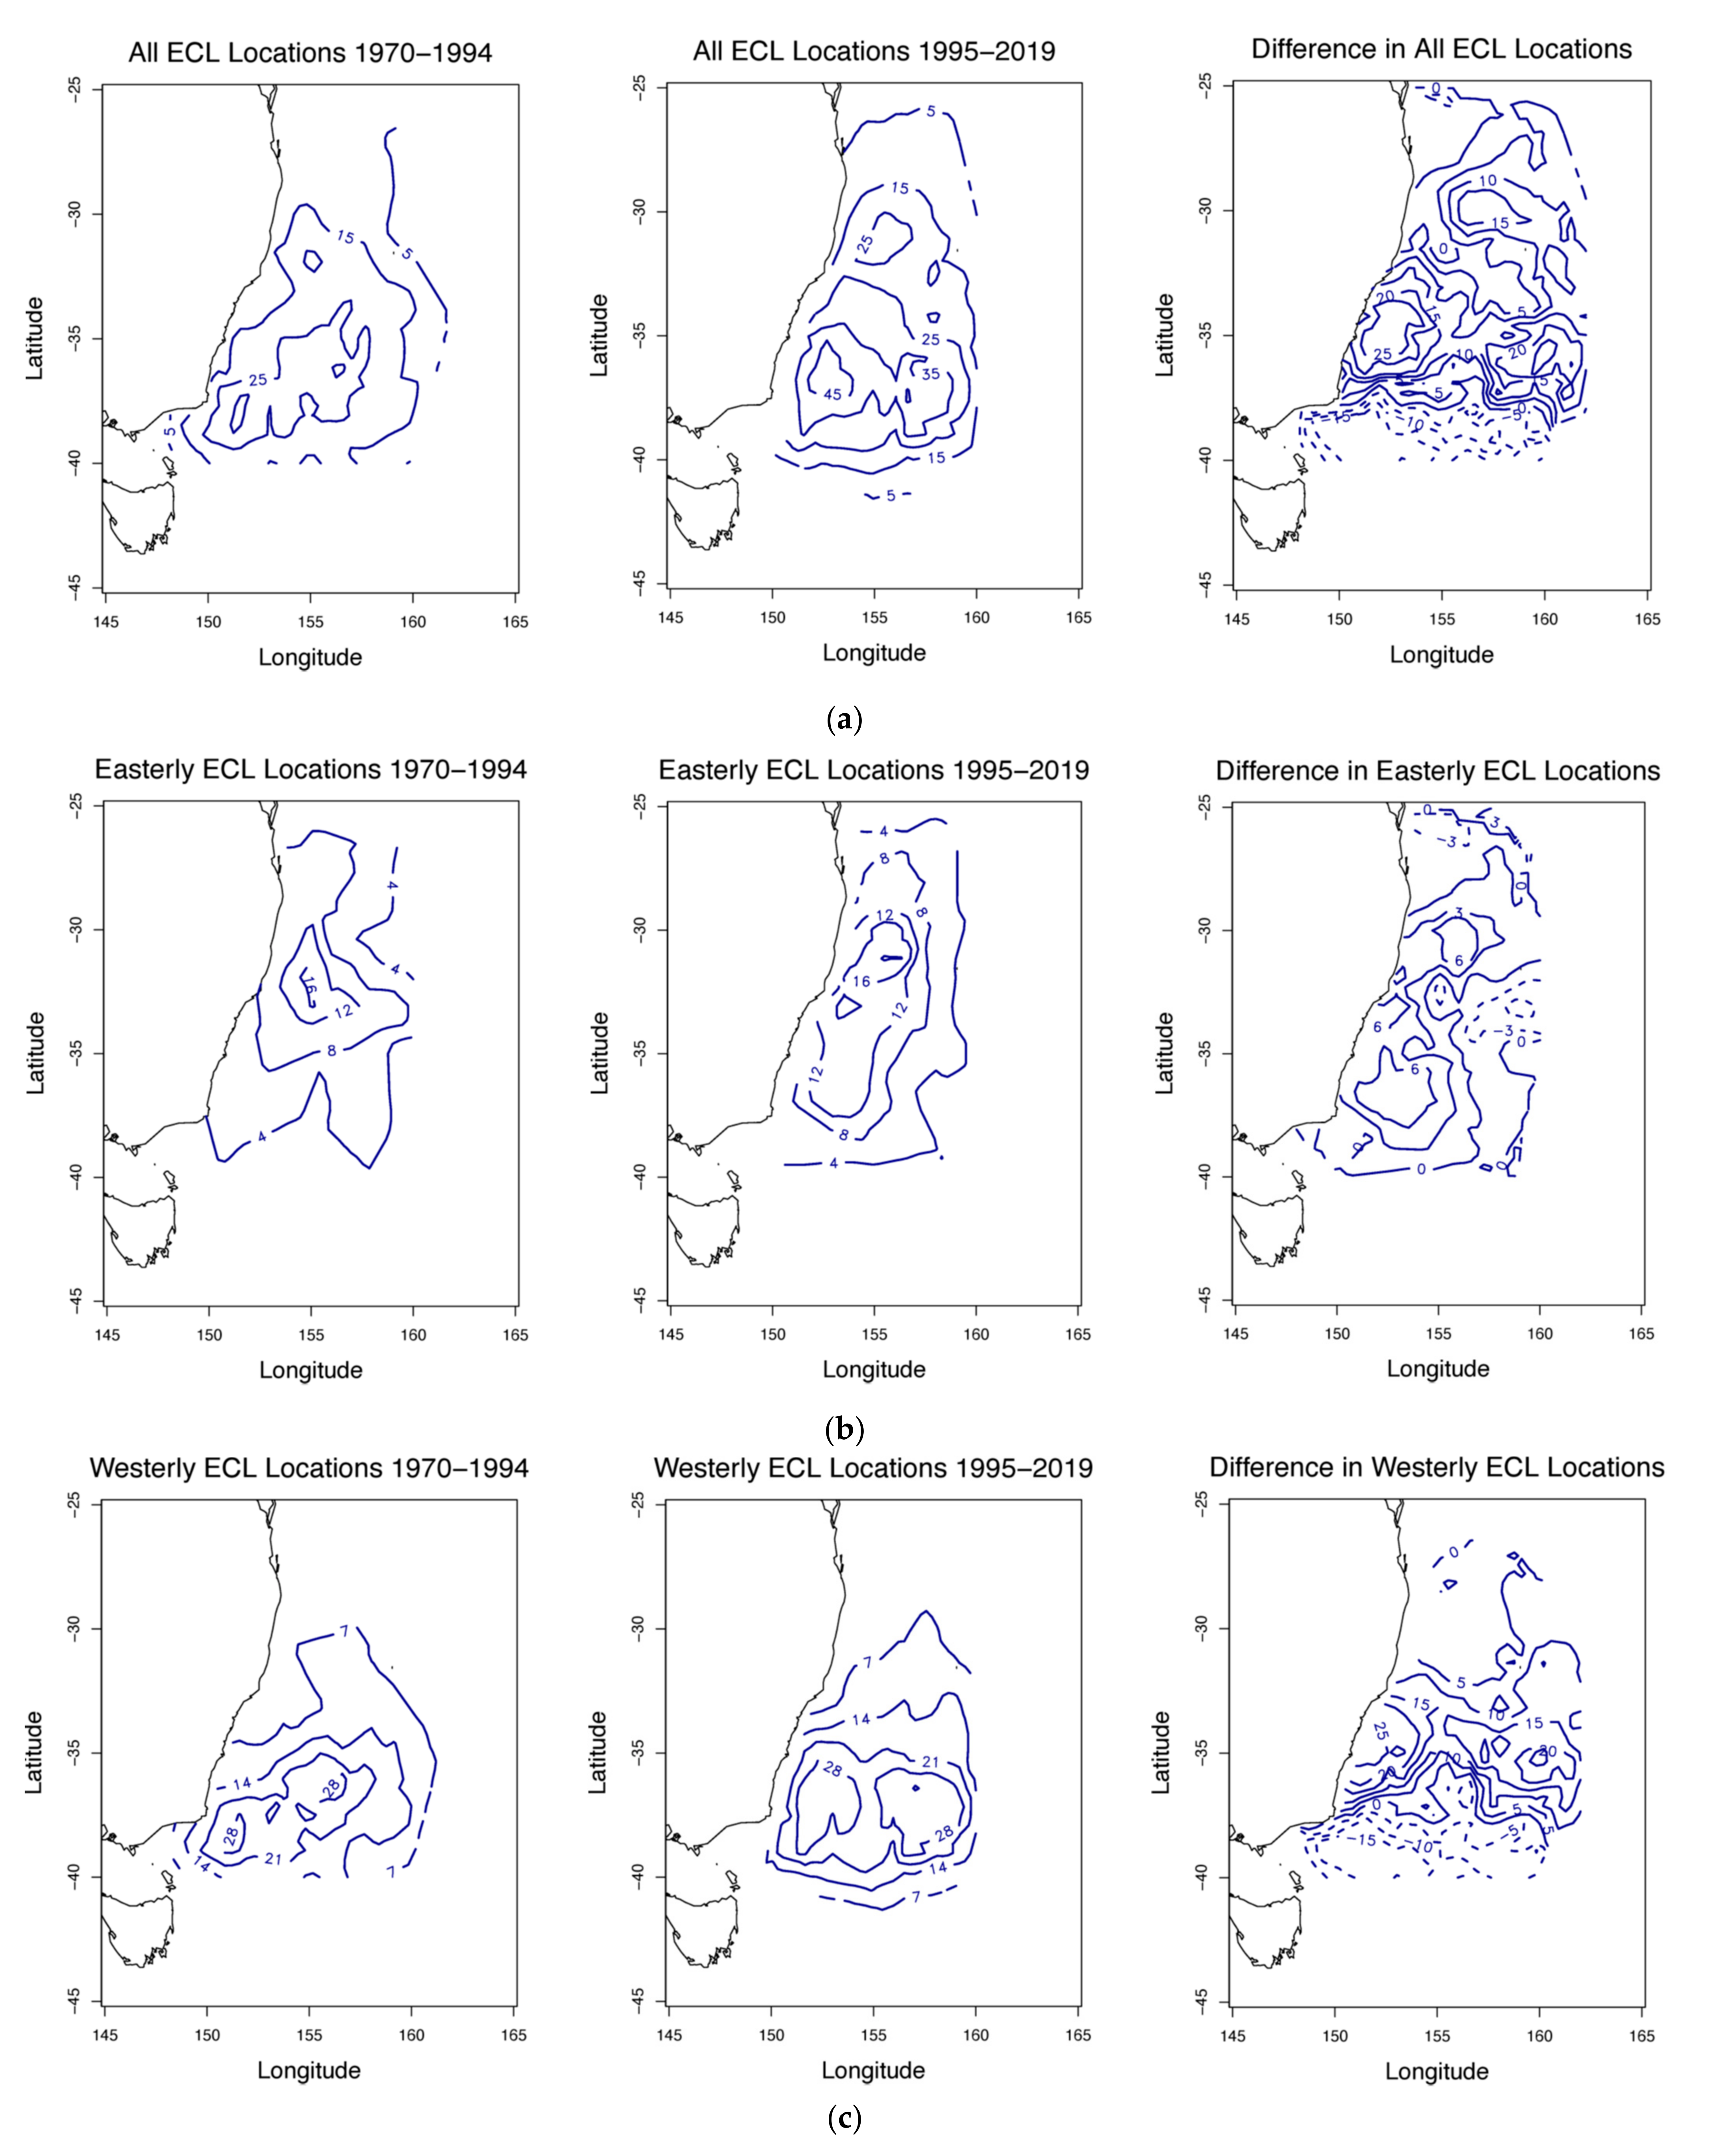
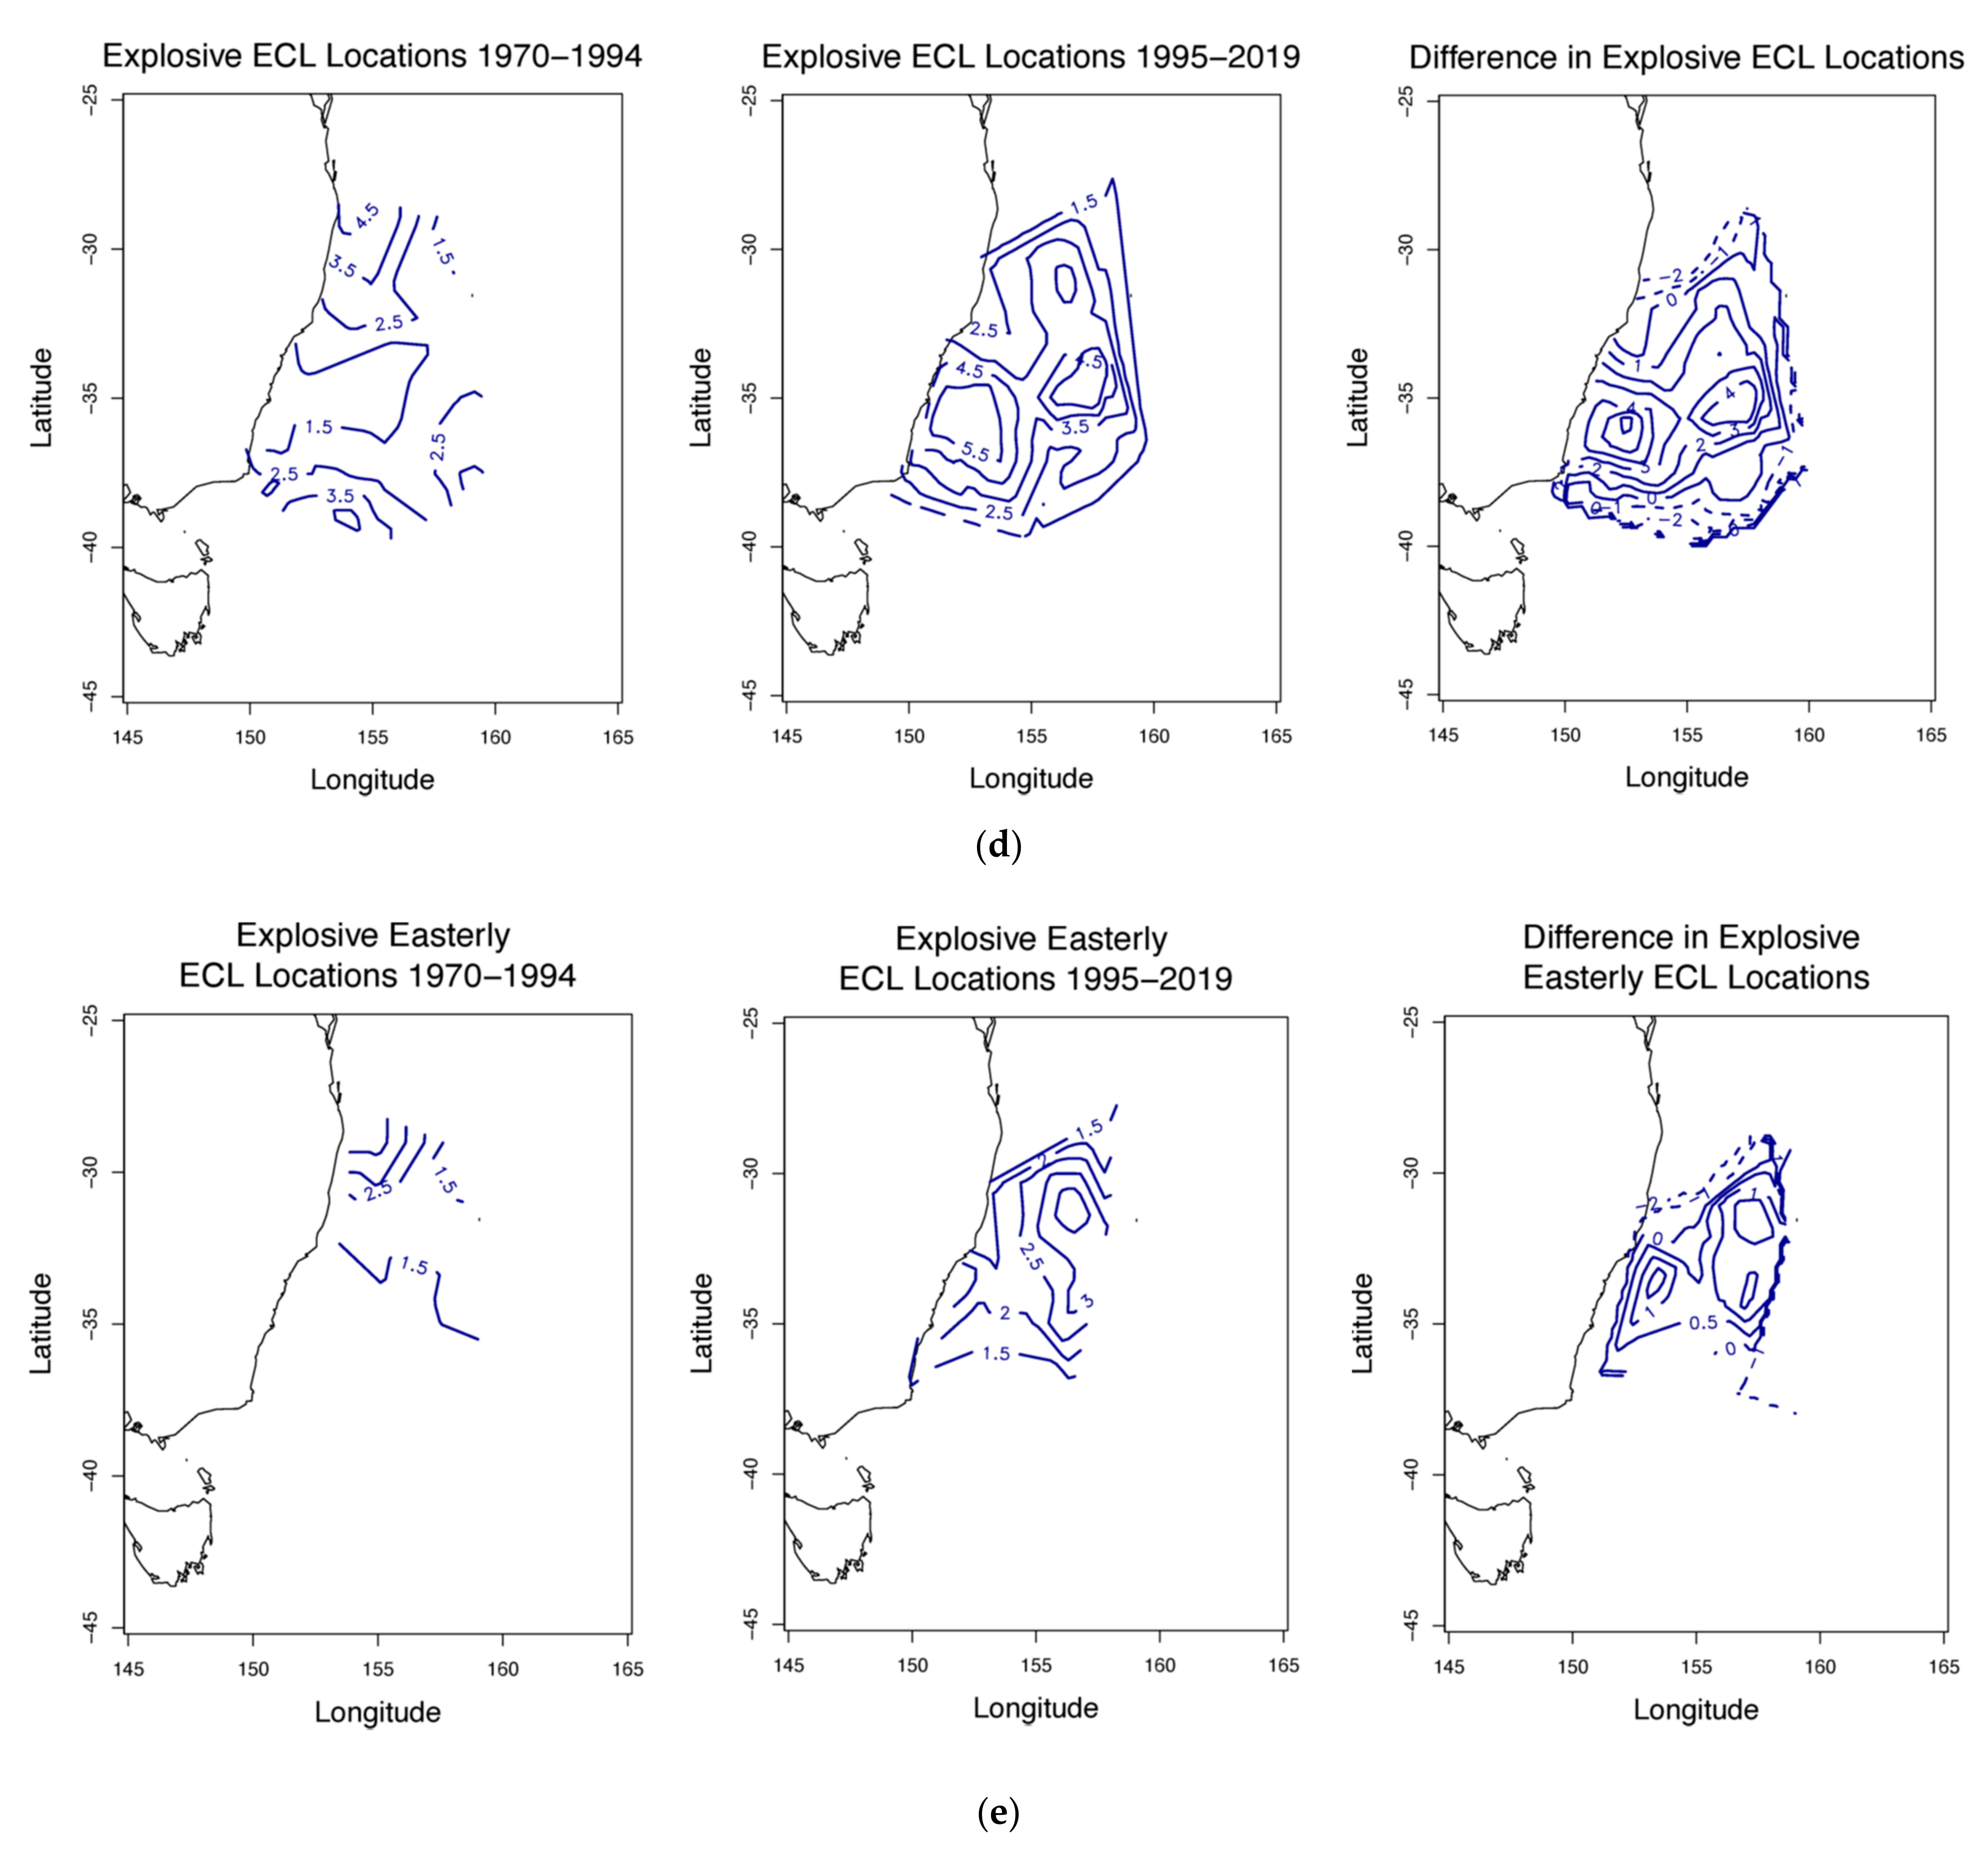
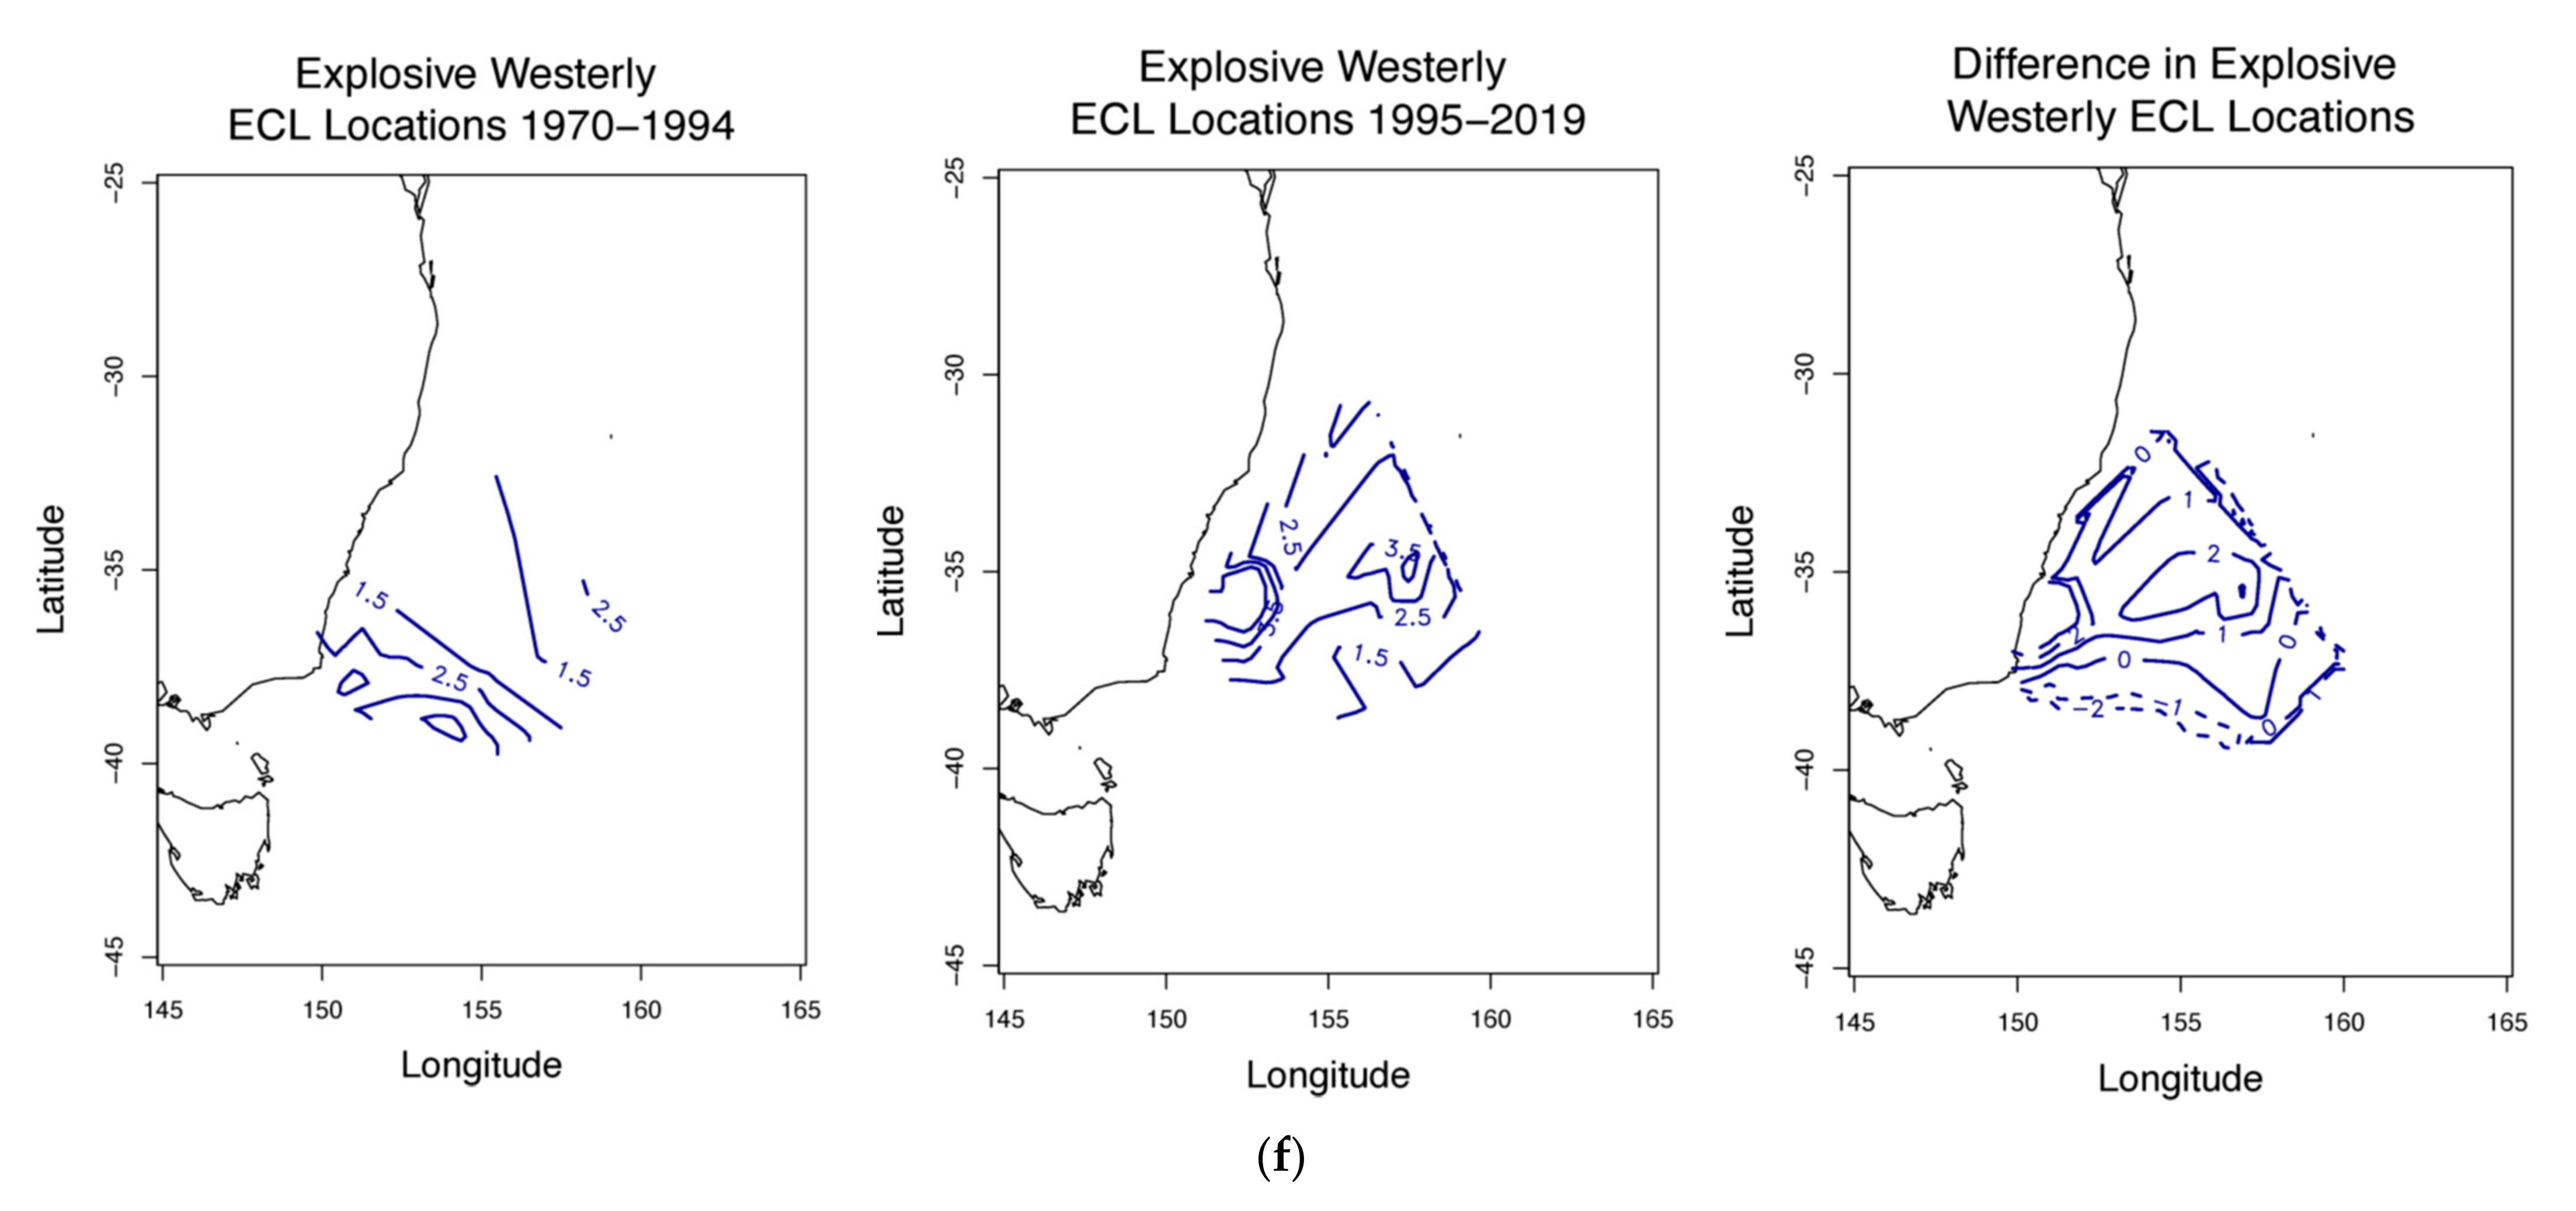
Large variations in box size frequencies of the Point Density Estimate (PDE) figures makes it difficult to improve their appearance by smoothing their contours. The key points are location shifts in maxima. The frequency maxima for the locations of the total mean development days in both periods occur at the same locations as shown by the differences between the two periods (Figure 7a). The increase in Easterlies frequency is shown as a secondary maximum further south in the latter period (Figure 7b). For the Westerlies grouping, there has been little change in position apart from a trend further north (Figure 7c). For these systems, the synoptic scale wind direction would still predominantly be offshore at coastal latitudes in the south of the domain from resulting frictional convergence over land towards the low pressure centers. However, for the locations of Explosive ECLs there is a maximum in the east of the domain away from the coast and a reduction adjacent to the coast in the north of the domain (Figure 7d) and their latitude/longitude changes are statistically significant (Table 1). For Explosive Easterlies there is a statistically significant latitudinal difference in variance (Table 1) and a notable location difference between the two periods from a maximum adjacent to the coast near 28° S to two maxima further south and east away from the coast near 34° S 153° E and 32° S 157° E (Figure 7e). Finally, while not statistically significant, there is a northeast location shift in the maximum of Explosive Westerlies from near the southeast corner of the Australian continent in the period 1970–1994 to near 35.5° S 156° E for the period 1995–2019 (Figure 7f).
4. Discussion
The statistically significant increase in the mean in total ECL development days that was found be-tween the periods 1970–1994 and 1995–2019, also is present in the ECL Westerlies sub-group. However, for both the mean development ECL Easterlies and Explosives sub-groups, there is no statistically significant change. This finding raises the possibility of a change in the large scale circulation and dynamics influencing eastern Australia that assists the initial development of ECLs in the domain. One possible explanation is that the split upper-level jet that is a climatological feature of the cool season (April–September) over the eastern Australian/Tasman Sea longitudes [26] has changed structure, has moved, or is a combination of both. The significant increase in variance of the total mean development days (p-value = 0.028; Table 1), in addition to Explosives, Explosive Easterlies and Explosive Westerlies (p-values = 0.00092, 0.0278 and 0.0006, respectively; Table 1) between 1970–1994 and 1995–2019, implies that despite the large scale atmospheric change, there remains an efficient, dynamical mechanism that can facilitate development of ECLs. Moreover, the significant increases in the variances of Explosive groups, suggest there are years when a dynamic, mid-latitude westerly wind regime in the domain was more active than others compared to the earlier period. There is a statistically significant increase in mean days when a low is present between the two periods for the Total and both Easterlies and Westerlies sub-groups (p-values = 0.0054, 0.0794 and 0.0218, respectively; Table 1). This increase is implied in the southern part of the domain where it is consistent with anomalous high pressure there from 1970–1994 compared to anomalous low pressure from 1995–2019 (Figure 8a,b).
While frequencies of development days of the Explosive ECLs are not statistically significant, as mentioned above, given the atmospheric change that has resulted from global warming, the implication is that other important development factors also might not be present. These include ocean thermal properties known to aid the intensification of subtropical ECLs, particularly the east Australian current (EAC) [26,27], which is close to and parallels the coast in the study area [2]. Regardless of the large scale change in circulation that has occurred, there is no statistical significance in the variance frequencies of Easterlies or Westerlies, intimating that both wind regimes are equally likely to be present in each 25-year period.
Notably, the mean central pressures of development days for both ECLs and ECL Westerlies exhibit statistically significant increases (p-values = 0.0016, 0002; Table 1), due almost entirely to the increase in the mean central pressures of the ECLs Westerlies. This is intimated again by the reversal of anomalous negative geopotential heights at 300 hPa across southern Australia/Tasman Sea longitudes in 1970–1994 compared to anomalous positive 300 hPa geopotential heights during 1995–2019 (Figure 8a,b). Although WF (Frontal Wave) developed ECLs have decreased slightly from 52% to 48%, the other two synoptic categories in the Westerlies regime group have increased markedly from 23% to 77% for Lows in Westerlies (LW) ECLs, and from 30% to 70% for Decaying Front (DF) ECLs (available at: https://0-doi-org.brum.beds.ac.uk/10.5281/zenodo.4137957). The implication is that a change has occurred that affects ECL development within a westerly wind regime over southern Australia/Tasman Sea longitudes. Most likely it arose through the periodic presence of transiting long wave troughs in the southern half of the domain, which is consistent with the anomalous center in the southwest of the domain as shown by the change from a generally westerly wind vector anomaly over the whole domain at 300 hPa from April–September 1970–1994 to a westerly wind vector anomaly only in the southwest of the domain from 1995–2019 (Figure 8c,d).
Turning to the lowest pressure (strongest intensity) of an event, the mean lowest pressure for ECLs is significantly larger for the 1995–2019 period (p-value = 0.0186; Table 1) most likely due to the larger value for Westerlies (p-value = 0.004), that is, more frequent mid-latitude westerly winds with low pressure systems developing near and transiting the southern part of the domain before sliding southeast on approaching anomalous high pressure in New Zealand longitudes.
Whereas there are no statistically significant changes in latitude and longitude of the means of development days for ECLs, the variances are significantly smaller for the latitude and longitude of development days of Easterlies (p-values = 0.0704, 0.0462, respectively; Table 1) and Explosives (p-values = 0.0002, 0.013, respectively; Table 1) in addition to the variance for latitude of Explosive Easterlies (p-value = 0.0966; Table 1).
The maximum near 28° S, adjacent to the coast in the Explosive ECLs during 1970–1994 (Figure 7e), disappears during 1995–2019 and a maximum appears further south near 34° S, 153° E together with another double centered maximum, much farther east away from the coast towards the eastern edge of the domain. The most likely explanation for this change is a difference in structure of the upper tropospheric jet stream over eastern Australia/Tasman Sea longitudes. A well-documented form of Explosive ECLs describes the initial formation of an ECL close to the coast, preceded by a cyclonic vorticity anomaly associated with the subtropical portion of the split-jet [2]. Development of a surface low pressure system in the elongated surface easterly trough offshore, parallel to the coast, results from a low level cyclonic anomaly in the easterly trough provided by the warm EAC [2]. Intensification near the coast, accompanied by a large drop in central pressure, was supported by numerical modelling [8]. It likely is a consequence of the EAC, which is a warm tongue of water stretching from about 10 km to 100 km off the coast [27]. A dominant maximum much further east in the period 1995–2019 (Figure 7e), indicates that the above-mentioned development mechanism is not as dominant in that period for coastal latitudes in the northern part of the domain. The typical position of ECL formation close to the coast from an inland trough (IT) [10], is consistent with the ECL development maximum near 34° S, 153° E. Even though the IT frequency remained the same over the two periods, it has influenced the change in coastal position of ECL formation in the latter peri-od because the increase in easterly trough (ET) frequency in the updated database arises from ECLs forming much further east.
Although the frequency of Explosive Westerlies ECL formation (Figure 7f) is low during 1970–1994, their location maximum near the SE corner of the continent is indicative of the Type 3 ECLs defined by [2] which form at the left hand entrance region of the polar front jet. During this period, the 300 hPa negative pressure anomalies were present across southern Australian latitudes (Figure 8a). The significant decrease in variance of Explosive Westerlies in the period 1995–2019 appears as two maxima much farther northeast than in 1970–1994 (Figure 7f) and is consistent with the increase in the two maxima in the same general area between 1970–1994 and 1995–2019 for all Explosive ECL locations (Figure 7d). Moreover, the statistically significant increase in frequency variance of both the Explosive Westerlies (p-value = 0.0394; Table 1) and Explosive Easterlies (p-value = 0.0006; Table 1) between the two periods, merits further future investigation to identify possible changes in the large scale atmospheric dynamics mentioned earlier.
It is noteworthy that most of eastern Australia was in drought during 2017–2019 and in 2019 there was a record low number of cyclones in southern Australia [28]. From April–September 2019 the updated database shows that only 3 of 14 ECLs developed in the Easterlies at MSLP. Moreover, Explosive ECLs in the period 1995–2019 have shifted significantly south and east implying less coastal rain impact in the north of the domain. The remaining 11 ECLs from April–September in 2019 developed from the mid-latitude zonal influence as initially part of a decaying frontal system, developing wave or a developing low pressure in a westerly wind regime. The proportions were similar in the drought years of 2017 and 2018. These ECLs result in an offshore (westerly) component wind over the southeast coast of Australia, hence rain was minimal compared to that potentially from systems that develop in a subtropical easterly (onshore) wind regime. Furthermore, large wind waves would be less likely to impact eastern Australia [29]. However, large swell waves can still impact the southeast coast of Australia from ECLs in a westerly wind regime. Nevertheless, as the zonal westerly wind regime has shifted poleward from 1995–2019, these systems are likely to shift further poleward or decrease in frequency if the mean flow flattens as suggested by Dowdy et al. [29].
5. Conclusions
Extending the existing database for April–September 1970–2006 [10] to 1970–2019 whilst ensuring consistency in methodology, revealed a significant increase in the mean frequency in total days an east coast low (ECL) was present during the period 1995–2019, in addition to both ECL Easterlies and Westerlies. The mean days of ECL development were also higher owing to the larger mean frequency of ECL Westerlies compared with 1970–1994. However, no statistically significant change was found in the mean frequency of Explosive ECLs between the two periods. This finding contrasts with no change or weak declines in ECLs found by Browning and Goodwin [13] and Pepler [28], but consistent with a lack of change in Explosive ECLs found in this study. In terms of April–September coastal flooding events Power and Callaghan [30] found 25 in the 25 years from 1970–1994 compared to 19 in the 18 years from 1995–2012. Unless their database is extended to 2019 it is not possible to compare flooding events with the synoptic findings of no significant change in development of Explosive ECLs in this study, notwithstanding an increase in Total days when a low was present. One factor influencing changes in coastal flooding events considered in this study would be the latitudinal/longitudinal changes in Explosive ECLs. There were noticeable changes in the locations of both the Westerlies ECLs and Explosive ECLs. The position changes of maxima for these two groupings possibly are related to changes in the large scale circulation that have influenced eastern Australian/Tasman Sea longitudes over the last 50 years and require further research. The statistically significant increase in the mean central pressure of the ECLs clearly is due to the increase in central pressure of the Westerlies ECLs. This finding is consistent with the observed anomalously high pressure (e.g., at 300 hPa) in the latter period. Future research therefore will focus on possible changes in the large scale circulation over eastern Australian/Tasman Sea longitudes because the PDEs of Easterlies, Westerlies and Explosive ECLs, and increased variance of Explosive Westerlies and Explosive Easterlies ECLs, have highlighted changes in the locations of their maxima between the two periods. Changes in ECL locations are critically important owing to the possible devastating coastal impacts of their associated natural hazards, including heavy rain, damaging winds, coastal erosion, and extreme tides.
Author Contributions
The following contributions are listed as: Conceptualization, M.S. and L.L.; methodology, M.S.; L.L.; S.M. and J.H.; validation, M.S.; investigation, M.S.; formal analysis, L.L., M.S., J.H. and S.M.; writing—original draft preparation, M.S.; writing—reviewing and editing, L.L.; M.S., J.H. and S.M.; supervision, L.L. and S.M. All authors have read and agreed to the published version of the manuscript.
Funding
This research received no external funding.
Institutional Review Board Statement
Not applicable.
Informed Consent Statement
Not applicable.
Data Availability Statement
The updated April–September ECL database 1970–2019 is available at: https://0-doi-org.brum.beds.ac.uk/10.5281/zenodo.4137957 (accessed on 10 February 2021).
Acknowledgments
The School of Mathematical and Physical Sciences, University of Technology, Sydney is acknowledged for providing computational power and support. This research also is supported by an Australian Government Research Training Program Scholarship and funding from the School of Mathematical and Physical Sciences, University of Technology, Sydney.
Conflicts of Interest
The authors declare no conflict of interest.
References
- Bureau of Meteorology. Annual Climate Statement 2019. Commonwealth of Australia. Available online: http://www.bom.gov.au/climate/current/annual/aus/2019/ (accessed on 10 February 2021).
- Holland, G.J.; Lynch, A.H.; Leslie, L.M. Australian east-coast cyclones. Part I: Synoptic overview and case study. Mon. Weather Rev. 1987, 115, 3024–3036. [Google Scholar] [CrossRef] [Green Version]
- McInnes, K.L.; Hess, G.D. Modifications to the Australian region limited area model and their impact on an east coast low event. Aust. Met. Mag. 1992, 40, 21–31. [Google Scholar]
- McInnes, K.L.; Leslie, L.M.; McBride, J.L. Numerical simulation of cut-off lows on the Australian east coast: Sensitivity to sea-surface temperature. Int. J. Climatol. 1992, 12, 783–795. [Google Scholar] [CrossRef]
- McInnes, K.L.; Hubbert, G.D. The impact of eastern Australian cut-off lows on coastal sea levels. Meteorol. Appl. 2001, 8, 229–243. [Google Scholar] [CrossRef]
- Dowdy, A.J.; Pepler, A.; Di Luca, A.; Cavicchia, L.; Mills, G.; Evans, J.P.; Louis, S.; McInnes, K.L.; Walsh, K. Review of Austral-ian east coast low pressure systems and associated extremes. Clim. Dyn. 2019, 53, 4887–4910. [Google Scholar] [CrossRef]
- Hopkins, L.C.; Holland, G.J. Australian heavy-rain days and associated east coast cyclones: 1958–92. J. Clim. 1997, 10, 621–635. [Google Scholar] [CrossRef]
- Leslie, L.M.; Holland, G.J.; Lynch, A.H. Australian east-coast cyclones. Part II: Numerical modeling study. Mon. Weather Rev. 1987, 115, 3037–3054. [Google Scholar] [CrossRef]
- Leslie, L.M.; Speer, M.S. Short-range ensemble forecasting of explosive Australian east coast cyclogenesis. Weather Forecast. 1998, 13, 822–832. [Google Scholar] [CrossRef]
- Speer, M.S.; Wiles, P.; Pepler, A. Low pressure systems of the New South Wales coast and associated hazardous weather: Establishment of a database. Aust. Met. Mag. 2009, 58, 29–39. [Google Scholar] [CrossRef]
- Dowdy, A.J.; Mills, G.A.; Timbal, B. Diagnosing indicators of large-scale forcing of east-coast cyclogenesis. In IOP Conference Series: Earth and Environmental Science; IOP Publishing: Bristol, UK, 2010; Volume 11, p. 012003. [Google Scholar]
- Dowdy, A.J.; Mills, G.A.; Timbal, B. Large-scale diagnostics of extratropical cyclogenesis in eastern Australia. Int. J. Climatol. 2013, 33, 2318–2327. [Google Scholar] [CrossRef]
- Browning, S.A.; Goodwin, I.D. Large-scale influences on the evolution of winter sub-tropical maritime cyclones affecting Australia’s east coast. Mon. Weather Rev. 2013, 141, 2416–2431. [Google Scholar] [CrossRef]
- Ji, F.; Evans, J.P.; Argueso, D.; Fita, L.; Di Luca, A. Using largescale diagnostic quantities to investigate change in East Coast Lows. Clim. Dyn. 2015, 45, 2443–2453. [Google Scholar] [CrossRef]
- Pepler, A.S.; Di Luca, A.; Ji, F.; Alexander, L.F.; Evans, J.P.; Sherwood, S.C. Impact of identification method on the inferred characteristics and variability of Australian east coast lows. Mon. Weather Rev. 2015, 143, 864–877. [Google Scholar] [CrossRef] [Green Version]
- Di Luca, A.; Evans, J.P.; Pepler, A.; Alexander, L.; Argüeso, D. Resolution sensitivity of cyclone climatology over eastern Aus-tralia using six reanalysis products. J. Clim. 2015, 28, 9530–9549. [Google Scholar] [CrossRef]
- Sanders, F.; Gyakum, J.R. Synoptic-Dynamic Climatology of the “Bomb”. Mon. Weather Rev. 1980, 108, 1589–1606. [Google Scholar] [CrossRef] [Green Version]
- Buckley, B.W.; Leslie, L.M. The Australian Boxing Day Storm of 1998—Synoptic Description and Numerical Simulations. Weather Forecast. 2000, 15, 543–558. [Google Scholar] [CrossRef]
- Mills, G.; Webb, R.; Davidson, N.E.; Kepert, J.; Seed, A.; Abbs, D. The Pasha Bulker East Coast Low of 8 June 2007; CAWCR Technical Report No. 023; Bureau of Meteorology: Melbourne, Australia, 2010; pp. 1–62. ISSN 1835-9884. [Google Scholar]
- Qi, L.; Leslie, L.M.; Speer, M. Climatology of cyclones over the southwest Pacif-ic: 1992–2001. Meteorol. Atmos. Phys. 2006, 91, 201–209. [Google Scholar] [CrossRef]
- Pezza, A.B.; Garde, L.A.; Veiga, J.A.P.; Simmonds, I. Large scale features and energetics of the hybrid subtropical low ‘Duck’ over the Tasman Sea. Clim. Dyn. 2014, 42, 453–466. [Google Scholar] [CrossRef]
- Good, P.I. Resampling Methods; Springer: Heidelberg, Germany, 2006; 28p, ISBN 978-0817643867. [Google Scholar]
- Australian Bureau of Meteorology and CSIRO. State of the Climate 2020. 2020; p. 24. Available online: http://www.bom.gov.au/state-of-the-climate/ (accessed on 4 March 2021).
- Kalnay, E.; Kanamitsu, M.; Kistler, R.; Collins, W.; Deaven, D.; Gandin, L.; Iredell, M.; Joseph, D. The NCEP/NCAR Reanalysis 40-year Project. Bull. Am. Meteorol. Soc. 1996, 77, 437–471. [Google Scholar] [CrossRef] [Green Version]
- Baddeley, A.; Rubak, E.; Turner, R. Spatial Point Patterns: Methodology and Applications with R; Chapman and Hall: London, UK, 2015; 828p, ISBN 978-1482210200. [Google Scholar]
- Bals-Elsholz, T.M.; Atallah, E.H.; Bosart, L.F.; Wasula, T.A.; Cempa, M.J.; Lupo, A.R. The Wintertime Southern Hemisphere Split Jet: Structure, Variability, and Evolution. J. Clim. 2001, 14, 4191–4215. [Google Scholar] [CrossRef] [Green Version]
- Godfrey, J.S.; Cresswell, G.R.; Golding, T.J.; Pearce, A.F.; Boyd, R. The separation of the East Australian Current. J. Phys. Oceanogr. 1980, 10, 430–440. [Google Scholar] [CrossRef]
- Pepler, A. Record lack of cyclones in southern Australia during 2019. Geophys. Res. Lett. 2020, 47, e2020GL088488. [Google Scholar] [CrossRef]
- Dowdy, A.; Mills, G.; Timbal, B.; Wang, Y. Fewer large waves projected for eastern Australia due to decreasing storminess. Nat. Clim. Chang. 2014, 4, 283–286. [Google Scholar] [CrossRef]
- Power, S.; Callaghan, J. The frequency of major flooding in coastal southeast Australia has significantly increased since the late 19th century. J. South. Hemisph. Earth Syst. Sci. 2016, 66, 2–11. [Google Scholar] [CrossRef]
Figure 1.
An example of an Australian ECL pressure system. The MSLP analyses are from the Australian Bureau of Meteorology and are valid at: 00 UTC 21 May 2020 (left panel) and 00 UTC 22 May 2020 (right panel). The study area for both the ECL database [10] and this updated study is the area bounded by the black lines (right panel).

Figure 2.
(a) Frequencies 1970–2019 (April–September) of synoptic categories of Total ECLs:- Total Easterly (Total E); Total Westerly (Total W); Total (E+W). Linear trends for each category are indicated. (b) NCEP/NCAR reanalysis of MSLP anomalies (hPa) 2007–2019 (April–September). (c) NCEP/NCAR reanalysis of MSLP anomalies (hPa) 1970–2006. Image provided by the NOAA/ESRL Physical Sciences Laboratory, Boulder Colorado from their Website at: http://psl.noaa.gov/ (accessed on 10 February 2021) [24].

Figure 3.
Box and whiskers plots of bootstrapped ECL counts of significant mean (left panel) and/or variance (right panel) for the periods April–September 1970–1994 and 1995–2019, (a) Total Dev. days, (b) Total Dev. days Westerlies, (c) Total days of Westerlies, (d) Total days of lows, (e) Total Dev. days Explosives, (f) Total Dev. days Explosive Easterlies, (g) Total Dev. days Explosive Westerlies.


Figure 4.
Box and whiskers plots of bootstrapped latitude and longitude ECL categories of mean (left panel) and variance (right panel) for the periods April–September 1970–1994 and 1995–2019, (a) Total Dev. days Easterlies-latitude, (b) Total Dev. days Easterlies-longitude, (c) Total Dev. days Explosives–latitude, (d) Total Dev. days Explosives–longitude (e) Total Dev. days Explosive Easterlies–latitude.


Figure 5.
Histogram plots of ECL development mean central pressure distribution for periods April–September 1970–1994 and 1995–2019 for (a) Total, (b) Easterlies, (c) Westerlies, and (d) Explosives. Solid lines are the normal distribution interpolation of the histograms.
Figure 5.
Histogram plots of ECL development mean central pressure distribution for periods April–September 1970–1994 and 1995–2019 for (a) Total, (b) Easterlies, (c) Westerlies, and (d) Explosives. Solid lines are the normal distribution interpolation of the histograms.


Figure 6.
Histogram plots of ECL lowest central pressure distribution for periods April–September 1970–1994 and 1995–2019 for (a) Total, (b) Easterlies, (c) Westerlies, and (d) Explosives. Solid lines are the normal distribution interpolation of the histograms.
Figure 6.
Histogram plots of ECL lowest central pressure distribution for periods April–September 1970–1994 and 1995–2019 for (a) Total, (b) Easterlies, (c) Westerlies, and (d) Explosives. Solid lines are the normal distribution interpolation of the histograms.


Figure 7.
Point density estimate (PDE) contours of ECL locations April–September 1970–1994 (left panel), 1995–2019 (middle panel), and the difference 1995–2019 minus 1970–1994 (right panel), for (a) Total, (b) Easterlies, (c) Westerlies, (d) Total Explosive, (e) Explosive Easterlies, and (f) Ex-plosive Westerlies.


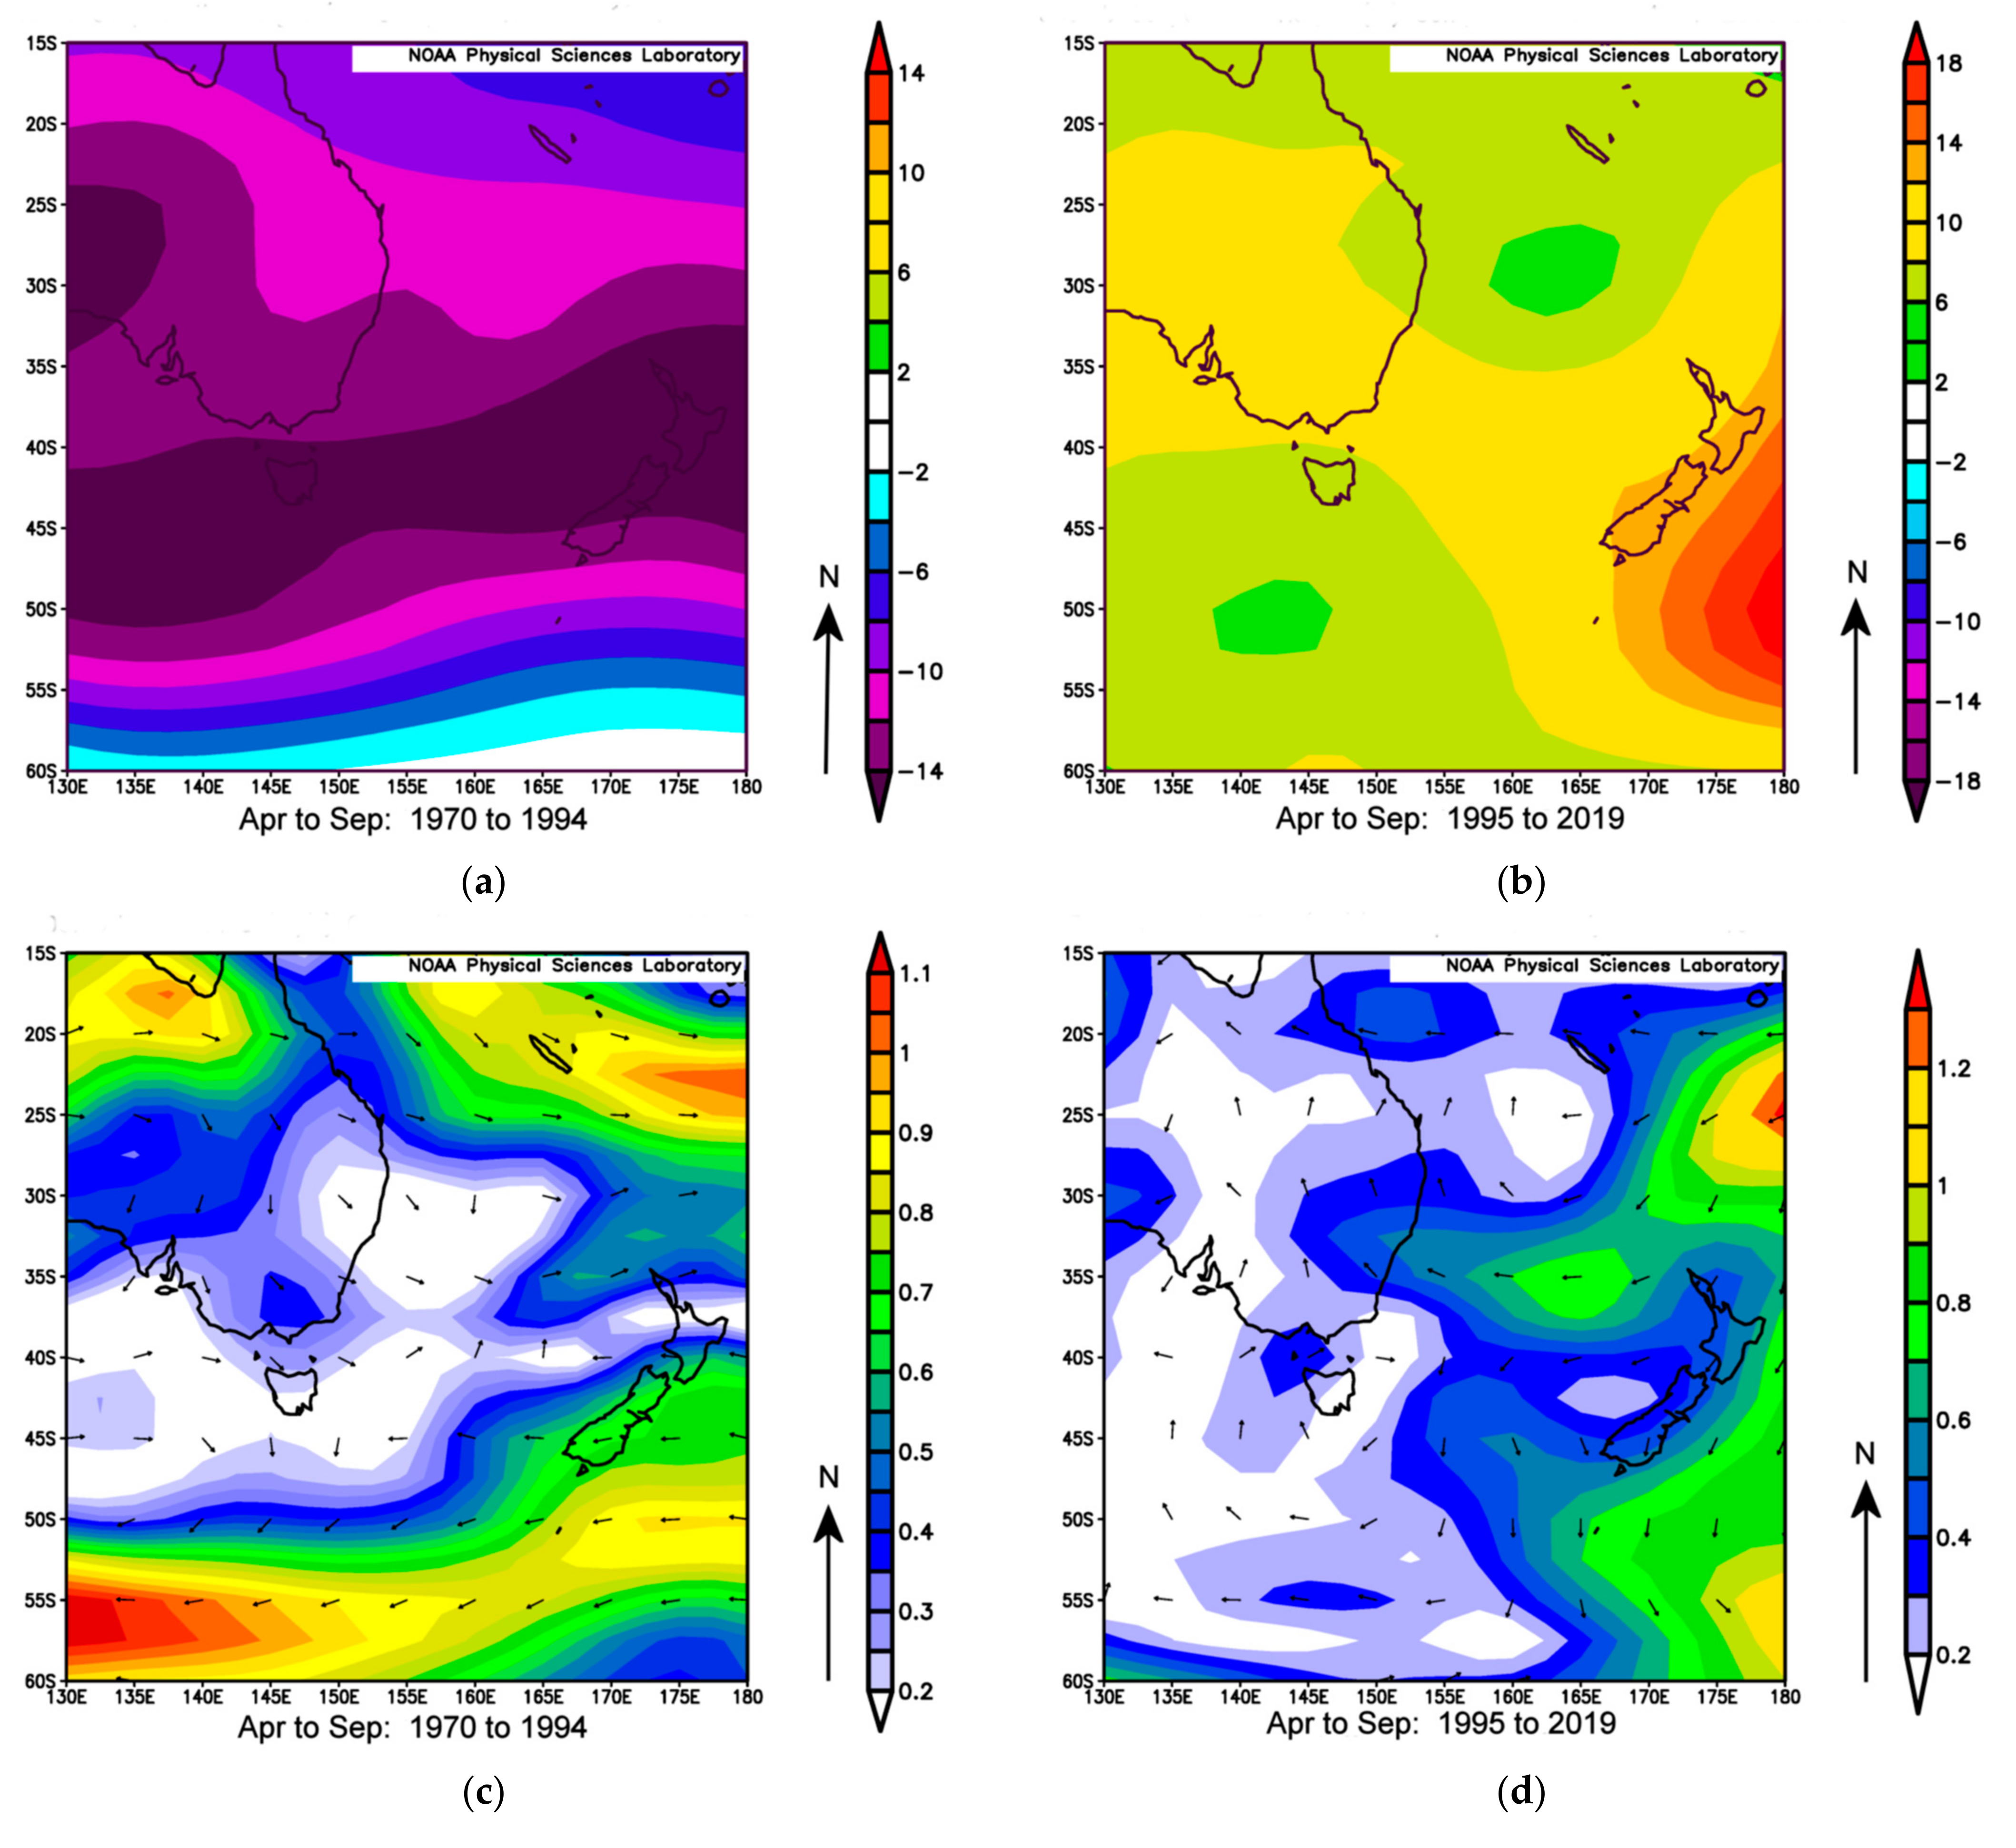
Figure 8.
(a) 300 hPa geopotential height (m) composite anomaly April–September 1970–1994, (b) 300 hPa geopotential height (m) composite anomaly April–September 1995–2019, (c) 300 hPa vector wind composite anomaly Apr-September 1970–1994, and (d) 300 hPa vector wind composite anomaly April–September 1995–2019. All anomalies based on climatology 1981–2010. Image provided by NOAA/ESRL Physical Sciences Laboratory, Boulder Colorado from their Website at: http://psl.noaa.gov/ [24].


Table 1.
p-values of difference in means and variances of ECL grouping between 1970 and 1994 and 1995 and 2019. p-values ≤ 0.05 are in bold and p-values ≥ 0.05 but ≤ 0.1 are in italics.
Table 1.
p-values of difference in means and variances of ECL grouping between 1970 and 1994 and 1995 and 2019. p-values ≤ 0.05 are in bold and p-values ≥ 0.05 but ≤ 0.1 are in italics.
| ECL Feature | p-Value | Statistical Significance of 1995–2019 Mean Relative to 1970–1994 | p-Value | Statistical Significance of 1995–2019 Variance Relative to 1970–1994 |
|---|---|---|---|---|
| Mean | Variance | |||
| Total Dev. days | 0.0142 | Larger | 0.028 | Larger |
| Total Dev. days duration | 0.167 | 0.811 | ||
| Total Dev. days Easterlies | 0.149 | 0.663 | ||
| Total Dev. days Easterlies Duration | 0.801 | 0.286 | ||
| Total Dev. days Westerlies | 0.0344 | Larger | 0.483 | |
| Total Dev. days Westerlies Duration | 0.225 | 0.94 | ||
| Total Dev. days Explosives | 0.506 | 0.0092 | Larger | |
| Total Dev. days Explosives Duration | 0.898 | 0.138 | ||
| Total Dev. days Explosive Easterlies | 0.761 | 0.0278 | ||
| Total Dev. days Exp. Easterlies Duration | 0.603 | 0.247 | ||
| Total Dev. days Explosive Westerlies | 0.492 | 0.0006 | ||
| Total Dev. days Exp. Westerlies Duration | 0.212 | 0.725 | ||
| Total days of lows present | 0.0054 | Larger | 0.22 | |
| Total days of Easterlies | 0.0794 | Larger | 0.653 | |
| Total days of Westerlies | 0.0218 | Larger | 0.807 | |
| Mean Development Latitude | 0.258 | 0.448 | ||
| Mean Development Longitude | 0.743 | 0.71 | ||
| Mean Dev. Lat. Easterlies | 0.27 | 0.0704 | Smaller | |
| Mean Dev. Long. Easterlies | 0.661 | 0.0462 | Smaller | |
| Mean Dev. Lat. Westerlies | 0.531 | 0.812 | ||
| Mean Dev. Long. Westerlies | 0.462 | 0.573 | ||
| Mean Dev. Lat. Explosives | 0.663 | 0.0002 | Smaller | |
| Mean Dev. Long. Explosives | 0.353 | 0.013 | Smaller | |
| Mean Dev. Lat. Explosive Easterlies | 0.357 | 0.0966 | ||
| Mean Dev. Long. Explosive Easterlies | 0.631 | 0.331 | ||
| Mean Dev. Lat. Explosive Westerlies | 0.16 | 0.234 | ||
| Mean Dev. Long. Explosive Westerlies | 0.691 | 0.251 | ||
| Mean Dev. Pressure | 0.0016 | Larger | 0.961 | |
| Mean Dev. Pressure Easterlies | 0.44 | 0.488 | ||
| Mean Dev. Pressure Westerlies | 0.0002 | Larger | 0.718 | |
| Mean Dev. Pressure Explosives | 0.974 | 0.0888 | Smaller | |
| Mean Lowest Pressure | 0.0186 | Larger | 0.922 | |
| Mean Lowest Pressure Easterlies | 0.623 | 0.22 | ||
| Mean Lowest Pressure Westerlies | 0.004 | Larger | 0.16 | |
| Mean Lowest Pressure Explosives | 0.314 | 0.108 | Smaller |
Publisher’s Note: MDPI stays neutral with regard to jurisdictional claims in published maps and institutional affiliations. |
© 2021 by the authors. Licensee MDPI, Basel, Switzerland. This article is an open access article distributed under the terms and conditions of the Creative Commons Attribution (CC BY) license (http://creativecommons.org/licenses/by/4.0/).
Share and Cite
MDPI and ACS Style
Speer, M.; Leslie, L.; Hartigan, J.; MacNamara, S. Changes in Frequency and Location of East Coast Low Pressure Systems Affecting Southeast Australia. Climate 2021, 9, 44. https://0-doi-org.brum.beds.ac.uk/10.3390/cli9030044
AMA Style
Speer M, Leslie L, Hartigan J, MacNamara S. Changes in Frequency and Location of East Coast Low Pressure Systems Affecting Southeast Australia. Climate. 2021; 9(3):44. https://0-doi-org.brum.beds.ac.uk/10.3390/cli9030044
Chicago/Turabian StyleSpeer, Milton, Lance Leslie, Joshua Hartigan, and Shev MacNamara. 2021. "Changes in Frequency and Location of East Coast Low Pressure Systems Affecting Southeast Australia" Climate 9, no. 3: 44. https://0-doi-org.brum.beds.ac.uk/10.3390/cli9030044
Note that from the first issue of 2016, this journal uses article numbers instead of page numbers. See further details here.