Next Issue
Volume 9, April
Previous Issue
Volume 9, February


Climate, Volume 9, Issue 3 (March 2021) – 12 articles

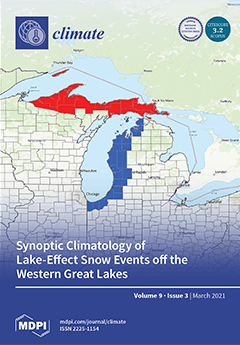
Cover Story (view full-size image): As the mesoscale dynamics of lake-effect snow (LES) are becoming better understood, recent and ongoing research studies are beginning to focus on the large-scale environments conducive to LES. Here, synoptic-scale composites have been constructed for Lake Michigan and Lake Superior LES events by employing an LES case repository for these regions within the U.S. LES off the western Great Lakes has received considerably less attention from the research community and differs significantly from the eastern Great Lakes in terms of LES morphology and impacts due to differences in geographical and physical characteristics. Additionally, the Advanced Weather Research and Forecast model has been utilized to obtain a high-resolution mesoscale depiction of the LES environment associated with each composite. View this paper
  • Issues are regarded as officially published after their release is announced to the table of contents alert mailing list.
  • You may sign up for e-mail alerts to receive table of contents of newly released issues.
  • PDF is the official format for papers published in both, html and pdf forms. To view the papers in pdf format, click on the "PDF Full-text" link, and use the free Adobe Reader to open them.
Order results
Result details
Section
Select all
Export citation of selected articles as:
19 pages, 6573 KiB  
Review
Impact of Seasonal Variation in Climate on Water Quality of Old Woman Creek Watershed Ohio Using SWAT
by Israel A. Olaoye, Remegio B. Confesor, Jr. and Joseph D. Ortiz
Climate 2021, 9(3), 50; https://0-doi-org.brum.beds.ac.uk/10.3390/cli9030050 - 19 Mar 2021
Cited by 11 | Viewed by 4660
Abstract
The effect of the projected 21st century climate change on water quality in Old Woman Creek (OWC) watershed was evaluated using the Soil and Water Assessment Tool (SWAT) and the precipitation and temperature projections from three best Global Climate Circulation Model (GCM)l ensemble [...] Read more.
The effect of the projected 21st century climate change on water quality in Old Woman Creek (OWC) watershed was evaluated using the Soil and Water Assessment Tool (SWAT) and the precipitation and temperature projections from three best Global Climate Circulation Model (GCM)l ensemble downloaded from the Coupled Model Intercomparison Project Phase 5 (CMIP5). These three best GCMs (GFDL-ESM2M, MPI-ESM-MR, EC-EARTH) were identified as those closest to the multivariate ensemble average of twenty different GCM-driven SWAT simulations. Seasonal analysis was undertaken in historical (1985–2014), current to near future (2018–2045), mid-century (2046–2075), and late-century (2076–2100) climate windows. The hydrological model calibration was carried out using a multi-objective evolutionary algorithm and pareto optimization. Simulations were made for stream flow and nine water quality variables (sediment, organic nitrogen, organic phosphorus, mineral phosphorus, chlorophyll a, carbonaceous biochemical oxygen demand, dissolved oxygen, total nitrogen, and total phosphorus) of interest. The average of twenty different CMIP5-driven SWAT simulation results showed good correlation for all the 10 variables with the PRISM-driven SWAT simulation results in the historical climate window (1985–2014). For the historical period, the result shows an over-estimation of flow, sediment, and organic nitrogen from January to March in simulations with CMIP5 inputs, relative to simulations with PRISM input. For the other climate windows, the simulation results show a progressive increase in stream flow with peak flow month shifting from April to March. The expected seasonal changes in each water quality variable have implications for the OWC estuary and Lake Erie water quality. Full article
(This article belongs to the Special Issue The Water Security and Management under Climate Change)
Show Figures

Figure 1

12 pages, 2563 KiB  
Article
Where to Go or Where Not to Go—A Method for Advising Communities during Extreme Temperatures
by Helena Madureira, Ana Monteiro and Sara Cruz
Climate 2021, 9(3), 49; https://0-doi-org.brum.beds.ac.uk/10.3390/cli9030049 - 19 Mar 2021
Cited by 7 | Viewed by 3587
Abstract
Climate change is producing more extremes and increasing the number and magnitude of risks that impact people’s lives, so identifying and understanding local climate risks is a long but essential process for defining adaptation strategies. The availability of technologies to sensitize and educate [...] Read more.
Climate change is producing more extremes and increasing the number and magnitude of risks that impact people’s lives, so identifying and understanding local climate risks is a long but essential process for defining adaptation strategies. The availability of technologies to sensitize and educate people about risks, and to assist people with becoming active observers and monitors of climatic elements has helped to promote permanent surveillance and proactive attitudes towards climatic phenomena that lead to undesirable risks. This paper proposes a methodological approach to guide citizens moving around the city when extreme temperatures occur, minimizing climatic risks and negative health comes, using a very simple method based on Landsat 8 temperature data images at a subsection spatial scale level. The results obtained indicate the places of higher extreme temperatures risks, as well as some of the potential places that people can use to protect themselves. This work demonstrates the value of mapping climatic factors at a local scale and deliver tailored and accurate maps with the places suitable for alleviating bioclimatic stresses and the places that should be avoided. Full article
Show Figures

Figure 1

23 pages, 4474 KiB  
Article
Assessment of the Urban Heat Island Impact on Building Energy Performance at District Level with the EUReCA Platform
by Pierdonato Romano, Enrico Prataviera, Laura Carnieletto, Jacopo Vivian, Michele Zinzi and Angelo Zarrella
Climate 2021, 9(3), 48; https://0-doi-org.brum.beds.ac.uk/10.3390/cli9030048 - 16 Mar 2021
Cited by 15 | Viewed by 4494
Abstract
In recent decades, the cooling energy demand in urban areas is increasing ever faster due to the global warming and the growth of developing economies. In this perspective, the urban building energy modelling community is focusing its research activities on innovative tools and [...] Read more.
In recent decades, the cooling energy demand in urban areas is increasing ever faster due to the global warming and the growth of developing economies. In this perspective, the urban building energy modelling community is focusing its research activities on innovative tools and policy actions to improve cities’ sustainability. This work aims to present a novel module of the EUReCA (Energy Urban Resistance Capacitance Approach) platform for evaluating the effects of the interaction between district’s buildings in the cooling season. EUReCA predicts the urban energy demand using a bottom-up approach and low computational resources. The new module allows us to evaluate the mutual shading between buildings and the urban heat island effects, and it is well integrated with the calculation of the energy demand of buildings. The analysis was carried out considering a real case study in Padua (Italy). Results show that the urban heat island causes an average increase of 2.2 °C in the external air temperature mainly caused by the waste heat rejected from cooling systems. This involves an increase in urban cooling energy and electricity demand, which can be affected between 6 and 8%. The latter is the most affected by the urban heat island (UHI), due to the degradation it causes on the HVAC systems’ efficiency. Full article
Show Figures

Figure 1

24 pages, 4948 KiB  
Article
Exploring Short-Term Climate Change Effects on Rangelands and Broad-Leaved Forests by Free Satellite Data in Aosta Valley (Northwest Italy)
by Tommaso Orusa and Enrico Borgogno Mondino
Climate 2021, 9(3), 47; https://0-doi-org.brum.beds.ac.uk/10.3390/cli9030047 - 15 Mar 2021
Cited by 35 | Viewed by 3660
Abstract
Satellite remote sensing is a power tool for the long-term monitoring of vegetation. This work, with reference to a regional case study, investigates remote sensing potentialities for describing the annual phenology of rangelands and broad-leaved forests at the landscape level with the aim [...] Read more.
Satellite remote sensing is a power tool for the long-term monitoring of vegetation. This work, with reference to a regional case study, investigates remote sensing potentialities for describing the annual phenology of rangelands and broad-leaved forests at the landscape level with the aim of detecting eventual effects of climate change in the Alpine region of the Aosta Valley (Northwest (NW) Italy). A first analysis was aimed at estimating phenological metrics (PMs) from satellite images time series and testing the presence of trends along time. A further investigation concerned evapotranspiration from vegetation (ET) and its variation along the years. Additionally, in both the cases the following meteorological patterns were considered: air temperature anomalies, precipitation trends and the timing of yearly seasonal snow melt. The analysis was based on the time series (TS) of different MODIS collections datasets together with Climate Hazards Group InfraRed Precipitation with Station data (CHIRPS) collection obtained through Google Earth Engine. Ground weather stations data from the Centro Funzionale VdA ranging from 2000 to 2019 were used. In particular, the MOD13Q1 v.6, MOD16A2 and MOD10A1 v.6 collections were used to derive PMs, ET and snow cover maps. The SRTM (shuttle radar topography mission) DTM (digital terrain model) was also used to describe local topography while the Coordination of Information on the Environment (CORINE) land cover map was adopted to investigate land use classes. Averagely in the area, rangelands and broad-leaved forests showed that the length of season is getting longer, with a general advance of the SOS (start of the season) and a delay in the EOS (end of the season). With reference to ET, significant increasing trends were generally observed. The water requirement from vegetation appeared to have averagely risen about 0.05 Kg·m−2 (about 0.5%) per year in the period 2000–2019, for a total increase of about 1 Kg·m−2 in 20 years (corresponding to a percentage difference in water requirement from vegetation of about 8%). This aspect can be particularly relevant in the bottom of the central valley, where the precipitations have shown a statistically significant decreasing trend in the period 2000–2019 (conversely, no significant variation was found in the whole territory). Additionally, the snowpack timing persistence showed a general reduction trend. PMs and ET and air temperature anomalies, as well as snow cover melting, proved to have significantly changed their values in the last 20 years, with a continuous progressive trend. The results encourage the adoption of remote sensing to monitor climate change effects on alpine vegetation, with particular focus on the relationship between phenology and other abiotic factors permitting an effective technological transfer. Full article
(This article belongs to the Special Issue The Interaction of Climate Change with Landscape and Environment)
Show Figures

Figure 1

18 pages, 3585 KiB  
Article
Climate Services for Renewable Energy in the Nordic Electricity Market
by Kirsten Halsnæs, Lisa Bay, Per Skougaard Kaspersen, Martin Drews and Morten Andreas Dahl Larsen
Climate 2021, 9(3), 46; https://0-doi-org.brum.beds.ac.uk/10.3390/cli9030046 - 12 Mar 2021
Cited by 4 | Viewed by 3894
Abstract
To limit global warming to less than 2 °C requires a low-carbon transition with very large shares of renewables. Options such as wind, solar and hydro are influenced by both short and longer-term weather and climate variability. While still subject to natural and [...] Read more.
To limit global warming to less than 2 °C requires a low-carbon transition with very large shares of renewables. Options such as wind, solar and hydro are influenced by both short and longer-term weather and climate variability. While still subject to natural and anthropogenic climate forcing and fluctuating energy prices, water reservoirs can dually operate as storage and production facilities and serve to balance the more volatile production capacity from solar and wind. This paper assesses the dynamics and demands of the hydro-dominated Nordic electricity system and market and identifies untapped potential for climate services based on a combination of literature-based research, documented stakeholder needs and data sources on historical and future conditions. A critical need for both improving the appropriateness and reliability of existing climate services and for developing new tailored solutions for a broader group of stakeholders from the renewable energy sector in the Nordics is observed. The quantification of uncertainties related to short-term weather forecasts and longer-term climate predictions is also found to be important for minimizing the financial risk in relation to systems management and to overall investments in renewable energy. Full article
Show Figures

Figure 1

21 pages, 5047 KiB  
Article
Cooling Energy Use Reduction in Residential Buildings in Egypt Accounting for Global Warming Effects
by Mohammad Abdollah Fadel Abdollah, Rossano Scoccia, Giulia Filippini and Mario Motta
Climate 2021, 9(3), 45; https://0-doi-org.brum.beds.ac.uk/10.3390/cli9030045 - 10 Mar 2021
Cited by 4 | Viewed by 3647
Abstract
Residential and commercial buildings are responsible for almost 50% of the total electricity consumption in Egypt. This percentage is expected to increase due to the global warming effect. This work deals with the cooling energy use reduction strategies for residential buildings compatible with [...] Read more.
Residential and commercial buildings are responsible for almost 50% of the total electricity consumption in Egypt. This percentage is expected to increase due to the global warming effect. This work deals with the cooling energy use reduction strategies for residential buildings compatible with the Egyptian market accounting for the global warming effects. A study in the Egyptian market was done to explore the best available technologies in the Egyptian market. A series of dynamic simulations were executed in each city to optimize the building envelope using the best available technologies to reduce the cooling needs. Financial, energetic and environmental factors were taken into consideration, and comparative analysis was done to assess the best alternatives. The double wall with air gap and insulation on the outside was found to be the best alternative in all the cities. Moreover, simple measures to further reduce the cooling energy need were explored, such as the usage of more efficient lighting and night ventilation. This work led to an average reduction of 40% in the cooling energy needs and CO2 emissions across the three cities, with a maximum discounted payback period down to 6.3 years. Future weather files adapted to climate change were generated, and the selected passive strategies were tested to assess the validity of such strategies in the future. The cooling energy needs are expected to increase by 39%, while the peak cooling loads are also expected to increase by 23% by 2080, rendering the current installed HVAC systems undersized. Full article
Show Figures

Figure 1

19 pages, 11358 KiB  
Article
Changes in Frequency and Location of East Coast Low Pressure Systems Affecting Southeast Australia
by Milton Speer, Lance Leslie, Joshua Hartigan and Shev MacNamara
Climate 2021, 9(3), 44; https://0-doi-org.brum.beds.ac.uk/10.3390/cli9030044 - 05 Mar 2021
Cited by 4 | Viewed by 4074
Abstract
Low pressure systems off the southeast coast of Australia can generate intense rainfall and associated flooding, destructive winds, and coastal erosion, particularly during the cool season (April–September). Impacts depend on coastal proximity, strength and latitude. Therefore, it is important to investigate changes in [...] Read more.
Low pressure systems off the southeast coast of Australia can generate intense rainfall and associated flooding, destructive winds, and coastal erosion, particularly during the cool season (April–September). Impacts depend on coastal proximity, strength and latitude. Therefore, it is important to investigate changes in frequency, duration, location, and intensity of these systems. First, an existing observation-based database of these low pressure systems, for 1970–2006, is extended to 2019, focusing on April–September and using archived Australian Bureau of Meteorology MSLP charts. Second, data consistency between 1970 and 2006 and 2007 and 2019 is confirmed. Third, permutation testing is performed on differences in means and variances between the two 25-year intervals 1970–1994 and 1995–2019. Additionally, trends in positions, durations and central pressures of the systems are investigated. p-values from permutation tests reveal statistically significant increases in mean low pressure system frequencies. Specifically, a greater frequency of both total days and initial development days only, occurred in the latter period. Statistically significant lower variance for both latitude and longitude in systems that developed in both subtropical easterly and mid-latitude westerly wind regimes indicate a shift south and east in the latter period. Furthermore, statistically significant differences in variance of development location of explosive low pressure systems that develop in a low level easterly wind regime indicate a shift further south and east. These changes are consistent with fewer systems projected to impact the east coast. Finally, important changes are suggested in the large scale atmospheric dynamics of the eastern Australian/Tasman Sea region. Full article
(This article belongs to the Special Issue Extreme Weather Events)
Show Figures

Figure 1

21 pages, 6174 KiB  
Article
Synoptic Climatology of Lake-Effect Snow Events off the Western Great Lakes
by Jake Wiley and Andrew Mercer
Climate 2021, 9(3), 43; https://0-doi-org.brum.beds.ac.uk/10.3390/cli9030043 - 05 Mar 2021
Cited by 3 | Viewed by 2904
Abstract
As the mesoscale dynamics of lake-effect snow (LES) are becoming better understood, recent and ongoing research is beginning to focus on the large-scale environments conducive to LES. Synoptic-scale composites are constructed for Lake Michigan and Lake Superior LES events by employing an LES [...] Read more.
As the mesoscale dynamics of lake-effect snow (LES) are becoming better understood, recent and ongoing research is beginning to focus on the large-scale environments conducive to LES. Synoptic-scale composites are constructed for Lake Michigan and Lake Superior LES events by employing an LES case repository for these regions within the U.S. North American Regional Reanalysis (NARR) data for each LES event were used to construct synoptic maps of dominant LES patterns for each lake. These maps were formulated using a previously implemented composite technique that blends principal component analysis with a k-means cluster analysis. A sample case from each resulting cluster was also selected and simulated using the Advanced Weather Research and Forecast model to obtain an example mesoscale depiction of the LES environment. The study revealed four synoptic setups for Lake Michigan and three for Lake Superior whose primary differences were discrepancies in a surface pressure dipole structure previously linked with Great Lakes LES. These subtle synoptic-scale differences suggested that while overall LES impacts were driven more by the mesoscale conditions for these lakes, synoptic-scale conditions still provided important insight into the character of LES forcing mechanisms, primarily the steering flow and air–lake thermodynamics. Full article
(This article belongs to the Special Issue Extreme Weather Events)
Show Figures

Figure 1

14 pages, 944 KiB  
Article
Ecoenergetic Comparison of HVAC Systems in Data Centers
by Alexandre F. Santos, Pedro D. Gaspar and Heraldo J. L. de Souza
Climate 2021, 9(3), 42; https://0-doi-org.brum.beds.ac.uk/10.3390/cli9030042 - 04 Mar 2021
Cited by 12 | Viewed by 3180
Abstract
The topic of sustainability is of high importance today. Global efforts such as the Montreal Protocol (1987) and the Kigali Amendment (2016) are examples of joint work by countries to reduce environmental impacts and improve the level of the ozone layer, the choice [...] Read more.
The topic of sustainability is of high importance today. Global efforts such as the Montreal Protocol (1987) and the Kigali Amendment (2016) are examples of joint work by countries to reduce environmental impacts and improve the level of the ozone layer, the choice of refrigerants and air conditioning systems, which is essential for this purpose. But what indicators are to be used to measure something so necessary? In this article, the types of air conditioning and GWP (Global Warming Potential) levels of equipment in the project phase were discussed, the issue of TEWI (Total Equivalent Warming Impact) that measures the direct and indirect environmental impacts of refrigeration equipment and air conditioning and a new methodology for the indicator was developed, the TEWI DC (DC is the direct application for Data Center), and using the formulas of this new adapted indicator it was demonstrated that the TEWI DC for Chicago (USA) was 2,784,102,640 kg CO2/10 years and Curitiba (Brazil) is 1,252,409,640 kg CO2/10 years. This difference in value corresponds to 222.30% higher annual emissions in Chicago than in Curitiba, showing that it is much more advantageous to install a Data Center in Curitiba than in Chicago in terms of environmental impact. The TEWI indicator provides a more holistic view, helping to combine energy and emissions into the same indicator. Full article
Show Figures

Figure 1

5 pages, 819 KiB  
Communication
Who Is Responsible for Embodied CO2?
by Hans Sanderson
Climate 2021, 9(3), 41; https://0-doi-org.brum.beds.ac.uk/10.3390/cli9030041 - 02 Mar 2021
Cited by 4 | Viewed by 2587
Abstract
With the Paris Agreement, countries are obliged to report greenhouse gas (GHG) emission reductions, which will ensure that the global temperature increase is maintained well below 2 °C. The parties will report their nationally determined contributions (NDCs) in terms of plans and progress [...] Read more.
With the Paris Agreement, countries are obliged to report greenhouse gas (GHG) emission reductions, which will ensure that the global temperature increase is maintained well below 2 °C. The parties will report their nationally determined contributions (NDCs) in terms of plans and progress towards these targets during the postponed COP26 (Conference of the Parties under the UNFCCC) in Glasgow in November 2021. These commitments, however, do not take significant portions of the consumption-related emissions related to countries imports into account. Similarly, the majority of companies that report their emissions to CDP (Formerly Carbon Disclosure Project) also do not account for their embodied value-chain-related emissions. Municipalities, on the path towards carbon neutrality in accordance with the methods outlined by C40, also do not include imported and embodied CO2 in their total emission tallies. So, who is responsible for these emissions—the producer or the consumer? How can we ensure that the NDCs, municipalities’ and companies’ reduction targets share the responsibility of the emissions in the value chain, thus ensuring that targets and plans become sustainable, climate fair, and just in global value chains? Today the responsibility lays with the producer, which is not sustainable. We have the outline for the tools needed to quantify and transparently share the responsibility between producers and consumers at corporate, municipal and national levels based on an improved understanding of the attendant sources, causes, flows and risks of GHG emissions globally. Hybrid life cycle analysis/environmentally extended input–output (LCA/EEIO) models can for example be further developed. This will, in the end, enable everyday consumption to support a more sustainable, green and low carbon transition of our economy. Full article
Show Figures

Figure 1

25 pages, 8640 KiB  
Article
Observed and Projected Changes in Temperature and Precipitation in the Core Crop Region of the Humid Pampa, Argentina
by Gabriela V. Müller, Miguel A. Lovino and Leandro C. Sgroi
Climate 2021, 9(3), 40; https://0-doi-org.brum.beds.ac.uk/10.3390/cli9030040 - 27 Feb 2021
Cited by 8 | Viewed by 3543
Abstract
The core crop region of the Humid Pampa is one of the most productive agricultural lands around the world and depends highly on climate conditions. This study assesses climate variability, climate extremes, and observed and projected climate changes there, using 1911–2019 observations and [...] Read more.
The core crop region of the Humid Pampa is one of the most productive agricultural lands around the world and depends highly on climate conditions. This study assesses climate variability, climate extremes, and observed and projected climate changes there, using 1911–2019 observations and CMIP5 model simulations. Since 1970, the annual mean temperature has risen by 1 °C and the mean annual minimum and maximum temperatures by 2 and 0.5 °C, respectively. The frequency of warm days and nights increased, and cold days and nights decreased. Heatwaves became longer and more intense, and cold waves decreased with less frost events. Annual precipitation increased by 10% from 1911, mainly in summer, and years with excess precipitation outnumbered those with a deficit. Both intense precipitation events and consecutive dry days grew, suggesting more annual precipitation falling on fewer days. Projections show a warming of 1 °C by 2035, regardless of the scenario. From then on until 2100, mean temperature will increase by 2 and 3–3.5 °C in the RCP4.5 and RCP8.5 scenarios, respectively. Annual precipitation will grow 8 and 16% from current values by 2100 in the RCP4.5 and RCP8.5 scenarios, respectively. No major precipitation changes are projected in the RCP2.6 scenario. Full article
(This article belongs to the Special Issue Climate Change and Land)
Show Figures

Figure 1

13 pages, 3053 KiB  
Article
The Stationary Concentrated Vortex Model
by Oleg Onishchenko, Viktor Fedun, Wendell Horton, Oleg Pokhotelov, Natalia Astafieva, Samuel J. Skirvin and Gary Verth
Climate 2021, 9(3), 39; https://0-doi-org.brum.beds.ac.uk/10.3390/cli9030039 - 26 Feb 2021
Cited by 2 | Viewed by 2410
Abstract
A new model of an axially-symmetric stationary concentrated vortex for an inviscid incompressible flow is presented as an exact solution of the Euler equations. In this new model, the vortex is exponentially localised, not only in the radial direction, but also in height. [...] Read more.
A new model of an axially-symmetric stationary concentrated vortex for an inviscid incompressible flow is presented as an exact solution of the Euler equations. In this new model, the vortex is exponentially localised, not only in the radial direction, but also in height. This new model of stationary concentrated vortex arises when the radial flow, which concentrates vorticity in a narrow column around the axis of symmetry, is balanced by vortex advection along the symmetry axis. Unlike previous models, vortex velocity, vorticity and pressure are characterised not only by a characteristic vortex radius, but also by a characteristic vortex height. The vortex structure in the radial direction has two distinct regions defined by the internal and external parts: in the inner part the vortex flow is directed upward, and in the outer part it is downward. The vortex structure in the vertical direction can be divided into the bottom and top regions. At the bottom of the vortex the flow is centripetal and at the top it is centrifugal. Furthermore, at the top of the vortex the previously ascending fluid starts to descend. It is shown that this new model of a vortex is in good agreement with the results of field observations of dust vortices in the Earth’s atmosphere. Full article
Show Figures

Figure 1

Previous Issue
Next Issue
Back to TopTop