Article

The Occurrence of Drought in Mopani District Municipality, South Africa: Impacts, Vulnerability and Adaptation

1
Department of Geography and Geo-Information Sciences, University of Venda, Thohoyandou 0950, South Africa
2
Unit for Environmental Sciences and Management, Faculty of Natural and Agricultural Sciences, North-West University, Vanderbijlpark 1900, South Africa
3
Department of Geography, University of South Africa, Science Campus, Florida 1709, South Africa
4
Division of Nature, Forest and Landscape, KU Leuven, 3000 Leuven, Belgium
*
Author to whom correspondence should be addressed.
Submission received: 5 February 2021 / Revised: 28 March 2021 / Accepted: 30 March 2021 / Published: 9 April 2021
(This article belongs to the Special Issue Assessment of Climate Change Impacts on Flood and Drought)

Abstract

:
Mopani District Municipality in the northeast of South Africa is largely semi-arid and frequently affected by meteorological droughts. The recent 2015/16 event had devastating impacts on water levels, crop yields, livestock herds and rural livelihoods. We investigated the nature of the drought hazard; its impacts, including vulnerability of rural communities in Mopani District and adaptation strategies they have employed to cope with drought. A mixed methods approach with both quantitative and qualitative datasets was used. The district was divided into two distinct climatic areas: the drier eastern lowveld and the wetter western bushveld. Questionnaires were administered among community members whilst key informant interviews were conducted among relevant government and municipal officials. Climate data was used to characterize historical drought using a Standardized Precipitation and Evapotranspiration Index whilst vegetation anomaly maps were used to demonstrate impacts. Spatially distinct patterns of drought conditions were evident with harsh and dry conditions towards the east. It was found that nearly half the time there is some form of drought or another in the district mostly linked to the remote El Nino phenomenon. In several areas, rain-fed agriculture is no longer tenable, with a direct impact on rural livelihoods. A Household Vulnerability Index determined variable levels of vulnerability such that different strategies are employed to adapt to drought some of which cause environmental problems. Local government intervention strategies include supply of seeds and fertilisers, providing cheap fodder and supplying water using trucks. The findings of this study contribute to disaster risk reduction efforts in a region that is highly vulnerable to current and future climate-risks.

1. Introduction

Drought is a normal recurring aspect of climate variability experienced globally particularly in the semi-arid subtropics. According to the Koppen climate classification, South Africa’s Limpopo Province in the northeast is classified as mainly semi-arid, making it vulnerable to drought hazards [1]. In a country with an annual average rainfall of 450 mm, which is way below the global annual rainfall of 860 mm, any disturbance in rainfall patterns can bring profound impacts on communities’ livelihoods and environment [2]. The rainfall distribution in Limpopo Province is characterised by high spatial and temporal variability [3] which may be partially attributed to strong spatial gradients in elevation in the area. During the 1991/92 austral summer rainfall season, the region encountered one of worst droughts which affected most smallholder famers’ income in negative ways and increased the food import rates [4].
The Mopani District Municipality in Limpopo is comprised of distinct climatic conditions that vary spatially from the wet western bushveld to the drier eastern lowveld. The region was also badly affected by the tropical cyclone Dando in 2012, which caused floods that claimed lives and losses in tourism and agriculture [5,6]. This was followed by a tropical continental low in 2013 which also caused floods in the lowveld. More recently, the 2015/16 El Nino drought season has become the hottest drought period on record and one of the driest, accounting for significant damage to livelihoods and economic development [7,8]. In this district, the impact of this drought event was greatest on the eastern lowveld. Thus, the district is characterized by a high coefficient of variability amid recurrent extreme events, with alternating flood and drought events.
The intrinsic nature of drought has made understanding, monitoring and evaluating adaptation to drought hazards difficult. In addition, identifying the onset of drought conditions is more difficult than with other natural hazards, as it usually occurs due to many factors which become apparent only after a prolonged period of little or no precipitation [9,10]. The difficulties are also experienced while determining the drought onset, extent and fate [11]. Adaptation remains the most valued option for research and assessment in responding to climate change [12,13]. However, few studies have evaluated the effectiveness of adaptation strategies, which may be region specific. Many have simply focused on describing how communities are adapting to the impacts of climate variability and change.
Disruption of social cohesion affects the adaptation capacity of every society [14]. The use of traditional approaches remains one of the most successful attempts to conquer climate change threats in many societies [15] even though in some regions old livelihoods are becoming less sustainable in a new climate dominated by weather and climate extremes.
Thus, the aim of this study was to investigate the occurrence of drought in Mopani District Municipality analysing its impacts, including how rural communities are living with drought. The levels of vulnerability to drought impacts are also evaluated via a household vulnerability index.

2. Study Area

This study was conducted across communities in Mopani District Municipality, which lies in South Africa’s northern Limpopo Province. The district has a total population of 1,092,507 and 296,320 households [16]. It is comprised of five local municipalities: Greater Letaba; Greater-Tzaneen; Greater-Giyani; Ba-Phalaborwa and Maruleng Local Municipality as shown in Figure 1. The decision to focus on all five local municipalities was guided by the climatic conditions across the district. It is a subtropical region with warm temperatures all year round [6], receiving an aerial average of 500 mm annual rainfall during the austral summer between October and March. The greater portion of Mopani District Municipality is made up of rural communities under subsistence livelihood.
The district is rich in arable land particularly in the west, which allows for extensive commercial farming, dominated by eucalyptus plantations (Figure 2A) which have high soil water requirements. Horticulture is highly notable in the area, with fruit production for international markets. It is shown in Figure 2A that most of the cultivated land and residential areas are located in the western half of the district, with woodlands and grasslands in the east. The eastern border of Mopani District Municipality which lies in the lowveld forms part of the Kruger National Park conservation hub [6]. Agriculture and tourism are the main economic activities in the district, with a tourism sector that is based on nature, it covers game farms, national park and nature reserves [17].
Mopani District Municipality experiences spatially distinct climatic conditions which are also influenced by the extensive topographic variation (Figure 2B). The mean altitude of the eastern lowveld is about 436 m whilst that of the western bushveld averages 811 m above mean sea level separated by the north-eastern escarpment. On the western end the highest elevation is higher than 1800 m falling to below 400 m in the river valleys of the eastern end (Figure 2B). Thus, the land uses and land cover types in the region are influenced by climatic conditions, topography, soil type and accessibility. There are also patches of bare soil and water bodies across the district, and some of the major dams in the district include Nsami Dam, Dap Naude Dam, Middle Letaba Dam and Tzaneen Dam.

3. Material and Methods

3.1. Meteorological Data

Rainfall is important for renewal of the global energy and water cycle, precise information about precipitation reaching the land surface is crucial for freshwater assessment and drought risk reduction [7,18]. Due to the absence of a long-term meteorological station records in the district, the Global Precipitation Climatology Center (GPCC) monthly rainfall data was obtained from the NCEP/NCAR through internet-based KNMI Climate Explorer tool (https://climexp.knmi.nl/start.cgi accessed online 7 June 2018). The GPCC data was employed to avoid uncertainties brought by gaps in observed station data. It provides data in different resolutions, ranging from 0.25° × 0.25°, 0.5° × 0.5°, 1° × 1° and 2.5° × 2.5° [18]. The monthly GPCC rainfall data used in this study was taken at the resolution of 0.25° × 0.25° across the district. GPCC is a gridded dataset which is continuous over space and time and was analysed here for the period from 1980–2016. Rainfall station data from South African Weather Service (SAWS) and Agricultural Research Council (ARC) was also analysed to validate the satellite data for the recent period.
Monthly records of minimum and maximum temperature were obtained from University of East Anglia’s Climate Research Unit (CRU) through the internet-based KNMI Climate Explorer tool (https://climexp.knmi.nl/start.cgi accessed online 9 June 2018). The CRU data obtained at a resolution of 0.25° × 0.25°was also selected to avoid gaps and errors associated with meteorological station datasets. The temperature records were used to determine the impact on drought and potential evapotranspiration of this region from 1980–2016. Through temperature records the impact of global warming and climate change on drought severity were also determined particularly on the most recent drought events. Temperature station data from SAWS and ARC were also analysed to validate the satellite estimates and the results showed good agreement correlations between 0.72 and 0.79. This analysis was only done for the period 2000–2016, for which the station data are continuous.

3.2. Standardized Precipitation Evapotranspiration Index

To characterize drought in Mopani District, the Standardized Precipitation Evapotranspiration Index (SPEI) was calculated which is superior to the original Standardized Precipitation Index (SPI) as it uses both precipitation and potential evapotranspiration (PET) data [19]. From this, a climatic water balance can be determined at different time scales. Drought in South Africa is often accompanied by high surface temperatures and heat waves [20] such that the role of evapotranspiration can be significant. SPEI calculation took into account the precipitation and temperature data mentioned in 3.1 above using the [21] formulae. Four categories of drought intensity can be determined when SPEI values are negative from mild drought to extreme drought (Table 1). Values of SPEI greater than zero indicate no drought.

3.3. Normalized Difference Vegetation Index

Vegetation indices from the spectral reflectance of remotely sensed data in the near infrared and visible bands have been used in several applications for years. The applications include monitoring vegetation health condition; vegetation cover mapping and ecosystem change detection [22]. Vegetation indices can also be used to assess the relationship between climate variability and terrestrial conditions, such as impacts of drought, evapotranspiration and heat waves [23].
MODIS vegetation data was obtained from the United States Geological Survey’s Land Processes Distributed Active Archive Centre (LP DAAC) website (http://lpdaac.usgs.gov accessed online 7 June 2018). MODIS vegetation indices have been used widely and they provide reliable spatial and temporal information which allows for terrestrial vegetation condition analysis over a large area [23]. The MODIS estimates are comprised of seven spectral bands specifically designed for land application with spatial resolution ranging from 250 m to 1 km [24]. They allow for intra and inter seasonal comparison of the collected data through frequent repeat cycles over one area [25]. The available MODIS data records only start in year 2000 and the selected resolution for this study is 250 m.
Although there are many vegetation indices, such as the Soil Adjacent Vegetation Index (SAVI) and Enhanced Vegetation Index (EVI), most studies make use of the Normalized Difference Vegetation Index (NDVI) for vegetation monitoring [25]. Advancements in technology have greatly improved the capabilities of NDVI to operate on different spatial and temporal scales [26]
The NDVI scale of measurement ranges from −1.0 and +1.0. For this study, the MODIS NDVI anomalies were used to assess impacts of drought hazards on vegetation and agriculture over time in the five local municipalities of Mopani District Municipality during the 10 year period from 2007 and 2016. Vegetation reflection reveals the phenology and health condition of the vegetation. The green colour of NDVI represents healthy vegetation, while the brownish colour resembles vegetation that is stressed. Flourishing vegetation is directly associated with the availability of soil moisture which is the integrator between rainfall and vegetation health.

3.4. Household Vulnerability Index

After determining the extent of the drought problem in Mopani District via the SPEI analysis, the Household Vulnerability Index (HVI) was employed to assess the levels of vulnerability of selected rural households across the district. The HVI is a statistical tool developed by [27] for measuring the internal and external vulnerability introduced by shocks such as those due to climate change. The vulnerability of different households differs from place to place and with time. Distinct ecological and social conditions of those affected also have an impact on their vulnerability [28].
HVI is equipped to measure the vulnerability of households and communities to hazards such as poverty; HIV and AIDS and extreme weather and climate events such as drought [27]. To assess the extent of vulnerability among households, this study adopted the five Sustainable Livelihoods indicators of vulnerability, i.e., financial status, social status, human capabilities, physical assets and natural assets. The dimensions covered under each of the five sustainable livelihood indicators are shown in Table 2 as adopted from [27].
Validation of the selected indicators was done through the Community-Based Asset Weighting System (CBAW), to allow community members to choose dimensions that contribute the most to their vulnerability. Under CBAW, a scale of 5 was used, where 1 represents mild impact, 2 moderate impact, 3 medium impact, 4 severe impact and 5 extreme impact. CBAW results were then used to assign weight to the indicators, as shown in Table 3.
Data from 121 household questionnaires was captured and used to produce an HVI variable table with 26 households from Greater-Giyani; 24 households from Greater-Letaba; 10 households from Maruleng, 16 households from Ba-Phalaborwa and 45 households from Greater-Tzaneen Local Municipality. The sample size was calculated using the Taro Yamane (1973) formula as shown in Table 4 below.
Each variable was assigned a score at a range between 0 and 1, where 0 means no impact and 1 means full impact. After setting boundaries for each variable, a transformation which was variable-dependent was done. In a well-defined variable case, no impact was given a 0 score and 1 for full impact. However, in the cases of Yes or No responses, subjective assigning of scores was done based on the direction of variable impact. In cases where a variable had more than one response option, the scores were split and 0 meant no impact, 0.25 slight impact, 0.5 typical impact, 0.75 minor impact and 1 for full impact.
After calculating household vulnerability, it is classified into following levels: Coping Level with Low Vulnerability Household (CLH), Acute Level with Moderate Vulnerability Household (ALH) or Emergency Level with High Vulnerability Household (ELH) with respect to the extent of the coping levels [25]. The HVI values were adapted from [29] to match the outcomes from this study and are shown in Table 5.

4. Results

4.1. Rainfall and Temperature Variability

Figure 3 shows that under normal climatic conditions, the main rainy season in Mopani District Municipality occurs during October to March, with the peaks between December and February. These results correspond to findings by [30] where it was revealed that more than 80% of the rainfall in Limpopo Province is received between October and March. Ref. [6] found that the district receives an annual total rainfall of 500 mm between October and March whilst [31] also found similar temporal patterns of summer rainfall over the interior parts of South Africa.
The western bushveld (Mopani West) of the district receives more rainfall as compared to the drier eastern lowveld (Mopani East) as shown in Figure 3. January is the wettest month in the western bushveld receiving a mean monthly rainfall of 136 mm whereas December is the wettest on the eastern lowveld, but with a lower mean of 98 mm/month. Summer rainfall in the district is mainly produced from cloud bands, but sometimes tropical cyclones from the southwest Indian Ocean affect the eastern lowveld. The dry season prevails from April to September with June and August being the driest months such that little or no rainfall occurs during this time. The west-east spatial variability shows distinct gradients mainly due to the presence of a sharp escarpment thus dividing the western bushveld from the eastern lowveld of the district.
The mean maximum temperature for Mopani District Municipality also depicts temporal and spatial differences largely due to topographic factors. Being on low altitude, the Mopani eastern lowveld is warmer with mean monthly maximum temperature of 33.1 °C experienced during January whilst the western bushveld is slightly cooler with average maximum temperature of 29.9 °C between January and February months (Figure 4). The highest temperatures are experienced throughout the summer months which are expected to be hot in subtropical semi-arid regions. Ref. [6] also found that the lowveld of Mopani District Municipality normally experiences higher summer temperatures all year-round, compared to the interior plateau of South Africa. There exists a non-linear relationship between temperature and rainfall which suggests a decrease in rainfall with increasing air temperature. Ref. [32] have projected future increases in surface air temperatures of 3 to 4 °C over the northeast of South Africa, including reduced rainfall, more frequent drought and increased fire risk over the region. The high temperatures prevailing or projected in the eastern lowveld imply high rates of actual evaporation of water from open water bodies and exposed soils, making rain-fed agriculture untenable.

4.2. Drought Characterisation Using SPEI

To characterise the nature of drought conditions across Mopani District Municipality, the SPEI index, which ran through the R-studio was used. It was calculated from 1980 to 2016 for a period of 1 (SPEI 1), 3 (SPEI 3), 6 (SPEI 6) and 12 (SPEI 12) months of the year. We pay more focus on results from SPEI6 in this paper as they correspond to seasonal time scales in the region.
SPEI 1 for one month in both the western bushveld and eastern lowveld showed interannual variability of dry and wet periods from one month to another. The predominant dry period starts from May to October and the wet period starts from November to April, which is similar to a normal dry winter season and wet summer season experienced in semi-arid regions of southern Africa [33]. The moisture differences from one month to another are not much, implicating the limitations of one-month SPEI interval in both the eastern lowveld and western bushveld.
SPEI 3 reflects moisture deficits over a 3-month time scale, representing mid-season moisture conditions [27]. The 3-month time scale is suitable for monitoring soil moisture or rainfall conditions during the growing season [27]. The dry period is much dominant in the first half of the study duration. However, for drought classification and frequency determination, SPEI 6 was used for its suitability to describe a rainy season in southern Africa [27]. 
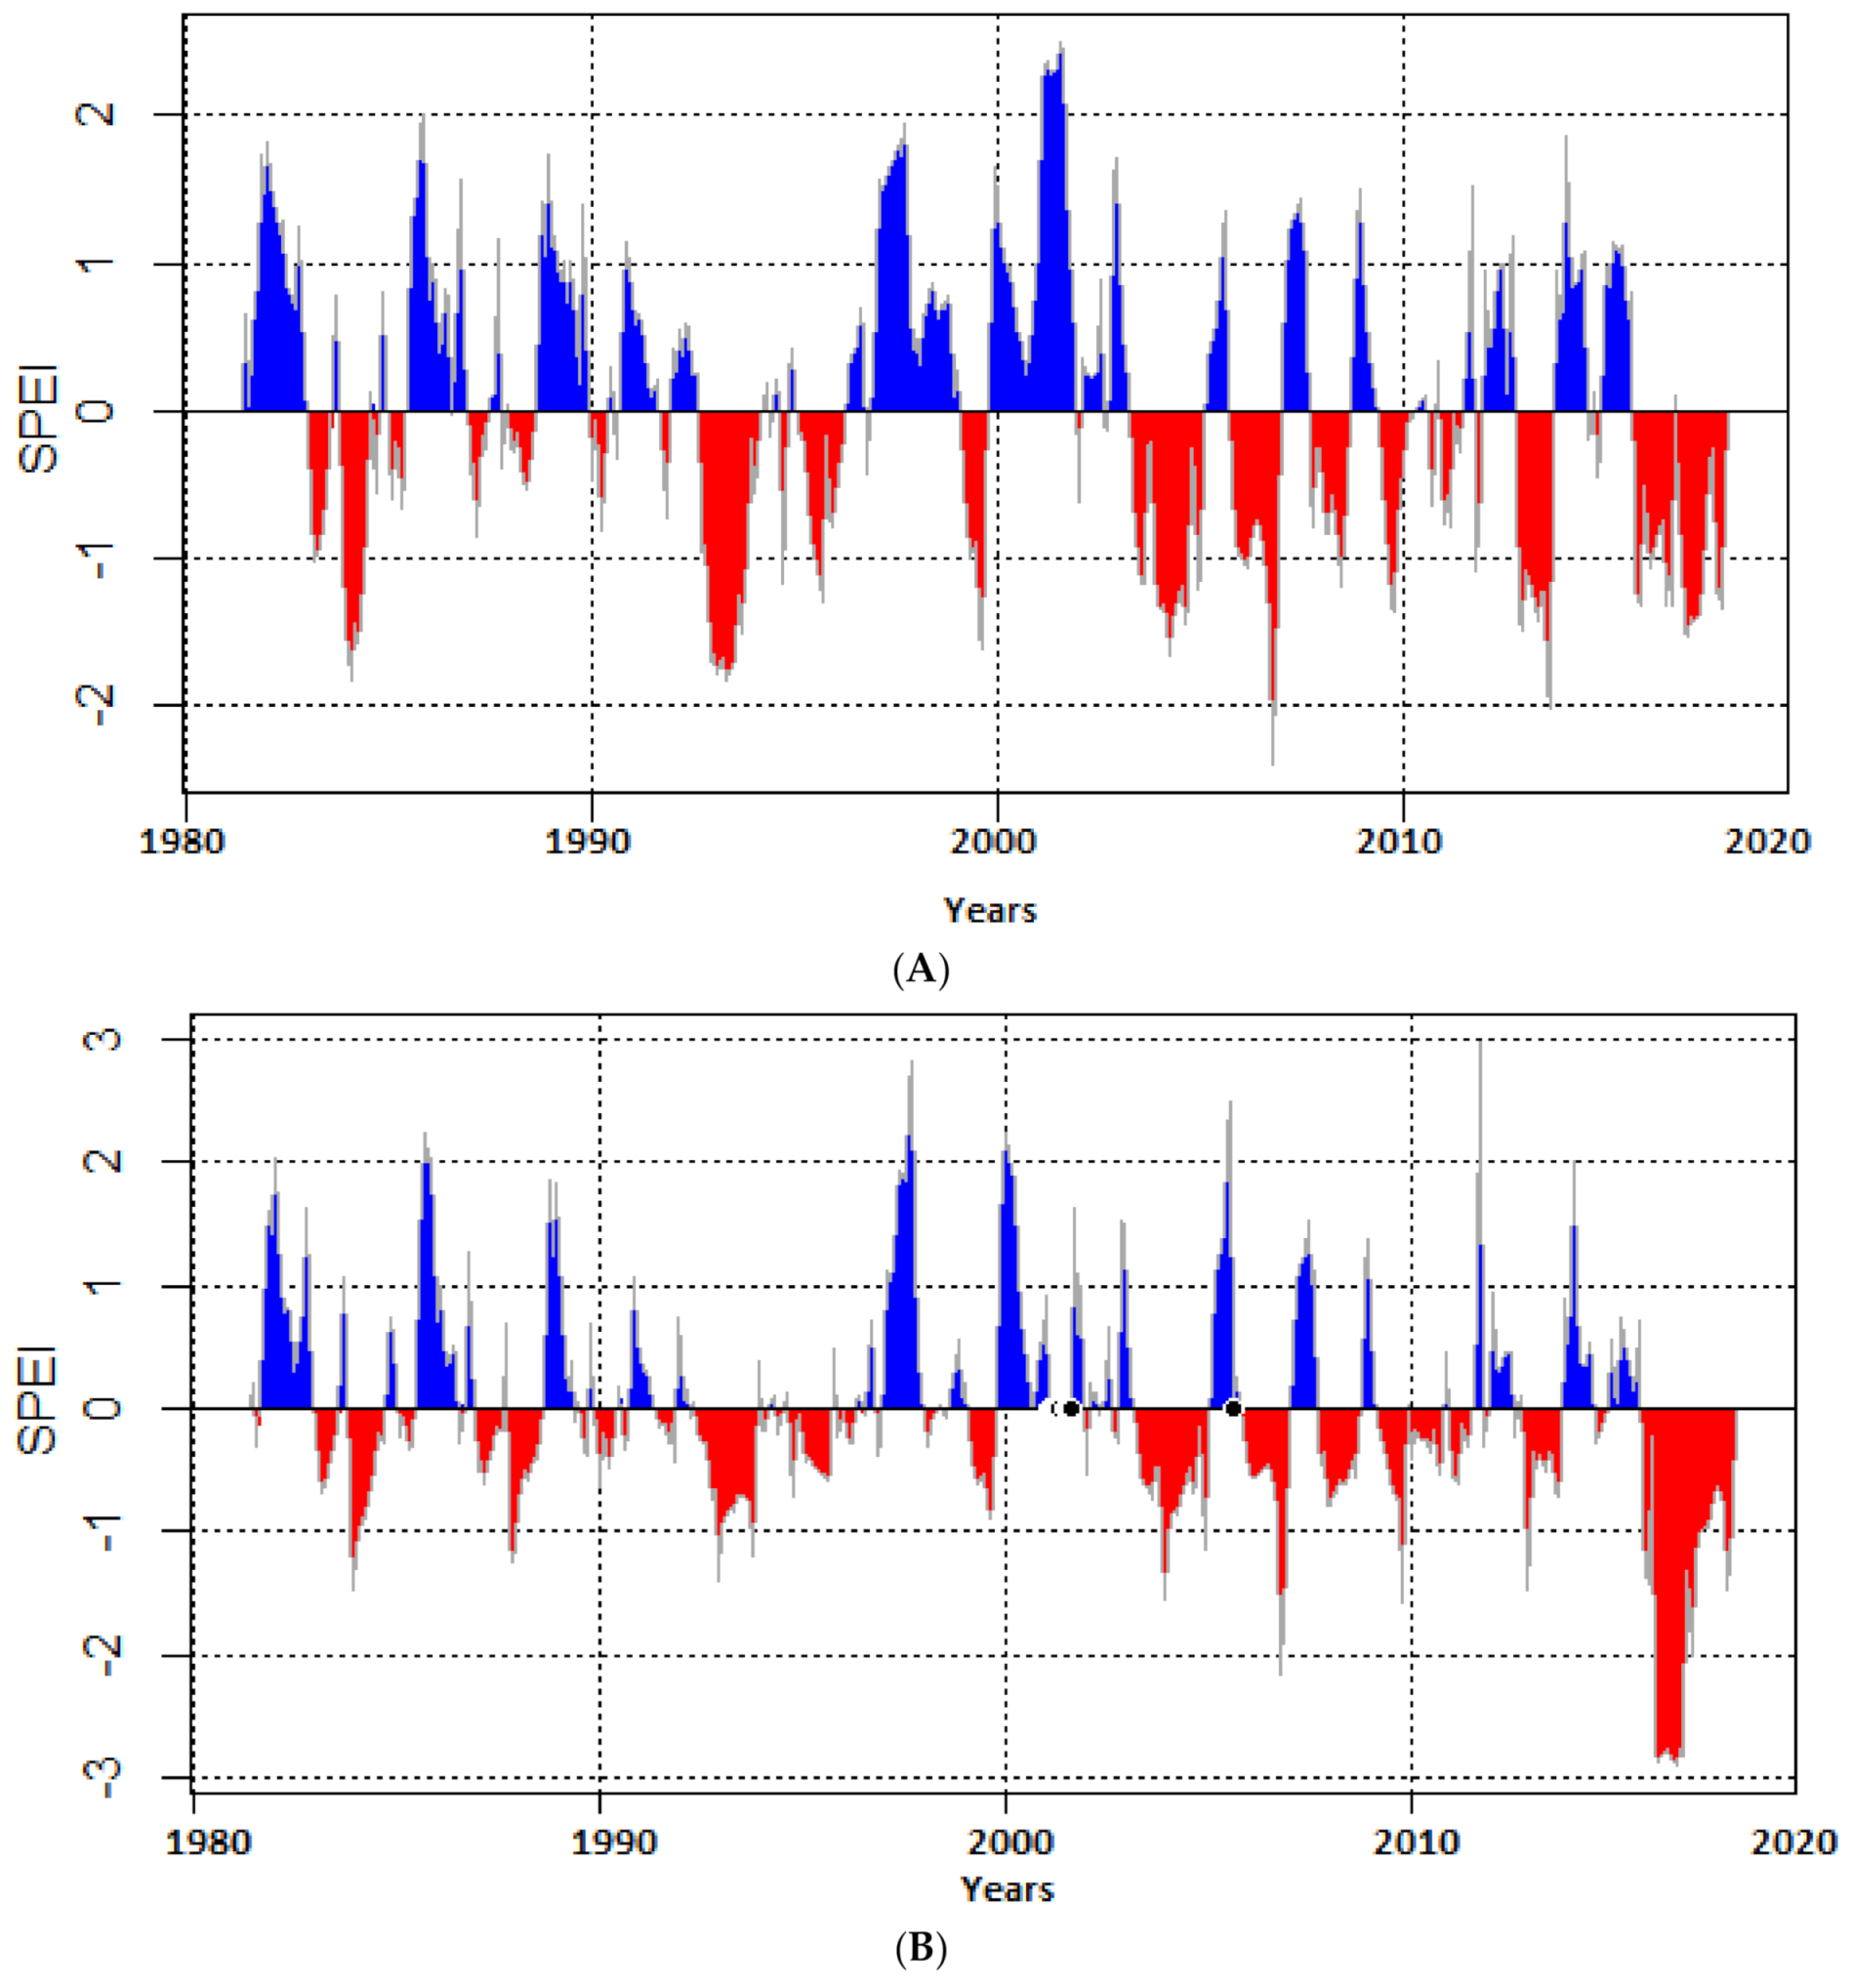
Figure 5A,B shows SPEI 6 for western bushveld and eastern lowveld respectively with significant fluctuation from wet to dry season, but dry events are more dominant. The SPEI 6 time scale ranges between October and March (rainy season), and April to September (dry season) from 1980–2016. The notable drought events were in 1980/81, 1982/83, 1983/84, 1986/87, 1991/92, 1993/94, 1997/98, 2002/03, 2004/05, 2007/08, 2011/12, 2014/15 and 2015/16 (Table 6). The early part of the study period from 1980–1995 was characterized by declining rainfall largely due to frequent droughts in the 1980s and the early 1990s [5].
One of the major droughts that affected Mopani District occurred in 1991/92 which was a severe drought on the west but moderate on the eastern lowveld. Ref. [28], described 1991/92 drought as the worst drought in South Africa and some parts of the Southern African Development Community (SADC). Although this was recorded as the worst drought across many regions in South Africa since 1922, in Mopani District Municipality it was not extreme. The elderly respondents in the study indicated that during 1991/92 drought, they lost large herds of livestock due to water and fodder shortages. Ref. [33] also found that the 1991/92 drought season brought a major set-back on farming across Limpopo Province in areas such as Sekhukhune District Municipality, as small-holder farmers lost their livestock and crops dried out and import rates increased.
In 1993/94 both sides of the district experienced moderate drought, but 1997/98 was a severe drought on the western bushveld while it was a mild drought on eastern lowveld. The season 2002/2003 came with severe drought conditions for the entire district. The first extreme occurred during 2004/05 season in the western bushveld, whereas the eastern lowveld experienced its first extreme in (2007/8) season. About 23 years later after the 1991/92 drought season, South Africa experienced one of the worst droughts ever during the 2015/16 season [7]. This was recorded as a prolonged drought season as the rising temperatures coupled from 2014/2015 drought season which was moderate on the western bushveld and extreme on the eastern lowveld. The 2015/16 drought was extreme in the eastern lowveld and severe in the western bushveld of Mopani District Municipality. The general trend over the years shows an increase in magnitude of drought from the eastern lowveld towards the western bushveld. The western bushveld, which is normally wet, shows more decline in precipitation due to drought, as compared to the arid eastern lowveld.
The occurrence of drought in Limpopo Province is related to a remote phenomenon resulting from fluctuations of sea-surface temperatures (SSTs) in the eastern equatorial Pacific Ocean. The El Nino phenomenon affects patterns of surface air temperatures, air pressure, winds and rainfall across much of the tropics and subtropics [5]. In Limpopo, rainfall is negatively correlated such that periods of El Nino are often periods of drought, hot weather, heat waves, high evaporation and high fire risk. The severe droughts in Mopani District identified in this study using SPEI have occurred during El Nino i.e., 1982/83, 1991/92, 1997/98, 2002/03 and 2015/16 (Table 6). Conversely, La Nina tends to favor higher rainfalls [34] which may lead to flooding in the lowveld through landfalls of tropical cyclones from the southwest Indian Ocean. The effect of El Nino on seasonal rainfall in Limpopo may be evolving and compounding due to rapidly rising surface air temperatures which are themselves also influenced by El Nino. The impacts of ENSO persist during the late summer coinciding with critical growth stages of maize [30]. In the 2015/16 drought season the region experienced the highest mean temperature record of above 33°C. A study by [35] found a strong link between the occurrence of drought and heat waves in southern Africa.

4.3. Drought Frequency in Mopani District Municipality

Since the 1970s climate extremes such as drought and heat waves have increased in frequency and intensity [36]. Furthermore, with advancements in earth system calibration models, [37] concurred that drought incidents across the globe will continue to rise in the 21st century. This brings concerns to livelihoods as [38] found that recurrent drought incidents were linked to famine and high mortality rates in Somalia. In this study drought frequency was determined by calculating the total number of droughts per category within 37-years period of study using SPEI 6. Thus, the total number of drought events that occurred under each category of droughts to determine their frequency in percentage.
Results show that Mopani District Municipality experiences drought of similar frequency on the eastern lowveld and western bushveld (Table 7). The number of seasons with no drought (wet) account for 50.91% on western bushveld and 50.80% on the eastern lowveld. Mild (30,52%) and moderate (13.90%) drought seasons are most frequent on the eastern lowveld. Severe (4,57%) and extreme (0,46%) droughts are rare across the entire district, occurring only rarely over the western bushveld. It can be said that nearly half the time there is some form of drought occurring in some part of Mopani District. Although the western bushveld was described as the cool and wet portion of the district, it was found to be more vulnerable to more severe and extreme droughts. Ref. [5] found that regions of higher average rainfall are more likely to be adversely affected by drought whereas the dry regions suffer less impacts as they are arid already.

4.4. Impacts of Drought on Vegetation Cover

Satellite estimates using different sensors provide more detailed information on the spatial extent of vegetation stress caused by the drought hazard. MODIS NDVI data anomalies were analysed to determine the impacts of drought on vegetation and rangelands. A healthy vegetation will typically exhibit high absorption at the red region due to high chlorophyll content and high reflection at near infrared region due to leaf internal structure [25]. There is a relationship that exists between rainfall and vegetation which can be presented and analysed to depict spatial-temporal variations [34]. Based on data availability, the following recent drought seasons were selected and analysed to show the spatial extent and intensity of the drought impacts: 2007/2008, 2014/2015 and 2015/2016. The analysis focused on the austral summer months from December of one year to the following March, which is the period when most rainfall that is received in this area, when vegetation is expected to flourish.
Despite the drought conditions, the distinct pattern of a greener western bushveld and brown eastern lowveld is clearly discernible for all three seasons, consistent with the rainfall climatology (Figure 6). The dominance of the greener portion towards the west shows that rainfall is generally high in the western bushveld across the study period and low on the eastern lowveld, despite prevailing drought conditions. Reduced vegetation cover during drought implies losses in agricultural (maize) productivity and rangelands which will have impact on grazing fodder and affect rural livestock herds negatively [33].
Of the three drought seasons, the 2015/16 NDVI anomalies show more loss in vegetation cover and health across the district (Figure 6C) which implies greater impact and can also be linked to high evapotranspiration which normally occurs during drought years. An important finding from Figure 6 is that no drought event is the same and their impacts vary across the district from one event to the other. However, we have also shown in Figure 6 that most of the drought impacts occur in the more vulnerable east where rainfall is less reliable and where agriculture is mostly for subsistence and rainfed.

4.5. Extent of Drought Vulnerability in Mopani District Municipality

The HVI was used to measure vulnerability levels across Mopani District Municipality through the five sustainable livelihood indicators (financial assets, physical assets, social assets, human resource and natural assets). The threshold used was 0–10 for coping level (Level 1) households (CLH) of low vulnerability, 11–20 for acute level (Level 2) households (ALH) with moderate vulnerability and 21–30 for emergency level (Level 3) households (ELH) with high vulnerability (Figure 7).
In Ba-Phalaborwa, none of the households in the study sample were on coping level (Figure 5), 81% of the households were facing moderate vulnerability at acute level and 19% of the households are faced with high levels of vulnerability on emergency level. Vulnerability levels in Greater-Giyani, had no household on coping level, 88% on acute level and 12% of the households were on emergency level. In Greater-Letaba, 8% of the households were on coping level, 92% were faced with moderate vulnerability and none of the households were on emergency level. Maruleng had no households with a low level of vulnerability, 70% had a moderate level and 30% had a high vulnerability. The Greater-Tzaneen Local Municipality also had no households with a low-level vulnerability; 98% of the households had moderate vulnerability and 2% were faced with a high level of vulnerability to drought hazards.
Vulnerability levels differ with respect to the livelihood indicators, most of the households reported to be more vulnerable with respect to financial assets. About 29% of the households receive monthly income less than R1000.00 which is not enough for survival under the national poverty line of R547.00 per individual as some of the households are comprised of up to ten dependants [22]. Ref. [39] concurred through findings that revealed Mopani District Municipality as the poorest district in Limpopo Province after comparing the average household incomes. There is a strong relationship between single/divorced respondents and vulnerability who were found to be more vulnerable to drought with values: x 2 = 15.672, df = 6 and p-value = 0.16. The challenges faced during the drought conditions cannot be exclusively linked to natural causes, some of these are exacerbated by conditions which prevail daily as a result of poor service delivery. This agrees with [40] on elevated level of vulnerability in most African countries and low adaptive capacity which is linked to poverty and high reliance on the natural resources for a living.

4.6. Household Adaptation to Drought in Mopani District Municipality

Adaptation strategies employed across households were found to differ from area to area across the district. Some studies have found that the distinct strategies employed for drought adaptation can either be reactive or impulsive [14,33]. In some instances, the questionnaires administered across the district in the five local municipalities revealed some similarities in adaptation routes taken by community members. The success of possible adaptation strategies depends mainly on their flexibility and potential to alleviate the cost of disaster, either physically or financially [41].
About 79% of the households are involved in farming activities, livestock farming, crop farming, or mixed farming. Most (83%) of the households involved in farming had been practising subsistence farming since birth. As community members are forced to find means to adapt to harsh climatic conditions, others have decided to rent out their smallholdings to make some income. However, 18 households were forced to abandon their farmlands due to extreme dry conditions. Five of them were in Tzaneen, three in Maruleng, three in the Greater Giyani, four in Ba-Phalaborwa and three in Greater Letaba Local Municipality.
About 52% of households had means to adapt to extreme conditions, with most (86%) of the respondents preferring to use indigenous routes such as ploughing drought tolerant seeds and crop rotation to survive, while others (14%) were using modern technologies. Ref. [28] also found that the use of traditional approaches was some of the more successful attempts to conquer climate change threats in many societies. However, the rapid rises in temperatures have called for a change in farming practices for community members to survive. Some of these changes included changing from livestock to crop farming or vice versa. This was since some community members argued that the loss endured from livestock farming was better than those from crop farming. The argument was that during harsh drought conditions those with livestock could simply sell some of it even at a low price, in order to be able to buy fodder and out-source water where possible. Ref. [33] also found that across other districts in Limpopo Province, livestock farmers resorted to destocking during times of uncertain climatic conditions. Ref. [27] also found similar results in Zimbabwe where farmers sold their livestock to reimburse for reduced income associated with low harvest during dry periods.
Few households in Maruleng Local Municipality preferred growing ground nuts, habanero and serrano chillies as they thrived better in harsh drought conditions. Five respondents (two from Greater-Giyani and three from Tzaneen) had switched to drought-tolerant maize seeds (FNK 2778 and GKC 2147 hybrids) with shorter growing periods. Ref. [33] also recommends a change in farming practice to ploughing drought resistant crops that grow fast as one of the best approaches to adapt to drought hazards.
The same has been done in livestock farming in Maruleng and Ba-Phalaborwa, where 10 community members had “Nguni” cows which are believed to be drought tolerant, with three households from former and seven from latter municipality. Although [33] recommends taking out an insurance policy as the best alternative to deal with climate change, none of the respondents had any form of drought insurance. This was either due to limited access to such information or financial constraints.
Water conservation has also become a priority, where farmers try to ensure that they save the little water they have. This has called for the improvement in irrigation system, where most (83%) farmers are opting for drip irrigation under minimal tillage, as it is water efficient. Several other studies have also recommended the zero-tillage approach, or mulching as means to help conserve soil moisture by reducing evaporative losses (e.g., [5,42,43]).

5. Discussion

Drought is one of the natural disasters of major concern for Mopani District Municipality, this is mainly because most of the community members rely on rain fed agriculture which is troubled during the drought seasons. The intricate nature of drought makes its characterisation and management difficult. This study revealed that Mopani District is faced with distinct spatial variability in climate, such that the western bushveld is wetter whereas the eastern lowveld is dry. However, it was found that the western bushveld is highly impacted by drought as compared to the eastern lowveld.
The impacts of drought vary across the district and different aspects are also affected differently, the vegetation, water bodies and food production (particularly maize) are adversely affected by drought spells. The exposure to drought hazard accessed through five sustainable livelihood indicators (financial assets, social assets, human resource, physical assets and natural assets) revealed that households are more susceptible to financial resources. There is a strong relationship between single/divorced respondents and vulnerability. The challenges faced by rural communities in Mopani during the drought conditions are exacerbated by poor service delivery. This corresponds to [40] findings about the elevated level of vulnerability in most African countries and low adaptive capacity which is linked to poverty and high reliance on the natural resources for a living.
The community members are forced to find means to adapt to harsh climatic conditions, in this pursuit some have decided to rent out their farm lands to make income. Accessibility to prominent agricultural markets is not convenient for small scale farmers, subsistence farmers across Mopani District fail to transport their produce to prominent markets due to financial constraints and lack of information on regulating procedures. Ref. [44] also found that most farmers in South Africa have limited access to markets and technology. The offered assistance by the government has not done much to reduce the household vulnerability. Ref. [27] asserted that institutional initiatives are less effective, and most forms of interventions are not carefully articulated to match the needs of those affected.
Ref. [45] found agricultural insurance, use of herbicides, insecticides and fertilisers as some of the approaches that help reduce subsistence farmers vulnerability to harsh climatic conditions. However, due to financial constraints, subsistence farmers across Mopani District Municipality could not afford agricultural insurance, making them more vulnerable to drought. The extent of vulnerability changes over time within a society, with new developments in policies, technology, societal behaviours and change on nature of the incident hazard. Communities have introduced some strategies that promote water efficiency to reduce vulnerability, this entails using grey water for crop irrigation and for household duties of convenient.
The most vulnerable groups are those that face difficulties in recovering their livelihoods after the occurrence of a disaster. Furthermore, if any subsequent hazardous event occurs, they are most likely to be adversely affected [46]. Although, farmers try to find ways to maintain agricultural production under drought conditions, they are hindered by financial challenges. Ref. [33] conquered that most small-scale farmers are limited by financial constrains as they are not even eligible to get loans for support. Ref. [47] asserted that a decrease in agricultural production influenced by climate change would have tremendous impacts on rural communities’ vulnerability and livelihoods. Reduced agricultural production has also forced some households to quit farming. This confirmed a study by [33] which found 93 that some of the farmers have deserted their farm lands and seek for employment opportunities in different industries. The 2015–16 drought spell virtually tied with the 1991/92 as two of the worst droughts to affect the district, although the more recent event was hotter due to climate change.

6. Conclusions

Many rural communities in South Africa are faced with historical exclusion challenges compounded by poor service delivery. Our study that focused on rural areas of Mopani District Municipality determined that many try to make a living through subsistence means in various sectors of economy. Their farming practices are highly reliant on rainfall and they cannot afford any means of production beyond that. We also found that in some areas in the east, rain-fed maize production is no longer tenable. The stress of drought exacerbates an already struggling situation. Rural communities in these areas then seek alternative livelihood options such as gathering and selling firewood, which are not sustainable adaptation measures. Climate change is also expected to worsen challenges of water accessibility in the district in future.
Over many generations, various strategies have been deployed to adapt to drought conditions and conservation agriculture has proved to assist subsistence farmers to attain living production during drought seasons [33]. The vulnerability levels have been progressive over decades, however, informed decision making, financial assistance, drought hazard-based insurance, advancements in technology, farmers’ awareness and advanced access to information can reduce vulnerability sharply. Improvements in early warning systems would also help communities prepare for drought season and reduce vulnerability.

Author Contributions

Conceptualization, N.N., H.C. and E.K.; methodology, N.N. and H.C.; software, N.N. and T.C.M.; formal analysis, N.N., T.C.M. and R.B.M.; writing—original draft preparation, N.N. and H.C.; writing—review and editing, N.N., R.B.M., E.K. and H.C.; visualization, N.N. and T.C.M.; supervision, H.C. and E.K. All authors have read and agreed to the published version of the manuscript.

Funding

This research was partially funded by the National Research Foundation of South Africa and the Research and Publications Committee of the University of Venda.

Acknowledgments

We acknowledge the assistance received from officials from the Mopani District Municipality Disaster Management Centre. The rainfall and temperature data obtained from the South African Weather Service and Agricultural Research Council is highly appreciated. We also thank Elelwani Mmbadi for help with fieldwork and administering questionnaires.

Conflicts of Interest

The authors declare no conflict of interest. The funders had no role in the design of the study; in the collection, analyses, or interpretation of data; in the writing of the manuscript, or in the decision to publish the results.

References

  1. M’marete, C.K. Climate and water resources in the Limpopo Province. In Agriculture as the Cornerstone of the Economy in the Limpopo Province. A Study Commissioned by the Economic Cluster of the Limpopo Provincial Government under the Leadership of the Department of Agriculture; Limpopo Department of Agriculture: Polokwane, South Africa, 2003; pp. 1–49. [Google Scholar]
  2. Benhin, J.K. South African crop farming and climate change: An economic assessment of impacts. Glob. Environ. Chang. 2008, 18, 666–678. [Google Scholar] [CrossRef]
  3. Maponya, P.I. Climate Change and Agricultural Production in Limpopo: Impacts and Adaptation Options. Ph.D. Thesis, University of South Africa, Pretoria, South Africa, 2013. [Google Scholar]
  4. Mpandeli, N.S.; Maponya, P.I. Coping with Climate Variability in Limpopo Province, South Africa. Peak J. Agric. Sci. 2013, 1, 54–64. [Google Scholar]
  5. Chikoore, H.; Vermeulen, J.H.; Jury, M.R. Tropical cyclones in the Mozambique Channel: January–March 2012. Nat. Hazards 2015, 77, 2081–2095. [Google Scholar] [CrossRef]
  6. Fitchett, J.M.; Hoogendoorn, G.; Swemmer, A.M. Economic costs of the 2012 floods on tourism in the Mopani District Municipality, South Africa. Trans. R. Soc. S. Afr. 2016, 71, 187–194. [Google Scholar] [CrossRef]
  7. Baudoin, M.A.; Vogel, C.; Nortje, K.; Naik, M. Living with drought in South Africa: Lessons learnt from the recent El Niño drought period. Int. J. Disaster Risk Reduct. 2017, 23, 128–137. [Google Scholar] [CrossRef]
  8. Richman, M.B.; Leslie, L.M. The 2015–2017 Cape Town Drought: Attribution and Prediction Using Machine Learning. Procedia Comput. Sci. 2018, 140, 248–257. [Google Scholar] [CrossRef]
  9. Morán-Tejeda, E.; Ceglar, A.; Medved-Cvikl, B.; Vicente-Serrano, S.M.; López-Moreno, J.I.; González-Hidalgo, J.C.; Revuelto, J.; Lorenzo-Lacruz, J.; Camarero, J.; Pasho, E. Assessing the capability of multi-scale drought datasets to quantify drought severity and to identify drought impacts: An example in the Ebro Basin. Int. J. Climatol. 2013, 33, 1884–1897. [Google Scholar] [CrossRef] [Green Version]
  10. Pal, L.; Ojha, C.S.P.; Chandniha, S.K.; Kumar, A. Regional scale analysis of trends in rainfall using nonparametric methods and wavelet transforms over a semi-arid region in India. Int. J. Climatol. 2019, 39, 2737–2764. [Google Scholar]
  11. Da Rocha Júnior, R.L.; dos Santos Silva, F.D.; Costa, R.L.; Gomes, H.B.; Pinto, D.D.C.; Herdies, D.L. Bivariate assessment of drought return periods and frequency in brazilian northeast using joint distribution by copula method. Geosciences 2020, 10, 135. [Google Scholar] [CrossRef] [Green Version]
  12. Yomo, M.; Villamor, G.B.; Aziadekey, M.; Olorunfemi, F.; Mourad, K.A. Climate change adaptation in semi-arid ecosystems: A case study from Ghana. Clim. Risk Manag. 2020, 27, 100206. [Google Scholar]
  13. Kane, S.; Shogren, J.F. Linking adaptation and mitigation in climate change policy. In Societal Adaptation to Climate Variability and Change; Springer: Dordrecht, The Netherlands, 2000; pp. 75–102. [Google Scholar]
  14. Adger, W.N.; Huq, S.; Brown, K.; Conway, D.; Hulme, M. Adaptation to climate change in the developing world. Prog. Dev. Stud. 2003, 3, 179–195. [Google Scholar] [CrossRef]
  15. Ribot, J. Democratic Decentralization of Natural Resources: Institutionalizing Popular Participation; World Resources Institute: Washington, DC, USA, 2002. [Google Scholar]
  16. Statistics South Africa. Census 2011 Statistical Release; Statistics South Africa: Pretoria, South Africa, 2012. [Google Scholar]
  17. Myer, S.L.; De Crom, E.P. Agritourism activities in the Mopani District municipality, Limpopo Province, South Africa: Perceptions and opportunities. J. Transdiscipl. Res. S. Afr. 2013, 9, 295–308. [Google Scholar] [CrossRef] [Green Version]
  18. Schneider, U.; Fuchs, T.; Meyer-Christoffer, A.; Rudolf, B. Global precipitation analysis products of the GPCC. Glob. Precip. Climatol. Cent. (GPCC) DWD 2008, 112, 1–13. [Google Scholar]
  19. Vicente-Serrano, S.M.; Beguería, S.; Lorenzo-Lacruz, J.; Camarero, J.J.; López-Moreno, J.I.; Azorin-Molina, C.; Revuelto, J.; Morán-Tejeda, E.; Sanchez-Lorenzo, A. Performance of drought indices for ecological, agricultural, and hydrological applications. Earth Interact. 2012, 16, 1–27. [Google Scholar] [CrossRef] [Green Version]
  20. Lyon, B. Southern Africa summer drought and heat waves: Observations and coupled model behaviour. J. Clim. 2009, 22, 6033–6046. [Google Scholar] [CrossRef]
  21. Peng, J.; Dadson, S.; Hirpa, F.; Dyer, E.; Lees, T.; Miralles, D.G.; Vicente-Serrano, S.M.; Funk, C. A pan-African high-resolution drought index dataset. Earth Syst. Sci. Data 2020, 12, 753–769. [Google Scholar]
  22. Chen, H.; Zhang, H.; Liu, R.; Yu, W. Agricultural drought monitoring, forecasting and loss assessment in China. In Remote Sensing for Agriculture, Ecosystems, and Hydrology XI; International Society for Optics and Photonics: Bellingham, WA, USA, 2009; Volume 7472, p. 74721. [Google Scholar]
  23. Estel, S.; Kuemmerle, T.; Alcántara, C.; Levers, C.; Prishchepov, A.; Hostert, P. Mapping farmland abandonment and recultivation across Europe using MODIS NDVI time series. Remote Sens. Environ. 2015, 163, 312–325. [Google Scholar] [CrossRef]
  24. Zhang, X.; Friedl, M.A.; Schaaf, C.B.; Strahler, A.H.; Hodges, J.C.; Gao, F.; Reed, B.C.; Huete, A. Monitoring vegetation phenology using MODIS. Remote Sens. Environ. 2003, 84, 471–475. [Google Scholar] [CrossRef]
  25. Ray, S.S.; Sai, M.S.; Chattopadhyay, N. Agricultural Drought Assessment: Operational Approaches in India with Special Emphasis on 2012. In High-Impact Weather Events over the SAARC Region; Springer: Cham, Switzerland, 2015; pp. 349–364. [Google Scholar]
  26. Tucker, C.J.; Pinzon, J.E.; Brown, M.E.; Slayback, D.A.; Pak, E.W.; Mahoney, R.; Vermote, E.F.; El Saleous, N. An extended AVHRR 8-km NDVI dataset compatible with MODIS and SPOT vegetation NDVI data. Int. J. Remote Sens. 2005, 26, 4485–4498. [Google Scholar] [CrossRef]
  27. Food Agriculture and Natural Resources Policy Analysis Network (FANRPAN). The Household Vulnerability Index (HVI); FANRPAN: Pretoria, South Africa, 2011. [Google Scholar]
  28. Nkondze, M.S.; Masuku, M.B.; Manyatsi, A. Factors affecting households’ vulnerability to climate change in swaziland: A case of Mpolonjeni Area Development Programme (ADP). J. Agric. Sci. 2013, 5, 1108. [Google Scholar] [CrossRef] [Green Version]
  29. Sibanda, L.M.; Kureya, T.; Chipfupa, U. The Household Vulnerability Index framework. Pretoria. South Africa. Available online: https://www.fanrpan.org/archive/documents/d00217/HVI_Dev-data_Feb2007.pdf (accessed on 7 June 2008).
  30. Mzezewa, J.; Misi, T.; Van Rensburg, L. Characterisation of rainfall at a semi-arid ecotope in the Limpopo Province (South Africa) and its implications for sustainable crop production. Water S. Afr. 2010, 36, 19–26. [Google Scholar] [CrossRef] [Green Version]
  31. Tyson, P.D.; Lee-Thorp, J.; Holmgren, K.; Thackeray, J.F. Changing gradients of climate change in Southern Africa during the past millennium: Implications for population movements. Clim. Chang. 2002, 52, 129–135. [Google Scholar] [CrossRef]
  32. Engelbrecht, F.; Adegoke, J.; Bopape, M.J.; Naidoo, M.; Garland, R.; Thatcher, M.; McGregor, J.; Katzfey, J.; Werner, M.; Ichoku, C.; et al. Projections of rapidly rising surface temperatures over Africa under low mitigation. Environ. Res. Lett. 2015, 10, 085004. [Google Scholar] [CrossRef]
  33. Mpandeli, S.; Nesamvuni, E.; Maponya, P. Adapting to the impacts of drought by smallholder farmers in Sekhukhune District in Limpopo Province, South Africa. J. Agric. Sci. 2015, 7, 115–125. [Google Scholar] [CrossRef]
  34. Reason, C.J.C.; Hachigonta, S.; Phaladi, R.F. Interannual variability in rainy season characteristics over the Limpopo region of southern Africa. Int. J. Climatol. J. R. Meteorol. Soc. 2005, 25, 1835–1853. [Google Scholar] [CrossRef]
  35. Sheffield, J.; Wood, E.F. Projected changes in drought occurrence under future global warming from multi-model, multi-scenario, IPCC AR4 simulations. Clim. Dyn. 2008, 31, 79–105. [Google Scholar] [CrossRef]
  36. Liu, X.; Zhu, X.; Pan, Y.; Li, S.; Liu, Y.; Ma, Y. Agricultural drought monitoring: Progress, challenges, and prospects. J. Geogr. Sci. 2016, 26, 750–767. [Google Scholar] [CrossRef] [Green Version]
  37. Dai, A. Drought under global warming: A review. Wiley Interdiscip. Rev. Clim. Chang. 2011, 2, 45–65. [Google Scholar] [CrossRef] [Green Version]
  38. FAO (Food and Agriculture Organization). Adapt Framework Programme on Climate Change Adaptation: Viale Delle Terme di Caracalla; FAO: Rome, Italy, 2011. [Google Scholar]
  39. De Cock, N.; D’Haese, M.; Vink, N.; Van Rooyen, C.J.; Staelens, L.; Schönfeldt, H.C.; D’Haese, L. Food security in rural areas of Limpopo province, South Africa. Food Sec. 2013, 5, 269–282. [Google Scholar] [CrossRef] [Green Version]
  40. Meilink, H.A.; Bryceson, D.F.; Abbink, G.J. Can Africa Claim the 21st Century? World Bank Publication: Washington, DC, USA, 2000. [Google Scholar]
  41. Smith, J.B.; Lenhart, S.S. Climate change adaptation policy options. Clim. Res. 1996, 6, 193–201. [Google Scholar] [CrossRef] [Green Version]
  42. Patt, A.; Gwata, C. Effective seasonal climate forecast applications: Examining constraints for subsistence farmers in Zimbabwe. Glob. Environ. Chang. 2002, 12, 185–195. [Google Scholar] [CrossRef]
  43. Hansen, J.W.; Marx, S.; Weber, E. The Role of Climate Perceptions, Expectations and Forecasts in Farmer Decision Making: The Argentine Pampas and South Florida; Technical Report, 04-01; International Research Institute for Climate Predictions: Palisades, NY, USA, 2004. [Google Scholar]
  44. Downing, T.E.; Bakker, K. Drought discourse and vulnerability. In Drought: A Global Assessment; Wilhite, D.A., Ed.; Natural Hazards and Disasters Series; Routledge Publishers: London, UK, 2000; Chapter 45. [Google Scholar]
  45. Panda, A. Vulnerability to climate variability and drought among small and marginal farmers: A case study in Odisha, India. Clim. Dev. 2017, 9, 605–617. [Google Scholar] [CrossRef]
  46. Wisner, B.; Blaikie, P.; Blaikie, P.M.; Cannon, T.; Davis, I. At Risk: Natural Hazards, People Vulnerability, and Disasters; Routledge Publishers: London, UK; New York, NY, USA, 2014. [Google Scholar]
  47. Pachauri, R.K. Climate change and its impacts on development: The role of the IPCC assessments. Clim. Dev. IDS Bull. Sussex Inst. Dev. Stud. 2004, 35, 11–14. [Google Scholar] [CrossRef] [Green Version]
Figure 1. Map showing the location of Mopani District Municipality, Limpopo Province, in the northeast of South Africa.
Climate 09 00061 g001
Figure 2. (A) Land uses and land cover classification and (B) Digital elevation across Mopani District Municipality.
Climate 09 00061 g002aClimate 09 00061 g002b
Figure 3. Mean monthly rainfall for Mopani Western bushveld and Eastern lowveld, calculated from a 1980–2016 climatology.
Climate 09 00061 g003
Figure 4. Mean annual cycle of maximum temperature for Mopani bushveld (west) and the lowveld (east), calculated from a 1980–2016 climatology.
Climate 09 00061 g004
Figure 5. (A) SPEI 6 for western bushveld and (B) and SPEI 6 for the eastern lowveld.
Climate 09 00061 g005
Figure 6. NDVI anomalies across Mopani District Municipality for the austral summer seasons of (A) 2007–2008; (B) 2014–2015; (C) 2015–2016.
Climate 09 00061 g006aClimate 09 00061 g006b
Figure 7. HVI per local municipality in Mopani District Municipality.
Climate 09 00061 g007
Table 1. SPEI Classical Table (adapted from [19]).
CategoriesSPEI Values
No drought>0
Mild drought0 to −0.99
Moderate drought−1.0 to −1.49
Severe drought−1.5 to −1.99
Extreme drought ≤−2.0
Table 2. Five sustainable livelihood indicators (adapted from [27]).
Natural AssetsPhysical AssetsHuman Capital AssetsFinancial AssetsSocial Assets
LandLivestockFarm LabourSalaryCommunity Support
SoilEquipmentDependentsSavingsSocial Welfare Support
Water Gender CompositionPension FundsAccess to Information
Extended Families
Table 3. Community-Based Asset Weighting Results.
IndicatorAssigned Weight
Financial Resource21
Physical Resources 22
Social Assets19
Human Resource17
Natural Resource22
Table 4. Households Sampling.
Local MunicipalityPopulation Number of HouseholdsPercentage (%)Calculations (% × n)Sample Number of Households
Greater Giyani63,54821.421.4 × 12326
Greater Letaba58,26119.619.6 × 12324
Maruleng24,4708.28.2 × 12310
Ba Phalaborwa41,11513.813.8 × 12316
Greater Tzaneen108,92636.736.7 × 12345
Total296,320100 121
Table 5. HVI classical values (adapted from [29]).
CategoryHVI Value
Low Vulnerability (Level 1)0–10
Moderate Vulnerability (Level 2)11–20
High Vulnerability (Level 3)21–30
Table 6. Drought Events in Mopani District Municipality and their categories.
Drought EventCategory
Western BushveldEastern Lowveld
1980/81ModerateMild
1982/83SevereModerate
1983/84MildModerate
1986/87MildModerate
1991/92SevereModerate
1993/94ModerateModerate
1997/98SevereMild
2002/03SevereSevere
2004/05ExtremeMild
2007/08ModerateExtreme
2011/12ExtremeModerate
2014/15ModerateExtreme
2015/16SevereExtreme
Table 7. Drought frequency in western highveld and eastern lowveld of Mopani District Municipality.
LevelCategoryOccurrence Frequency (%)
Western HighveldEastern Lowveld
>0No drought50.950.8
0 to −0.99Mild drought30.430.5
−1.0 to −1.99Moderate drought13.713.9
−1.5 to 1.99Severe drought4.64.5
≤−2.0 Extreme drought0.50.2
Publisher’s Note: MDPI stays neutral with regard to jurisdictional claims in published maps and institutional affiliations.

