Article

Comparison of Multiple Maximum and Minimum Temperature Datasets at Local Level: The Case Study of North Horr Sub-County, Kenya

1
Interuniversity Department of Regional and Urban Studies and Planning (DIST), Politecnico di Torino & Università di Torino, 10125 Torino, Italy
2
University Department of Environmental, Land and Infrastructure Engineering (DIATI), Politecnico di Torino, 10125 Torino, Italy
3
TriM_Translate Into Meaning, 10128 Torino, Italy
*
Author to whom correspondence should be addressed.
Submission received: 26 February 2021 / Revised: 1 April 2021 / Accepted: 6 April 2021 / Published: 9 April 2021
(This article belongs to the Section Climate Adaptation and Mitigation)

Abstract

:
Climate analyses at a local scale are an essential tool in the field of sustainable development. The evolution of reanalysis datasets and their greater reliability contribute to overcoming the scarcity of observed data in the southern areas of the world. The purpose of this study is to compute the reference monthly values and ranges of maximum and minimum temperatures for the eight main inhabited villages of North Horr Sub-County, in northern Kenya. The official ten-day dataset derived from the Kenyan Meteorological Department (KMD), the monthly datasets derived from the ERA-Interim reanalysis (ERA), the Observational-Reanalysis Hybrid (ORH) and the Climate Limited Area Mode driven by HadG-EM2-ES (HAD) are assessed on a local scale using the most common statistical indices to determine which is more reliable in representing monthly maximum and minimum temperatures. Overall, ORH datasets showed lower biases and errors in representing local temperatures. Through an innovative methodology, a new set of monthly mean temperature values and ranges derived from ORH datasets are calculated for each location in the study area, in order to guarantee to locals an historical benchmark to compare present observations. The findings of this research provide insights for environmental risk management, supporting local populations in reducing their vulnerability.

1. Introduction

Several studies have classified Africa as the most vulnerable continent to the impacts of climate change, due to its dependence on agricultural activities as well as its poor financial, technical and institutional resilience capacities [1,2,3,4]. Local sustainable development in Africa is heavily threatened by the impacts that climate change has on livelihood activities, ecosystem services and water supply [5]. Among African countries, Kenya is one of the most vulnerable to climate change. According to the Notre Dame Global Adaptation Initiative index, which measures the current level of vulnerability to climate disruption for 182 countries, Kenya was ranked as the 38th most vulnerable country in the world to the effect of climate change and the 23rd least ready to face future impacts in 2020 [6]. Changes in rainfall patterns and increasing temperatures are expected to generate prolonged periods of drought and more intense floods in the country [7], causing huge economic losses, especially for the pastoralist communities in the north of the country [8]. Most of the rural communities in the northern regions live under conditions of poverty and extreme weather events will increasingly threaten the area [9]. Therefore, monitoring, forecasting and early warning systems are the best strategies to mitigate negative socio-economic impacts and strengthen the resilience of the communities [10,11].
The present investigation is based on the principles of the One Health approach. This multidisciplinary approach aims to achieve global health, addressing the needs of the most vulnerable populations and increasing their resilience on the basis of the intimate relationship between human health, animal health and environment conditions [12]. In this context, historical weather observations are essential, since they allow the examination of long-term climate trends and the comparison of past patterns with present and future values, in order to have a broader view of what is happening at the local scale. However, the weather observation network in arid and semi-arid lands (ASALs) has a poor spatial distribution. The majority of the land-based meteorological stations are located in the south and in the coastal areas of the country, which are the territories that attract most of the tourist flows [13]. Furthermore, due to the scarce investment in technological renovation of the infrastructures, the national meteorological network lacks modern facilities for data analysis, which are needed to adequately represent past and present local climate trends [14,15]. These observation deficiencies do not allow the proper interpretation and prediction of local extreme weather events and consequently prevent the mitigation of related risks [16].
With the progress of technologies and the increasing research effort, different sources have been produced over recent decades to fill these data gaps, such as remote sensing, climate models and reanalysis [17]. Recent studies have tried to assess the reliability of different reanalysis datasets in Kenya and, more generally, in East Africa [18,19,20,21]. However, all of these studies approached the issue with a regional rather than a local perspective.
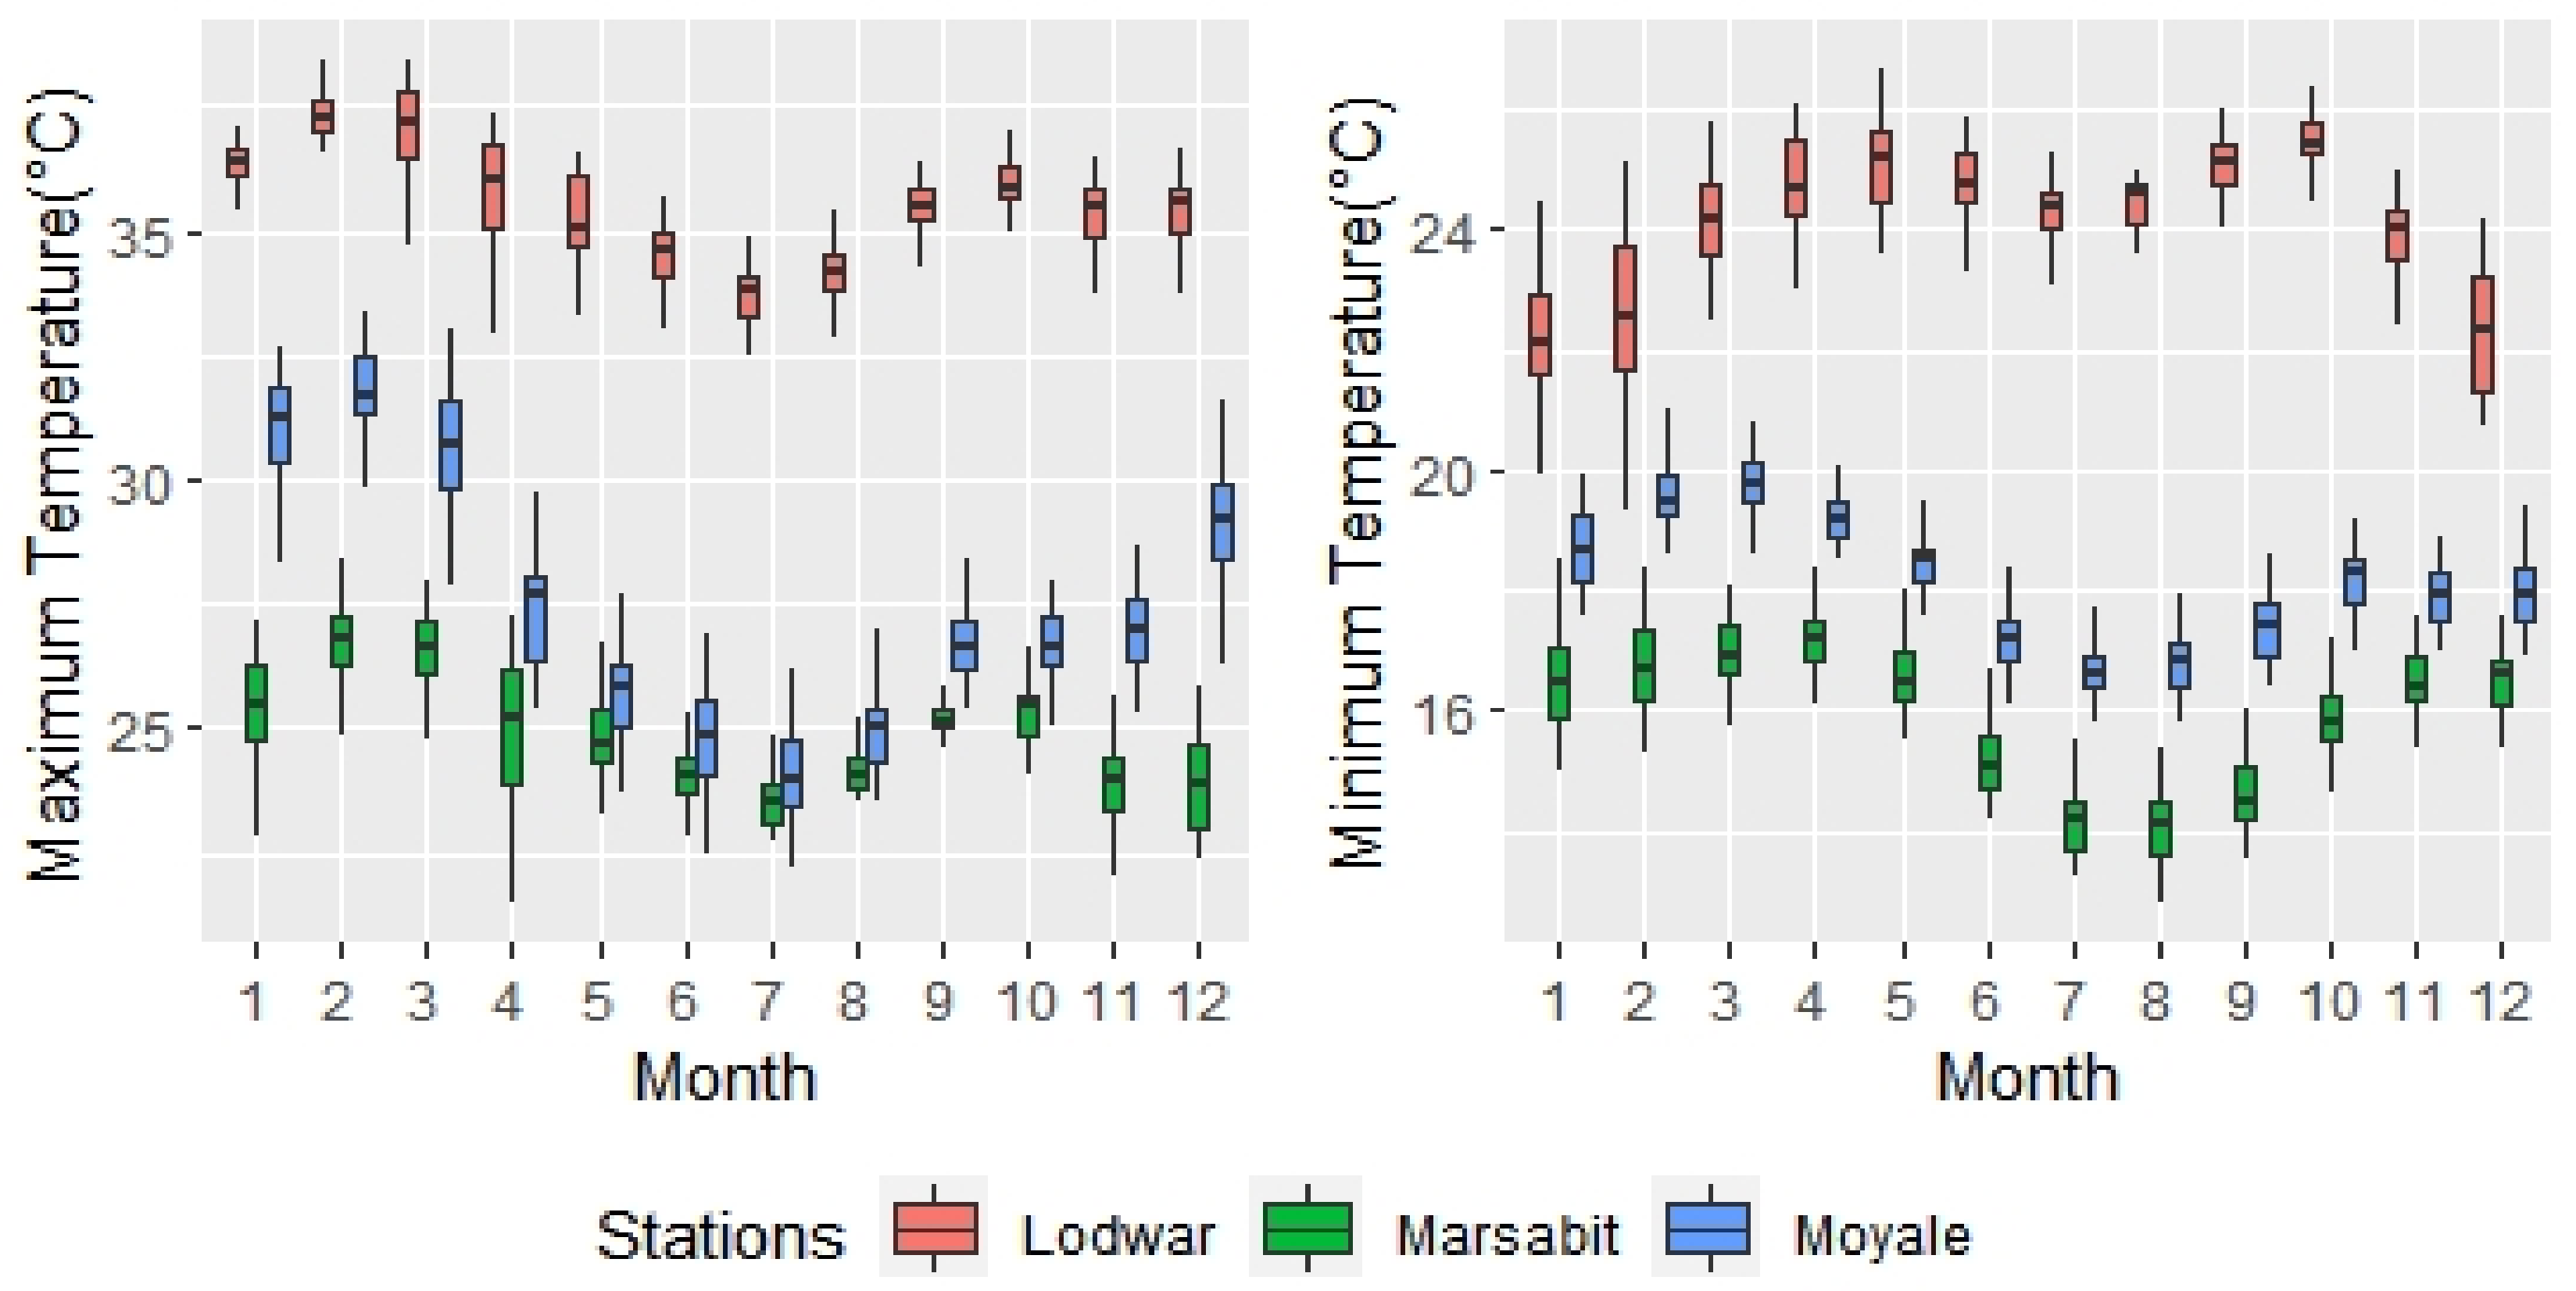
The present study analyzes the reliability of different maximum and minimum temperature datasets derived from temperature reanalysis to assess which is the most appropriate to represent the local climate. In North Horr Sub-County, situated in Marsabit County in northern Kenya, there is only one land-based meteorological station, which was installed in North Horr village in 2019. Due to the lack of historical observations in the sub-county, an area within a 250 km radius from North Horr has been defined and the land-based meteorological stations located inside the area have been selected in order to maximize the spatial coverage and the local representativeness. Specifically, these land-based meteorological stations are situated in Lodwar, Moyale and Marsabit. The climatic products were evaluated against the historical observations recorded by the Lodwar, Marsabit and Moyale land-based meteorological stations using a direct, point-to-pixel validation based on a statistical indices approach [22].
As proposed by [23], the closest grid point to each land-based meteorological station has been selected for each dataset, regardless of the position of the station inside the grid box and of the spatial resolution of the datasets. Although the resolution of the datasets is known to have an influence on the validation results [24,25], the use of this approach is supported by the low topographic complexity of the area [22,26] and by the need to assess the datasets’ performances in their original format, i.e., original resolutions. Thus, the evaluation involves the datasets’ ability, as available for the end users, to appreciate the local peculiarities, that is, how the selected product will be used for future local-scale research on the area. Five performance indicators were considered in order to assess the goodness of the models [23,27,28]. In addition, Taylor diagrams were calculated in order to display the statistical agreement between the models’ data and the observations. The datasets which provided the highest scores were chosen for the calculation of the reference TMAX and TMIN.
The novelty of this study consists in the creation of an innovative methodology for the calculation of reference TMAX and TMIN values and temperature ranges. The reference values and temperature ranges obtained can provide a benchmark to strengthen the warning and response systems against extreme weather events. This methodology can support local populations in developing adaptation strategies and increasing their resilience against climatic anomalies.
Section 2 describes the geographic features in the study area, the dataset used, and the methodology adopted. The results are presented and discussed in Section 3, whereas conclusions are drawn in Section 4.

2. Materials and Methods

2.1. Study Area

North Horr Sub-County is located within Marsabit County, in northern Kenya. In this area, the main populated villages, as reported in Figure 1 as “main locations”, are Balesa, Dukana, El-Gade, El-Hadi, Gas, Kalacha, Malabot and North Horr. The region is mainly arid and represents ASAL. Exceptions are represented by the areas around Mt. Marsabit and Mt. Kulal. The geomorphological configuration of the territory is mainly characterized by extensive plains with an altitude varying from 300–900 m.a.s.l. The rainfall is variable and the evaporation rate exceeds ten times the rainfall amount, whereas the temperature ranges from 15 °C to 26 °C and the mean annual temperature is about 20.5 °C [29]. The temperature is mostly influenced by the altitude and its oscillation throughout the year is linked to the rainy seasons. Generally, in Kenya, there are two rainy seasons, with a high peak during the months of March to May, and between October and December. The bimodal rainfall pattern is mainly influenced by the migration of the Inter-Tropical Convergence Zone and occasionally by the El Niño Southern Oscillation and the Indian Ocean Dipole, which can lead to extreme events such as floods and droughts [30,31,32].

2.2. Historical Temperature Series

Three land-based meteorological stations, located outside the study area but within a radius of 250 km from North Horr village, allowed us to overcome the lack of historical observations that characterizes the territory [22]. They are located in Lodwar, Marsabit and Moyale. Moreover, an automatic weather station has been active in North Horr since March 2019, within the framework of the One Health international cooperation project carried out in the sub-county. The characteristics of the land-based meteorological and automatic stations are summarized in Table 1.
Monthly maximum and minimum temperature observations recorded by Lodwar, Marsabit and Moyale land-based meteorological stations provided by the Kenyan Meteorological Department were used to evaluate the performance of each model assessed. Considering the stations range of activity, the period 1983–2014 was chosen to optimize the temporal coverage.
Finally, TMAX and TMIN observations recorded between March 2019 and June 2020 by the land-based automatic weather station located in North Horr were used for the validation of the results.
Regarding the temporal resolution, monthly TMAX and TMIN were considered suitable for the purpose of this study; temperatures recorded at shorter periodic intervals were converted into monthly observations.
As can be seen from Figure 2, the maximum and minimum temperatures recorded by the Lodwar station are significantly higher than those of Marsabit and Moyale. The reason for this difference derives from the different altitudes at which the stations are located. Lodwar station is located at 500 m, while those of Marsabit and Moyale are higher. However, the cold season in the region is experienced from June–August and the hot season is January–March.

2.3. Reanalysis Product Description

Four different climatic products were evaluated for the purpose of this study, as shown in Figure 3.
The temperature datasets assessed were:
According to [27,35,36], Observational Reanalysis Hybrid (ORH) should be the preferred data source to be used for climate change studies in East Africa. ORH is a global [35] and regional (Northern/West/East Africa) [28] three-hourly, daily and monthly meteorological dataset developed through a spatial downscaling of the National Centers for Environmental Prediction and the National Center for Atmospheric Research reanalysis, with a spatial resolution of 0.25°. The spatial downscaling includes elevation changes and is evaluated against ground stations, allowing the omission of random errors. Moreover, ORH is corrected for temporal inhomogeneity and biases [28]. Another source of climate information is the Regional Climatic Models derived from the Global Climatic Model through the dynamical downscaling method [37]. Recently, within the Coordinated Regional Downscaling Experiment community, different regional climatic models were developed in the African domain, with high spatial resolution and availablility in different temporal domains. According to a recent study [21], the Climate Limited Area Model driven by HadGEM2-ES (HAD) with a resolution of 0.1° is suitable for climate change studies in East Africa and was considered for this analysis. In addition, ERA-Interim (ERA) maximum and minimum temperature datasets with a spatial resolution of 0.125° were assessed. ERA has been issued for the period of 1979–2016 and combines weather observations and short-term forecasts initialized from previous analysis; it integrates daily surface air temperature observations and it is probably the most comprehensive reanalysis existing currently [33]. Finally, the last dataset considered is the ten-day dataset from the Kenyan Meteorological Department (KMD), which has a spatial resolution of 0.0375°, and covers the period 1983–2014. The KMD is a high-resolution, spatially and temporally complete gridded historical temperature dataset produced by the International Research Institute for Climate and Society (IRI), the Earth Institute at Columbia University [24].

2.4. Methodology

The study followed five steps (Figure 4):
1.
Dataset performance assessment through the comparison between the historical observations of the land-based meteorological stations of Lodwar, Marsabit and Moyale and the dataset point values;
2.
Evaluation of systematic errors in TMAX and TMIN seasonal representation of the chosen datasets at the land-based meteorological station level;
3.
Calculation and validation of the monthly ranges of TMAX and TMIN for Lodwar, Marsabit and Moyale;
4.
Calculation of the monthly reference values and ranges of TMAX and TMIN for all the eight reference points;
5.
Validation of the results through the comparison between monthly TMAX and TMIN ranges and the observations recorded by the North Horr automatic land-based weather station.
The five methodological steps are described in detail below.

2.4.1. Dataset Performance Comparison

Point-to-pixel comparison is a commonly used method to compare ground observations with other data products, such as reanalysis temperature datasets [26]. This method has been implemented in the analysis to test the accuracy of each selected product in representing North Horr Sub-County local temperatures. Since the historical observations were available as monthly values, the temperature values from the datasets were firstly aggregated into monthly values. Therefore, KMD, ERA, ORH and HAD datasets were evaluated against the TMAX and TMIN observations recorded by the land-based meteorological stations of Lodwar, Marsabit and Moyale in the selected period of 1983–2014. Five statistical indices have been computed: the Bias, the mean absolute error (MAE), the mean squared error (MSE), the root mean squared error (RMSE) and the correlation coefficient (CC) [27,28,38]. On top of the above statistical indices, a Taylor diagram has been computed to display the statistical agreement between the datasets and the land-based meteorological station data. The diagram shows the agreement through the CC and the standard deviation (σ).

2.4.2. Systematic Error Evaluation at Land-Based Station Level

After establishing which datasets showed the best fit for the study area, the analysis of the ability to represent seasonal temperatures was carried out for each land-based meteorological station. Seasonal TMAX and TMIN boxplots were created to compare the differences between the observations and the dataset values. The analysis of the boxplots aimed to assess the distribution of the temperature values and to determine the presence of seasonal systematic errors in the reanalysis. Moreover, the comparison between the boxplots allowed us to choose the most appropriate position index e to calculate the monthly reference temperatures.

2.4.3. Reference Values and Range Computation and Validation at Land-Based Station Level

Monthly reference values were computed for both TMAX and TMIN timeseries by averaging the monthly temperature for the entire period considered (1983–2014). Temperature ranges were calculated with an amplitude of 2 degrees Celsius centered on the climatological monthly mean values. The amplitude of the ranges is determined by the difference between the 5th and 95th percentile of the ORH monthly distribution of TMAX and TMIN. Thereby, the ranges managed to contain most of the historical observations and to exclude the events of extreme heat or cold.
As a first level of verification, the monthly ranges were compared against historical maximum and minimum temperature observations recorded by Lodwar and Moyale land-based meteorological stations, to assess the number of observations falling within the ranges and the number of outliers outside of the intervals.

2.4.4. Range Computation at Reference Point Level

Since the temperature ranges and reference values computed for Lodwar and Moyale locations showed good performances, the climatological reference values were calculated for all the reference locations (Balesa, Dukana, El-Hadi, El-Gade, Gas, Kalacha, Malabot, North Horr) using the same criteria.

2.4.5. Result Validation for North Horr

As a final test, North Horr temperature ranges were compared against the TMAX and TMIN observations collected from the automatic weather station located in North Horr for the period from March 2019 to June 2020. Daily temperature observations were converted into monthly measurements and subsequently evaluated in relation to the monthly thresholds.

3. Results and Discussion

3.1. Dataset Performance Comparison

In this section, the comparison between climate products and historical TMAX and TMIN observations is presented. Five different indices were computed: RMSE, MSE, MAE, bias and CC, as shown in Table 2.
Despite small exceptions, all products showed a tendency to overestimate temperatures, as suggested by positive values of the bias. Referring to MSE and RMSE indices, ORH and KMD showed better results. Indeed, ERA and HAD showed higher RMSE, MSE and biases compared to ORH and KMD datasets in almost every station. KMD showed higher CC results compared to other TMAX datasets; differently mixed results were found for TMIN CCs. Overall, the KMD dataset showed better performances in representing maximum temperature, whereas the ORH dataset fit better for minimum temeperature. Furthermore, Taylor diagrams pictured in Figure 5 present the degree of the statistical agreement between the datasets and the recorded historical observations.
According to the Taylor diagrams, on average, KMD and ORH showed a lower standard deviation and higher CC (as has already been presented in Table 2) in representing TMAX and Lodwar TMIN values, whereas HAD showed a higher CC and lower standard deviation in representing Marsabit TMIN, and ERA showed better results in representing Moyale TMIN.
Considering the overall validation results presented in Table 2 and the Taylor diagrams, ORH is the most accurate product in representing local TMIN, whereas KMD yields a better performance in describing local TMAX. Despite the broader resolution, ORH showed significantly lower biases and errors in most of the validation stations. One reason behind these results could be the low topographic complexity of the area. According to [26], temperature reanalysis with high resolution is fundamental in a context with complex geomorphologic features, but not particularly beneficial in plain areas. The better performances of the KMD in representing Marsabit temperatures support this hypothesis, as Marsabit is located on a hilltop. In this case, the higher-resolution grid may have resulted in better performances. Since KMD and ORH presented the best results in representing local temperatures, we evaluated which of these two datasets best approximated the seasonal distribution of maximum and minimum temperature, in order to decide which datasets to use in calculating the monthly reference values.

3.2. Systematic Error Evaluation at Land-Based Station Level

In this section, the ability of the ORH and KMD datasets to depict seasonal distributions of the temperature data is assessed.
Seasonal TMAX and TMIN boxplots were created in order to further compare the differences between observations and the datasets. Figure 6 shows the comparison between seasonal observed data and seasonal data from KMD and ORH reanalysis.
ORH showed poor results in representing both TMAX and TMIN in Marsabit, overestimating both maximum and minimum temperatures and confirming the high bias values reported in Table 2. Conversely, ORH showed good results in representing all seasons’ TMAX both for Lodwar and Moyale. However, it tended to underestimate Lodwar TMIN during fall, spring and summer and Moyale TMIN during fall, spring and winter, and to overestimate the winter temperature in Lodwar. The density distribution is represented next to the box graph for each season; several seasons appear to have normal distributions, whereas others have bimodal or not centered/symmetric distributions.
On the other side, in Figure 6, it can be seen that the KMD tends to systematically overestimate both maximum and minimum temperatures.
Given the results described by the seasonal boxplots, it emerged that the temperature data from ORH reanalysis, with the exception of Marsabit, fit better than data from KMD to describe the seasonal pattern of the observations recorded by the land-based stations. Indeed, ORH seasonal boxplots did not show a tendency to systematically overestimate or underestimate temperatures recorded by both Lodwar and Moyale land-based meteorological stations. These results are in line with [27,35,36], whose outcomes underline that ORH is the most accurate data source for TMAX and TMIN at monthly resolutions compared to other climatic products in East Africa.
Therefore, monthly mean reference values for each location were calculate as the monthly mean value of TMAX and TMIN data derived from the ORH reanalysis.

3.3. Reference Values and Range Computation and Validation at Land-Based Station Level

TMAX and TMIN reference values have been calculated for the stations of Lodwar, Marsabit and Moyale, by averaging the monthly and seasonal TMAX and TMIN data deriving from the ORH reanalysis (results are reported in Appendix A). Afterwards, climatological ranges were calculated with an amplitude of 2 degrees centered on the climatological monthly mean values for for both Lodwar and Moyale locations (see Figure 7). The ranges have been computed with an amplitude of 2 °C. Marsabit temperature ranges were not computed, since ORH failed in representing both TMAX and TMIN observation recorded by the relevant land-based station. Due to this overestimation, Marsabit monthly ranges would not have been representative of the observed temperature.
As shown in Figure 7, maximum and minimum ranges computed for Lodwar and Moyale showed good results, as they are able to contain from 80 to 95% of the historical observations. The percentage of values not falling within the limits of the ranges refers to those extreme climatic events characterized by a heavy tail distribution and which differ significantly from the average [39].

3.4. Calculation of Seasonal/Monthly Temperature Ranges for the Reference Points

The monthly/seasonal TMAX and TMIN ranges were calculated for the eight reference points, as shown in Table 3 and Table 4.
A visual representation of the maximum and minimum seasonal temperature values at a local scale is given by the isotherm maps presented in Figure 8 and Figure 9. The annual TMAX and TMIN distributions for each reference point based on monthly ORH temperature timeseries are shown in Figure 10.

3.5. Result Validation for North Horr

The lack of land-based meteorological stations in the territory may represent a limitation for the reliability of the results of this study. This issue is overcome through the observations recorded by the North Horr land-based automatic weather station, providing local evidence of the adequacy of the results. Despite the recent installation, the observations recorded by the North Horr land-based automatic weather station represent a unique opportunity for the validation of our methodology at a local scale. Observations that were collected and tested refer to the period between March 2019 and June 2020. In particular, since the station is used to measure the maximum and minimum temperature on a daily basis, the daily data were averaged on a monthly basis and then compared with time intervals, as shown in Figure 11.
Even though the number of observations is small, the visualization of temperature ranges confirms that the majority of the records are contained within the temperature boundaries. However, in May, both minimum and maximum temperature observations were above the upper limit of the climatological range. The upper limit is likewise passed in March, April, May and July (TMAX) and in May and June (TMIN). Moreover, in October, monthly average temperature values were below the lower limit, both for TMIN and TMAX, and in February and April, observations were observed below the lower limit, respectively, of the TMAX and TMIN ranges. Overall, the climatological temperature ranges for both TMAX and TMIN were able to contain nearly 70% of the observations.

4. Conclusions

The availability of reliable historical climatic datasets is key to understanding and predicting extreme weather events and consequently reducing the vulnerability in African countries, especially in ASAL regions. Similar to many other East African countries, Kenya lacks historical land-based meteorological observations. This study identifies which maximum and minimum temperature datasets are able to fill the data gap in North Horr Sub-County. Four different climatic products are chosen and validated against historical TMAX and TMIN observations recorded by the land-based meteorological stations of Lodwar, Marsabit and Moyale. The comparison between ERA, HAD, KMD and ORH datasets highlights that ORH TMAX and TMIN datasets are able to better represent local temperatures and to successfully describe the seasonal patterns.
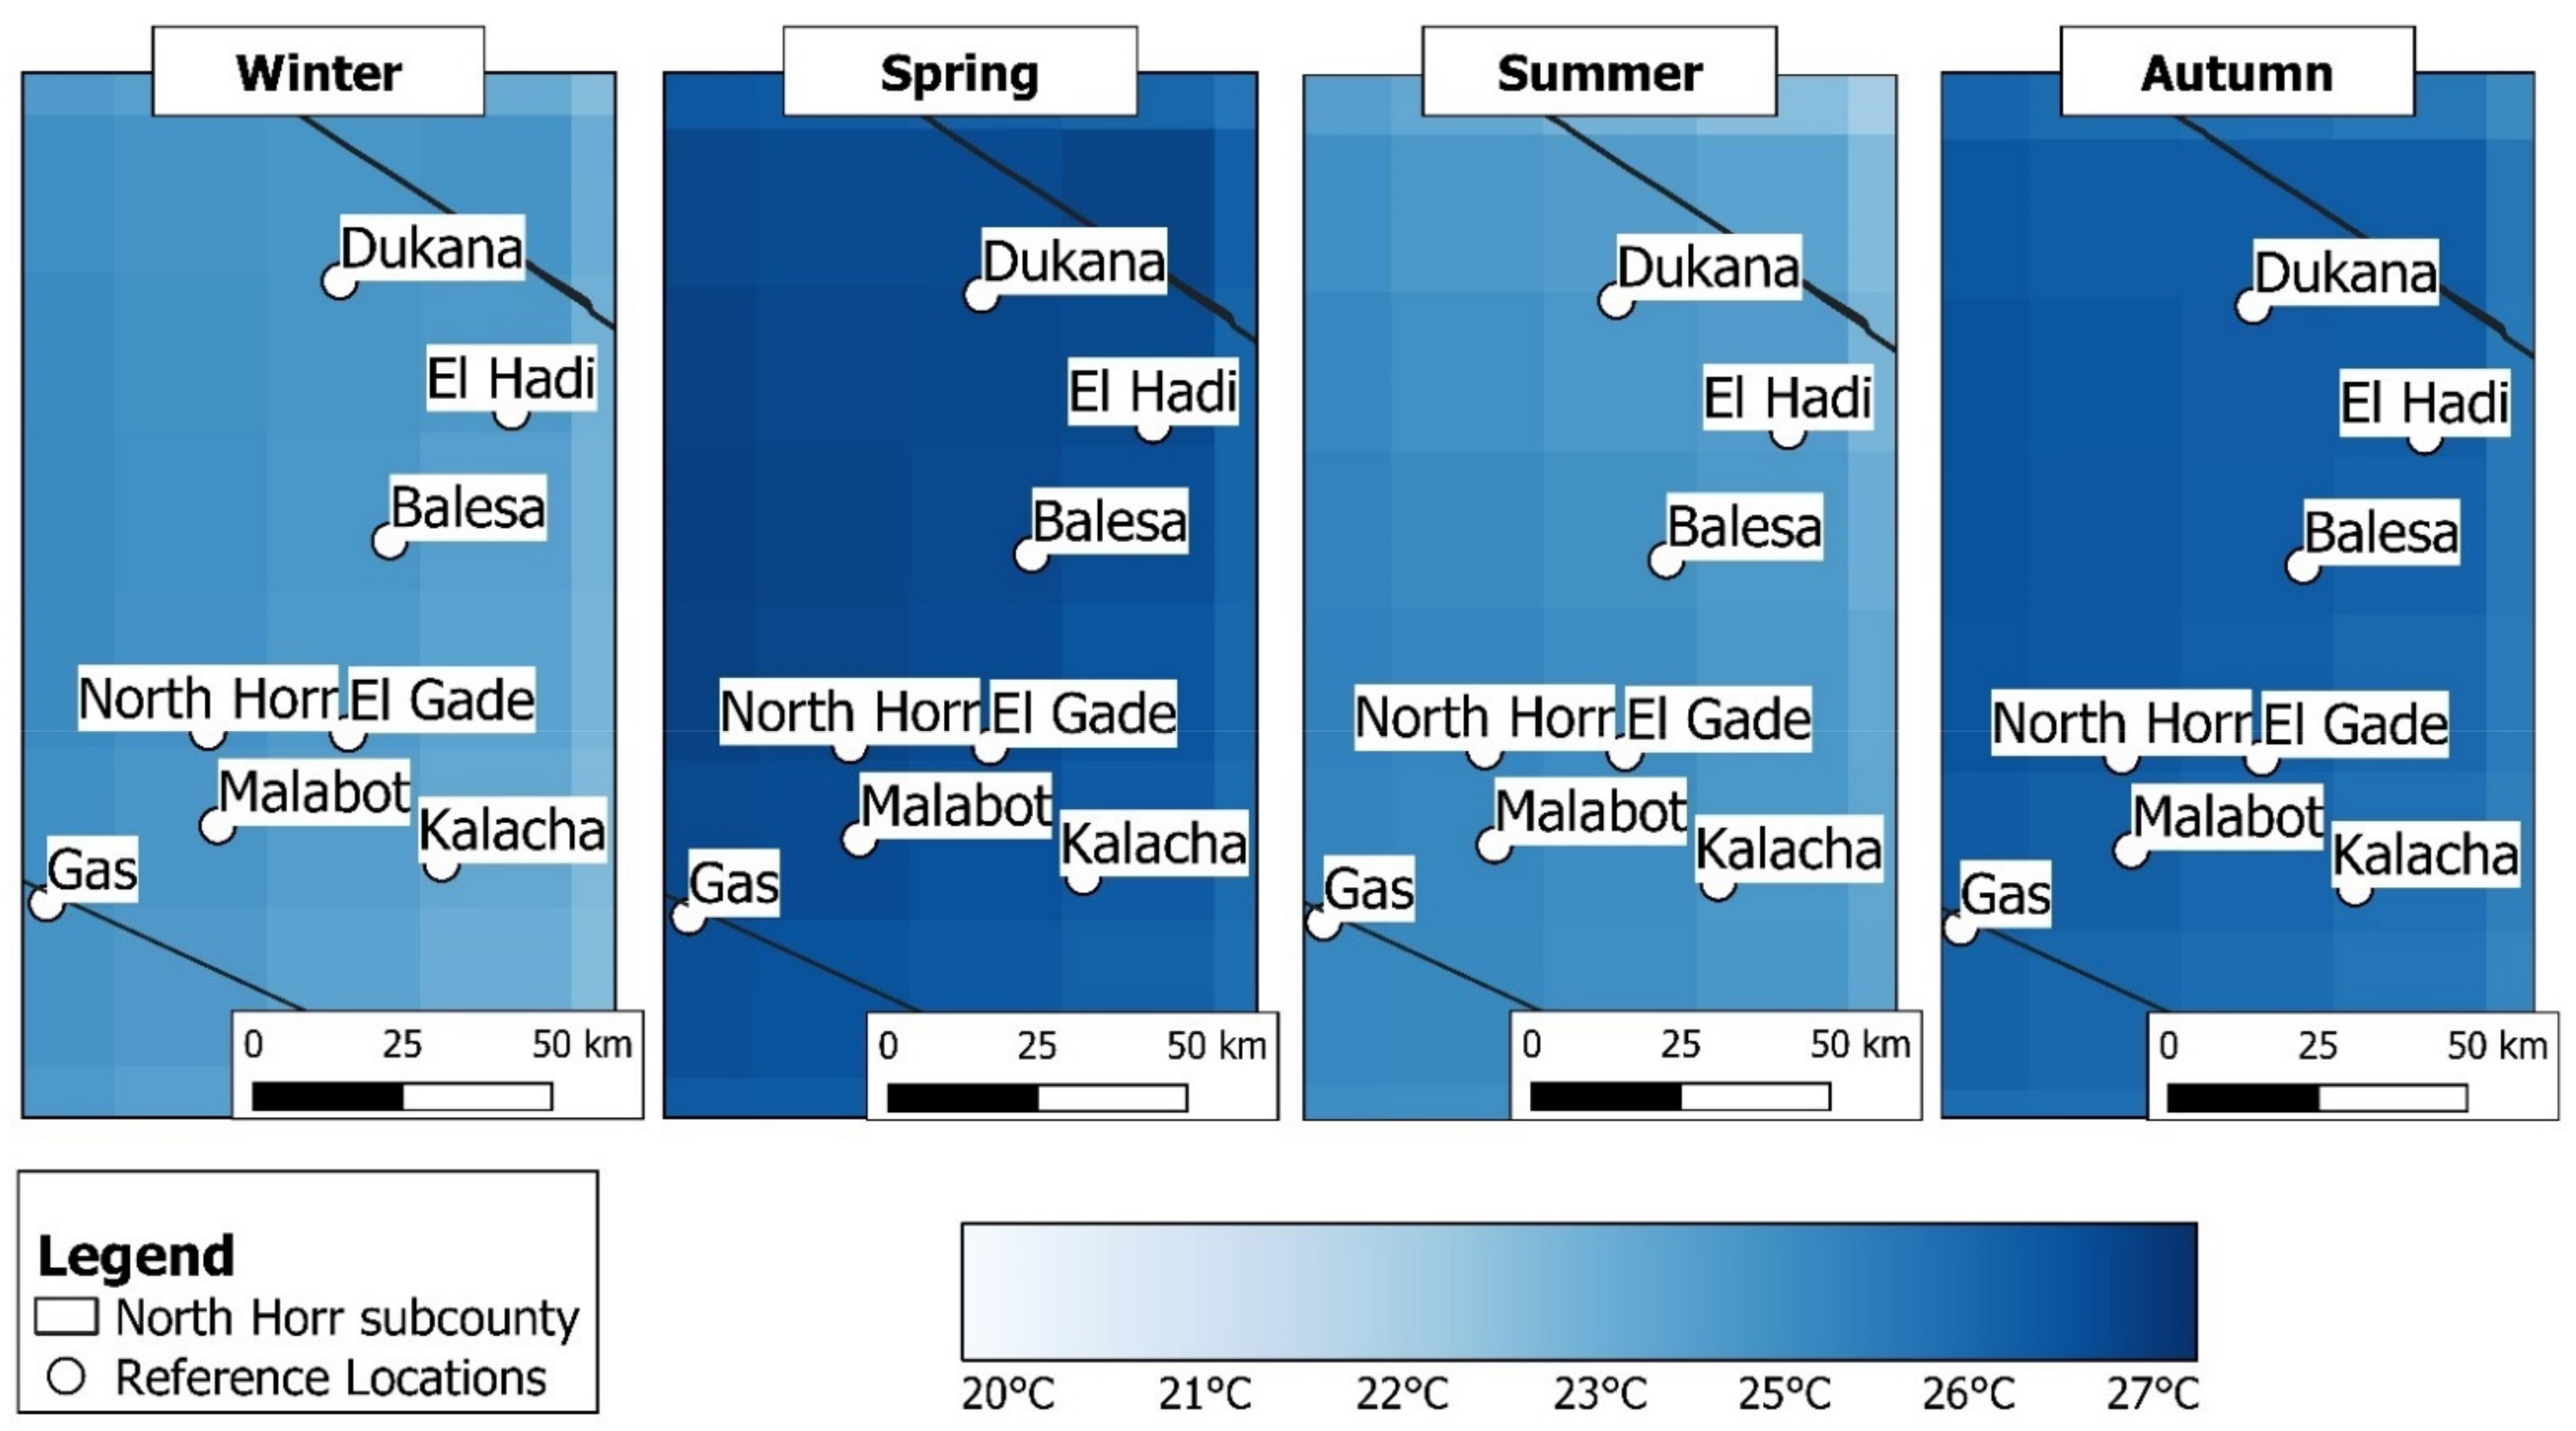
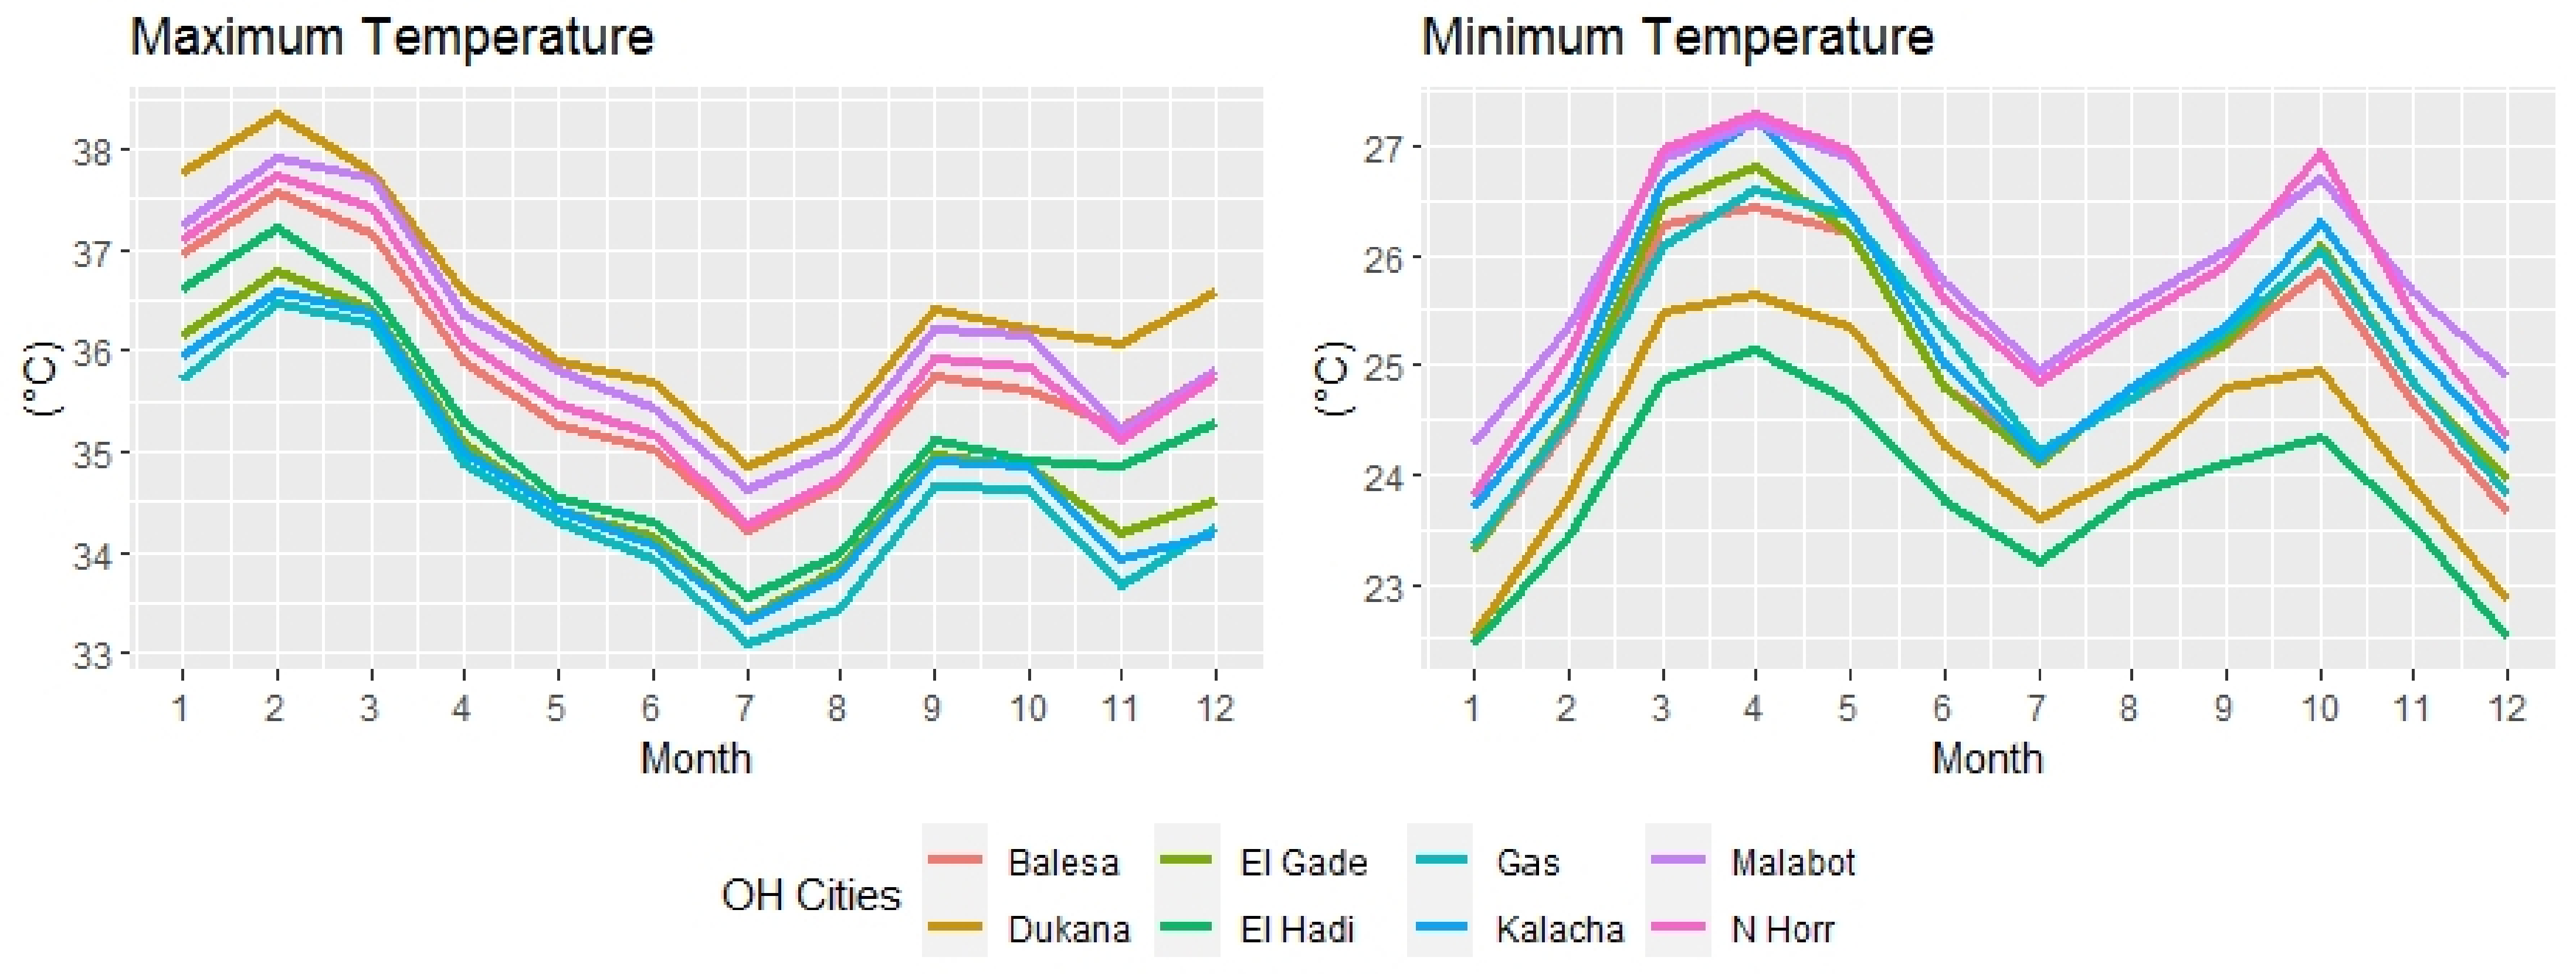
To strengthen the response systems against extreme weather events, temperature reference values and climatological temperature ranges were computed using ORH data for the eight main villages located in the study area (Balesa, Dukana, El-Gade, El-Hadi, Gas, Kalacha, Malabot and North Horr). Temperature reference values were calculated by averaging monthly and seasonal TMAX and TMIN data derived from the ORH reanalysis and climatological ranges were calculated with an amplitude of 2 degrees centered on the monthly temperature reference values. Monthly temperature ranges were compared against (i) the observations recorded by the Lodwar and Moyale land-based meteorological stations and then against (ii) the North Horr land-based automatic weather station observations recorded in the period of 03/2019–06/2020. Lodwar and Moyale temperature ranges contain the majority of the records (80–95%), demonstrating the ability to adapt to the local context and to represent temperatures. Differently, despite the small number of observations, temperature ranges computed for North Horr contain roughly 70% of both TMAX and TMIN values recorded from March 2019 to June 2020. The high performances obtained by the temperature ranges in the validation process confirm the adequacy of this methodology’s application at a regional level.
High-resolution temperature data are urgently needed to understand climatic trends in East African countries. This study provides a solution to the scarcity of observed data in North Horr Sub-County, by identifying monthly maximum and minimum temperature ranges. Anomalous temperature values can be detected through the comparison between current observations and the temperature ranges, strengthening the local population’s ability to cope with forthcoming extreme events.
Future research should test and validate the methodology proposed here in other locations. Moreover, the same methodology should be retested after more observations from the North Horr land-based automatic weather station are provided.

Author Contributions

Conceptualization: G.S., A.P., V.B., I.V., E.C. (Elena Comino), M.R., E.C. (Elena Cristofori), A.D.; methodology: G.S., A.P., V.B., I.V., E.C. (Elena Comino), M.R.; formal analysis, G.S.; writing—original draft preparation: G.S.; writing—review and editing: A.P., V.B., I.V.; supervision: A.P., V.B., I.V., E.C. (Elena Comino), M.R., E.C. (Elena Cristofori), A.D.; project management: A.P. All authors have read and agreed to the published version of the manuscript.

Funding

This research received no external funding.

Institutional Review Board Statement

Not applicable.

Informed Consent Statement

Not applicable.

Data Availability Statement

Data available in a publicly accessible repository that does not issue DOIs.

Acknowledgments

This study was conducted within the framework of the International Cooperation Project “ONE HEALTH: Multidisciplinary approach to promote the health and resilience of shepherds” communities in North Kenya” funded by the Italian Agency for Development Cooperation (AICS). The authors would like to thank the project coordinator (CCM) and project partners (TRIM and VSF-Germany) and the Kenyan Meteorological Department.

Conflicts of Interest

The authors declare no conflict of interest.

Appendix A

Table A1. Comparison of monthly/seasonal mean value of maximum temperature (values are expressed in °C) obtained from the historical time series and the ORH dataset for the three land-based meteorological stations (Lodwar, Marsabit and Moyale).
LodwarMarsabitMoyale
HistoricalORHHistoricalORHHistoricalORH
January36.136.825.330.331.031.3
February37.237.726.731.231.931.9
March36.937.426.631.230.631.4
April36.036.425.329.827.428.5
May35.335.524.929.125.826.6
June34.534.924.028.724.925.9
July33.733.923.528.024.025.3
August34.234.424.128.424.926.0
September35.435.925.329.726.827.5
October35.935.525.429.826.827.4
November35.235.024.028.327.127.8
December35.536.023.929.229.129.3
Autumn36.336.825.330.230.730.8
Winter36.136.425.630.128.028.8
Spring34.234.423.928.424.625.8
Summer35.535.524.929.326.927.6
Table A2. Comparison of monthly/seasonal mean value of minimum temperature (values are expressed in °C) obtained from the historical time series and the ORH dataset for the three land-based meteorological stations (Lodwar, Marsabit and Moyale).
LodwarMarsabitMoyale
HistoricalORHHistoricalORHHistoricalORH
January22.222.816.517.918.618.0
February22.723.716.818.619.618.9
March24.224.517.119.419.919.4
April24.824.617.119.619.218.9
May25.124.516.719.018.518.3
June24.824.115.217.917.217.6
July24.323.714.217.216.616.8
August24.523.914.117.316.816.9
September25.024.114.617.917.517.4
October25.324.515.918.918.217.8
November23.923.616.518.618.017.5
December22.323.016.518.218.017.7
Autumn22.423.116.618.218.718.2
Winter24.724.517.019.319.218.8
Spring24.523.914.517.516.917.1
Summer24.724.115.718.517.917.6

References

  1. Huq, S.; Reid, H.; Konate, M.; Rahman, A.; Sokona, Y.; Crick, F. Mainstreaming adaptation to climate change in Least Developed Countries (LDCs). Clim. Policy 2004, 4, 25–43. [Google Scholar] [CrossRef]
  2. Nordhaus, W.D. Geography and macroeconomics: New data and new findings. Proc. Natl. Acad. Sci. USA 2006, 103, 3510–3517. [Google Scholar] [CrossRef] [PubMed] [Green Version]
  3. Rose, R.M. The Impact of Climate Change on Human Security in the Sahel Region of Africa. Donnish J. Reg. Afr. 2015, 1, 9–14. [Google Scholar]
  4. Singh, A.; Purohit, B.M. Public Health Impacts of Global Warming and Climate Change. Peace Rev. 2014, 26, 112–120. [Google Scholar] [CrossRef]
  5. Niang, I.; Ruppel, O.C.; Abdrabo, M.A.; Essel, A.; Lennard, C.; Padgham, J.; Urquhart, P. Africa. Climate Change 2014: Impacts, Adaptation, and Vulnerability. Part B: Regional Aspects. Contribution of Working Group II to the Fifth Assessment Report of the Intergovernmental Panel on Climate Change. 2015, pp. 1199–1266. Available online: https://www.ipcc.ch/report/ar5/wg2/ (accessed on 16 November 2020).
  6. Rankings//Notre Dame Global Adaptation Initiative//University of Notre Dame. Available online:https://gain.nd.edu/our-work/country-index/rankings/ (accessed on 13 November 2020).
  7. UNDP. Climate Risks, Vulnerability and Governance in Kenya: A review. Undp 2012, 83, 22–26. [Google Scholar]
  8. Ministry of Foreign Affairs of the Netherlands. Climate Change PROFILE Kenya. Minist. Foreign Aff. Neth. 2018, 923, 14. [Google Scholar]
  9. (NCCAP—GoK) National Climate Change Action Plan 2013–2017; Government of Kenya: Nairobi, Kenya, 2013.
  10. Engels, B.; Dietz, K. Climate change in Africa: Social and political impacts, conflicts and strategies. Clim. Chang. Afr. Soc. Polit. Impacts Confl. Strateg. 2018, 1, 1–208. [Google Scholar]
  11. Tarhule, A.; Saley-Bana, Z.; Lamb, P.J. Rainwatch: A Prototype GIS for Rainfall Monitoring in West Africa. Bull. Am. Meteorol. Soc. 2009, 90, 1607–1614. [Google Scholar] [CrossRef]
  12. One Health Integrated Approach. North Horr|Comitato Collaborazione Medica. Available online:http://www.ccm-italia.org/en/one-health-north-horr (accessed on 16 November 2020).
  13. Kenya Meteorological Department. Available online: https://www.meteo.go.ke/ (accessed on 13 November 2020).
  14. County Consultations. Available online: https://www.kccap.info/index_option_com_phocadownload_view_category_id_37_Itemid_54.html (accessed on 13 November 2020).
  15. Tarhule, A.; Lamb, P.J. Climate research and seasonal forecasting for West Africans. Bull. Am. Meteorol. Soc. 2003, 84, 1741–1759. [Google Scholar] [CrossRef]
  16. UNDP. Factoring of Weather and Climate Information and Products into Disaster Management Policy: A contribution to Stategies for Disaster Reduction in Kenya; Kenya Meteorological Department: Nairobi, Kenya, 2002; pp. 1–206. [Google Scholar]
  17. Gan, T.Y.; Ito, M.; Hülsmann, S.; Qin, X.; Lu, X.X.; Liong, S.Y.; Rutschman, P.; Disse, M.; Koivusalo, H. Possible climate change/variability and human impacts, vulnerability of drought-prone regions, water resources and capacity building for Africa. Hydrol. Sci. J. 2016, 61, 1209–1226. [Google Scholar] [CrossRef]
  18. Anyah, R.O.; Semazzi, F.H.M. Climate variability over the Greater Horn of Africa based on NCAR AGCM ensemble. Theor. Appl. Climatol. 2006, 86, 39–62. [Google Scholar] [CrossRef]
  19. Anyah, R.O.; Semazzi, F.H.M. Variability of East African rainfall based on multiyear RegCM3 simulations. Int. J. Climatol. Int. J. Clim. 2007, 27, 357–371. [Google Scholar] [CrossRef]
  20. Diro, G.T.; Grimes, D.I.F.; Black, E. Teleconnections between Ethiopian summer rainfall and sea surface temperature: Part I-observation and modelling. Clim. Dyn. 2011, 37, 103–119. [Google Scholar] [CrossRef]
  21. Endris, H.S.; Omondi, P.; Jain, S.; Lennard, C.; Hewitson, B.; Chang’a, L.; Awange, J.L.; Dosio, A.; Ketiem, P.; Nikulin, G.; et al. Assessment of the performance of CORDEX regional climate models in simulating East African rainfall. J. Clim. 2013, 26, 8453–8475. [Google Scholar] [CrossRef]
  22. Vigna, I.; Bigi, V.; Pezzoli, A.; Besana, A. Comparison and bias-correction of satellite-derived precipitation datasets at local level in northern Kenya. Sustainability 2020, 12, 2896. [Google Scholar] [CrossRef] [Green Version]
  23. Bayissa, Y.; Tadesse, T.; Demisse, G.; Shiferaw, A. Evaluation of satellite-based rainfall estimates and application to monitor meteorological drought for the Upper Blue Nile Basin, Ethiopia. Remote Sens. 2017, 9, 669. [Google Scholar] [CrossRef] [Green Version]
  24. Dinku, T.; Thomson, M.C.; Cousin, R.; del Corral, J.; Ceccato, P.; Hansen, J.; Connor, S.J. Enhancing National Climate Services (ENACTS) for development in Africa. Clim. Dev. 2018, 10, 664–672. [Google Scholar] [CrossRef]
  25. Bitew, M.M.; Gebremichael, M.; Ghebremichael, L.T.; Bayissa, Y.A. Evaluation of high-resolution satellite rainfall products through streamflow simulation in a hydrological modeling of a small mountainous watershed in Ethiopia. J. Hydrometeorol. 2012, 13, 338–350. [Google Scholar] [CrossRef]
  26. Giorgi, F.; Gutowski, W.J. Regional Dynamical Downscaling and the CORDEX Initiative. Annu. Rev. Environ. Resour. 2015, 40, 467–490. [Google Scholar] [CrossRef]
  27. Gebrechorkos, S.H.; Hülsmann, S.; Bernhofer, C. Evaluation of multiple climate data sources for managing environmental resources in East Africa. Hydrol. Earth Syst. Sci. 2018, 22, 4547–4564. [Google Scholar] [CrossRef] [Green Version]
  28. Cattani, E.; Merino, A.; Levizzani, V. Evaluation of monthly satellite-derived precipitation products over East Africa. J. Hydrometeorol. 2016, 17, 2555–2573. [Google Scholar] [CrossRef]
  29. Marsabit County Government. Climate Change Mainstreaming Guidelines; Agriculture, Livestock and Fisheries Sector; Marsabit County Government: Marsabit, Kenya, 2018.
  30. Maina, M.M.; Messo, R.J. Analysis of the Trends in Temperature and Rainfall in Thika River Basin in Kenya. Int. J. Clim. Res. 2017, 2, 26–35. [Google Scholar] [CrossRef] [Green Version]
  31. Karanja, F.K.; Mutua, F.M. Reducing the Impact of Environmental Emergencies through Early Warning and Preparedness—The Case of El Nino-Southern Oscillation. North 2000, 1, 1–55. [Google Scholar]
  32. Owiti, Z.; Ogallo, L.A.; Mutemi, J. Linkages between the Indian Ocean Dipole and east African seasonal rainfall anomalies. J. Kenya Meteorol. Soc. 2008, 2, 2–17. [Google Scholar]
  33. Berrisford, P.; Dee, D.; Fielding, K.; Fuentes, M.; Kallberg, P.; Kobayashi, S.; Uppala, S. The ERA-Interim Archive. ERA Rep. Ser. 2009, 1, 1–16. [Google Scholar]
  34. Dosio, A.; Panitz, H.J.; Schubert-Frisius, M.; Lüthi, D. Dynamical downscaling of CMIP5 global circulation models over CORDEX-Africa with COSMO-CLM: Evaluation over the present climate and analysis of the added value. Clim. Dyn. 2015, 44, 2637–2661. [Google Scholar] [CrossRef] [Green Version]
  35. Chaney, N.W.; Sheffield, J.; Villarini, G.; Wood, E.F. Development of a high-resolution gridded daily meteorological dataset over sub-Saharan Africa: Spatial analysis of trends in climate extremes. J. Clim. 2014, 27, 5815–5835. [Google Scholar] [CrossRef]
  36. Gebrechorkos, S.H.; Hülsmann, S.; Bernhofer, C. Statistically downscaled climate dataset for East Africa. Sci. Data 2019, 6, 2–9. [Google Scholar] [CrossRef] [Green Version]
  37. Wang, Y.; Leung, L.R.; McGregor, J.L.; Lee, D.K.; Wang, W.C.; Ding, Y.; Kimura, F. Regional climate modeling: Progress, challenges, and prospects. J. Meteorol. Soc. Jpn. 2004, 82, 1599–1628. [Google Scholar] [CrossRef] [Green Version]
  38. Wilks, D.L. Statistical Methods in the Atmospheric Sciences, 2nd ed.; Academic Press: Cambridge, MA, USA, 2006. [Google Scholar]
  39. Nairn, J.; Fawcett, R. Defining heatwaves: Heatwave defined as a heat-impact event servicing all community and business sectors in Australia. CAWCR Tech. Rep. 2013, 60, 1–79. [Google Scholar]
Figure 1. Map of the study area: North Horr Sub-County is highlighted along with the main reference points. Within the 250 km radius from the reference point of North Horr, three land-based meteorological stations are identified (Lodwar, Marsabit and Moyale). Main locations refer to the main inhabited villages located in the study area. Adapted from: [22].
Climate 09 00062 g001
Figure 2. Monthly boxplots of the maximum and minimum temperature observations recorded by the land-based meteorological stations of Lodwar, Marsabit and Moyale in the period of 1983–2014.
Climate 09 00062 g002
Figure 3. Comparison of the different resolutions of the gridded dataset. The ten-day dataset from the Kenyan Meteorological Department (KMD) has the highest resolution (0.0375°) followed by the Climate Limited Area Model (CCLM) driven by HadGEM2-ES (HAD), with a spatial resolution of 0.1°, the ERA-Interim Reanalysis (ERA), with a spatial resolution of 0.125° and then by the Observation Reanalysis Hybrid (ORH), with the broader spatial resolution (0.25°).
Climate 09 00062 g003
Figure 4. Methodological scheme. ORH, ERA, KMD and HAD refer to the reanalysis datasets used for the comparisons with the observed data.
Climate 09 00062 g004
Figure 5. Taylor diagrams showing the agreement between the observed historical series and the temperature dataset for the selected land-based meteorological stations for the period 1983–2014. The standard deviation of each series is proportional to the distance from the origin of the diagram. The correlation coefficient (in Table 2) between each series and the observed historical series is expressed by the azimuthal angle. Points closer to the historical series’ marker (white point), with similar standard deviation and higher CC, correspond to the best-fit dataset.
Climate 09 00062 g005
Figure 6. Seasonal boxplot of the observations, the KMD and the ORH TMIN and TMAX datasets for the selected land-based meteorological stations for the period 1983–2014. Next to the boxplots are the seasonal temperature density distributions.
Climate 09 00062 g006
Figure 7. Climatological ranges (gray bands) with an amplitude of 2 °C centered on the monthly mean of the ORH temperature dataset for the selected land-based meteorological stations in the period 1983–2014 (Lodwar and Moyale). Each blue dot represents one monthly observation. Red dashed lines represent the upper and lower limits of the ranges.
Climate 09 00062 g007
Figure 8. ORH isotherm maps representing seasonal mean TMAX values at the local scale for North Horr Sub-County, for winter (January, February, March), spring (April, May, June), summer (July, August, September) and autumn (October, November, December) seasons. White dots represent the location of the reference points.
Climate 09 00062 g008
Figure 9. ORH isotherm maps representing seasonal mean TMIN values at the local scale for North Horr Sub-County, for winter (January, February, March), spring (April, May, June), summer (July, August, September) and autumn (October, November, December) seasons. White dots represent the location of the reference points.
Climate 09 00062 g009
Figure 10. Annual TMAX and TMIN distribution for each reference points based on monthly ORH temperature timeseries.
Climate 09 00062 g010
Figure 11. Temperature ranges (gray bands) with an amplitude of 2 degrees centered on the climatological monthly mean values for the selected land-based meteorological station in North Horr for the period 03/19–06/20. Each dot represents one observation. Red dashed lines represent the upper and lower limits of the ranges.
Climate 09 00062 g011
Table 1. Schematic summary of the land-based meteorological stations’ characteristics.
StationDistrictLatitudeLongitudeAltitude
LodwarTurkana3.1°35.6°523 m
MarsabitMarsabit2.3°37.9°1345 m
MoyaleLodwar3.53°39.1°1097 m
North HorrNorth Horr3.3°37.1°361 m
Table 2. Maximum temperature (TMAX) and the minimum temperature (TMIN) dataset evaluation, based on statistical indices (bias, mean absolute error (MAE), mean squared error (MSE), root mean squared error (RMSE) and correlation coefficient (CC)) computed against the observed historical series selected from the land-based meteorological stations of Lodwar, Marsabit and Moyale for the period 1983–2014. The last four columns present the overall performaces, given by the mean of the performance indices computed for the three stations. Values in bold correspond to the best value of the index for each station.
LodwarMarsabitMoyaleOverall Performances
KMDERAORHHADKMDERAORHHADKMDERAORHHADKMDERAORHHAD
TMAX
Bias−2.34−2.460.28−0.881.825.944.564.10.921.310.71.380.131.601.851.53
MAE2.382.490.921.281.825.944.564.11.061.321.011.461.753.252.162.28
MSE7.449.031.612.474.3537.3322.0218.571.752.611.613.374.5116.328.418.14
RMSE2.733.011.271.572.096.114.694.311.321.621.271.842.053.582.412.57
CC0.740.710.650.650.790.570.660.550.950.830.920.860.830.700.740.69
TMIN
Bias1.01−1.120.171.920.884.712.442.722.740.570.24−11.541.390.681.21
MAE1.231.70.882.111.154.712.452.722.740.610.641.131.712.341.321.99
MSE2.523.721.335.61.8323.556.978.067.740.530.711.94.039.273.005.19
RMSE1.591.931.152.371.354.852.642.842.780.730.841.381.912.501.542.20
CC0.410.230.540.230.570.480.620.740.910.920.740.620.630.540.640.53
Table 3. Monthly and seasonal 2 °C TMAX ranges centered on the climatological mean and computed for all the eight reference points located in North Horr Sub-County. Values are expressed in °C.
BalesaDukanaEl-GadeEl-HadiGasKalachaMalabotNorth Horr
Jan36–3836.8–38.835.1–37.135.6–37.634.7–36.735–3736.3–38.336.1–38.1
Feb36.6–38.637.4–39.435.8–37.836.2–38.235.5–37.535.6–37.636.9–38.936.8–38.8
Mar36.2–38.236.8–38.835.4–37.435.6–37.635.3–37.535.4–37.436.7–38.736.4–38.4
Apr34.9–36.935.6–37.634.1–36.134.3–36.333.9–35.934–3635.4–37.435.1–37.1
May34.3–36.334.9–36.933.4–35.433.5–35.533.3–35.333.4–35.434.8–36.834.5–36.5
June34–3634.7–36.733.2–35.233.3–35.532.9–34.933.1–35.134.4–36.434.2–36.2
July33.2–35.233.9–35.932.4–34.432.6–34.632.1–34.132.3–34.333.6–35.633.3–35.3
Aug33.7–35.734.3–36.332.8–34.833–3532.5–34.532.8–34.834–3633.7–35.7
Sep34.7–36.735.4–37.434–3634.1–36.133.7–35.733.9–35.935.2–37.234.9–36.9
Oct34.6–36.635.2–37.233.8–35.833.9–35.933.6–35.633.9–35.935.1–37.134.8–36.8
Nov34.2–36.235.1–37.133.2–35.233.8–35.832.7–34.732.9–34.934.2–36.234.1–36.1
Dec34.8–36.835.6–37.633.5–35.534.3–36.333.3–35.333.2–35.234.8–36.834.8–36.8
Winter35.8–37.836.6–38.634.8–36.835.4–37.434.5–36.534.6–36.636–3835.9–37.9
Spring35.1–37.135.8–37.834.3–36.334.5–36.534.2–36.234.3–36.135.6–37.635.3–37.3
Summer33.6–35.634.3–36.332.8–34.833–3532.5–34.532.7–34.734–3633.7–35.7
Autumn34.5–36.535.2–37.233.7–35.733.9–35.933.3–35.333.6–35.634.8–36.834.6–36.6
Table 4. Monthly and seasonal 2 °C TMIN ranges centered on the climatological mean and computed for all the eight reference points located in North Horr Sub-County. Values are expressed in °C.
BalesaDukanaEl-GadeEl-HadiGasKalachaMalabotNorth Horr
Jan22.3–24.321.6–23.622.3–24.321.5–23.522.4–24.422.7–24.723.3–25.222.8–24.8
Feb23.5–25.522.8–24.823.6–25.622.5–24.523.5–25.523.8–25.824.4–26.424.1–26.1
Mar25.3–27.324.5–26.525.5–27.523.9–25.925.1–27.125.7–27.725.9–27.926–28
Apr25.5–27.524.7–26.725.8–27.824.2–26.225.6–27.626.3–28.326.2–28.226.3–28.3
May25.2–27.224.4–26.425.2–27.223.7–25.725.4–27.425.4–27.425.9–27.926–28
June23.8–25.823.3–25.323.8–25.822.8–24.824.3–26.324–2624.8–26.824.6–26.6
July23.2–25.222.6–24.623.1–25.122.2–24.223.2–25.223.2–25.224–2523.9–25.9
Aug23.7–25.723.1–25.123.8–25.822.8–24.823.7–25.723.8–25.824.6–26.624.6–26.6
Sep24.2–26.223.8–25.824.2–26.223.1–25.124.3–26.324.4–26.425.1–27.124.9–26.9
Oct24.9–26.924–2625.1–27.123.4–25.425.1–27.125.3–27.325.7–27.726–28
Nov23.7–25.722.9–24.923.8–25.822.5–24.523.8–25.824.2–26.224.7–26.724.5–26.5
Dec22.7–24.721.9–23.923–2521.5–23.522.8–24.823.2–25.223.9–25.923.4–25.4
Winter22.8–24.822.1–24.123–2521.8–23.822.9–24.923.2–25.223.9–25.923.4–25.4
Spring25.3–27.324.5–26.525.5–27.523.9–25.925.4–27.425.8–27.826–2826.1–28.1
Summer23.6–25.623–2523.6–25.622.6–24.623.7–25.723.7–25.724.5–26.524.3–26.3
Autumn24.3–26.323.6–25.624.4–26.423–2524.4–26.424.6–26.625.2–27.225.1–27.1
Publisher’s Note: MDPI stays neutral with regard to jurisdictional claims in published maps and institutional affiliations.

